Characteristics of Energy Distribution in a Desert Ecosystem in Inner Mongolia, Northern China
 Yumeng Pan1
  Huijie Xiao
- 1School of Soil and Water Conservation, Beijing Forestry University, Beijing, China
- 2Inner Mongolia Dengkou Desert Ecosystem National Observation Research Station, Experimental Center of Desert Forestry, Chinese Academy of Forestry, Dengkou, China
- 3Department of Geosciences, The University of Tulsa, Tulsa, OK, United States
- 4Department of Watershed and Range Management, Faculty of Water and Soil, University of Zabol, Zabol, Iran
- 5Shandong Key Laboratory of Eco-Environmental Science for the Yellow River Delta, Binzhou University, Binzhou, China
Desert ecosystems are vulnerable to climate change because of their fragile environment and poor self-regulation ability. Exploring the land–surface energy balance and the water/heat transfer processes of such regions for water resource management purposes is critical. The processes of surface water and heat transfer throughout the desert ecosystems and the effects of environmental factors on the energy distribution remain poorly studied. In this study, we used an eddy covariance system and surface meteorological data (2019–2021) to investigate the characteristics of the energy balance of Dengkou Desert ecosystem located in Inner Mongolia, northern China. Also, we evaluated the effects of different environmental factors on the energy distribution in this desert ecosystem. We found that the temporal patterns of both sensible heat flux (H) and latent heat flux (LE) with time are consistent with that of net radiation (Rn), and Rn is dominated by H. The sum of the daily average soil heat flux during the observation period was positive, indicating that soil was a heat sink and that the atmosphere transfers heat to the soil. During the observation period, the energy distribution of H/Rn fluctuated greatly, presenting a general U-shaped trend, while LE/Rn presented an inverted V-shaped trend. The main factor affecting H was Rn, followed by saturated vapor pressure, air temperature (Ta), and relative humidity. For LE, the main influencing factors were Ta, and Rn. The energy closure of the half-hour flux in the Inner Mongolian desert ecosystem during the observation period was 48%–68%, and the energy balance ratio was 0.54–0.74. The energy closure at the daily scale was higher than that at the half-hour scale, and the energy closure during daytime was higher than that at night.
1 Introduction
As the main energy source in an ecosystem, solar radiation is mostly returned to the atmosphere in the form of latent heat and sensible heat (except for the small part used for plant photosynthesis, internal heat reserves of crops, and heating of soil) (Brown and Rosenberg, 1973). Surface radiation and the energy balance, which are the core components of land–surface processes and land–air interactions, are used to describe the exchange process of matter and energy between the ground and the atmosphere (Yue et al., 2013). In recent years, many studies investigated the characteristics, distribution, and closure of the energy flux using flux towers in different ecosystems in China (Ma et al., 2014; Yuan et al., 2015; Li et al., 2018; Niu et al., 2018; Zhou et al., 2019). Energy distribution can promote material exchange, and the influence of water exchange is particularly important because it is manifested in the promotion of the water cycle by increasing sensible heat flux (H). A clear understanding of the transport processes of water vapor and energy in the boundary layer is very important for understanding the regional climate and water cycle.
The eddy covariance (EC) method is considered as a reasonable standard for measuring evapotranspiration, because it can directly measure water, heat, and CO2 fluxes between various underlying surfaces and atmosphere and achieve long-term continuous observations. The obtained results can represent the overall average exchange rate between the surface and the atmosphere over a certain area (Zhao et al., 2011). In recent years, EC technology has been widely applied to the study of material and energy transmission and exchange in the field of ecology (Wu et al., 2018; Reddy et al., 2020; Wang et al., 2020), and many studies focused on the energy distribution within different ecosystems (Li et al., 2014; Jiao et al., 2018; Zhou et al., 2019). These studies found notable differences in the energy distribution within different ecosystems of different regions. Even for the same ecosystem, the characteristics of the energy distribution will vary on different temporal and spatial scales. Many studies conducted in-depth analyses on various factors affecting water and heat transport between ecosystems and the atmosphere (Majozi et al., 2017; Yue et al., 2018; Huang et al., 2019), and the results indicate that differences in the energy distribution are mainly affected by environmental factors and vegetation growth factors. Energy closure refers to the balance between the turbulent flux and the effective energy measured by an EC system. According to the basic assumption of EC system observations and the law of energy conservation, energy closure can be used as an effective method to evaluate the performance and data quality of an observation system. In a study of forest in the Amazon, Renata et al. (2019) found that an increase of the energy balance closure residual indicates that the EC technique underestimates the energy flux.
Desert ecosystems exhibit special geographical, climatological, hydrological, and geological conditions. Owing to the lack of water, vegetation in desert areas is generally sparse, plant species are monotonous, biological production is low, energy flow and material circulation are slow, and environmental regulation and adaptability are poor. Because of the unique geographical environment and special characteristics of the surface albedo, the underlying surface of a desert is unique in terms of the energy, water, and material circulation rules, and its response to solar radiation is also distinct from that of other ecosystems. The exploration of both land–surface processes and land–air interactions in desert regions has long been the focus of climate research in arid regions (Qi et al., 2020). The radiation balance, energy balance, and their distributions represent the basis of the formation of a microclimate (Tan et al., 2015). However, in arid desert regions, because of the special climate and the underlying surface conditions, the microclimatic characteristics are different to those of other ecosystems. Few studies investigated the energy balance in desert ecosystems. Therefore, to comprehensively understand the energy and water vapor cycles and the effects of climate change in arid regions, exploring the radiation budget and the energy distribution of desert ecosystems is important.
The objectives of this study were to analyze the characteristics of energy and energy closure in desert ecosystems over different time scales and to preliminarily explore the causes and influencing mechanisms of the imbalance of surface energy budget and expenditure. The findings of the present study deepen the understanding of the energy imbalance in the near strata, unify the influence of flow characteristics on energy non-closure in desert areas, contribute to the understanding of the energy cycle mechanism in desert ecosystems, and lay a foundation for the evaluation of the regional water and energy balance.
2 Material and Methods
2.1 Site Description
The experimental area is located in the northeast of the Ulan Buh Desert in Dengkou County, Bayannaoer City, Inner Mongolia, China (Figure 1A). The field measurements were conducted at a desert comprehensive observation station (40°24′N, 106°43′E, 1,050 m above sea level, Figure 1B) in the second experimental field at the Desert Forestry Experimental Center of the Chinese Academy of Forestry. The area exhibits a temperate continental arid climate, with an annual average temperature of 7.8°C and annual average rainfall of approximately 145 mm. Precipitation falls mainly during June–September, accounting for 70%–80% of the annual total. Annual evaporation in the study area is approximately 2,327 mm, and the soil type is wind-sand soil. Nitraria Tangutorum is the dominant plant within the study site. The Nitraria population exists in the form of Nitraria nebkhas, which are approximately 1–3 m high and 6–10 m in diameter. The main associated dominant plants are Artemisia sphaerocephala, Artemisia ordosica, Psammochloa villosa, and Agriophyllum squarrosum, and the overall community coverage is 10%–20%.
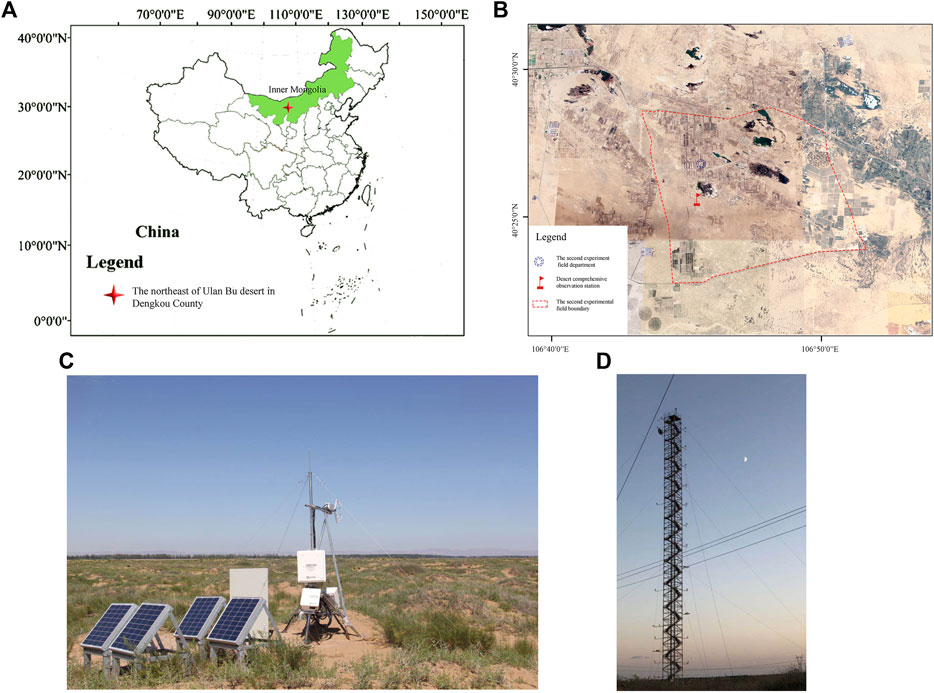
FIGURE 1. (A) Overview of the study area; (B) The experimental site; (C) Eddy covariance (EC) system; (D) The meteorological station.
2.2 Energy Flux and Meteorological Measurements
The fluxes and meteorological data of the desert oasis transition zone were measured simultaneously using an EC system and an auxiliary meteorological element gradient monitoring system. The EC system installed at the center of the desert comprehensive observation station (Figure 1C) composed a closed-path CO2/H2O analyzer (EC155, Campbell, United States), 3D ultrasonic anemometer (CSAT-3, Campbell scientific Inc., United States) and data logger (CR3000, Campbell scientific Inc., United States). The predominant wind direction in this region is from the northwest, and the fetch length is considered adequate for EC measurements. The observations consisted of both mean and high-frequency turbulent measurements. The gradient monitoring system comprised a soil temperature sensor (CS616, Campbell Scientific Inc., United States), four-component radiation sensor (NR-LITE, Kipp & Zonen, Netherlands), and a temperature and humidity sensor (HMP45C, Vaisala Inc., Finland). Four soil heat flux plates (HFP01, Hukseflux, Netherlands) were installed at the depth of 0.1 m. Flux measurements were taken at a sampling frequency of 10 Hz. Further details including the specifications of the instruments are presented in Table 1. Also, all sensors used were previously subjected to calibration at the factory, and their performance was thoroughly evaluated. Measurements collected during 2019–2021 were used in the present study. Owing to failure of observation instruments and the influence of certain weather conditions, some data were recognized as abnormal, and some data were missing.
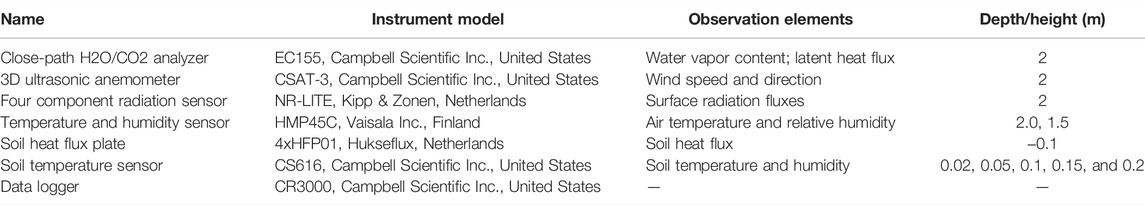
TABLE 1. Summary of the specifications of the instruments integrated on the eddy covariance flux tower. All measurements are averaged over 30-min interval.
Meteorological parameters were observed simultaneously on the daily scale by using the meteorological station located in the study area (Figure 1D). The main observation elements included average temperature, maximum temperature, minimum temperature, relative humidity (RH), and precipitation. Next, daily averages of the recorded data were calculated for the period from January 2019 to October 2021.
2.3 Parameter Calculation and Data Analysis
2.3.1 Data Processing
The formulas for the calculation of H and latent heat flux (LE) are as follows (Swinbank, 1951):
where ρ is air density (kg·m−3), CP is the heat capacity of air (J·kg−1°C−1), λ is the latent heat of evaporation (J·kg−1),
The original turbulent data with sampling frequency of 10 Hz were preprocessed using the EddyPro software developed by the LI-COR company. First, the original observational data of the EC system were rotated twice for 30 min, an ultrasonic virtual temperature correction was performed for H, and a WPL correction was performed for LE (Webb et al., 1980). On this basis, the outliers were eliminated. Through data correction and noise elimination, valid data accounted for 75% of the total. To understand the dynamic changes of water and heat fluxes over time, continuous water and heat flux data are needed. Deleted data and missing data were replaced using either of the following two interpolation methods: missing data over a period of less than 2 h were interpolated using the linear interpolation method, and missing data over a period of greater than 2 h were interpolated by means of the diurnal variation method (Falge et al., 2001).
2.3.2 Evaluation of Surface Energy Budget
The weather–climate system is a dynamic system driven by the absorption of sunlight and emission of longwave radiation. These two fluxes are an integral part of the surface energy balance (SEB) from which the ground temperature is estimated in weather prediction models (Mihalakakou et al., 1997; Curry and Webster, 1999). In general terms, the SEB can be expressed as follows:
where Rn is net radiation flux (W·m−2), G is ground heat flux (W·m−2), and H and LE are sensible heat and latent heat fluxes, respectively (W·m−2). The convention used here is that all radiative fluxes (non-radiative fluxes) directed toward the surface are positive (negative).
Lack of closure of SEB fluxes measured by EC systems is a known issue that remains unresolved (Wilson et al., 2002), and it appears in terms of discrepancies between the turbulent heat fluxes (H + LE) and available energy (Rn−G). In this paper, the energy balance ratio (EBR) and ordinary least squares (OLS) were used to analyze the closure degree of the energy balance.
EBR, which refers to the ratio of turbulent energy and effective energy measured directly by the EC system, can be expressed as follows:
A value of EBR = 1 indicates perfect closure of the SEB. Although using 30-min averaged measurements demonstrates the advantage of smoothing out random errors and higher-frequency fluctuations, it can also lead to overestimation of upward (downward) fluxes during the day (night) (Mahrt, 1998).
The OLS method calculates the regression slope (S) and intercept (b) of the turbulent flux and the effective energy to analyze the closure degree of the energy balance, in which S can reflect the balance of instantaneous energy. The basic assumption of OLS regression is to minimize EOLS, and the OLS regression equation can be expressed as follows:
where (LE + H) is the turbulent flux, (Rn−G) is the effective energy, S is the slope of the linear regression, and b is the intercept. Under ideal conditions, the value of S of the linear regression of the effective energy (Rn−G), the turbulent flux (LE + H) is 1, and the value of b is 0.
2.3.3 Data Analysis
All the monitoring data were sorted using Excel 2013, and the parameters were calculated and analyzed with R software and MATLAB software. Curve fitting and the comparisons of different subsets of the data were performed using Origin 2019b (Origin Lab Corporation, Northampton, MA, United States).
3 Results
3.1 Variations in Environmental Factors
The observational data obtained by the gradient meteorological system and the conventional meteorological station showed that the variations of all the daily meteorological factors demonstrated obvious seasonal patterns (Figure 2). Both air temperature (Ta) and vapor pressure deficit (VPD) showed a single-peaked trend of change. In contrast to the above meteorological variables, RH fluctuated with a jagged pattern. During the observation period, the maximum value of daily Ta was 29.6°C (13 July 2021), the minimum value of daily Ta was −20.6°C (6 January 2021), and the values of VPD and Ta were similar. Although the daily average VPD showed significant seasonal variation, it did not show significant interannual variation, with the annual average VPD of 0.58, 0.58, and 0.71 kPa in 2019, 2020, and 2021, respectively. Compared with 2019, 2020, and 2021, the annual average RH was 43.3%, 44.6%, and 38.1%, respectively, and the daily average relative humidity in 2021 was slightly lower. Next, the study area is arid and demonstrates little rainfall, and the average precipitation in the three studied years was 101 mm. Precipitation is usually concentrated in May–September, and May–September precipitation in 2019 and 2020 accounted for 71.6% and 97.2% of the total annual precipitation, respectively. Additionally, precipitation is distributed extremely unevenly in terms of quantity and time.

FIGURE 2. Seasonal dynamics of (A) daily average relative air temperature (Ta), (B) vapor pressure deficit (VPD), (C) humidity (RH) and (D) interannual distribution of total daily precipitation (P) in the study area.
3.2 Dynamic Characteristics of Energy Component and Energy Partitioning
3.2.1 Seasonal Variations of Energy Flux and Energy Partitioning
In the process of surface energy exchange, net radiation (Rn), H, and LE are the main variables, and their characteristics and variation rules are affected by many local factors. Figure 3 shows the seasonal variation characteristics of the daily average of half-hour energy flux in the Inner Mongolian desert ecosystem during the observation period. The seasonal variation of Rn is obvious, and the annual average daily Rn approximates single-peak variation. Owing to the change of mesoscale climatic conditions, Rn presents a serrated fluctuation, especially in the case of rainfall, and a large diurnal difference is found in Rn. The sum of the daily average soil heat flux (G) in the observation period of 2019, 2020, and 2021 was positive, indicating that the soil was a heat sink and that heat was transferred from the atmosphere to the soil. In 2019, 2020, and 2021, the mean values were 5.93, 2.84, and 1.07 W·m−2, respectively.
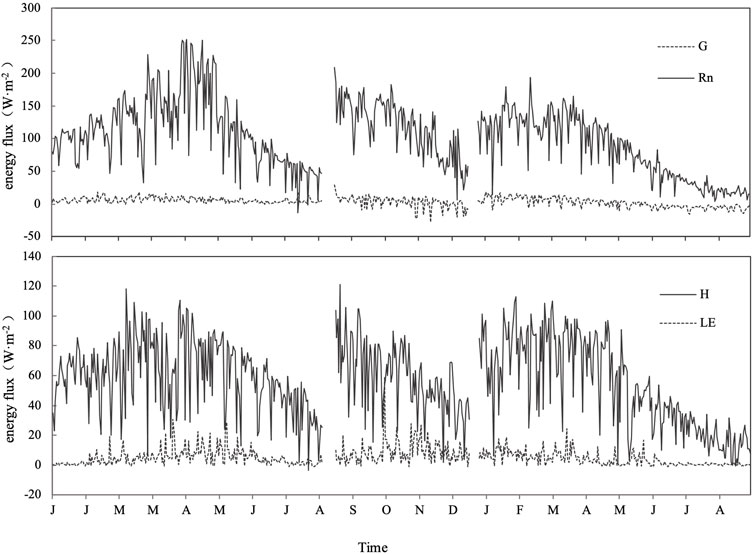
FIGURE 3. Seasonal and interannual variation of energy flux of the desert ecosystem in Dengkou County, Inner Mongolia.
The seasonal variation trend of H in the study area was broadly consistent with that of Rn. The fluctuation range of daily average H during the observation period was −3.64 W·m−2 (23 October 2019) to 120.98 W·m−2 (8 June 2020), and the average value was 57.22 W·m−2. In conditions of underlying surface drought and sparse vegetation, the magnitude of the values of LE in the study area was small, but there was notable seasonal variation for which the main trend was similar to that of Rn. LE fluctuated markedly in the rainy season during the growing period, which is consistent with the fluctuation of the time of precipitation and Rn. In 2019, 2020, and 2021, the mean values of LE were 4.89, 8.84, and 3.73 W·m−2, respectively.
Table 2 shows the calculation results of the annual monthly total value of the energy flux components in the Inner Mongolian desert ecosystem during 2019–2021. Overall, Rn, H, and LE all show a monthly trend of initial increase and then decrease during the year. The maximum values appeared in the growing season, and the fluctuation of the monthly total was slightly different from the month in which the maximum value occurred. Also, the monthly total amount of G increased with the increase of Rn, but marked positive and negative changes were found in different months. In 2019, the monthly total amount of G was positive, whereas in 2020 and 2021, the monthly total amount of G was negative during September–December, indicating that the direction of heat transfer in the Inner Mongolian desert ecosystem was from the soil to the atmosphere.
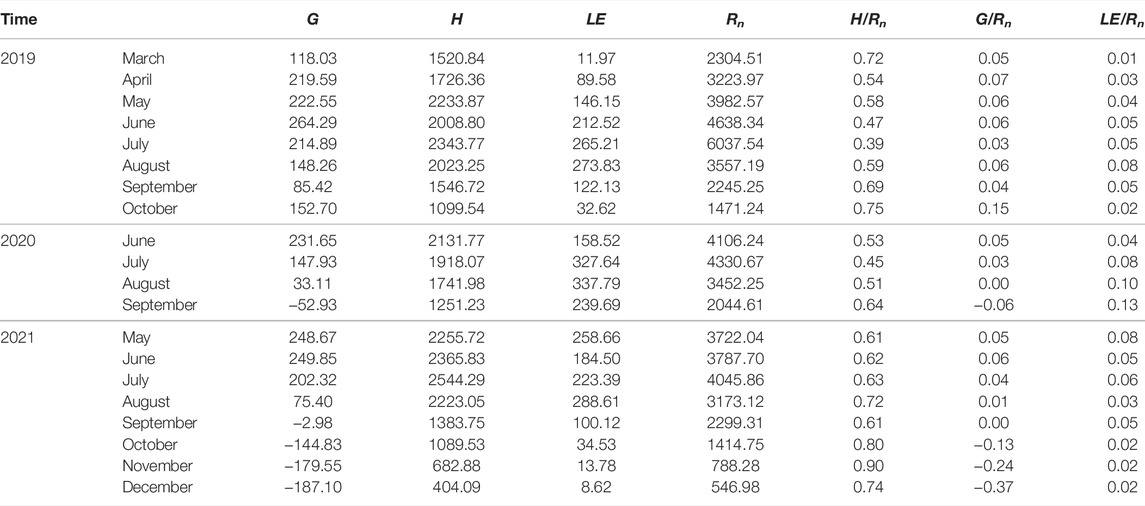
TABLE 2. Monthly total amount of daily average energy components (W m−2) and energy distribution in a desert ecosystem in Dengkou County (Inner Mongolia) during the observation period.
The seasonal variation of the distribution of H and LE can be used to determine the dry/wet conditions of the underlying surface. The Rn allocation of the Inner Mongolian desert ecosystem is mainly dominated by H (Figure 4). During the observation period, the energy allocation of H/Rn fluctuated greatly, and the change curve presents a U-shaped trend. The value in the non-growing season was larger than that in growing season. In 2019, 2020, and 2021, the mean values were 0.58, 0.52, and 0.70, respectively. Next, according to comparative analysis of H/Rn in different months (Table 2), H/Rn reached the peak value of 0.72 at the initial stage of vegetation growth (March) in 2019. Subsequently, with further vegetation growth, part of Rn was absorbed and reflected by the canopy, and the H/Rn value began to decrease gradually. At the end of vegetation growth, the H/Rn value began to increase and then decreased after November. The monthly average H/Rn value ranged from 0.39 (July) to 0.75 (October) in 2019, and the H/Rn values in 2020 and 2021 remained high (> 0.5). During the observation period, LE/Rn exhibited obvious seasonal variation, and the overall change curve presents an inverted V-shaped distribution. The average daily LE/Rn values in 2019, 2020, and 2021 were 0.04, 0.09, and 0.04, respectively. Next, the ratio of G to Rn fluctuated by less than 0.1 in the growing season, and the daily average G/Rn values varied from −0.01 to 0.96, −0.29 to 0.14 and −0.91 to 0.14 in 2019, 2020, and 2021, respectively.

FIGURE 4. Seasonal and interannual variation of energy distribution of the desert ecosystem in Dengkou County, Inner Mongolia.
3.2.2 Diurnal Variations of Energy Flux and Energy Partitioning
According to soil temperature and the phenological period of N. tangutorum, the observation time was divided into four periods: pre-growth period (March–April), growth period (May–September), declining period (October), and freezing period (November–February). In this study, H, LE, Rn, and G data at 30-min intervals during 2019–2021 were analyzed, and the mean and standard deviation of the energy flux were extracted for the same time for all days in each period. The daily average value of the diurnal variation of the energy components in different years in the same period demonstrated little variation (Table 3). The obtained average daily variation of the energy flux of the Inner Mongolian desert ecosystem in each of the different periods is shown in Figure 5.
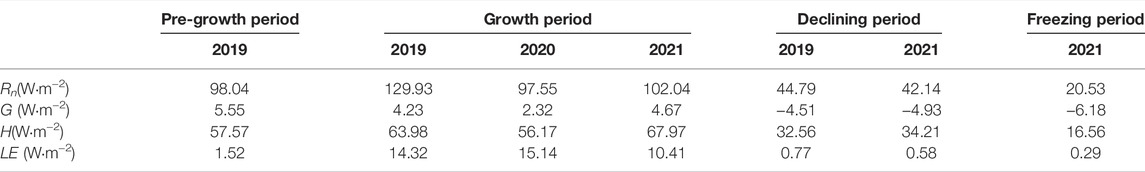
TABLE 3. Daily mean values of energy components in different periods.
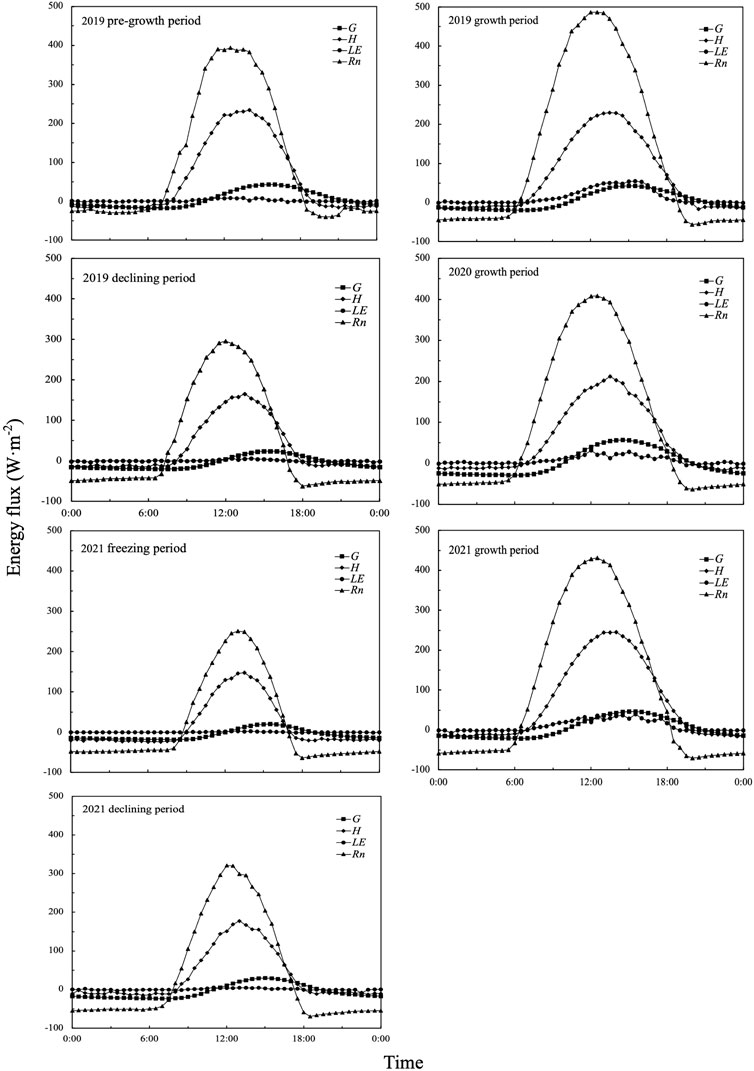
FIGURE 5. Diurnal variation of energy flux in the Inner Mongolian desert ecosystem in different periods.
In each period, Rn showed a single peak in the daily trend with low values in the morning and evening and high values at noon. The peak value of Rn appeared during 12:00–12:30 local time, and no notable difference was found between different years and periods. The maximum value of daily variation of Rn in each period was as follows: growth period > pre-growth period > declining period > freezing period. The daily dynamic change of G was consistent with that of Rn, although its peak time lagged Rn, i.e., it usually occurred during 15:00–15:30 local time. The diurnal variation of G in each period was obvious, being mostly positive during the day and negative at night. The changes of H were highly consistent with that of Rn, but the trend was gentler, and the daily change trend of each period was similar. Except for the fluctuation of LE in the vigorous growth period, it changed little in other periods, and it was approximately zero. LE was mostly positive during the day but negative at night when the temperature was <0°C, indicating frost or condensation.
The daily dynamics of the energy distribution in the different periods showed that H played a dominant role in energy consumption (Figure 6). Moreover, the energy distribution during the day and at night was different. The energy distribution during the day was H/Rn > G/Rn > LE/Rn, and the energy distribution at night was G/Rn > H/Rn > LE/Rn. The dominant factor was G. Both H/Rn and G/Rn showed a gradual increasing trend during the day and fluctuated greatly at night, while LE/Rn changed slightly at night, fluctuated violently before and after sunrise and sunset, and was relatively stable during the day, when the value was higher than that at night. Also, the diurnal variation trend of LE/Rn in the early growth period, declining period, and freezing period was very stable, when it fluctuated above and below zero. However, it fluctuated greatly in the vigorous growth period, and obvious positive and negative changes occurred before and after sunset.
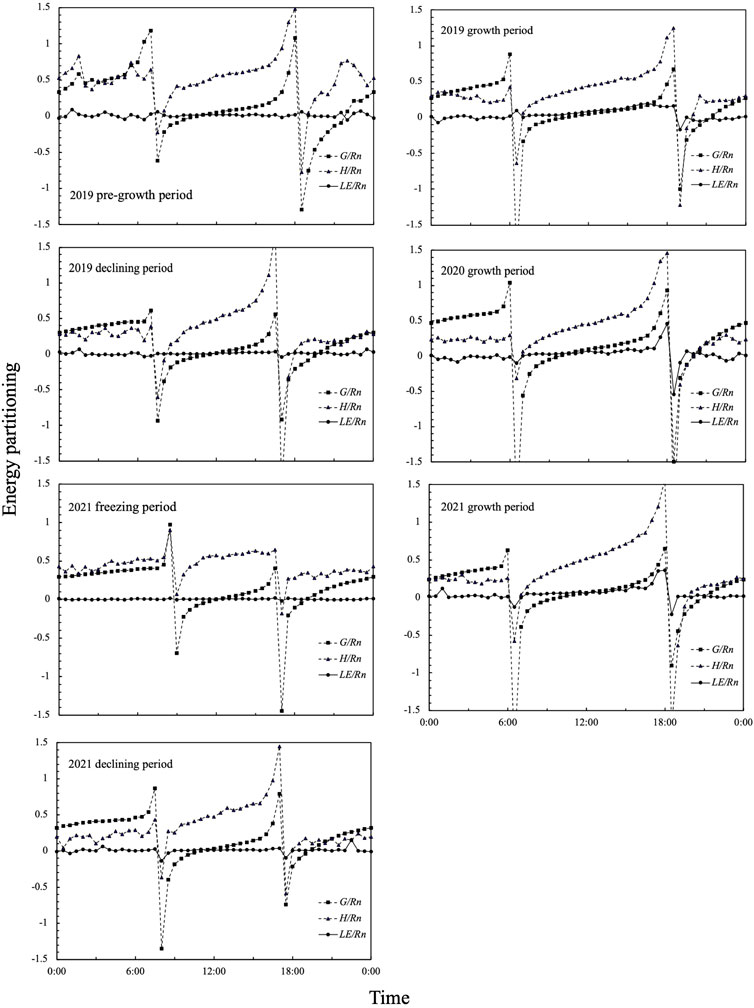
FIGURE 6. Diurnal variation of energy distribution in the Inner Mongolian desert ecosystem during different observation periods.
3.3 Influencing Factors of Energy Flux and Energy Distribution
To analyze the relationship between LE, H, the energy distribution, and environmental factors, correlation analysis was performed between the daily average flux data from March–October 2019 and the data of environmental factors (Rn, VPD, Ta, RH, Ts-10cm: soil temperature at 10 cm depth, and SWC10cm: soil water content at 10 cm depth) in the same period (Table 4). The results revealed that H demonstrated a very significant positive correlation with Rn, VPD, Ta, and SWC10cm and a very significant negative correlation with RH; LE demonstrated a very significant positive correlation with Rn, VPD, RH, Ta, Ts-10cm, and SWC10cm; LE/Rn demonstrated a very significant positive correlation with Ta, RH, Ts-10cm, and SWC10cm; H/Rn was negatively correlated with Ta, VPD, RH, Ts-10cm, and SWC10cm.
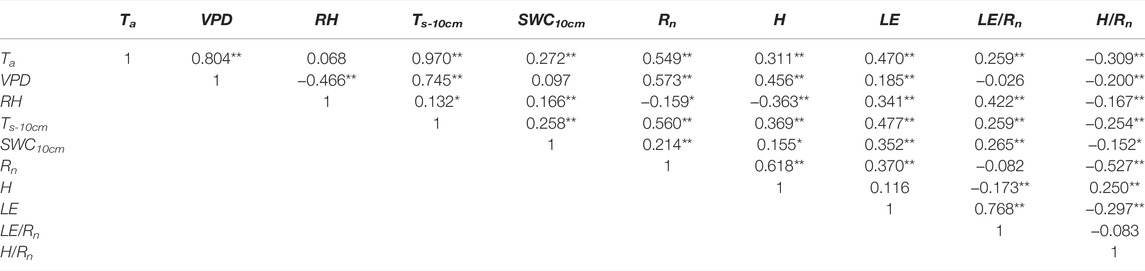
TABLE 4. Correlation between energy flux and environmental factors in the same periods.
3.4 Energy Closure
3.4.1 Half-hour Scale Energy Closure
According to the linear regression analysis of effective energy and turbulent flux and the analysis results of the energy balance ratio (Figure 7; Table 5), the energy closure rate of the half-hour flux of the Inner Mongolian desert ecosystem in different periods was different, with a variation range of 48%–68%. Generally, the intercept of the obtained linear regression line cannot pass through the origin. Therefore, in the analysis process, this paper gave linear regression S1, intercept b, determination coefficient R21, linear regression S2, and determination coefficient R22 forced through the origin. In the different periods, the variation range on the half-hour scale of regression slope S1 was 0.48–0.68, S2 was 0.50–0.77, b was 2.72–27.95 W m−2, and R2 was 0.56–0.78, which can better explain the results of the linear regression between effective capacity and turbulent flow. Additionally, S2 was greater than S1 in each period, indicating that the energy closure is improved slightly by forced linear fitting across the origin.
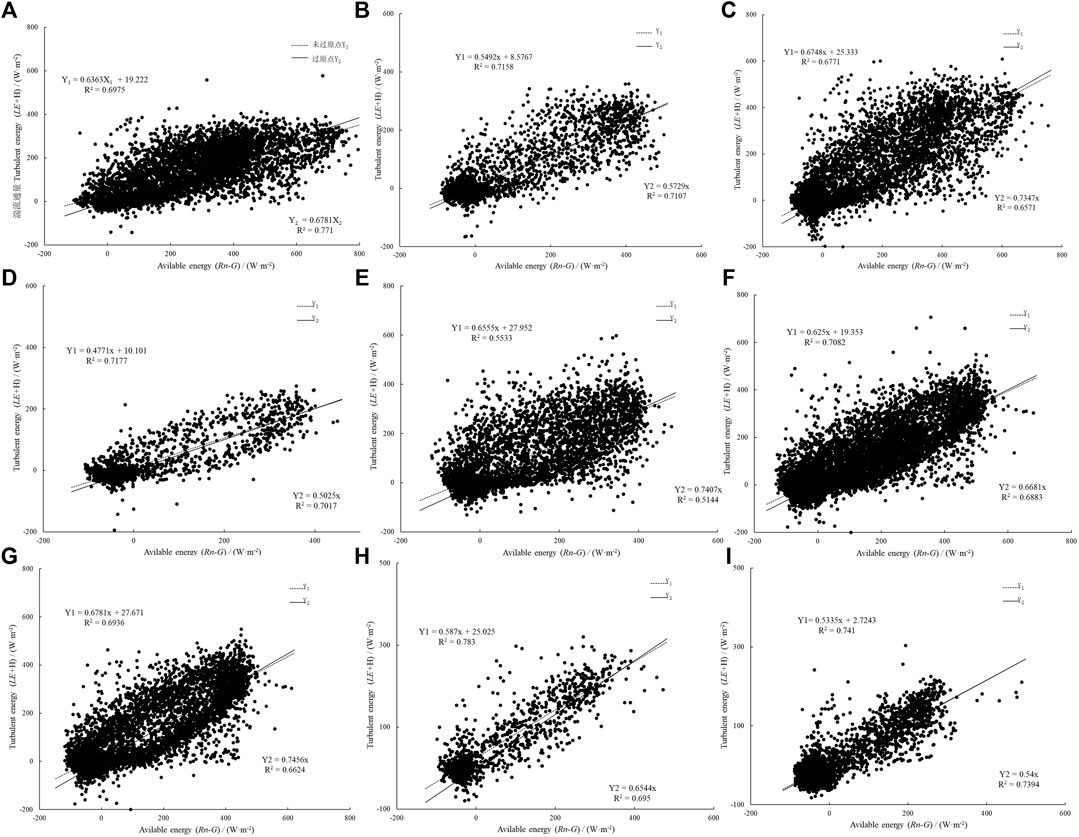
FIGURE 7. Relationship between energy turbulent flux (H + LE) and effective energy (Rn−G) in different periods under the half-hour data set. (A) 2019; (B) Pre-growth period in 2019; (C) Growth period in 2019; (D) Declining period in 2019; (E) Growth period in 2020; (F) 2021; (G) Growth period in 2021; (H) Declining period in 2020; (I) Freezing period in 2020.
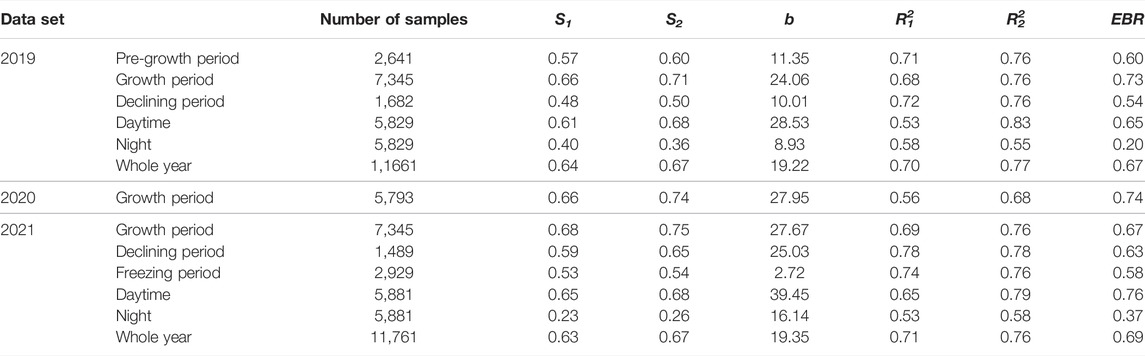
TABLE 5. Characteristics of energy closure of the Inner Mongolian desert ecosystem at the half-hour scale.
According to the half-hour flux data, the EBR range in the different periods was 0.54–0.74. The EBR value in the vigorous growth period was the largest, followed by that in the early growth period, while the EBR value in both the declining period and the freezing period was small. The number of observation samples in 2019 and 2021 was broadly the same. Next, the comparative analysis showed no significant difference in energy closure between the 2 years. The EBR value calculated from all observation data in 2019 was 0.67, i.e., the annual average energy closure was 67%, and the EBR in 2021 was 0.69. In 2019, the energy closure during the day and at night was 65% and 20%, respectively, and in 2021, the energy closure during the day was also higher than that at night (76% and 37% respectively). Additionally, it can be seen from Table 5 that the energy closure obtained using the EBR method was greater than that calculated using the correlation method.
3.4.2 Daily Scale Energy Closure
If the observation time is short and the energy balance component and distribution are not synchronized, a lag effect will occur that results in energy non-closure. If the time scale is properly extended, the energy closure can be improved. Therefore, the energy closure calculated from the half-hour scale flux data was lower than that on the daily scale. To study the influence of different time scales on energy closure and reduce the error of a large number of nighttime flux data on the half-hour scale, two methods were also used to analyze the energy closure under the calculation of daily average flux data. The slopes of the linear regression of the 3-year effective energy and turbulent flow were slightly higher than those calculated for the half-hour scale in the same period. The energy closure of the daily average flux in 2019, 2020, and 2021 was 67%, 66%, and 67%, respectively (energy closure on the half-hour scale was 64%, 66%, and 63%, respectively). The energy closure on the daily scale in 2021 increased by 3%, and the R2 of the linear regression equation also increased significantly (i.e., 0.96). On the daily scale, the EBR values in 2019, 2020, and 2021 were 0.77, 0.80, and 0.70, respectively. In comparison with the half-hour data (0.67, 0.74, and 0.69 in 2019, 2020, and 2021 respectively), the average energy closure increased by approximately 6% (Figure 8; Table 6).
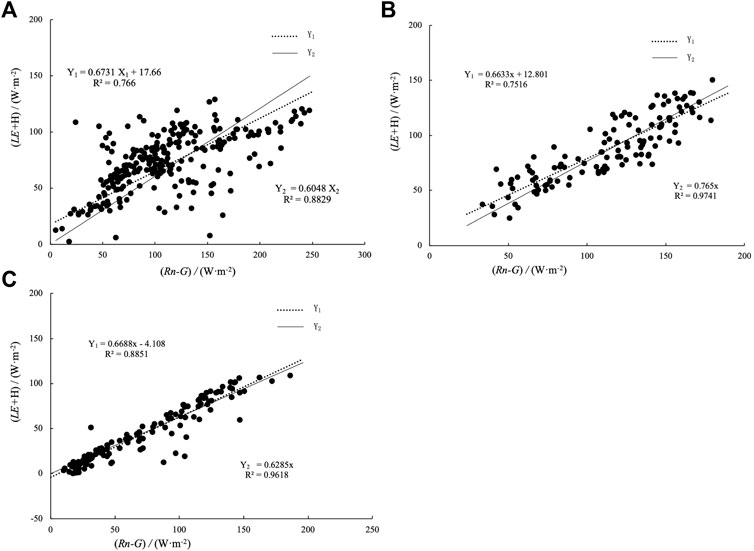
FIGURE 8. Relationship between energy turbulent flux (H + LE) and effective energy (Rn−G) in different periods under the daily average data set. (A) 2019; (B) 2020; (C) 2021.
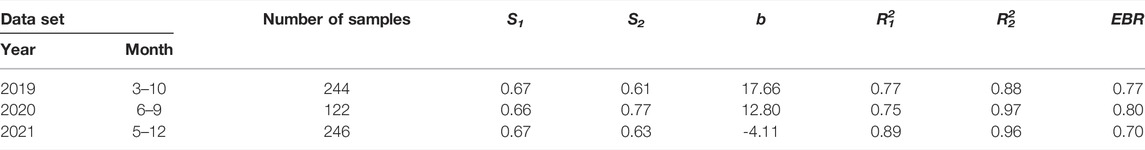
TABLE 6. Characteristics of energy closure of the Inner Mongolian desert ecosystem at the daily scale.
4 Discussions
4.1 Energy Distribution Characteristics
Sensible heat exchange depends on the turbulent heat exchange coefficient and the Ta gradient difference. The greater the gradient difference, the rougher the ground, the stronger the surface heat exchange, and the greater the sensible heat. This study found that the sensible heat was greater than the latent heat, which was similar to the energy balance characteristics reported for the growing season of the Inner Mongolian Desert Grassland (Yang and Zhou, 2010) and the hinterland of the Taklimakan Desert (Qi et al., 2020) all year round. Next, the variation trend of both H and G was consistent with that of Rn in three periods, i.e., a single-peaked diurnal variation, but with a curve that was not as smooth as that of Rn, which might reflect indirect turbulent transmission (Zhang et al., 2002). Because the specific heat of soil is much greater than that of air and because the change of soil temperature occurs later than that of Ta, the time for G to reach its peak lags behind Rn, and the time lag is affected by the sunrise time. Although the ratio of G to Rn is very small, the characteristics of G absorbing energy during the day and releasing energy at night and storing energy in summer and releasing energy in winter play a role of an “energy buffer” in the surface energy budget. Therefore, when studying the energy balance of desert ecosystems in Inner Mongolia, the influence of G cannot be ignored.
During the observation period in the study area, LE/Rn was always very small, i.e., < 0.1 most of the time. This is because in the Ulan Buh desert area, soil water is scarce, vegetation transpiration is slow, LE is less than H, and the soil type is sandy soil, which is conducive to rapid vertical drainage, thereby reducing the potential impact of soil water on LE. The differences in the energy distribution of desert ecosystems are determined by climatic characteristics, soil moisture status, and the underlying vegetation (Liu and Feng, 2012; Majozi et al., 2017; Yue et al., 2018; Ren et al., 2022). The results of this study showed that water resource status is the key factor affecting energy distribution in extremely arid desert areas. If the water supply of the ecosystem is sufficient, the energy consumption is mainly LE. If the water supply of the ecosystem is insufficient, the energy consumption is mainly H.
4.2 Influence of Environmental Factors on the Energy Distribution
The correlation analysis revealed that the main factor affecting sensible heat is Rn. The previous analysis established that H increases with increasing Rn and that it shows similar dynamic changes with Rn on daily and seasonal scales, followed by VPD, soil temperature, Ta, and RH. Soil water content exhibits little effect on latent heat. For latent heat, Ta, soil temperature and Rn are the main influencing factors, followed by VPD, RH, and wind speed. Many earlier studies showed that climatic factors (e.g., precipitation, radiation, temperature, and VPD) and biological factors (e.g., leaf area index) affect the energy distribution (Matsumoto et al., 2008; Launiainen, 2010; Jia et al., 2016; Launiainen et al., 2016). For the desert ecosystem of Inner Mongolia with its arid climate, sparse vegetation, and fragile ecological environment, the key factors affecting the energy distribution are water conditions and the underlying surface conditions (Yue et al., 2019).
4.3 Energy Closure
In the process of observing the carbon, water, and heat fluxes using an EC system, the closure of energy balance is an important index with which to measure the data quality (Mahrt, 1998; Li et al., 2004), but energy non-closure is a common phenomenon in EC observation. In terms of data processing, different time scales and energy balance evaluation methods obtain different energy closure results. At the FLUXNET site, the slope range is 0.53–0.99, the average value is 0.79, the intercept range is −32.9 to 36.9 W m−2, and the average value is 3.7 W m−2, including grassland, farmland, and forest (Wilson et al., 2002). At the ChinaFLUX stations, the slope variation range is 0.49–0.81, the average value is 0.67, the intercept value range is 10.8–79.9 W m−2, and the average value is 28.9 W m−2 (Li et al., 2005). The EBR of FLUXNET sites is between 0.34 and 1.69, with an average value of 0.84; the EBR range of ChinaFLUX sites is 0.58–1.00, with an average value of 0.83 (Li et al., 2005). The water and heat fluxes of different underlying surfaces are very different. Next, depending on the characteristics of the underlying surface, the degree of surface energy closure varies. The closure rate of desert and the desert underlying surface is 63%–96% (Beyrich, et al., 2002).
In the observation period of 2019 (2021), the energy closure of the Inner Mongolian desert ecosystem was 64% (63%). However, the phenomenon of energy non-closure in the study area always existed, and the range of energy loss is 30%–40%. According to the half-hour flux data, the EBR range in different periods was 0.54–0.74. The EBR value in the growth period was the largest, followed by the pre-growth period, and the EBR value in both the declining period and the freezing period was small. By comparing the results of the two methods, it was found that the slope of the OLS method can reflect the closure of the energy balance only when the correlation coefficient of the regression equation is effective. The EBR method needs to average the random error of the measured half-hour values to analyze the equilibrium ratio of all energy over a certain period of time.
5 Conclusion
The maximum value of the daily average of Rn during 2019–2021 was 251.73, 208.17, and 193.65 W m−2, respectively. The energy distribution showed obvious seasonal and diurnal changes. The distribution of Rn in the Inner Mongolian desert ecosystem is mainly dominated by H. The energy distribution of H/Rn fluctuated greatly, showing a U-shaped change trend, while LE/Rn generally presents an inverted V-shaped distribution, and LE/Rn was low in winter, fluctuating above and below zero. Next, G/Rn fluctuated slightly in the growing season and was < 0.1. The energy component and energy distribution showed reasonable correlation with various environmental factors. The main factor affecting sensible heat was Rn, followed by VPD, soil temperature, Ta, and RH. For latent heat, the main influencing factors were Ta, soil temperature, and Rn.
The energy closure rate of half-hour flux data in the Inner Mongolian desert ecosystem in different periods was different, with a variation range of 48%–68%. In different years, little difference occurred in the degree of energy closure. According to the half-hour flux data, the EBR range in the different periods was 0.54–0.74. The EBR value in the vigorous growth period was largest, followed by that in the early growth period, and the EBR value in both the declining period and the freezing period was small. The energy closure during the day was higher than that at night. Comparison and analysis of the energy closure at the half-hour and daily average scales revealed that the energy closure of the daily average flux in 2019, 2020, and 2021 was 67%, 66%, and 67%, respectively, i.e., higher than that at the half-hour scale (64%, 66%, and 63%, respectively).
The special location of the desert ecosystem in Inner Mongolia increases the complexity of the spatial distribution and temporal variation of the physical quantities on the surface. Additionally, this study did not consider the energy closure caused by the loss of energy flux, heat storage in the vegetation canopy and air, measurement errors, and other issues. Furthermore, the continuity and integrity of the data need to be improved. Analysis of the energy balance during other weather conditions and seasons or on longer time scales is lacking for this region. Therefore, the heat and water transfer in the Dengkou Desert ecosystem in Inner Mongolia needs further study.
Data Availability Statement
The original contributions presented in the study are included in the article/Supplementary Material. Further inquiries can be directed to the corresponding author.
Author Contributions
YP and ZX contributed to conception and design of the study. YP wrote the original draft. HX contributed to the revision of the manuscript. All authors contributed to manuscript revision, read, and approved the submitted version.
Funding
This study was funded by the Project of Intergovernmental International Cooperation in Science and Technology Innovation (NO. 2019YFE0116500).
Conflict of Interest
The authors declare that the research was conducted in the absence of any commercial or financial relationships that could be construed as a potential conflict of interest.
Publisher’s Note
All claims expressed in this article are solely those of the authors and do not necessarily represent those of their affiliated organizations or those of the publisher, the editors, and the reviewers. Any product that may be evaluated in this article, or claim that may be made by its manufacturer, is not guaranteed or endorsed by the publisher.
Acknowledgments
We are grateful for the support from the Inner Mongolia Dengkou Desert Ecosystem National Observation Research Station, Dengkou, China. We also thank the journal editors and reviewers for their comments and efforts on this article. Also, we thank James Buxton, MSc, from Liwen Bianji (Edanz) (www.liwenbianji.cn/), for editing the English text of a draft of this manuscript.
References
Beyrich, F., De Bruin, H. A. R., Schipper, J. W., Meijninger, W. M. L., Lohse, H., and Lohse, H. (2002). Results from One-Year Continuous Operation of a Large Aperture Scintillometer Over a Heterogeneous Land Surface. Boundary-Lay. Meteorol. 105 (1), 85–97. doi:10.1023/a:1019640014027
Brown, K. W., and Rosenberg, N. J. (1973). A Resistance Model to Predict Evapotranspiration and its Application to a Sugar Beet Field1. Agron. J. 65 (3), 341–347. doi:10.2134/agronj1973.00021962006500030001x
Curry, J., and Webster, P. (1999). Thermodynamics of Atmospheres and Oceans. San Diego, CA: Academic Press, 65, 1–471.
Falge, E., Baldocchi, D., Olson, R., Anthoni, P., Aubinet, M., Bernhofer, C., et al. (2001). Gap Filling Strategies for Defensible Annual Sums of Net Ecosystem Exchange. Agric. For. Meteorol. 107 (1), 43–69. doi:10.1016/s0168-1923(00)00225-2
Huang, T. Y., Liu, X. T., Wang, G. L., Duan, L. M., and Chen, X. P. (2019). Dynamic Changes of Water and Heat Fluxes and Responses to Environmental Factors in Cascade Ecological Zone. J. Soil Water Conserv. 26 (03), 122–127+134. doi:10.13869/j.cnki.rswc.2019.03.018
Jia, X., Zha, T. S., Gong, J. N., Zhang, Y. Q., Qin, S. G., Chen, G. P., et al. (2016). Energy Partitioning Over a Semi-Arid Shrubland in Northern China. Hydrol. Process. 30 (6), 972–985. doi:10.1002/hyp.10685
Jiao, L., Ding, R., Kang, S., Du, T., Tong, L., and Li, S. (2018). A Comparison of Energy Partitioning and Evapotranspiration Over Closed Maize and Sparse Grapevine Canopies in Northwest China. Agric. Water Manage. 203, 251–260. doi:10.1016/j.agwat.2018.03.019
Launiainen, S., Katul, G. G., Lindroth, A., Lohila, A., Aurela, M., Varlagin, A., et al. (2016). Do the Energy Fluxes and Surface Conductance of Boreal Coniferous Forests in Europe Scale with Leaf Area? Glob. Change Biol. 22 (12), 4096–4113. doi:10.1111/gcb.13497
Launiainen, S. (2010). Seasonal and Inter-Annual Variability of Energy Exchange above a Boreal Scots Pine Forest. Biogeosciences 7 (12), 3921–3940. doi:10.5194/bg-7-3921-2010
Li, H. D., Guan, D. X., Yuan, F. H., Ren, Y., Wang, A. Z., Jin, C. J., et al. (2014). Diurnal and Seasonal Variations of Energy Balance Over Horqin Meadow. Chin. J. Appl. Eclo. 25 (01), 69–76. doi:10.13287/j.1001-9332.2014.01.010
Li, T., Yan, C. H., Wang, B., Zhao, W., L., Zhang, Y., and Qiu, G. Y. (2018). Characteristics of Energy Balance in a Mixed Forest in Jiuzhaigou Valley. Acta Ecol. Sin. 38 (22), 8098–8106. doi:10.5846/stxb201712182270
Li, Z. Q., Yu, G. R., Wen, X. F., Zhang, L. M., Ren, C. Y., and Fu, Y. L. (2004). Evaluation of Energy Balance Closure of ChinaFLUX Network. Sci. China Earth Sci. 34 (S2), 46. doi:10.1360/zd2004-34-S2-46
Li, Z. Q., Yu, G. R., Wen, X. F., Zhang, L. M., Ren, C. Y., and Fu, Y. L. (2005). Energy Balance Closure at ChinaFLUX Sites. Sci. China(Ser. D). 48 (S1), 51–62. doi:10.1360/05zd0005
Liu, H., and Feng, J. W. (2012). Seasonal and Interannual Variations of Evapotranspiration and Energy Exchange over Different Land Surfaces in a Semiarid Area of China. J. Appl. Mater. Clim. 51 (10), 1875–1888. doi:10.1175/JAMC-D-11-0229.1
Ma, H., Chen, Y. N., and Li, W. H. (2014). Charateristics of Energy Balance of Riparian Tamarix Shrubs in Desert. J. Desert Res. 34 (01), 108–117. (In Chinese). doi:10.7522/j.issn.1000-694X.2013.00134
Mahrt, L. (1998). Flux Sampling Errors for Aircraft and Towers. J. Atmos. Ocean. Technol. 15 (2), 416–429. doi:10.1175/1520-0426(1998)015<0416:fsefaa>2.0.co;2
Majozi, N. P., Mannaerts, C. M., Ramoelo, A., Mathieu, R., Nickless, A., and Verhoef, W. (2017). Analysing Surface Energy Balance Closure and Partitioning over a Semi-arid Savanna FLUXNET Site in Skukuza, Kruger National Park, South Africa. Hydrol. Earth Syst. Sci. 21 (7), 3401–3415. doi:10.5194/hess-21-3401-2017
Matsumoto, K., Ohta, T., Nakai, T., Kuwada, T., Daikoku, K. I., Iida, S. I., et al. (2008). Energy Consumption and Evapotranspiration at Several Boreal and Temperate Forests in the Far East. Agric. For. Meteorol. 148 (12), 1978–1989. doi:10.1016/j.agrformet.2008.09.008
Mihalakakou, G., Santamouris, M., Lewis, J. O., and Asimakopoulos, D., N. (1997). On the Application of the Energy Balance Equation to Predict Ground Temperature Profiles. Sol. Energy 60 (3-4), 181–190. doi:10.1016/s0038-092x(97)00012-1
Niu, X. D., Liu, X. J., Liu, S. R., and Sun, P. S. (2018). Energy Balance Characteristics of a Natural Oak Forest (Quercus Aliena) at a Transitional Area from a Subtropical to Warm Temperate Climate, China. Acta Ecol. Sin. 38 (18), 6701–6711. (In Chinese). doi:10.5846/stxb201803290650
Qi, F. F., Ali, M., Huo, W., He, Q., and Liu, Y. Q. (2020). Characteristics of Surface Radiation and Energy Balance and Microclimate in the Hinterland of Taklimakan Desert. Arid. Meteorol. 38 (1), 32–39. (In Chinese). doi:10.11755/j.issn.1006-7639(2020)-01-0032
Reddy, N. N., Temimi, M., Fonseca, R. M., Weston, M. J., Wehbe, Y., Thota, M. S., et al. (2020). Micrometeorological Measurements in an Arid Environment: Diurnal Characteristics and Surface Energy Balance Closure. Atmo. Res. 234, 104745. doi:10.1016/j.atmosres.2019.104745
Ren, X. Y., Zhang, Q., Yue, P., Yan, X., and Yang, Y. (2022). Energy Distribution Characteristics and Environmental Impact Factors in Different Regions of the Summer Monsoon Transition Zone. Front. Environ. Sci. 10 (4), 1–14. doi:10.3389/fenvs.2022.847725
Renata, G. A., Carlo, R. D. M., Leonardo, J. G. A., Mariano, M. E., and Graciela, R. F. (2019). Energy Balance Closure in the Southwest Amazon Forest Site-Astatistical Approach. Theor. Appl. Climatol. 136 (3-4), 1209–1219. doi:10.1007/s00704-018-2548-8
Swinbank, W. C. (1951). The Measurement of Vertical Transfer of Heat and Water Vapor by Eddies in the Lower Atmosphere. J. Meteor. 8 (3), 135–145. doi:10.1175/1520-0469(1951)008<0135:tmovto>2.0.co;2
Tan, Z. H., Yu, G. R., Zhou, G. Y., Liao, Z. Y., Zhao, J. F., Yang, L. Y., et al. (2015). Microclimate of Forests across East Asia Biomes: 1. Radiation and Energy Balance. Chin. J. Plant Eclo. 39 (06), 541–553. doi:10.17521/cjpe.2015.0052
Wang, X., Huo, Z., Shukla, M. K., Wang, X., Guo, P., Xu, X., et al. (2020). Energy Fluxes and Evapotranspiration Over Irrigated Maize Field in an Arid Area with Shallow Groundwater. Agric. Water Manage. 228, 105922. doi:10.1016/j.agwat.2019.105922
Webb, E. K., Pearman, G. I., and Leuning, R. (1980). Correction of Flux Measurements for Density Effects Due to Heat and Water Vapour Transfer. Q. J. Roy. Meteor. Soc. 106 (447), 85–100. doi:10.1002/qj.49710644707
Wilson, K. B., Goldstein, A., H., Falge, E., Tenhunen, J., Velentini, R., and Verma, S. (2002). Energy Balance Closure at FLUXNET Sites. Agric. For. Meteorol. 113 (1-4), 223–243. doi:10.1016/s0168-1923(02)00109-0
Wu, F. T., Cao, S. K., Cao, G. C., Han, G. Z., Lin, Y. Y., and Chen, S. Y. (2018). Variation of CO2 Flux of Alpine Wetland Ecosystem of Kobresia Tibetica Wet Meadow in Lake Qinghai. J. Eclo. Rural. Environ. 34 (02), 124–131. (In Chinese). doi:10.11934/j.issn.1673-4831.2018.02.004
Yang, F., and Zhou, G. (2010). Characteristics and Driving Factors of Energy Budget Over a Temperate Desert Steppe in Inner Mongolia. Acta Ecol. Sin. 30 (21), 5769–5780.
Yuan, W. W., Tong, X. J., Zhang, J. S., Meng, P., Li, J., and Zheng, N. (2015). Characteristics of Energy Balance of a Mixed Plantation in the Xiaolangdi Area in the Growing Season. Acta Ecol. Sin. 35 (13), 4492–4499. (In Chinese). doi:10.5846/stxb201411062195
Yue, P., Zhang, Q., Yang, Y., Zhang, L., Zhang, H., Hao, X. C., et al. (2018). Seasonal and Inter-Annual Variability of the Bowen Smith Ratio over a Semi-Arid Grassland in the Chinese Loess Plateau. Agric. For. Meteorol. 252, 99–108. doi:10.1016/j.agrformet.2018.01.006
Yue, P., Zhang, Q., Zhang, L., Li, H. Y., Yang, Y., Zeng, J., et al. (2019). Long-Term Variations in Energy Partitioning and Evapotranspiration in a Semiarid Grassland in the Loess Plateau of China. Agric. For. Meteorol. 278, 107671. doi:10.1016/j.agrformet.2019.107671
Yue, P., Zhang, Q., Zhao, W., Wang, J. S., Wang, R., Y., Yao, Y. B., et al. (2013). Effects of Clouds and Precipitation Disturbance on the Surface Radiation Budget and Energy Balance over Losess Plateau Semi-Arid Grassland in China. Acta Phys. Sin. 62 (20), 1–14. (In Chinese). doi:10.7498/aps.62.209201
Zhang, J. H., Ding, Z. H., Han, S. J., Zou, C-J., and Zhou, Y-M. (2002). Turbulence Regime Near the Forest Floor of a Mixed Broad Leaved Korean Pine Forest in Changbai Mountains. J. For. Res. 13 (2), 119–122. doi:10.1007/BF02857234
Zhao, W., Z., Ji, X. B., and Liu, H. (2011). Progresses in Evapotranspiration Research and Prospect in Desert Oasis Evapotranspiration Research. Arid. Zone Rer 28 (03), 463–470. (In Chinese). doi:10.13866/j.azr.2011.03.029
Keywords: desert ecosystem, eddy covariance method, energy balance, environmental factors, energy closure
Citation: Pan Y, Xiao H, Xin Z, Li J, Miri A and Cao Q (2022) Characteristics of Energy Distribution in a Desert Ecosystem in Inner Mongolia, Northern China. Front. Environ. Sci. 10:939782. doi: 10.3389/fenvs.2022.939782
Received: 09 May 2022; Accepted: 01 June 2022;
Published: 19 July 2022.
Edited by:
Jifeng Deng, Shenyang Agricultural University, ChinaReviewed by:
Jiabing Wu, University of Chinese Academy of Sciences, ChinaXiaohui Yang, Chinese Academy of Forestry, China
Copyright © 2022 Pan, Xiao, Xin, Li, Miri and Cao. This is an open-access article distributed under the terms of the Creative Commons Attribution License (CC BY). The use, distribution or reproduction in other forums is permitted, provided the original author(s) and the copyright owner(s) are credited and that the original publication in this journal is cited, in accordance with accepted academic practice. No use, distribution or reproduction is permitted which does not comply with these terms.
*Correspondence: Huijie Xiao, soilandwater2006@hotmail.com