Improvement of P Use Efficiency and P Balance of Rice–Wheat Rotation System According to the Long-Term Field Experiments in the Taihu Lake Basin
 Liang Xiao1†
  Guanglei Chen1† Hong Wang2† Yixuan Li1 Chi Li1 Liang Cheng2 Wenge Wu2,3 Xin Xiao2*
  Yiyong Zhu1*
- 1Jiangsu Provincial Key Lab for Organic Solid Waste Utilization, Jiangsu Collaborative Innovation Center for Solid Organic Waste Resource Utilization, National Engineering Research Center for Organic—Based Fertilizers, Nanjing Agricultural University, Nanjing, China
- 2College of Resources and Environment, Anhui Science and Technology University, Fengyang, China
- 3Anhui Academy of Agricultural Sciences, Hefei, China
Phosphorus (P) accumulation in rice–wheat rotation fields around the Yangtze River delta have been enriched during the last decades. To protect the environment and save P resources, we conducted field experiments to optimize the P application scheme. First, one field experiment was designed as a series of P fertilizer application doses of 0–100 kg P2O5 hm−2. Grain yield and P uptake by crops were analyzed to calculate P surplus and P use efficiency. Soil P fractions were extracted and tested. According to the P balance, we optimized fertilization by reducing the chemical P amount, which was used by local farmers; furthermore, we substituted chemical P with organic fertilizer. To verify these management strategies, another field experiment was conducted with five treatments: no N, P, or K fertilizer (CK); only no P fertilizer (NK); farmers’ fertilization of P (90 kg P2O5 hm−2) (FFP); reducing 20% P (FFP-20%P); and reducing 20% P and replacing 20% P by manure (FFPM-36%P). The grain yield was enhanced by increased P fertilizer and reached a constant level after 75 kg P2O5 hm−2. Moreover, the annual P surplus was balanced around the input of 150 kg P2O5 hm−2. Accordingly, by optimizing fertilization (FFP-20%P) and further replacing manure (FFPM-36%P), we also achieved crop yield equivalent to that of FFP treatment (90 kg P2O5 hm−2). Thus, the 72–75 kg P2O5 hm−2 application rate is a threshold for the production of rice and wheat and P balance. Total P content in soil was enhanced by increased input of P fertilizer and mainly divided into labile Pi and middle stable Pi fractions. Soil Olsen-P content increased by P fertilization accordingly, while the content of organic P and stable P content was relatively constant. Reducing P fertilizer by 20% had similar results for soil P fractions when compared with farmers’ P fertilization treatment. Therefore, reducing at least 20% current input of P by farmers (annual 180 kg P2O5 hm−2) according to the balance of P surplus in rice and wheat rotation systems is an imperative measure to guarantee crop production with enhanced P use efficiency, and meanwhile, it can alleviate environmental risk.
Introduction
Food security is always an important issue in Asia, where there is a large population (Thangavel and Sridevi, 2017). In China, the rice–wheat rotation system is one of the traditional agricultural practices along the Yangtze River Basin, with a planting area of 4.8 million hectares (Zhang et al., 2017), which provides important staple foods for people. In 2018, China’s total rice and wheat production accounted for 27% and 18% of the global production, respectively (Muthayya et al., 2015). These huge crop productions in China were strongly dependent on the large inputs of chemical fertilizers, especially N and P (Qiu, 2009; Qiu, 2010; Cui et al., 2018). According to the data from the National Bureau of Statistics (https://www.ceicdata.com/zh-hans/china/consumption-of-chemical-fertilizer-phosphate), P fertilizer applied in 2019 amounts to 6.815 million tons. The annual application amount of P fertilizer from 1979 to 2019 is an average of 6.890 million tons. The value peaked in 2014, at about 8.453 million tons from the lowest value in 1979, about 2.235 million tons. The heavy fertilizer use has made China one of the biggest fertilizer consumers in the world. Therefore, such an agricultural mode had adverse negative effects on the environment, such as the increase in greenhouse gas emissions (Chen et al., 2014; Cui et al., 2018), soil acidification (Guo et al., 2010), eutrophication (Le et al., 2010), and biodiversity loss in soil (Clark and Tilman, 2008). The Yangtze River Basin is an important agricultural area in China due to enough water and temperature resources for paddy rice cultivation. However, the Yangtze River Basin has consistently accumulated phosphorus since 1980 due to intensive agriculture with high input of P (Powers et al., 2016).
Thus, it is urgent to re-evaluate the input of fertilizers, seasonal crop production, accumulation, and balance of nutrient elements in the local agricultural system. Phosphorus (P) is one of the important fertilizers for crop growth and yield. However, P is easily absorbed by oxides of Al or Fe or precipitated by Ca in the soil, which leads to low P use efficiency (Holford, 1997). To achieve high crop production, farmers apply the P fertilizer every season in high amounts, due to the lack of information regarding the present values of available P in soil. In the Yangtze River delta near the Taihu Lake, average yields of rice and wheat in the area were reported to be around 7,500 and 4,500 kg hm−2 during the wet and dry rotation, respectively (Zhao et al., 2009). However, due to the high rate of chemical P fertilizer application, the phosphorus content in farmland soil in Taihu Lake Basin has been increasing over the last 40 years. The Olsen-P concentration in 65% of soil samples in this region was over 20 mg kg−1 soil (Wang S. Q. et al., 2012; Wang et al., 2022); in contrast, it was only several mg·kg−1 in the 1980s. Since the environmental threshold of soil Olsen-P in the local fields is about 30 mg kg−1, the overapplication of chemical P fertilizer or compound fertilizer brought a great risk to the environment (Powers et al., 2016), and further decreased P use efficiency and wasted P resources (Alewell et al., 2020).
In the present study, we conducted a field experiment with a series of P fertilization rates to check the effect of P input on the crop yield and P surplus in the current rice and wheat rotation system. Furthermore, we reduced the current farmers’ application dose of P fertilizer and combined it with organic manure to get an optimized regime of P fertilization in the Taihu Lake delta. Our aim is to find a practical and feasible fertilization strategy to guarantee crop production and reduce risk to the environment for sustainable agriculture.
Materials and Methods
Field Experiments Description
Field trials were conducted on a farm in Yixing City, in the Yangtze River delta in the northeast of China (31°41′N, 120°40′E). This region has a subtropical semi-humid monsoon climate, with an average annual temperature of 15.2°C and annual rainfall of 1,286 mm. About 50% of the precipitation is distributed from April to June. The soil was paddy soil, consisting of 12% sand, 45% silt, and 43% clay. The initial soil pH was 6.21 (1:1, water/soil, w/w). In the surface soil (0–20 cm), the total nitrogen is 13.6 g kg−1, the organic carbon is 12.8 g kg−1, the available P is 22.8 mg kg−1, and the available K is 64.9 mg kg−1.
The field trials were divided into two parts. First, the different P fertilization amounts were applied beginning in 2016. There are five treatments: P0, P25, P50, P75, and P100 (representing 0–100 kg P2O5 hm−2 of P fertilizer, respectively). The plot size was 7 × 5 = 35 m2 with a 50-cm wide walkway between the plots. Another field experiment had five treatments, including control (CK), no phosphate fertilizer (NK), conventional fertilization by farmers (FFP), FFP reduced P by 20% (FFP-20%P), and organic substitution plus or minus P by 36% (FFPM-36%P). The plot size was 8 × 10 = 80 m2 with a 50-cm wide walkway between the plots. All treatments had four repetitions, and plots are randomly arranged in the fields.
The local cultivar of rice and wheat were Nangeng 46 and Yangmai 5, respectively. In the rice season, rice seedlings were prepared and transplanted at 30,000 holes per hectare, while wheat was directly planted at 50,000 plants per hectare. Urea was used as N fertilizer, and superphosphate and potassium chloride were used as P and K fertilizers. The organic fertilizer was manufactured by a local factory with organic matter of 40% and total N, P, and K of 6%. Urea was applied as basal fertilizer and two top dressings with a ratio of 4:3:3 (Table 1). P, K, and organic fertilizers were applied as basal fertilizers.
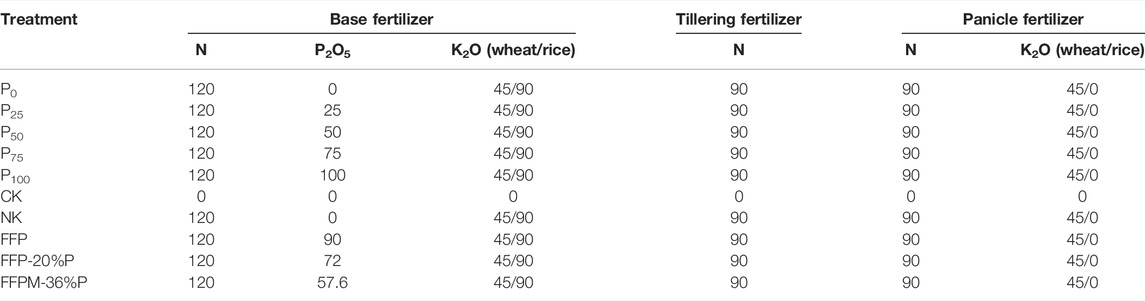
TABLE 1. Fertilizers for wheat and rice cultivation (kg·hm−2).
Crop Yield Estimation
Crops were manually harvested with all the above-ground parts from each plot. The grain and straw were separated by a threshing machine. Yield components and P concentration of grain and straw were analyzed.
Soil P Analysis
Soil samples (0–20 cm depth) from each plot were collected after crop harvest, air-dried, ground, sieved (< 2 mm sieve), and stored at room temperature for chemical analysis. Available P in soil was extracted with 0.5 M NaHCO3 (pH 8.5) and determined using the molybdenum blue method (Olsen et al., 1954).
Various P fractions were sequentially extracted from soils by deionized H2O and anion exchange resin, 0.5 M NaHCO3, 0.1 M NaOH, and 1M HCl according to Tiessen and Moir (1993). 0.5 g air-dried soil samples were dispersed in the aforementioned 20 ml solution step by step and shaken for 16 h on a rotary shaker. The soil and supernatant were then separated by centrifugation for 10 min at 10,000 × g at 4°C. The P concentration in the supernatant was determined by a spectrometer at 700 nm (UV 2500, Japan;) using the ascorbic acid molybdenum blue method (Murphy and Riley, 1962). After all the extraction steps, the soil residual was digested with H2SO4 and H2O2 at 360°C for P analysis. Moreover, NaHCO3 and NaOH extracts were halved to measure the total P and inorganic P. The amount of organic P in the extract was calculated based on the difference between total P in digestion and inorganic P in the extracts.
P Use Efficiency Calculation
Agronomic efficiency of P: AEP (kg·kg−1) = (yield under P fertilization − yield of blank)/P application dose; recovery efficiency of P: REP (%) = (P uptake by crop under P fertilization − P uptake by crop of blank)/P fertilization dose ×100%;
P uptake (kg·hm−2) = biomass per unit area × P content;
P surplus (kg·hm−2) = (P application dose − P accumulation) per unit area.
Statistical Analysis
One-way analysis of variance (ANOVA) was conducted to explore the effects of different treatments on each variable (SPSS Statistics 19.0). Differences between treatments were tested using Duncan’s test with the significance level set as alpha = 0.05. The structural equation modeling (SEM) was used to study the interaction and transformation of different P components (Hou et al., 2016) using IBM SPSS AMOS 22.0. Root mean square error of approximation (RMSEA) (<0.08), chi-square (χ2) (χ2/df < 2), and the p value of χ2 (p > 0.05) were used to evaluate the model fitting.
Results
The Yield of Rice and Wheat Under Different P Fertilization Rates
Rice yield was enhanced by P fertilizer application rates from 0∼100 P2O5 hm−2 (Table 2), including both grain and straw yield. However, the harvest index was not variable and ranged from 56∼59%. The yield components of rice showed that the P fertilizer application rates significantly affected the panicle number and grain number per panicle, but not the thousand-grain weight and filled-grain percent (Supplementary Table S1). Combining the data from the two rice seasons, it was found the P75 treatment had the highest grain yield (Supplementary Figure S1A) with the highest panicle number and grain number per panicle (Supplementary Table S1) among all the treatments. Nevertheless, the yield of rice did not further increase with the treatment of P100.
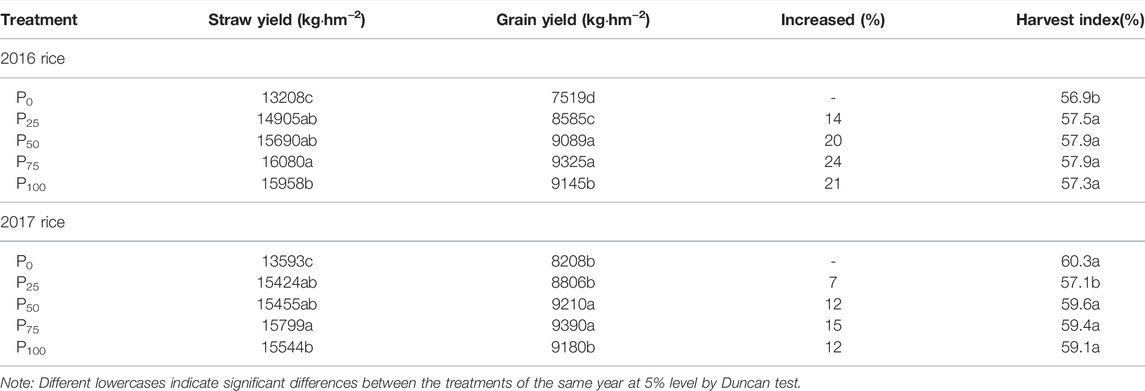
TABLE 2. Effect of P fertilization rates on rice yield.
The wheat yield was also influenced by the application rates of P fertilizer (Table 3), with increased panicle number by elevated P input, while the grain number per panicle or thousand-grain weight was not changed (Supplementary Table S2). The grain yield of two wheat seasons under the P100 treatment was similar to that under P75 (Figure 1A).
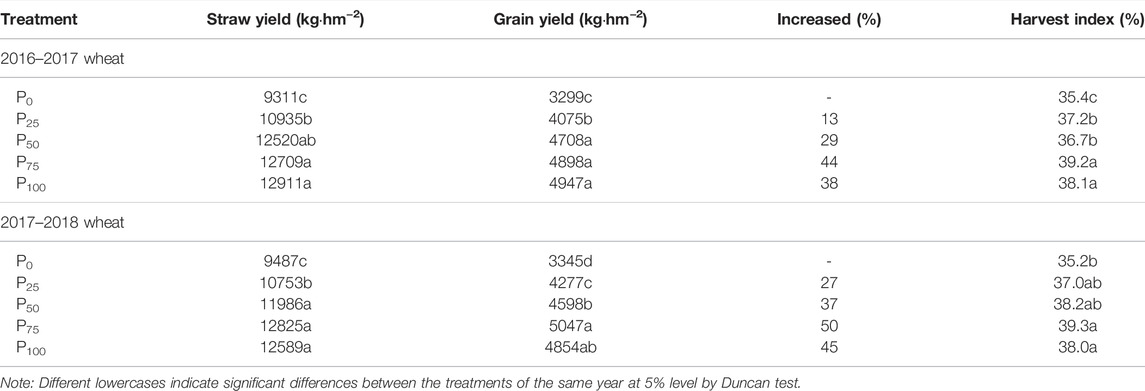
TABLE 3. Effect of P fertilization rates on wheat yield.
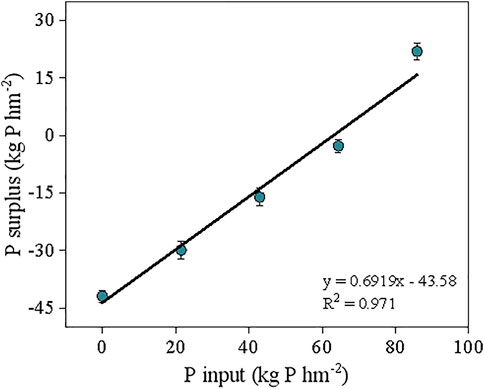
FIGURE 1. The relationship between the annual P input and the P surplus in rice and wheat rotation according to two years under a series of P fertilization amount treatment.
P Uptake by Crops and P Surplus in Rice–Wheat Rotation System Under Different P Fertilization Rates
Since the total yield of aboveground biomass (straw and grain) of rice or wheat was related to the P application rates (Tables 2, 3), the total uptake of P, which accumulated in aboveground biomass of rice and wheat, also seemed dependent on the P application rates (Table 4). 75 kg P2O5 hm−2 input caused the highest P uptake by rice and wheat; however, additional input of P did not enhance P uptake as under P100 treatments. P surplus showed negative values before P input around 75 kg P2O5 hm−2 and became positive after P75 treatment.
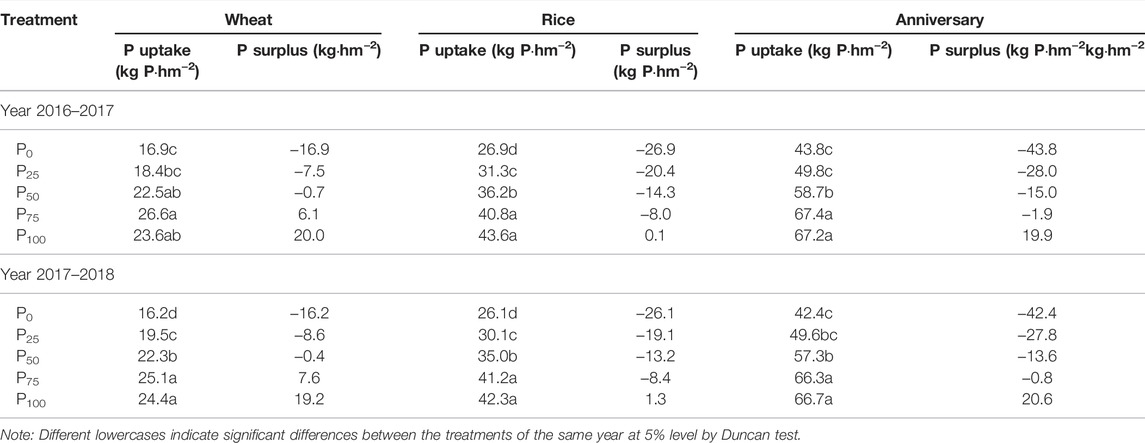
TABLE 4. Effect of P fertilization rates on P uptake and P surplus.
Taken together, we found the annual P surplus equilibrium is around 150 kg P2O5 hm−2 application rate (=65.5 P hm−2, Figure 1). Therefore, we decided to cut down the currently annual P fertilizer amount (180 kg P2O5 hm2) of farmers (FFP) by 20% (FFP-20%P) and further substitute partial P with organic manure (FFPM-36%P).
The Yield of Rice and Wheat Under Optimized P Fertilization
In the subsequent field trial from 2018 to 2019, we found that the application of P had a significant effect on rice yield compared to the no P application (NK) or no fertilization of N, P, K (CK) (Table 5). Reducing 20% P did not decrease the panicle number, grain number per panicle, thousand-grain weight, and seed setting rate, in comparison with the farmers’ P fertilization rate (Supplementary Table S3). Combining data from the seasons revealed that the rice yield can be guaranteed by reducing at least 20% of the current P fertilization (Supplementary Figure S1B). Similar results were also found in wheat seasons. Application of P fertilizer strongly improved wheat yield (Table 6), with significantly increased panicle number and grain number per panicle (Supplementary Table S4). Compared to FFP, the yield of wheat in two seasons under FFP-20%P and FFPM-36%P treatments was similar and without the differences.
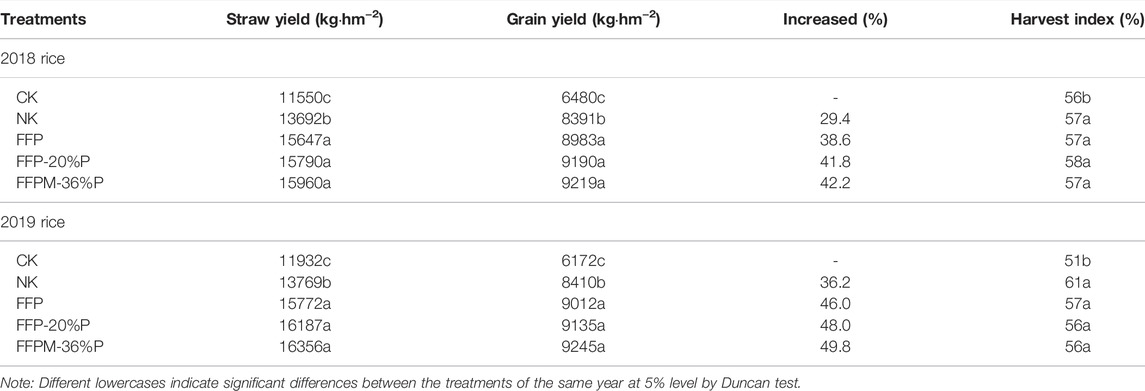
TABLE 5. Effect of optimized fertilization on rice yield.
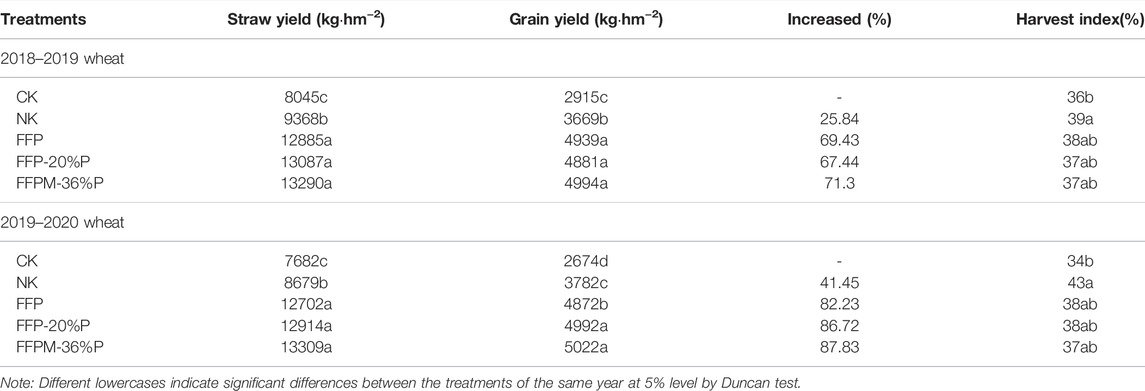
TABLE 6. Effect of optimized fertilization on wheat yield.
P Uptake by Crops and P Surplus in the Rotation System Under Optimized P Fertilization
Optimized P fertilization in rice and wheat rotation showed reduced 20% P input did not cause a decrease in P uptake but significantly depressed the P surplus in comparison with the farmer’s P fertilization dose (Table 7). It seemed that the uptake of P showed no difference between farmer’s treatment (FFP) and reduced 20% P fertilizer treatments (FFP-20%P and FFPM-36%P). Furthermore, rice took up more P than wheat and caused a net deficit of P surplus. But taken together, the annual P surplus was near equilibrium under treatments of reduced 20% P fertilizer (FFP-20%P and FFPM-36%P).
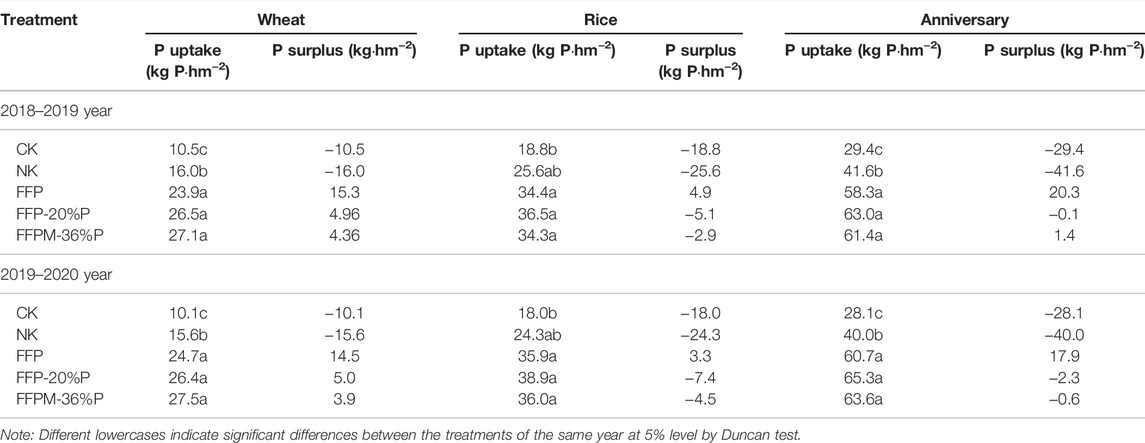
TABLE 7. Effect of optimized fertilization on P uptake and P surplus.
P Use Efficiency in Rice and Wheat Season
The effect of different P fertilizer application rates on the P use efficiency in rice and wheat rotation was calculated (Table 8). With elevated application rates of P fertilizer, the agronomic efficiency of P (AEP) continuously decreased, while the recovery efficiency of P (REP) increased and reached a maximum under P75 treatment, and then decreased under P100 treatment for both rice and wheat season (Table 8).
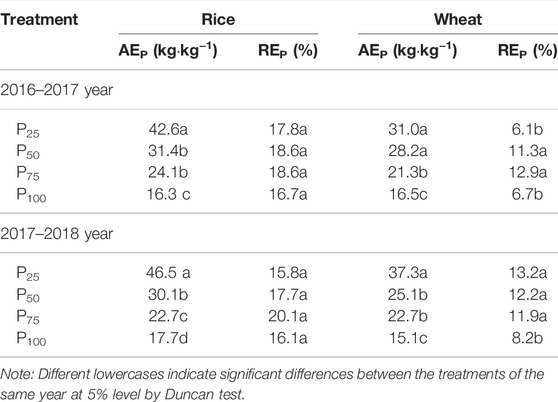
TABLE 8. Effect of P fertilization rates on P use efficiency.
The optimized P fertilization with 20% reduced P significantly enhanced the P use efficiency of AEp and REP both in the rice and wheat season (Table 9). FFPM-36%P treatment had even higher AEP and REp than FFP-20%P treatment, indicating that organic fertilizer could improve the P availability in soil compared with chemical fertilizer.
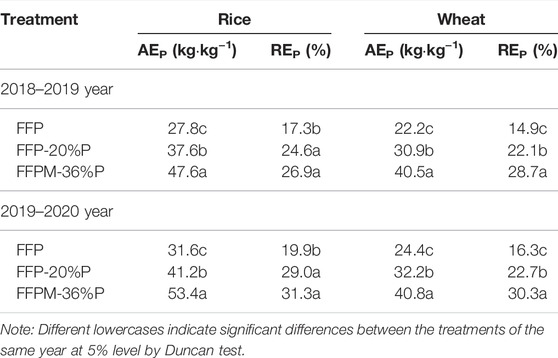
TABLE 9. Effect of optimized fertilization on P use efficiency.
Changes of P Fractions in Soil
Different P fractions were extracted from the soil after every season. P extracted with anion-exchange resin and NaHCO3 is considered labile P, and that extracted with NaOH is moderately labile P. P extracted with HCl and residual P is considered stable P (Hedley et al., 1982; Tiessen and Moir 1993).
After treatment of P fertilizer application rates, labile P and moderately labile P in soils were consequently elevated by the increase of P input, either in rice season (Figures 2A,C) or wheat season (Figures 2B,D). This is also true after the optimized fertilization treatments (Figure 3) that labile P and moderately labile P significantly increased, compared with no P treatments (CK and NK). While organic P content and stable P content were not influenced by the input of P fertilizer in the field experiments.
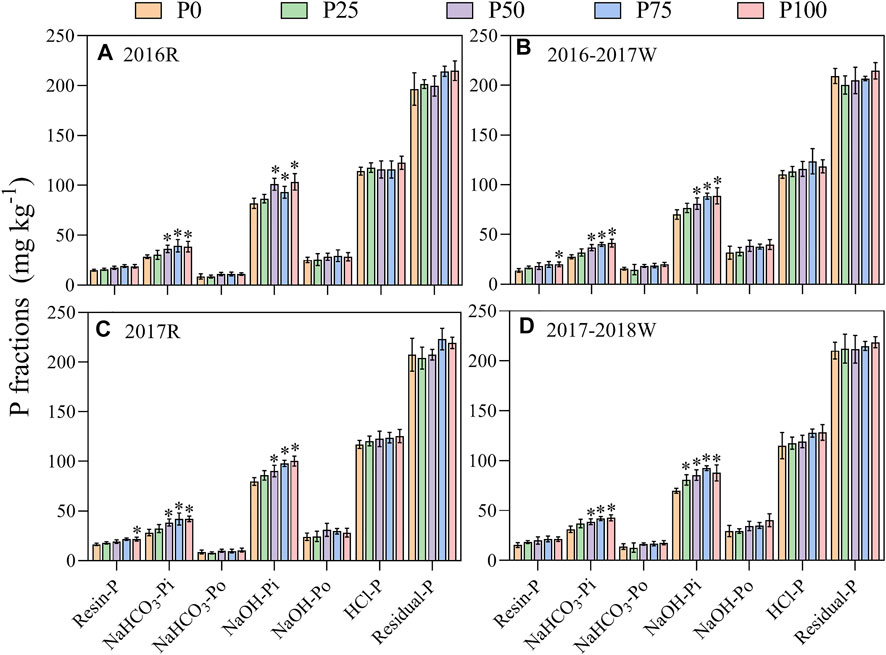
FIGURE 2. Variations in sequentially extracted P fractions under P fertilization rates on two-year rice-wheat rotation paddy field from 2016 to 2018.
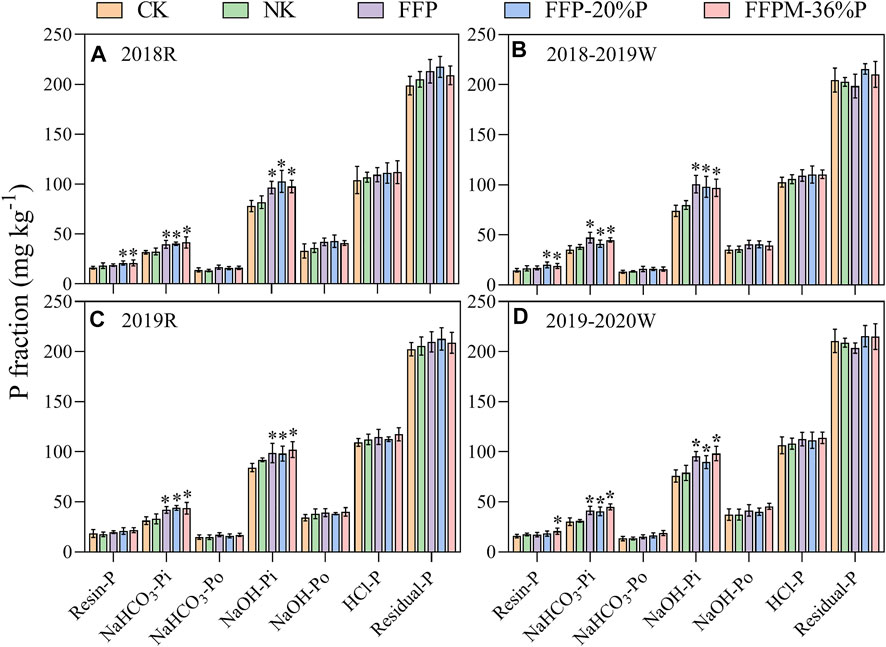
FIGURE 3. Variations in sequentially extracted P fractions under optimized fertilization on two-year rice-wheat rotation paddy field from 2018 to 2020.
Further SEM was used to explore how different P fertilizer input and optimization affected soil P fraction transformation. The results showed that NaHCO3-Pi had a direct and positive effect on resin-P (path coefficient = 0.53); NaOH-Po has a direct and positive effect on NaHCO3-Po (path coefficient = 0.75) (Figure 4A); among them, NaHCO3-Pi (standard coefficient = 0.53) and NaOH-Pi (standard coefficient = 0.51) have the most significant influence on the total standard of resin-P (Figure 4B). In the experiment of optimization of P fertilization, the results showed that NaHCO3-Po had a direct and positive effect on NaHCO3-Pi (path coefficient = 0.86) and resin-P (path coefficient = 0.31) (Figure 4C). Among them, NaHCO3-Po (standard coefficient = 0.55) has the most significant influence on the total standard of resin-P (Figure 4D).
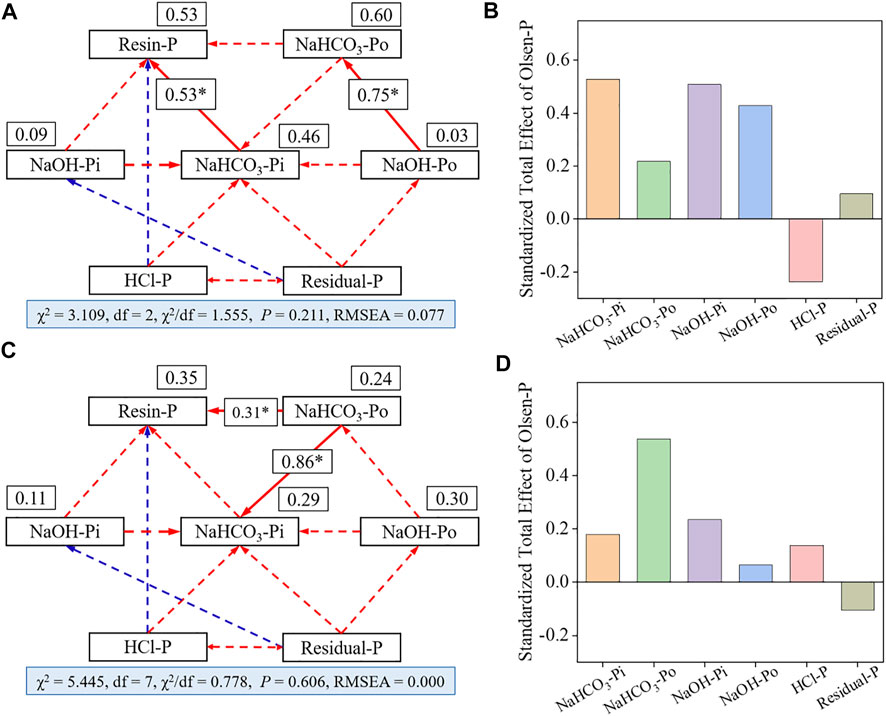
FIGURE 4. Structural equation modeling (SEM) analysis of different P fractions transformation under P fertilizer input and optimization on four-year rice‐wheat rotation paddy field from 2016 to 2020.
Taken together, the total P in the soil is strongly elevated by the input dose of P fertilizer (Figures 5A,B). Accordingly, soil Olsen-P content was significantly elevated with increasing P fertilizer application rates (Figures 6A,B). A positive correlation existed between the soil Olsen P content and the P input dose in both the rice and wheat seasons (Supplementary Figure S2).
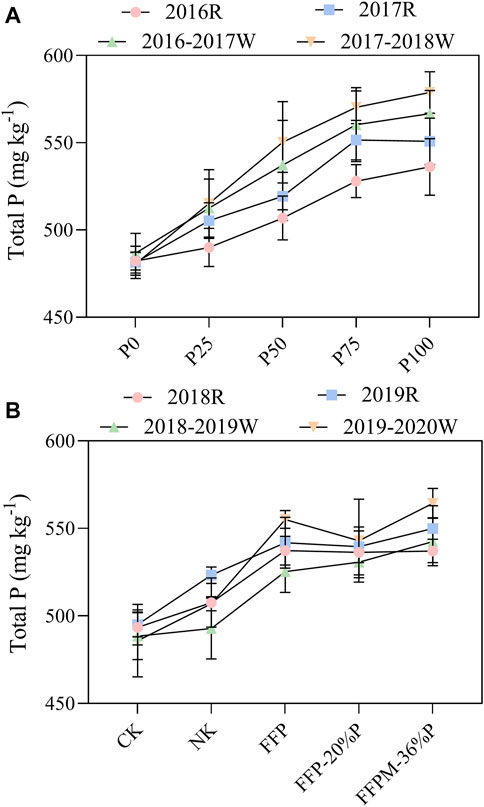
FIGURE 5. Total P (TP) concentration under P fertilizer input and optimization on four-year rice-wheat rotation paddy field from 2016 to 2020.
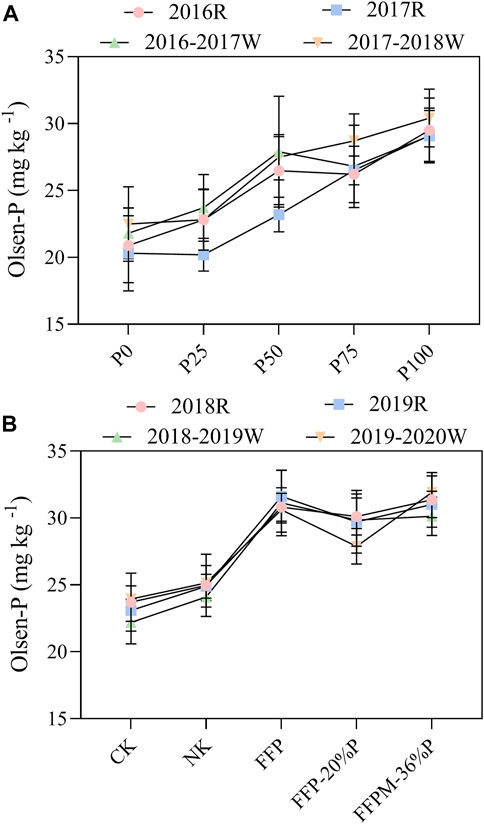
FIGURE 6. Olsen-P concentration under P fertilizer input and optimization on four-year rice-wheat rotation paddy field from 2016 to 2020.
Discussion
Effects of P Fertilization Regimes on Crop Yield
Our field experiments showed that the application amount of P fertilizer had a major effect on the yields of rice and wheat (Tables 1, 2, Supplementary Figure S1), which was related to the formation of the panicle number of these crops (Supplementary Tables S1, S2). The results indicated that the response of the panicle number rather than grain weight to fertilization regimes is the crucial factor determining crop yield. This is consistent with various previous studies (Peng et al., 2007; Gao et al., 2009; Ding et al., 2013; Song et al., 2013).
However, crop yield could not cross the threshold of a P fertilizer amount. In our experiment, 75 kg P2O5 hm−2 input caused the maximum rice or wheat yield. Excessive application of P fertilizer could not further promote the crop yield in this area. (Supplementary Figure S1). Similar results were also found by other researchers (Gong et al., 2011; Li et al., 2015). It was explained that if the amount of P fertilizer exceeded the requirement of crop growth, excessive P would not further promote crop yield.
In addition, we found that organic fertilizer replacing partial chemical fertilizer can ensure the panicle number and grain number of rice or wheat (Supplementary Tables S1, S2) necessary to achieve a similar or even higher yield like that under farmers’ fertilization (Tables 2, 3), albeit not statistically significant (Supplementary Figure S1). The results here indicated that organic manure could replace some chemical P fertilizer to further cut down the input of P. The involved mechanism may be due to the activation of soil microorganisms to mobilize the otherwise unavailable P in soil (Kaur et al., 2008). Organic manures increased organic carbon and nitrogen contents in soil (Luo et al., 2019), which in turn could stimulate the abundance of microorganisms to promote the release of ALP and accelerate the transformation of P in soil (Xavier et al., 2009; Chen et al., 2022). In addition, organic matters could help form soil aggregates and improve the physical properties of soil (Ye et al., 2019). Thus, crop production could be improved by the addition of organic manures. It is also true that 28 years of organic-inorganic fertilization field trials showed that the rice yield was 19.9% higher than that under chemical fertilization treatment (Huang et al., 2013).
Effects of Different Fertilization Regimes on P Use Efficiency
Different inputs of P fertilizer had a positive effect on P uptake by crops (Table 4), which in turn increased the accumulation of P in crop biomass (Li et al., 2015). In this experiment, it was also found that applying too much P fertilizer did not further increase P accumulation in crops when the P input was over 75 kg P2O5 hm−2 (Table 4). Meanwhile, crop yield did not continue to increase when P input exceeded 75 kg P2O5 hm−2 (Supplementary Figure S1); this might have been caused by the limitation of other nutrients in the soil. Accordingly, the agronomy efficiency of P (AEp) decreased when the P input increased, but the recovery efficiency of P (REp) reached maximum value under the treatment of 75 kg P2O5 hm−2 (Table 8). Our results indicated that 75 kg P2O5 hm−2 was currently the optimum to meet the requirement of rice or wheat yield in Taihu Lake Basin with the highest P fertilizer use efficiency. In addition, the annual P surplus reached a level of equilibrium under the treatment of 75 kg P2O5 hm−2 for the rice season or the wheat season (Table 4 and Figure 1).
Therefore, to optimize P fertilization for local farmers in Taihu Lake Basin, we cut down 20% input of chemical P fertilizer used by farmers’ (90 kg P2O5 hm−2) and tested it in field trials. The P uptake by crops was not disturbed by the 20% decrease in P fertilizer amount used by local farmers (Table 7); meanwhile, the P use efficiency was enhanced to different degrees by the FFP-20%P and FFPM-36%P treatments, compared to the conventional FFP treatment. This also suggests that organic fertilizer might improve P fertilizer use efficiency (Ayaga et al., 2006).
Effects of Different Fertilization Regimes on Soil P Pool
Fertilization is one of the major factors that can affect the various P fractions in the soil (Hong et al., 2015). Understanding the composition and transformation characteristics of soil P is of great significance for improving the recycling of P in soil (Wang et al., 2009). In this study, we analyzed P fractions extracted from the soil after harvest. The application of P fertilizer increased the total P content of the soil (Figures 5A,B) and mainly in inorganic P fractions of NaHCO3-Pi, and NaOH-Pi (Figures 2, 3). According to the structural equation modeling analysis, all the P application treatments caused the transformation of moderately labile P (NaOH-P) to labile P (Resin-P and NaHCO3-P) (Figure 4), which indicated that P application was beneficial to the mobilization of P (Chen et al., 2021; Chen et al., 2022). In this way, the Olsen-P content was significantly elevated by P fertilization (Figure 6). Our results showed that changes in soil P within a certain range were positively correlated with the amount of P fertilizer input. The content of Olsen-P in soil increased with the increase of the P application rates (Supplementary Figure S2). Our results were in line with other findings (Wang S. X. et al., 2012). In addition, some studies reported that P fertilization could also enhance the organic P in the soil due to the stimulation of microorganisms (Feng et al., 2010). However, our study did not detect significantly increased organic P content after P fertilization, which may be limited by C sources in the soil (Zhang et al., 2018).
Nevertheless, it could not be forgotten that crops also need to consume inorganic P from soil (Penuelas et al., 2013), whose root systems in soil could transfer moderately labile P from solid phase to liquid phase through abiotic or biological processes (Frossard et al., 2000), such as secretion of root exudates (Menezes-Blackburn et al., 2016; Zou et al., 2018; Chai and Schachtman, 2022) or microbial-related enzymes (Sinsabaugh et al., 2009; Nannipieri et al., 2011). Soil resin-P is a dynamic P pool and is easily absorbed by plants and utilized by soil microorganisms, which may also explain the reason why Resin-P is relatively less than other P fractions and kept relatively constant under all treatments.
Conclusion
In this study, P fertilization rates caused P surplus variability, providing solid evidence to guide the nutrition management for input and balance of P in the rice and wheat rotation system. Results of our field experiments showed that applying appropriate P fertilizer is not only important for the improvement of crop yields but also to keep a relatively higher PUE, which in turn can cut down the P accumulation in soil and alleviate the risk of P pollution in the ecosystem. Nevertheless, our research also proved that combining organic fertilizer with reducing P fertilizer can ensure crop yield and enhance the PUE of rice and wheat. Thus, our findings provided a basis for formulating efficient and reasonable P fertilizer optimization methods for the rice–wheat rotation system.
Data Availability Statement
The original contributions presented in the study are included in the article/Supplementary Material; and further inquiries can be directed to the corresponding authors.
Author Contributions
LX: Conceptualization, data curation, investigation, methodology, and writing—original draft. GC: Conceptualization, data curation, formal analysis, investigation, and writing. HW: Investigation, methodology, formal analysis, and writing—editing. YL conducted the field experiment. CL conducted the field experiment. LC: Software. YZ: Project leader and writing—review and editing. XX: Resources and writing—review and editing. WW: Review and editing.
Funding
This work was sponsored by the National Key Research and Development Program of China (2021YFF1000404 and 2017YFD0200206); the Natural Science Foundation of Anhui Province, China (1608085MC59; 2008085QD181); the Major science and technology projects of Anhui Province (201903a06020023); the Key University Science Research Project of Anhui Province (KJ 2019A0819); and the Nonprofit Technology Application Research on Linkage Project of Anhui Province (1604f0704046).
Conflict of Interest
The authors declare that the research was conducted in the absence of any commercial or financial relationships that could be construed as a potential conflict of interest.
Publisher’s Note
All claims expressed in this article are solely those of the authors and do not necessarily represent those of their affiliated organizations, or those of the publisher, the editors, and the reviewers. Any product that may be evaluated in this article, or claim that may be made by its manufacturer, is not guaranteed or endorsed by the publisher.
Supplementary Material
The Supplementary Material for this article can be found online at: https://www.frontiersin.org/articles/10.3389/fenvs.2022.932833/full#supplementary-material
References
Alewell, C., Ringeval, B., Ballabio, C., Robinson, D. A., Panagos, P., and Borrelli, P. (2020). Global Phosphorus Shortage Will be Aggravated by Soil Erosion. Nat. Commun. 11, 4546. doi:10.1038/s41467-020-18326-7
Ayaga, G., Todd, A., and Brookes, P. C. (2006). Enhanced Biological Cycling of Phosphorus Increases its Availability to Crops in Low-Input Sub-Saharan Farming Systems. Soil Biol. Biochem. 38, 81–90. doi:10.1016/j.soilbio.2005.04.019
Chai, Y. N., and Schachtman, D. P. (2022). Root Exudates Impact Plant Performance under Abiotic Stress. Trends Plant Sci. 27, 80–91. doi:10.1016/j.tplants.2021.08.003
Chen, G.-L., Xiao, L., Xia, Q.-L., Wang, Y., Yuan, J.-H., Chen, H., et al. (2021). Characterization of Different Phosphorus Forms in Flooded and Upland Paddy Soils Incubated with Various Manures. ACS Omega 6, 3259–3266. doi:10.1021/acsomega.0c05748
Chen, G., Yuan, J., Chen, H., Zhao, X., Wang, S., Zhu, Y., et al. (2022). Animal Manures Promoted Soil Phosphorus Transformation via Affecting Soil Microbial Community in Paddy Soil. Sci. Total Environ. 831, 154917. doi:10.1016/j.scitotenv.2022.154917
Chen, X., Cui, Z., Fan, M., Vitousek, P., Zhao, M., Ma, W., et al. (2014). Producing More Grain with Lower Environmental Costs. Nature 514, 486–489. doi:10.1038/nature13609
Clark, C. M., and Tilman, D. (2008). Loss of Plant Species after Chronic Low-Level Nitrogen Deposition to Prairie Grasslands. Nature 451, 712–715. doi:10.1038/nature06503
Cui, Z., Zhang, H., Chen, X., Zhang, C., Ma, W., Huang, C., et al. (2018). Pursuing Sustainable Productivity with Millions of Smallholder Farmers. Nature 555, 363–366. doi:10.1038/nature25785
Ding, J. W., Ma, Y. H., Hu, H. X., Tian, Y. F., Li, D., Fang, F., et al. (2013). Effects of Straw Application and Fertilizer Application Reduction on the Double Cropping Rice Output and Soil Enzyme Activity. Agro-Environ. Dev. 30, 72–77. doi:10.3969/j.issn.1005-4944.2013.04.014
Feng, Y. H., Zhang, Y. Z., and Huang, Y. X. (2010). Effects of Phosphatezation on Organic Phosphorus Fractions and Their Seasonal Variations and Bioavailabilities of Paddy Soils in Hunan Province. Plant Nutr. Fertil. 16, 634–641.
Frossard, E., Condron, L. M., Oberson, A., Sinaj, S., and Fardeau, J. C. (2000). Processes Governing Phosphorus Availability in Temperate Soils. J. Environ. Qual. 29, 15–23. doi:10.2134/jeq2000.00472425002900010003x
Gao, J., Zhang, S. X., Xu, M. G., Huang, S. M., and Yang, X. Y. (2009). Phosphorus Use Efficiency of Wheat on Three Typical Farmland Soils under Long-Term Fertilization. Appl. Ecol. 20, 2142–2148. CNKI:SUN:YYSB.0.2009-09-016.
Gong, J. L., Zhang, H. C., Li, J., Cang, Y., Dai, Q. G., and Huo, Z. Y. (2011). Effects of Phosphorus Levels on Grain Yield and Quality of Super Rice Nanjing 44. Chin. J. Rice. Sci. 25, 447–451. doi:10.3969/j.issn.1001-7216.2011.04.017
Guo, J. H., Liu, X. J., Zhang, Y., Shen, J. L., Han, W. X., Zhang, W. F., et al. (2010). Significant Acidification in Major Chinese Croplands. Science 327, 1008–1010. doi:10.1126/science.1182570
Hedley, M. J., and Stewart, J. W. B. (1982). Method to Measure Microbial Phosphate in Soils. Soil Biol. Biochem. 14, 377–385. doi:10.1016/0038-0717(82)90009-8
Holford, I. C. R. (1997). Soil Phosphorus: Its Measurement, and its Uptake by Plants. Soil Res. 35, 227–239. doi:10.1071/S96047
Hong, J., Zhang, H., Zhang, W., Yue, X., and Lei, Q. (2015). Research Progress on Cropland Phosphorus Balance in China. J. Eco-Agr. 23, 1–8. CNKI:SUN:ZGTN.0.2015-01-001.
Hou, E., Chen, C., Kuang, Y., Zhang, Y., Heenan, M., and Wen, D. (2016). A Structural Equation Model Analysis of Phosphorus Transformations in Global Unfertilized and Uncultivated Soils. Glob. Biogeochem. Cycles 30, 1300–1309. doi:10.1002/2016GB005371
Huang, J., Gao, J. S., Zhang, Y. Z., Qin, D. Z., and Xu, M. G. (2013). Change Characteristics of Rice Yield and Soil Organic Matter and Nitrogen Contents under Various Long-Term Fertilization Regimes. J. Appl. Ecol. 24, 1889–1894. doi:10.13287/j.1001-9332.2013.0412
Kaur, T., Brar, B. S., and Dhillon, N. S. (2008). Soil Organic Matter Dynamics as Affected by Long-Term Use of Organic and Inorganic Fertilizers under Maize-Wheat Cropping System. Nutr. Cycl. Agroecosyst. 81, 59–69. doi:10.1007/s10705-007-9152-0
Le, C., Zha, Y., Li, Y., Sun, D., Sun, D., Lu, H., et al. (2010). Eutrophication of Lake Waters in China: Cost, Causes, and Control. Environ. Manag. 45, 662–668. doi:10.1007/s00267-010-9440-3
Li, Q., Hou, Y. P., Gao, J., Chu, Z. Q., Kong, L. L., and Xu, X. P. (2015). Effect of Different Phosphorus Application on Dry Matter Accumulation, Phosphorus Uptake and Distribution and Yield of Rice. Jilin Agr. Sci. 40, 37–41. CNKI:SUN:JLNK.0.2015-03-010. doi:10.16423/j.cnki.1003-8701.2015.03.010
Luo, G., Sun, B., Li, L., Li, M., Liu, M., Zhu, Y., et al. (2019). Understanding How Long-Term Organic Amendments Increase Soil Phosphatase Activities: Insight into PhoD- and PhoC-Harboring Functional Microbial Populations. Soil Biol. Biochem. 139, 107632. doi:10.1016/j.soilbio.2019.107632
Menezes-Blackburn, D., Paredes, C., Zhang, H., Giles, C. D., Darch, T., Stutter, M., et al. (2016). Organic Acids Regulation of Chemical-Microbial Phosphorus Transformations in Soils. Environ. Sci. Technol. 50, 11521–11531. doi:10.1021/acs.est.6b03017
Murphy, J., and Riley, J. P. (1962). A Modified Single Solution Method for the Determination of Phosphate in Natural Waters. Anal. Chim. Acta 27, 31–36. doi:10.1016/s0003-2670(00)88444-5
Muthayya, S., Sugimoto, J. D., Montgomery, S., and Maberly, G. F. (2014). An Overview of Global Rice Production, Supply, Trade, and Consumption. Ann. N.Y. Acad. Sci. 1324, 7–14. doi:10.1111/nyas.12540
Nannipieri, P., Giagnoni, L., Landi, L., and Renella, G. (2011). “Role of Phosphatase Enzymes in Soil,” in Phosphrus in Action. Editors E. K. Bunemann, A. Oberson, and E. Frossard (Dordrecht London New York: Springer Heidelberg), 215–243. doi:10.1007/978-3-642-15271-9_9
Olsen, S. R., Cole, C. V., Watanabe, F. S., and Dean, L. A. C. (1954). Estimation of Available P in Soil by Extraction with Sodium Bicarbonate. Champaign: USDA Circular, 939.
Peng, Y. X., Wang, K. R., and Xie, X. L. (2007). Effects of Rice Straw Incorporation on Soil Nitrogen Supply and Rice Yield under Different Irrigation and Fertilizer Regimes. Soil Fertilizer. Sci. China. 04, 40–43. doi:10.11838/sfsc.20070409
Peñuelas, J., Poulter, B., Sardans, J., Ciais, P., van der Velde, M., Bopp, L., et al. (2013). Human-Induced Nitrogen-Phosphorus Imbalances Alter Natural and Managed Ecosystems across the Globe. Nat. Commun. 4, 2934. doi:10.1038/ncomms3934
Powers, S. M., Bruulsema, T. W., Burt, T. P., Chan, N. I., Elser, J. J., Haygarth, P. M., et al. (2016). Long-term Accumulation and Transport of Anthropogenic Phosphorus in Three River Basins. Nat. Geosci. 9, 353–356. doi:10.1038/ngeo2693
Sinsabaugh, R. L., Hill, B. H., and Follstad Shah, J. J. (2009). Ecoenzymatic Stoichiometry of Microbial Organic Nutrient Acquisition in Soil and Sediment. Nature 462, 795–798. doi:10.1038/nature08632
Song, S., Fu, L. D., and Zhan, G. S. (2013). Effect of Phosphorus Fertilizer Amounts on Yield of Rice. North Rice 43, 20–22. doi:10.3969/j.issn.1673-6737.2013.06.005
Thangavel, P., and Sridevi, G. (2017). “Soil Security: A Key Role for Sustainable Food Productivity,” in Sustainable Agriculture towards Food Security. Editor A. Dhanaraja (Berlin, Germany: Springer Nature Singapore Pte Ltd), 309–326.
Tiessen, H., and Moir, J. (1993). “Characterization of Available P by Sequential Extraction,” in Soil Sampling and Methods of Analysis. Editor M. R. Carter (Boca Raton, FL: Lewis Publishers), 75–86.
Wang, D. Z., Guo, X. S., Liu, F., and He, C. L. (2009). Effects of Long-Term Fertilization on Inorganic Phosphorus Fractions in Lime Concretion Soil. Plant Nutr. Fertil. 15, 601–606. doi:10.11674/zwyf.2009.0316
Wang, S. Q., Zhao, X., Xing, G. X., Gu, Y. C., Shi, T. J., and Yang, L. Z. (2012b). Phosphorus Pool in Paddy Soil and Scientific Fertilization in Typical Areas of Taihu Lake Watershed. Soils 44, 158–162. doi:10.3969/j.issn.0253-9829.2012.01.026
Wang, S. X., Liu, G. R., Luo, Q. Q., Liu, X. M., and Qi, L. X. (2012a). Research Advance in Phosphorous Accumulation and its Loss Potential in Paddy Soils. Acta Agric. jiangxi. 70, 98–103. doi:10.1002/1097-0142(19921001)70:7
Wang, Y., Yuan, J. H., Chen, H., Chen, G. L., Zhao, H. M., Xu, L. Y., et al. (2022). Soil Phosphorus Pool Evolution and Environmental Risk Prediction of Paddy Soil in the Taihu Lake Region. Acta Pedol. Sin. doi:10.11766/trxb202012160696
Xavier, F. A., Oliveira, T. S., Andrade, F. V., and Mendona, E. S. (2009). Phosphorus Fractionation in a Sandy Soil under Organic Agriculture in Northeastern Brazil. Geoderma 151, 417–423. doi:10.1016/j.geoderma.2009.05.007
Ye, G., Lin, Y., Kuzyakov, Y., Liu, D., and Ding, W. (2019). Manure over Crop Residues Increases Soil Organic Matter but Decreases Microbial Necromass Relative Contribution in Upland Ultisols: Results of a 27-Year Field Experiment. Soil. Biol. biochem. 134, 15–24. doi:10.1016/j.soilbio.2019.03.018
Zhang, L., Ding, X., Peng, Y., George, T. S., and Feng, G. (2018). Closing the Loop on Phosphorus Loss from Intensive Agricultural Soil: a Microbial Immobilization Solution? Front. Microbiol. 9, 104. doi:10.3389/fmicb.2018.00104
Zhang, S. M., Gu, K. J., Fan, P. S., Xu, B., Zhang, C. H., and Gu, D. X. (2017). Rice Straw Returning and Seeding Patterns: Effects on Wheat Seedling Emergence and Grain Yield in Field Experiment. Agr. Sci. tech-iran. 18, 2357–2361. doi:10.16175/j.cnki.1009-4229.2017.12.037
Zhao, X., Xie, Y. X., Xiong, Z. Q., Yan, X. Y., Xing, G. X., and Zhu, Z. L. (2009). Nitrogen Fate and Environmental Consequence in Paddy Soil under Rice-Wheat Rotation in the Taihu Lake Region, China. Plant Soil 319, 225–234. doi:10.1007/s11104-008-9865-0
Zou, X. H., Wei, D., Wu, P. F., Zhang, Y., Hu, Y. N., Chen, S. T., et al. (2018). Strategies of Organic Acid Production and Exudation in Response to Low-Phosphorus Stress in Chinese Fir Genotypes Differing in Phosphorus-Use Efficiencies. Trees-Struct. Funct. 32, 897–912. doi:10.1007/s00468-018-1683-2
Keywords: rice–wheat rotation, P fertilizer, P surplus, P use efficiency, soil P fractions
Citation: Xiao L, Chen G, Wang H, Li Y, Li C, Cheng L, Wu W, Xiao X and Zhu Y (2022) Improvement of P Use Efficiency and P Balance of Rice–Wheat Rotation System According to the Long-Term Field Experiments in the Taihu Lake Basin. Front. Environ. Sci. 10:932833. doi: 10.3389/fenvs.2022.932833
Received: 30 April 2022; Accepted: 09 June 2022;
Published: 14 July 2022.
Edited by:
Gu Feng, China Agricultural University, ChinaReviewed by:
Yinghua Duan, Institute of Agricultural Resources and Regional Planning (CAAS), ChinaJun Wang, Shandong Agricultural University, China
Copyright © 2022 Xiao, Chen, Wang, Li, Li, Cheng, Wu, Xiao and Zhu. This is an open-access article distributed under the terms of the Creative Commons Attribution License (CC BY). The use, distribution or reproduction in other forums is permitted, provided the original author(s) and the copyright owner(s) are credited and that the original publication in this journal is cited, in accordance with accepted academic practice. No use, distribution or reproduction is permitted which does not comply with these terms.
*Correspondence: Xin Xiao, xiaoxin8088@126.com; Yiyong Zhu, yiyong1973@njau.edu.cn
†These authors have contributed equally to this work