Exploring the Role of Shared Mobility in Alleviating Private Car Dependence and On-Road Carbon Emissions in the Context of COVID-19
 Xiaoyu Zhang
 Chunfu Shao1*
  Shichen Huang
- 1Key Laboratory of Transport Industry of Big Data Application Technologies for Comprehensive Transport, Beijing Jiaotong University, Beijing, China
- 2Department of Mechanical Engineering, Laval University, Québec, QC, Canada
- 3Tangshan Key Laboratory of Air and Ground Smart Transportation, North China University of Science and Technology, Qinhuangdao, China
Shared mobility is becoming increasingly popular worldwide, and travelers show more complex choice preferences during the post-pandemic era. This study explored the role of shared mobility in the context of coronavirus disease (COVID-19) by comparing the travel mode choice behavior with and without shared mobility. Considering the shared mobility services of ride-hailing, ride-sharing, car-sharing, and bike-sharing, the stated preference survey was designed, and the mixed logit model with panel data was applied. The results show that if shared mobility is absent, approximately 50% of motorized mobility users and 84.62% of bike-sharing adopters will switch to using private car and public transport, respectively. The perceived pandemic severity positively affects the usage of car-sharing and bike-sharing, while it negatively affects the ride-sharing usage. Under different pandemic severity levels, the average probabilities of private car choice with and without shared mobility are 38.70 and 57.77%, respectively; thus, shared mobility would alleviate the dependence on private car in post-pandemic future. It also helps to decrease the on-road carbon emissions when the pandemic severity is lower than 53. These findings suggest policymakers to maintain the shared mobility ridership and simultaneously contain the pandemic. Additionally, pricing discount and safety enhancement are more effective than reducing detour time to protect ride-sharing against COVID-19.
Introduction
The development of the global positioning system and smartphone applications has promoted a rapid expansion of digital technology-enabled shared mobility services (Alemi et al., 2019). Due to the advantages of on-demand response, door-to-door access, and great comfort, the new mobility has operated in over 760 cities worldwide (Li et al., 2019). According to the China State Information Center (2020), its trading volume in China reached 270 billion CNY (equal to 43 billion USD) by 2019, with a growth rate of 34.4% within 2 years. At present, different forms of shared mobility services have blossomed and can be roughly categorized into ride-hailing, ride-sharing, car-sharing, and bike-sharing (Khazbak et al., 2020). The introduction and extensive deployment of these services have transformed the travel demand and supply, and have thus complicated people’s travel mode choice behavior.
Since December 2019, the coronavirus disease (COVID-19) has spread globally and has become the most serious health emergency. The World Health Organization (2022) declared that the number of confirmed cases exceeded 481 million, with a total of 6 million deaths by March 2022. The urban human mobility is changing due to the perception of pandemic severity and the rise of telecommuting. Public transport faces an unprecedented decline of passenger demand during the pandemic (Hu and Chen, 2021). Li and Zhang (2020) pointed out that the transit ridership in Beijing, China, in March 2020 was 70% lower than that the year before. In comparison, the usage of private car is surging. Luan et al. (2021) proved that the mode split of private car occupied 58.11% and 82.55% for trips under 6 km and between 6 and 12 km, respectively. Das et al. (2021) found that 80% of car commuters would retain their car-using behavior.
For shared mobility—an emerging travel mode category between public and personal transport—travelers could show more complex choice preferences in the post-pandemic era. The usage of shared mobility was negatively affected by concerns regarding the contagion risk and the apprehension toward contact with shared surfaces (Morshed et al., 2021; Loa et al., 2022). While on the other hand, shared mobility could provide non-car owners with more protective spaces while traveling due to its in-vehicle crowding avoidance and lower close contact. Therefore, it could play an important role in the post-pandemic era (Song et al., 2022; Wang W. et al., 2022; Yu et al., 2022).
Previous studies explored the role of shared mobility from various aspects. For example, Shen et al. (2020) proved that ride-hailing could increase vehicle kilometers traveled and on-road vehicular emissions. Qian et al. (2020) reported that the rise of ride-hailing would decrease the average citywide speed by 22.5% and would be one of the main contributing factors to traffic congestion. Liu et al. (2019) found that the fuel savings of each ride-sharing trip could occupy 47% of fuel consumed when driving alone. Ikezoe et al. (2020) confirmed that car-sharing could not stop travelers from owning a car. However, the evidence on this issue is limited for the COVID-19 context. In addition, these studies mainly focus on certain travel mode of shared mobility. The comprehensive analysis of diverse mobility services is beneficial in excavating more detailed and personalized travel demand.
Considering the shared mobility services of ride-hailing, ride-sharing, car-sharing, and bike-sharing, this study applied the mixed logit model to examine the stated preference (SP) survey data collected from Beijing, China. Mixed logit model, also called random parameters logit model, is a prominent technique for modeling discrete outcome problems (McFadden and Train, 2000; Washington et al., 2011). It has been proposed and adopted in many transportation studies, such as the analysis of travel mode choice (Zhao et al., 2020), travel route choice (González Ramírez et al., 2021), and regional destination choice (Camacho-Murillo et al., 2021). The model obviates the limitations of conditional logit model by allowing the heterogeneity in preferences among decision makers and avoiding the property of independence from irrelevant alternatives (McFadden, 1974). It can also deal with the correlation in repeated choices and adapt to the panel analysis (Chen et al., 2018). Therefore, the mixed logit model is suitable for the travel behavior analysis in this study.
The contributions of this study are threefold: 1) It discusses the decision mechanism of travel mode choice behavior with and without differentiated shared mobility services; 2) it investigates the role of shared mobility in alleviating the private car dependence and on-road carbon emissions in the context of COVID-19; and 3) it will inform the development of shared mobility and provide theoretical support for the traffic structure optimization in a post-pandemic future.
Methodology
Survey
Beijing, the capital of China, is a typical city with the rapid expansion and fierce competition of various shared mobility services for more than 10 years (Chen, 2021). To collect the mode choice data, we designed a SP survey base on Beijing to enrich the observed context.
The survey contained two parts, and all questions were closed. The first part involved the socio-demographic information, such as sex, age, and car ownership. In addition, respondents were asked to indicate how they perceive the pandemic severity using a scale from 0 to 100, in which “0” stands for “extremely not severe” and “100” for “extremely severe.” They also needed to give their perception scores for the safety of each shared mobility service.
The second part investigated travelers’ mode choices with and without shared mobility in the context of COVID-19. Seven modes were considered, including three conventional modes (e.g., public transport, private car, and taxi) and four shared mobility services (e.g., ride-hailing, ride-sharing, car-sharing, and bike-sharing). Hypothetical SP scenarios were presented by introducing the combinations of levels for influencing factors. The evidence of selecting factors is as follows:
• Trip distance: This variable was proved to have high predictive power for the shared mobility usage (Taiebat et al., 2022); thus, it was selected as the context variable in the SP survey. The five levels of 3, 10, 15, 20, and 30 km were considered to cover different trip distances.
• Waiting time: This factor was introduced in most existing SP surveys (Zheng et al., 2016; Choudhury et al., 2018). According to the timetable in Shang et al. (2019), a waiting time of 8–40 min for public transport was appropriate. Furthermore, a waiting time of 10–30 min for taxi and 5–25 min for ride-hailing and ride-sharing are consistent with the statistical results in DIDI (2016).
• Number of transfers: This variable is a critical determinant of public transport usage (Marra et al., 2022). The categorical values of 0, 1, 2, and 3 are given in accordance with the practical transferring situation in Beijing.
• Parking cost: Previous studies examined the effects of this variable frequently (Liao et al., 2020; Wang Y. et al., 2022). In this paper, three levels of 5, 12, and 20 CNY were determined according to the parking rates established by Beijing Municipal Commission of Development and Reform (2018).
• Detour time: Detour was specified as an influencing factor of travelers’ willingness to embrace ride-sharing (König and Grippenkoven, 2020). Li et al. (2019) reported that most shared rides made detours <30 min, and the average detour time was 10 min. Therefore, the levels of 10 and 30 min were involved.
• Access distance: This factor was proved to negatively affect the preference for car-sharing (Jin et al., 2020). According to the car-sharing site distribution, the levels of 700, 1, 200, and 2,000 m were considered.
The levels for the influencing factors are listed in Table 1.
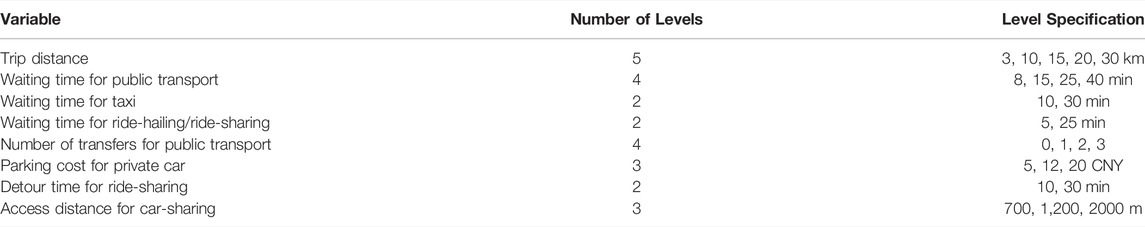
TABLE 1. Levels for the SP survey.
Using orthogonal design, a total of 36 choice scenarios were generated. The travel time associated with the trip distance was added to each scenario. To further distinguish differentiated shared mobility services, their travel cost was also considered. Under each observed scenario, respondents select their preferred alternatives with and without shared mobility, and the corresponding choice sets contain seven and three travel modes respectively, as shown in Figure 1.
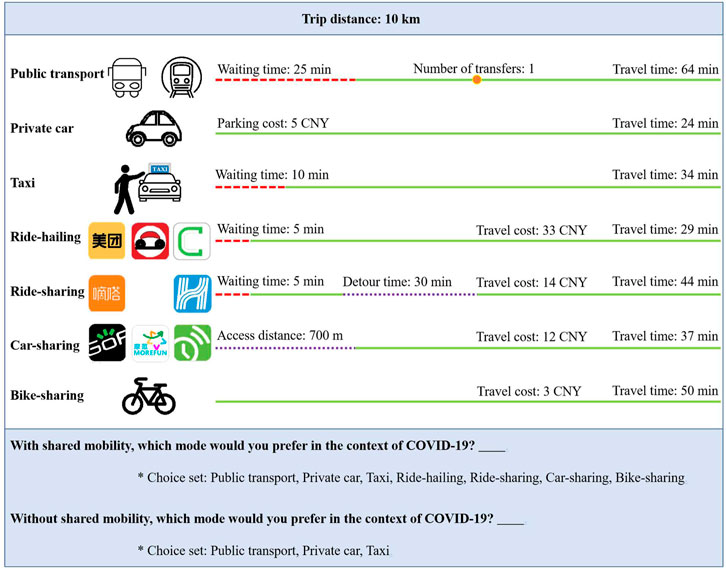
FIGURE 1. Example of the SP survey.
With the assistance of a professional internet-based survey company, the respondents with experience in adopting the four shared mobility services were sampled from the permanent residents in Beijing. The reason for online investigation was to avoid the close contact with respondents and decrease the risk of transmission during COVID-19. The survey was conducted for nearly 1 month in December 2020. Each respondent was randomly given three out of the 36 SP scenarios. In the questionnaire collection process, we checked the validation based on the the following two principles: 1) The assigned scenarios were completely answered; and 2) the non-car owners did not choose private car as their preferred mode. A total of 1,007 valid questionnaires were collected in the end, and the number of mode choice data with and without shared mobility were both 3,021. Ethical approval from institutional review boards was not required because this study constituted empirical analysis instead of human research, and no confidential data were recorded.
Model Specification
Discrete choice models describe decision makers’ choice among alternatives, which must be mutually exclusive, exhaustive, and finite. In this study, the alternatives were chosen repeatedly; thus, the choice tastes vary over people and are constant over choice scenarios for each person. Therefore, the mixed logit model based on panel data was employed to formulate the travel mode choice behavior with and without shared mobility (Train, 2003). The two model structures are shown in Figures 2A, B.
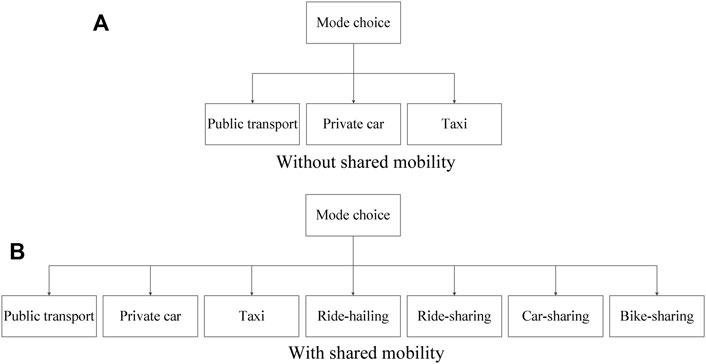
FIGURE 2. Mixed logit model structure: (A) without shared mobility, and (B) with shared mobility.
The formulation process includes three steps:
• Utility function construction.
According to the assumption of utility-maximizing behavior by the decision maker, the travel mode with the maximum utility will be selected. In the mixed logit model, the utility
where
The explanatory variables used in modeling came from the influencing factors investigated in the SP survey (see Section 2.1). Since travel cost was closely associated with travel time and trip distance (Shen et al., 2020), the trip distance was excluded from the two models. For the model without shared mobility, the explanatory variables include travel time, waiting time, number of transfers for public transport, parking cost for private car, and perception of COVID-19 severity. For the model with shared mobility, the additional variables include travel cost and perceived safety of shared mobility, detour time for ride-sharing, and access distance for car-sharing.
• Choice probability calculation.
Suppose that each traveler has a total
Different from the standard logit model, the random coefficient
• Parameter estimation.
The mixed logit probability
Insert the simulated probability into the log likelihood function, then the simulated log likelihood is
where
Results
Socio-demographic Results
The socio-demographic characteristics of 1,007 participants are summarized in Table 2. Most respondents were aged 18–39. Older people were fewer in our sample, because they were not familiar with the internet-based shared mobility applications. More than 60% of the respondents owned their own vehicles.
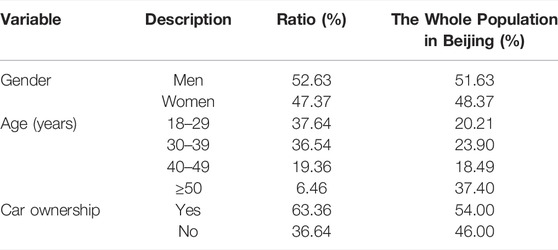
TABLE 2. Summary statistics of respondents.
The distribution of perceived COVID-19 severity and safety of shared mobility is listed in Table 3. Almost 50% of the participants perceived the pandemic severity as exceeding 80. Ride-hailing is perceived as the safest service, while ride-sharing is perceived as having the minimum safety. Although the average perceived safety of car-sharing is only 27.11, 18.87% of the respondents feel it safe enough. Bike-sharing is generally perceived as a safe mode, while its safety is considered to be <20 by 22.05% of the sample.
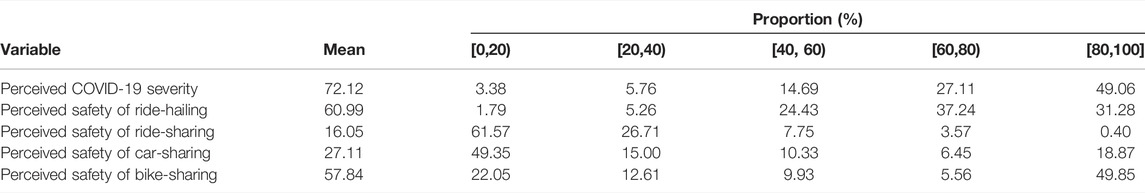
TABLE 3. Statistics of respondents’ perceived COVID-19 severity and perceived safety of each shared mobility service.
To assess the quality of the questionnaire, we conduct the psychometric analysis (specifically reliability and validity) on the five perception related questions. The Cronbach’s alpha of these questions is 0.698, higher than 0.6; thus, the scale has acceptable internal consistency reliability (Cronbach, 1951). In addition, the KMO value is 0.725, and the significant level of the Bartlett sphericity test is 0.000, indicating the scale has good validity (Hair et al., 2010).
Mode Choice Analysis
The travel mode choices are shown in Figure 3. The mode split of shared mobility is 37.54% and is specifically sorted as ride-hailing (19.53%), ride-sharing (7.12%), car-sharing (7.02%), and bike-sharing (3.87%), in that order. Private car is mostly favored (48.59%), which is consistent with the statistical results by Jiang et al. (2020). If shared mobility is absent, the popularity of private car increases by 17.45%. Furthermore, the proportion of public transport and taxi rise by 9.9 and 10.19%, respectively.
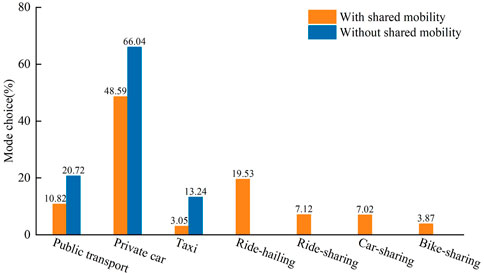
FIGURE 3. Travel mode choices with and without shared mobility.
Table 4 summarizes the travel modal shift to conventional modes if shared mobility is absent. In addition, 58.96% of car-sharing users switch their choices to private car, followed by ride-sharing (49.30%) and ride-hailing (47.80%). Taxi is more preferred than public transport for motorized shared mobility adopters. This statistical result is inconsistent with the pre-COVID-19 studies (Shen et al., 2020; Yang H. et al., 2022), in which more than 50% of respondents select public transport as the alternative mode. In addition, 84.62% of bike-sharing users switch to public transport; thus, bike-sharing would contribute to decreasing the infection risk for those concerned regarding travel cost.
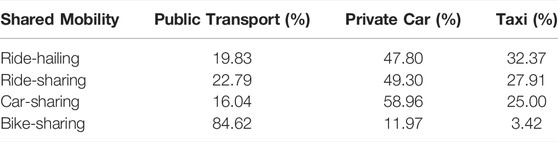
TABLE 4. Travel modal shift from shared mobility to conventional modes.
Estimation Results
We estimate the parameters in mixed logit models with and without shared mobility through simulation methods, and the estimation results are shown in Table 5. Assuming that distributions of random coefficients are normal, the probability is approximated using Monte Carlo integration with Halton draws of 600. The goodness-of-fit measures
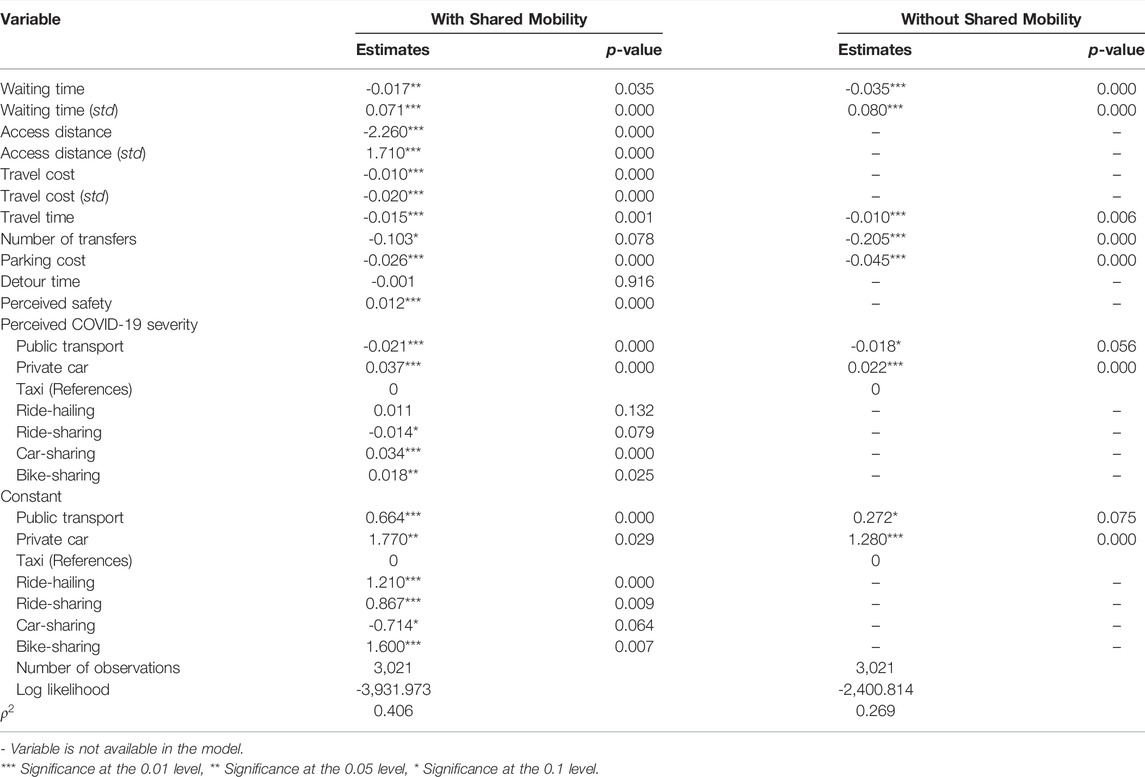
TABLE 5. Mixed logit model estimation results.
For the model with shared mobility, the random coefficients exist in waiting time, access distance, and travel cost. The mean and standard deviation of the random parameters are all significant, which means the estimation results explain the individuals’ travel mode choice behavior properly. The estimated coefficients of travel time, waiting time, travel cost, and perceived safety are statistically significant and have the expected signs. The number of transfers for public transport, parking cost for private car, and access distance for car-sharing have negative effects on the preference for corresponding modes. This is consistent with the results of existing studies (Yan et al., 2019; Jin et al., 2020; Fang et al., 2021).
The coefficient of detour time for ride-sharing is insignificant, which is inconsistent with the previous studies (König and Grippenkoven, 2020; Ke et al., 2021). The reason may be that people would mind sharing in-vehicle spaces rather than the detour time in the context of COVID-19.
With the increase of perceived pandemic severity, private car is more favored, and public transport is less favored. Furthermore, the pandemic severity positively affects the usage of car-sharing and bike-sharing, and negatively affects the usage of ride-sharing. In terms of the mode specific constants, we find that private car has the largest positive constant. Therefore, it is predicted to be most preferred without the prior knowledge of the market. This result is consistent with the surveyed mode split in Figure 3. Among the shared mobility services, bike-sharing is the most popular, while car-sharing is less popular than the base alternative of taxi.
The model without shared mobility only has one random coefficient of waiting time. The variables related to shared mobility use do not exist in the model. The remaining variables have similar effects on the travel mode choice as the model with shared mobility.
Discussion
To evaluate the role of shared mobility in the context of COVID-19, we predict the mode split of private car and on-road carbon emissions using the two mixed logit models.
The mode split prediction is to calculate the choice probability of each travel mode for any given value of explanatory variables based on the estimated parameters. In this section, we predict the mode split of private car in response to the perceived COVID-19 severity. As presented in Figure 4, the average probabilities of private car choice with and without shared mobility are 38.70% and 57.77%, respectively. Even if the pandemic is at its worst, the mode split of the former is 20.78% lower than that of the latter. According to Awad-Núñez et al. (2021), the preference in extraordinary periods could reestablish people’s travel habits. In a post-pandemic future, shared mobility would be beneficial in relieving the private car dependence.
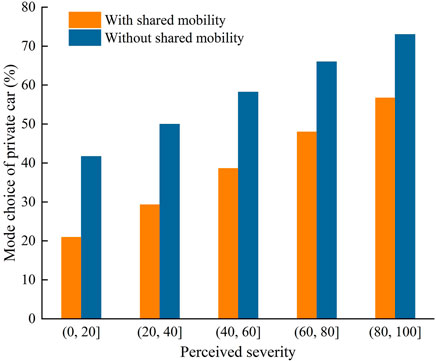
FIGURE 4. Predicted mode split of private car in response to the perceived COVID-19 severity.
The on-road carbon emissions generated by surveyed respondents are calculated by multiplying the emission factors by the total travel distance of corresponding mode. The emission factors of buses, cars, and electric vehicles are adopted as 35.0 g/(person·km), 131.7 g/(person·km), and 80.3 g/(person·km), respectively (Yang et al., 2017a; Yang et al., 2017b). Assuming that the occupancy of ride-sharing is two riders, the on-road carbon emissions with and without shared mobility are estimated and reported in Table 6.
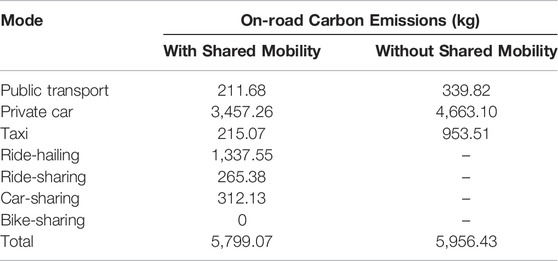
TABLE 6. On-road carbon emissions with and without shared mobility in the context of COVID-19.
Total on-road carbon emissions with shared mobility are 5,799.07 kg, less than those without it. Furthermore, motorized vehicles produce fewer carbon emissions while introducing shared mobility. This is because of the following: 1) Affected by new services’ competition, private car and taxi are less used; 2) ride-sharing mitigates emissions by improving occupancy; 3) the car-sharing service adopts electric vehicles and thus is eco-friendlier; and 4) bike-sharing is the main replacement of public transport and no emission is created. This result is inconsistent with the pre-COVID-19 studies (Shen et al., 2020; Yang H. et al., 2022), in which shared mobility increases the on-road vehicular emissions because it replaces many public transport trips rather than private car-based trips. In addition, among shared mobility services, only ride-hailing is considered in these studies. In our study, the whole shared mobility contributes 33.02% to the total carbon emissions.
In addition, we investigate the total carbon emissions in response to different pandemic severity levels. As shown in Figure 5, the on-road carbon emissions would increase with the pandemic severity. The emissions with shared mobility are always lower than those without shared mobility, whereas the two would be closer when the severity is >53. Therefore, to reduce the carbon emissions, the pandemic prevention and the maintenance of shared mobility ridership need to be carried out simultaneously.
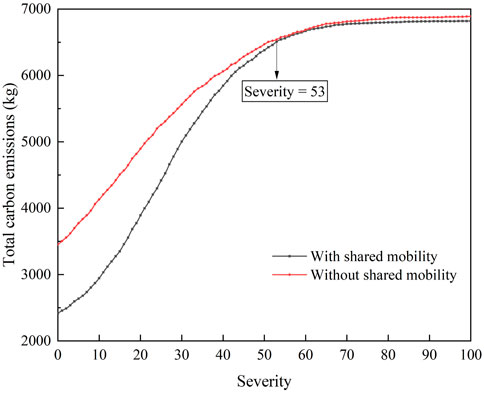
FIGURE 5. On-road carbon emissions in response to different pandemic severity levels.
Conclusion
This study explored the role of shared mobility in the context of COVID-19. Considering shared mobility services (e.g., ride-hailing, ride-sharing, car-sharing, and bike-sharing) and conventional modes, the SP survey was designed and conducted in Beijing, China. Mixed logit models were specified and estimated to compare the travel mode choice behavior with and without shared mobility.
The main findings are as follows:
1. The perceived safety of shared mobility services is in the order of ride-hailing > bike-sharing > car-sharing > ride-sharing, and the mode split is in the order of ride-hailing > ride-sharing > car-sharing > bike-sharing.
2. If shared mobility is absent, approximately 50% of the motorized shared mobility adopters switch to using private car, whereas 84.62% of bike-sharing users select public transport as the alternative mode.
3. The estimates show that the coefficient of detour time for ride-sharing is insignificant, which may be because people would mind sharing in-vehicle spaces rather than the detour time in the context of COVID-19. The perceived pandemic severity positively affects the usage of car-sharing and bike-sharing, while it negatively affects the usage of ride-sharing.
4. Under different pandemic severity levels, the average probabilities of private car choice with and without shared mobility are 38.70 and 57.77%, respectively. Therefore, shared mobility would contribute to relieving the private car dependence in a post-pandemic future. It also helps to decrease the on-road carbon emissions when the pandemic severity is <53.
To sum up, it is necessary to maintain the ridership of shared mobility owing to its vital role in the context of COVID-19. However, the role of shared mobility would be limited with the pandemic severity increases, thus the policymakers need to contain the pandemic at the same time. In addition, pricing discount and safety enhancement would be more effective than reducing detour time to protect the environmental ride-sharing service against COVID-19.
For future research, twofold directions were suggested. First, more variables could be figured out and applied in the mode choice modeling by combining the massive order data and the survey data of shared mobility services. Second, we will investigate the travel behavior in different stages of pandemic development and then provide a more detailed analysis on the role of shared mobility.
Data Availability Statement
The data used in the research are included in the Survey section, further inquiries can be directed to the corresponding author.
Ethics Statement
Ethical approval from institutional review boards was not required because this study constituted empirical analysis instead of human research, and no confidential data were recorded.
Author Contributions
Conceptualization: XZ and CS; data collection: XZ and CS; analysis: XZ and BW; writing original manuscript: XZ; visualization: SH, XM, and YZ; editing: CS and BW; funding: CS.
Funding
This study was sponsored by the National Natural Science Foundation of China (No. 52072025). Bourses de recherche postdoctorale, Fonds de recherches du Québec – Nature et Technologie (FRQNT) (No. 322727).
Conflict of Interest
The authors declare that the research was conducted in the absence of any commercial or financial relationships that could be construed as a potential conflict of interest.
Publisher’s Note
All claims expressed in this article are solely those of the authors and do not necessarily represent those of their affiliated organizations, or those of the publisher, the editors, and the reviewers. Any product that may be evaluated in this article, or claim that may be made by its manufacturer, is not guaranteed or endorsed by the publisher.
References
Alemi, F., Circella, G., Mokhtarian, P., and Handy, S. (2019). What Drives the Use of Ridehailing in California? Ordered Probit Models of the Usage Frequency of Uber and Lyft. Transp. Res. Part C Emerg. Technol. 102, 233–248. doi:10.1016/j.trc.2018.12.016
Awad-Núñez, S., Julio, R., Moya-Gómez, B., Gomez, J., and Sastre González, J. (2021). Acceptability of Sustainable Mobility Policies under a Post-COVID-19 Scenario. Evidence from Spain. Transp. Policy 106, 205–214. doi:10.1016/j.tranpol.2021.04.010
Beijing Municipal Commission of Development and Reform (2018). Parking Charge Standard of Beijing. (in Chinese).
Camacho-Murillo, A., Gounder, R., and Richardson, S. (2021). Regional Destination Attributes that Attract Domestic Tourists: the Role of Man-Made Venues for Leisure and Recreation. Heliyon 7, e07383. doi:10.1016/j.heliyon.2021.e07383
Chen, F., Chen, S., and Ma, X. (2018). Analysis of Hourly Crash Likelihood Using Unbalanced Panel Data Mixed Logit Model and Real-Time Driving Environmental Big Data. J. Saf. Res. 65, 153–159. doi:10.1016/j.jsr.2018.02.010
Chen, X. (2021). Review of App-Based Ridesharing Mobility Research. J. Transp. Syst. Eng. Inf. Technol. 21, 77–90. doi:10.16097/j.cnki.1009-6744.2021.05.008
Choudhury, C. F., Yang, L., de Abreu e Silva, J., and Ben-Akiva, M. (2018). Modelling Preferences for Smart Modes and Services: A Case Study in Lisbon. Transp. Res. Part A Policy Pract. 115, 15–31. doi:10.1016/j.tra.2017.07.005
Cronbach, L. J. (1951). Coefficient Alpha and the Internal Structure of Tests. Psychometrika 16, 297–334. doi:10.1007/bf02310555
Das, S., Boruah, A., Banerjee, A., Raoniar, R., Nama, S., and Maurya, A. K. (2021). Impact of COVID-19: A Radical Modal Shift from Public to Private Transport Mode. Transp. Policy 109, 1–11. doi:10.1016/j.tranpol.2021.05.005
Elahi, E., Khalid, Z., Tauni, M. Z., Zhang, H., and Lirong, X. (2021). Extreme Weather Events Risk to Crop-Production and the Adaptation of Innovative Management Strategies to Mitigate the Risk: A Retrospective Survey of Rural Punjab. Pakistan: Technovation.
Elahi, E., Zhang, Z., Khalid, Z., and Xu, H. (2022). Application of an Artificial Neural Network to Optimise Energy Inputs: An Energy- and Cost-Saving Strategy for Commercial Poultry Farms. Energy 244, 123169. doi:10.1016/j.energy.2022.123169
Fang, D., Xue, Y., Cao, J., and Sun, S. (2021). Exploring Satisfaction of Choice and Captive Bus Riders: An Impact Asymmetry Analysis. Transp. Res. Part D Transp. Environ. 93, 102798. doi:10.1016/j.trd.2021.102798
González Ramírez, H., Leclercq, L., Chiabaut, N., Becarie, C., and Krug, J. (2021). Travel Time and Bounded Rationality in Travellers’ Route Choice Behaviour: A Computer Route Choice Experiment. Travel Behav. Soc. 22, 59–83. doi:10.1016/j.tbs.2020.06.011
Hair, J. F., Black, W. C., Babin, B. J., and Anderson, R. E. (2010). Multivariate Data Analysis. Pearson College Division.
Hu, S. H., and Chen, P. (2021). Who Left Riding Transit? Examining Socioeconomic Disparities in the Impact of COVID-19 on Ridership. Transp. Res. Part D Transp. Environ. 90, 102654. doi:10.1016/j.trd.2020.102654
Ikezoe, K., Kiriyama, E., and Fujimura, S. (2020). Car-sharing Intention Analysis in Japan by Comparing the Utility of Car Ownership for Car-Owners and Non-car Owners. Transp. Policy 96, 1–14. doi:10.1016/j.tranpol.2020.05.018
Jiang, N., Li, S., Cao, S. Z., Wei, J. N., Wang, B. B., Qin, N., et al. (2020). Transportation Activity Patterns of Chinese Population during the COVID-19 Epidemic. Res. Environ. Sci. 33, 1675–1682. doi:10.13198/j.issn.1001-6929.2020.06.16
Jin, F., An, K., and Yao, E. (2020). Mode Choice Analysis in Urban Transport with Shared Battery Electric Vehicles: A Stated-Preference Case Study in Beijing, China. Transp. Res. Part A Policy Pract. 133, 95–108. doi:10.1016/j.tra.2020.01.009
Ke, J., Zheng, Z., Yang, H., and Ye, J. (2021). Data-driven Analysis on Matching Probability, Routing Distance and Detour Distance in Ride-Pooling Services. Transp. Res. Part C Emerg. Technol. 124, 102922. doi:10.1016/j.trc.2020.102922
Khazbak, Y., Fan, J., Zhu, S., and Cao, G. (2020). Preserving Personalized Location Privacy in Ride-Hailing Service. Tinshhua Sci. Technol. 25, 743–757. doi:10.26599/tst.2020.9010010
König, A., and Grippenkoven, J. (2020). Travellers' Willingness to Share Rides in Autonomous Mobility on Demand Systems Depending on Travel Distance and Detour. Travel Behav. Soc. 21, 188–202. doi:10.1016/j.tbs.2020.06.010
Krueger, R., Bierlaire, M., Daziano, R. A., Rashidi, T. H., and Bansal, P. (2021). Evaluating the Predictive Abilities of Mixed Logit Models with Unobserved Inter- and Intra-individual Heterogeneity. J. Choice Model. 41, 100323. doi:10.1016/j.jocm.2021.100323
Li, S., and Zhang, Y. (2020). Urban Transportation System Planning under the COVID-19 Pandemic in Beijing. Urban Transp. China 18, 28–32. doi:10.13813/j.cn11-5141/u.2020.0021
Li, W., Pu, Z., Li, Y., and Ban, X. (2019). Characterization of Ridesplitting Based on Observed Data: A Case Study of Chengdu, China. Transp. Res. Part C Emerg. Technol. 100, 330–353. doi:10.1016/j.trc.2019.01.030
Liao, F., Tian, Q., Arentze, T., Huang, H.-J., and Timmermans, H. J. P. (2020). Travel Preferences of Multimodal Transport Systems in Emerging Markets: The Case of Beijing. Transp. Res. Part A Policy Pract. 138, 250–266. doi:10.1016/j.tra.2020.05.026
Liu, X., Yan, X., Liu, F., Wang, R., and Leng, Y. (2019). A Trip-specific Model for Fuel Saving Estimation and Subsidy Policy Making of Carpooling Based on Empirical Data. Appl. Energy 240, 295–311. doi:10.1016/j.apenergy.2019.02.003
Loa, P., Hossain, S., Liu, Y., and Nurul Habib, K. (2022). How Has the COVID-19 Pandemic Affected the Use of Ride-Sourcing Services? an Empirical Evidence-Based Investigation for the Greater Toronto Area. Transp. Res. Part A Policy Pract. 155, 46–62. doi:10.1016/j.tra.2021.11.013
Luan, S., Yang, Q., Jiang, Z., and Wang, W. (2021). Exploring the Impact of COVID-19 on Individual's Travel Mode Choice in China. Transp. Policy 106, 271–280. doi:10.1016/j.tranpol.2021.04.011
Marra, A. D., Sun, L., and Corman, F. (2022). The Impact of COVID-19 Pandemic on Public Transport Usage and Route Choice: Evidences from a Long-Term Tracking Study in Urban Area. Transp. Policy 116, 258–268. doi:10.1016/j.tranpol.2021.12.009
McFadden, D. (1974). Conditional Logit Analysis of Qualitative Choice Behavior. New York: Academic Press.
McFadden, D. (2022). Instability in Mixed Logit Demand Models. J. Choice Model. 43, 100353. doi:10.1016/j.jocm.2022.100353
McFadden, D., and Train, K. (2000). Mixed MNL Models for Discrete Response. J. Appl. Econ. 15, 447–470. doi:10.1002/1099-1255(200009/10)15:5<447::aid-jae570>3.0.co;2-1
Morshed, S. A., Khan, S. S., Tanvir, R. B., and Nur, S. (2021). Impact of COVID-19 Pandemic on Ride-Hailing Services Based on Large-Scale Twitter Data Analysis. J. Urban Manag. 10, 155–165. doi:10.1016/j.jum.2021.03.002
Qian, X., Lei, T., Xue, J., Lei, Z., and Ukkusuri, S. V. (2020). Impact of Transportation Network Companies on Urban Congestion: Evidence from Large-Scale Trajectory Data. Sustain. Cities Soc. 55, 102053. doi:10.1016/j.scs.2020.102053
Shang, H.-Y., Huang, H.-J., and Wu, W.-X. (2019). Bus Timetabling Considering Passenger Satisfaction: An Empirical Study in Beijing. Comput. Industrial Eng. 135, 1155–1166. doi:10.1016/j.cie.2019.01.057
Shen, H., Zou, B., Lin, J., and Liu, P. (2020). Modeling Travel Mode Choice of Young People with Differentiated E-Hailing Ride Services in Nanjing China. Transp. Res. Part D Transp. Environ. 78, 102216. doi:10.1016/j.trd.2019.102216
Song, J., Zhang, L., Qin, Z., and Ramli, M. A. (2022). Spatiotemporal Evolving Patterns of Bike-Share Mobility Networks and Their Associations with Land-Use Conditions before and after the COVID-19 Outbreak. Phys. A Stat. Mech. its Appl. 592, 126819. doi:10.1016/j.physa.2021.126819
Taiebat, M., Amini, E., and Xu, M. (2022). Sharing Behavior in Ride-Hailing Trips: A Machine Learning Inference Approach. Transp. Res. Part D Transp. Environ. 103, 103166. doi:10.1016/j.trd.2021.103166
Train, K. (2003). Discrete Choice Methods with Simulation. Cambridge, United Kingdom: Cambridge University Press.
Wang, W., Miao, W., Liu, Y., Deng, Y., and Cao, Y. (2022). The Impact of COVID-19 on the Ride-Sharing Industry and its Recovery: Causal Evidence from China. Transp. Res. Part A Policy Pract. 155, 128–141. doi:10.1016/j.tra.2021.10.005
Wang, Y., Geng, K., May, A. D., and Zhou, H. (2022). The Impact of Traffic Demand Management Policy Mix on Commuter Travel Choices. Transp. Policy 117, 74–87. doi:10.1016/j.tranpol.2022.01.002
Washington, S., Karlaftis, M., and Mannering, F. (2011). Statistical and Econometric Methods for Transportation Data Analysis. 2nd ed. New York: CRC Press.
Yan, X., Levine, J., and Marans, R. (2019). The Effectiveness of Parking Policies to Reduce Parking Demand Pressure and Car Use. Transp. Policy 73, 41–50. doi:10.1016/j.tranpol.2018.10.009
Yang, H., Zhai, G., Yang, L., and Xie, K. (2022). How Does the Suspension of Ride-Sourcing Affect the Transportation System and Environment? Transp. Res. Part D Transp. Environ. 102, 103131. doi:10.1016/j.trd.2021.103131
Yang, Y., He, K., Wang, Y., Yuan, Z., Yin, Y., and Guo, M. (2022). Identification of Dynamic Traffic Crash Risk for Cross-Area Freeways Based on Statistical and Machine Learning Methods. Phys. A Stat. Mech. its Appl. 595, 127083. doi:10.1016/j.physa.2022.127083
Yang, Y., Wang, C., Liu, W., and Zhou, P. (2017a). Microsimulation of Low Carbon Urban Transport Policies in Beijing. Energy Policy 107, 561–572. doi:10.1016/j.enpol.2017.05.021
Yang, Y., Yuan, Z., Chen, J., and Guo, M. (2017b). Assessment of Osculating Value Method Based on Entropy Weight to Transportation Energy Conservation and Emission Reduction. Environ. Eng. Manag. J. 16, 2413–2423. doi:10.30638/eemj.2017.249
Yu, J., Xie, N., Zhu, J., Qian, Y., Zheng, S., and Chen, X. (2022). Exploring Impacts of COVID-19 on City-wide Taxi and Ride-Sourcing Markets: Evidence from Ningbo, China. Transp. Policy 115, 220–238. doi:10.1016/j.tranpol.2021.11.017
Zhao, X., Yan, X., Yu, A., and Van Hentenryck, P. (2020). Prediction and Behavioral Analysis of Travel Mode Choice: A Comparison of Machine Learning and Logit Models. Travel Behav. Soc. 20, 22–35. doi:10.1016/j.tbs.2020.02.003
Keywords: shared mobility, COVID-19, mode choice, stated preference survey, mixed logit model, private car dependence, on-road carbon emissions, Beijing
Citation: Zhang X, Shao C, Wang B, Huang S, Mi X and Zhuang Y (2022) Exploring the Role of Shared Mobility in Alleviating Private Car Dependence and On-Road Carbon Emissions in the Context of COVID-19. Front. Environ. Sci. 10:931763. doi: 10.3389/fenvs.2022.931763
Received: 29 April 2022; Accepted: 14 June 2022;
Published: 22 July 2022.
Edited by:
Ehsan Elahi, Shandong University of Technology, ChinaReviewed by:
Lina Zhang, Business School, Hohai University, ChinaXinru Han, Institute of Agricultural Economics and Development (CAAS), China
Linchuan Yang, Southwest Jiaotong University, China
Copyright © 2022 Zhang, Shao, Wang, Huang, Mi and Zhuang. This is an open-access article distributed under the terms of the Creative Commons Attribution License (CC BY). The use, distribution or reproduction in other forums is permitted, provided the original author(s) and the copyright owner(s) are credited and that the original publication in this journal is cited, in accordance with accepted academic practice. No use, distribution or reproduction is permitted which does not comply with these terms.
*Correspondence: Chunfu Shao, cfshao@bjtu.edu.cn