Vulnerability Assessment and Spatio-Temporal Dynamics Analysis of Agricultural Flood in China
 Yinong Liu
 Jiaxi Zheng*
 - School of Business Administration, Zhongnan University of Economics and Law, Wuhan, China
Flood is one of the main problems faced by agricultural production in China. The research of agriculture’s floods vulnerability is the premise of scientifically dealing with floods. Based on the vulnerability assessment framework of “sensitivity-exposure-adaptability,” this paper selects 14 evaluation indicators from three aspects: sensitivity, exposure, adaptability, and the index weights which are determined by the entropy weight method to evaluate the sensitivity, resilience, and vulnerability of flood In terms of time, China’s overall flood vulnerability shows a trend of increasing first and then decreasing. From a spatial point of view, the number of highly vulnerable areas is relatively small which are mainly concentrated in Henan, Hubei, Anhui and other provinces, and most areas of the country are at low and mild levels. From the factor analysis model, the main contributing factors of agricultural flood exposure, sensitivity and adaptability are soil erosion control area, forest coverage rate, total reservoir capacity and total power of agricultural machinery. Therefore, controlling soil erosion, increasing forest coverage, further improving water conservancy facilities and strengthening agricultural mechanization level are the keys to reduce vulnerability of agricultural floods.
Introduction
In recent years, global climate change has intensified, and extreme climate events have also increased significantly, which has increased the instability of agricultural production. The security of agricultural production has been threatened and challenged. The report “Climate Change 2022: Impacts, Adaptation, and Vulnerability” published by group II of the Intergovernmental Panel on Climate Change (IPCC) pointed out that the current global temperature rise is only 1.1°C, but it has caused great damage on a global scale. Record floods have seriously threatened agricultural security and the livelihoods of tens of millions of people around the world. The increasing risk of flood disasters has become a global problem accompanied by climate change. The rising sea level and the increasing frequency of catastrophic storms caused by the increase in global average surface temperature have increased the threat of future flood disasters.
Affected by the factors such as monsoon, geographical location, topography and landform, China is a country with frequent and serious flood disasters in the world. Flood disasters not only have a wide range, frequent occurrence, strong suddenness, but also create huge losses. According to the statistics, from 1991 to 2020, an average of 2,020 people died or went missing due to floods in China, with a total of more than 60,000 deaths, resulting in an average annual direct economic loss of 160.4 billion yuan, totaling about 4.81 trillion yuan.
Floods have a wider impact on farmland than in cities and other systems. Especially for China’s agriculture with small farmers as the main production unit, the construction of rural infrastructure is insufficient, the popularity of agricultural insurance is not high (Xu et al., 2019), and the ability of farmers to deal with flood disasters is limited. Flood disasters directly lead to the reduction of crop yields, the reduction of people’s income, and the shortage of food. The reduction of crop productivity and the deterioration of the ecological environment have severely restricted the agricultural development.
China is a big agricultural country, and agriculture is the foundation of the national economy. The safety of agricultural production is related to food security, social and economic development, and more importantly, social stability. From 2000 to 2020, the average area affected by agricultural floods in China was 0.851 million hectares, and the harvest area was reduced by 0.129 million hectares. After 2006, the economic losses caused by flood disasters to China’s agricultural production have been increasing year by year. In 2006–2009, the annual economic loss caused by floods in China was about 46.6 billion yuan, and after 2010, this figure soared to 91.3 billion yuan. In 2012, China’s grain output decreased by 40 million tons due to floods, which was close to 6.8% of the total grain output in that year. Therefore, in the face of more and more frequent flood disasters, assessing the vulnerability of China’s agricultural floods has practical value for formulating disaster prevention and mitigation strategies and improving the ability of agriculture to cope with flood disasters.
Literature Review
The concept of vulnerability originated in the social sciences, firstly used by O'Keefe et al. (1976), to describe concepts related to natural disasters. Vulnerability is defined as a measure of the unfavorable degree to which the socioeconomic system of human groups is damaged by natural disasters, and is determined by sensitivity, exposure, and resilience (IPCC, 2001). Now, it is widely used in disaster research (Sahana and Sajjad, 2019). IPCC (2014) believed that vulnerability is mainly the result of socio-economic processes and social conditions, that is, the socio-economic pathways, adaptation and mitigation actions, and management practices of the assessed area need to be considered. Vulnerability is often related to disasters, aggravated by human activities (Aroca-Jiménez et al., 2020), and will reduce the ability of human beings and regions to respond to threats (Fatemi et al., 2017). Climate change has an increasing impact on production and people’s lives. In order to effectively reduce the losses caused by floods, it is necessary to understand the vulnerability of floods (Lian and Morimoto, 2019). In recent years, the issue of flood vulnerability has gradually become the focus and research hotspot of scholars from all over the world.
In the past few decades, a large number of scholars have measured and evaluated the vulnerability of floods. From the research field, researchers divide the vulnerability of flood into many types, including social vulnerability, economic vulnerability and environmental vulnerability., including social vulnerability, economic vulnerability and environmental vulnerability. Munyai et al. (2019) measured the social vulnerability of communities in South Africa, and found that the social and economic components of the flood disaster vulnerability index system scored higher than the natural environment score. Li et al. (2022) evaluated the vulnerability of China’s agricultural ecosystem by multi-index method. From the perspective of research scope, the existing research focuses on flood vulnerability from both micro and macro perspectives. At the micro level, the research objects are mainly individuals, families, and communities. Mahmood et al. (2017) used seven integrated methods to assess the impact of flash flood events in the Sudanese capital Khartoum in 2013 and 2014, assessing vulnerability to mountain flooding. Tessema and Simane (2019) calculated the livelihood vulnerability index from the aspects of ecology, agriculture, society, community, wealth, technology and infrastructure, and evaluated the vulnerability of Ethiopia’s agricultural system based on farmer’s interview and questionnaire. Percival and Teeuw (2019) took a systematic approach to study flood hazard vulnerability in mountainous Nepal. It is found that the high vulnerability level stems from higher flood risk and lower adaptive capacity, and the ordinal response model is used to analyze the micro-factors affecting the flood vulnerability level. Nazeer and Bork (2021) assessed the integrated indicators of flood vulnerability in Khyber Pakhtunkhwa, Pakistan, from a microscopic perspective through a household survey, setting relative indicators and a color matrix. At the macro level, researchers collect regional statistical data to obtain research data. Muqtada et al. (2014) assessed flood vulnerability using indicators such as population mortality, economics, and agriculture. Ahmed and Balica (2019) developed a new flood vulnerability index from six dimensions: climatic, physiographic, land use, anthropogenic, economic and access to services. Thereby evaluating the flood vulnerability index of the Pre-Saharan Region. Kociper et al. (2019) analyzed the agricultural vulnerability of Slovenia. At present, the main methods of vulnerability measurement are mainly divided into Indicator based approach and Multi-Criteria Approach. At the same time, GIS methods are more and more used in vulnerability research. Desalegn and Mulu (2021) used GIS method to analyze the economic vulnerability of flood in Fetam basin. Guo et al. (2021) established 12 indexes, measured drought vulnerability in China by comprehensive index method, and studied spatial change by GIS software.
Based on the above literature, there are abundant researches on flood vulnerability, including research fields, research angles, research methods and so on. However, the existing research still has some shortcomings. First of all, the existing research mainly focuses on the vulnerability assessment and analysis of flood disasters in cities and river basins, and the research on the vulnerability of floods in agriculture is insufficient. Especially for China, a big agricultural country, there is a lack of evaluation and discussion on the vulnerability of agricultural floods in China. In addition, another problem of the existing research is that the research period is short, and the long-term spatio-temporal evolution analysis of flood vulnerability is lacking.
Drawing on the definitions of vulnerability of IPCC (2001) and IPCC (2014), this paper adopted the vulnerability assessment framework of "exposure-sensitivity-adaptability" (Li et al., 2015; Gurri et al., 2018) selected meteorological and socio-economic indicators, combined the natural ecosystem with the socio-economic system, collected and sorted out the statistical data of 31 provinces (cities) in China for 21 years, established an evaluation model of agricultural flood vulnerability, and analyzed the vulnerability of agricultural flood in different provinces. This will provide a reference for the prevention and control of agricultural floods in China.
Methods and Data
Model Settings
This study is based on the vulnerability concept and analytical framework proposed by the Intergovernmental Panel on Climate Change (IPCC). According to the existing research (Rehman et al., 2019; Moreira et al., 2021), 14 meteorological and socio-economic indicators were selected from the three aspects of exposure, sensitivity and adaptability to construct a vulnerability assessment system for agricultural flood vulnerability. The flood vulnerability evaluation index system established in this study is shown in Table 1.
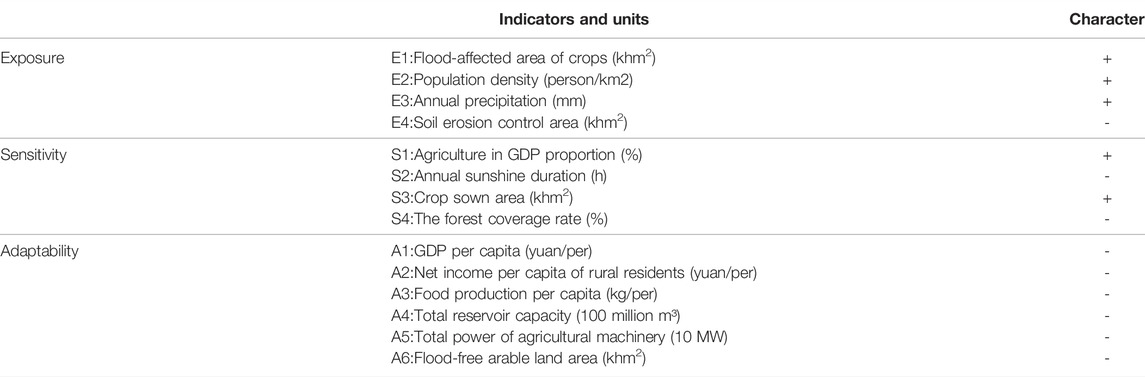
TABLE 1. China’s agricultural flood vulnerability evaluation index system.
(1) In the vulnerability assessment of agricultural floods, exposure is the degree to which agriculture is faced with flood disaster, including the affected area of crop floods, population density, annual precipitation, and soil erosion control area. The flood-affected area of crops reflects the scale of the region affected by floods and floods for a long time. The larger the affected area, the higher the vulnerability of flood. Population density reflects the regional population status, and a larger population density means greater economic losses when suffering from floods. Precipitation is the main natural cause of flood disasters, and annual precipitation reflects regional agricultural conditions and has a positive impact on vulnerability to flood disasters. In addition, soil erosion often aggravates the frequency and scale of flood disasters and increasing the area of soil erosion control is one of the means to alleviate flood vulnerability.
(2) Sensitivity is the degree to which agriculture is vulnerable to floods, including the proportion of agriculture to GDP, annual sunshine hours, crop sown area, and forest coverage. The proportion of agriculture in GDP reflects the position of agriculture in the national economy. The higher the proportion, the greater the impact of agricultural natural disasters on the economy. Annual sunshine duration are the sum of the time when the direct solar radiation is equal to or more than 120 w/m2 in a year. More sunshine duration mean that the possibility of flood disaster is low. The larger the sown area of crops, the greater the losses in the event of floods, thus increasing the vulnerability. The forest coverage rate reflects the ecological level of the environment, and a higher forest coverage rate is helpful to improve the soil water storage capacity and reduce the flood disaster.
(3) Adaptability is the ability to cope with and reduce the losses caused by floods, which helps to reduce the vulnerability of agricultural floods, including per capita GDP, per capita disposable income of rural households, per capita grain production, total reservoir capacity of the reservoir, the total power of agricultural machinery, and the area of flood control.
GDP per capita can objectively reflect a country’s economic level. Compared with underdeveloped countries, countries with higher GDP per capita often have stronger infrastructure and social resources to cope with floods. The net income per capita of rural residents reflects farmers’ economic affordability and disaster prevention and recovery ability (Zhou et al., 2021). Increasing people’s net income can effectively improve rural residents’ ability to cope with floods (Xu et al., 2017). The per capita grain production reflects the level of agricultural productivity, and higher agricultural productivity naturally has a stronger ability to resist natural disasters. Water conservancy facilities such as reservoirs are important facilities for alleviating and weakening flood disasters. The total power of agricultural machinery represents the degree of modernization of agricultural production, and modern agricultural production methods are more conducive to dealing with sudden natural disasters such as floods. The flood-removed area is the area of land that is managed in an area and is not affected by flood disasters and has a negative impact on flood vulnerability.
(4) It is necessary to explain the character of indicators (Table 1). For the indicators whose character is “+”, the vulnerability degree increases with the increase of the index value. However, for the indicators whose character is “−”, the vulnerability degree decreases with the increase of the index value.
Source of Data
The historical data used in this article are the climate and economic data of 31 provincial-level administrative units in China (except Hong Kong, Macao, and Taiwan) from 2000 to 2020. The climate data includes annual total rainfall and annual sunshine hours, all from the National Meteorological Science Data Center (http://data.cma.cn). Economic data are from the National Bureau of Statistics of China (http://www.stats.gov.cn) and the China Statistical Yearbook. Table 2 shows the relevant characteristics of the sample data.
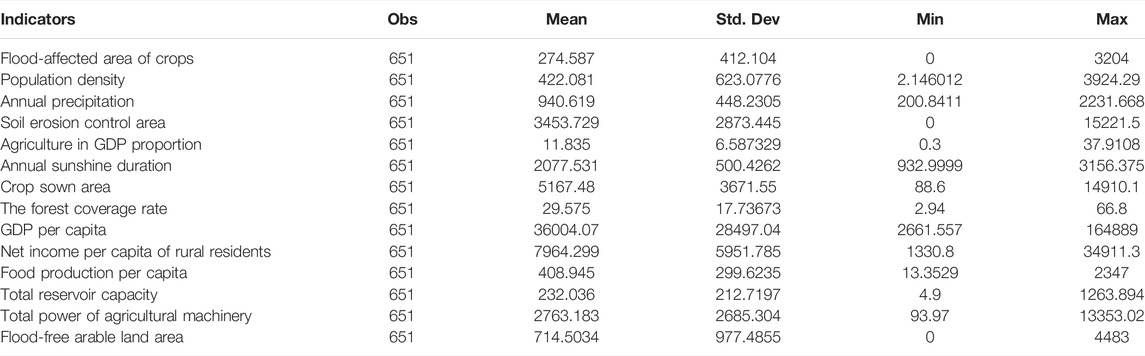
TABLE 2. Descriptive statistics of the sample.
Entropy Weight Method
Referring to Guo et al. (2020), in order to make the evaluation results more objective, this study selected entropy weight method to calculate the vulnerability of agricultural floods. The entropy weight has the following methods and steps:
The first step of entropy weight method is to standardize the index data to eliminate the differences in units between different data. The entropy weight method specifies the standardization methods of positive and negative indicators, as shown in Formula 1 and Formula 2.
In this paper, i is the number of provinces, i=1,2,... ,31, j is the number of evaluation indexes, and j=1,1,2,... ,14.Xij represents the value of j index of ith province. Xmax and Xmin represent the maximum and minimum values of Xij. Yij is the normalized value of Xij.
Calculate the weight index Pij, m=31
Calculate the information entropy of the jth index Ej:
Calculate the coefficient of variance of the jth indicator Hj:
Calculate the weight of the jth indicator Wj:
Vulnerability Assessment Model
According to Yuan et al. (2021), agricultural flood vulnerability is a function of exposure, sensitivity, and adaptive capacity. This paper constructs a vulnerability evaluation model to measure the vulnerability index of agricultural flood in China.
Where V represents vulnerability, E represents exposure, S represents sensitivity, and A represents adaptive capacity. E, S and A are calculated as follows:
Where Wej, Wsj, and Waj are the weights of the jth indicators of exposure, sensitivity, and adaptive capacity, respectively; Yeij, Ysij, and Yaij are the standardized values of the jth indicators of exposure, sensitivity, and adaptive capacity, respectively.
Factor Contribution Model
The premise of effectively reducing vulnerability is to identify and analyze its main influencing factors. In the research of influencing factor identification, factor contribution models are widely used. This paper analyzes the main factors affecting the vulnerability of agricultural floods in China. the calculation equation is as follows:
Cj is the contribution of the jth index to vulnerability, Ij is the index deviation, usually expressed as the difference between 1 and the pu value Yij of each index; Wj is the weight of index j calculated by Formula 6.
Results and Discussion
Vulnerability Assessment of Agricultural Floods in China
According to Formula 8, the agricultural flood vulnerability index, exposure index, sensitivity index, and adaptability index in China from 2000 to 2020 is calculated in this paper, and lists the data in Table 3.
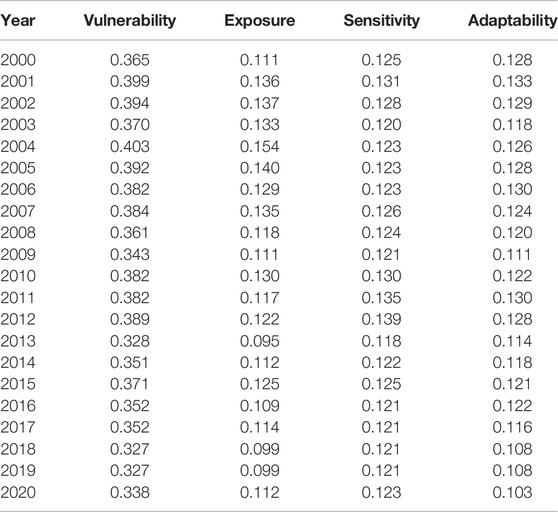
TABLE 3. Average vulnerability of agricultural floods in China from 2000 to 2020.
From 2000 to 2020, China’s agricultural flood vulnerability showed a fluctuating downward trend, reflecting the improvement of China’s overall flood vulnerability. The national average flood vulnerability increased from 0.365 in 2000 to 0.403 and in 2004, reaching the highest value, and then began to fluctuate and decrease to 0.338 in 2020. The possible reason is that since 2005, China’s Central Document No. 1 of the Central Government has continuously paid attention to the construction of agricultural infrastructure. The corresponding increase increases the ability of agriculture to resist natural risks, resulting in a lower vulnerability index.
In the existing research, there is no clear level standard of agricultural flood vulnerability. Based on the researches of Kociper et al. (2019), Yuan et al. (2021), Guo et al. (2021) and Li et al. (2022), this study graded the vulnerability index, exposure index, sensitivity index and adaptability index of agricultural floods in China from 2000 to 2020. The classification range is shown in Supplementary Data Sheet S2. Among them, all the indicators that constitute the adaptability index are negative (as shown in Table 1), and reverse normalization is carried out, that is, the smaller the adaptability index, the higher the adaptability.
Spatio-Temporal Dynamics Analysis of Agricultural Flood Vulnerability in China
After calculating the vulnerability index of agricultural floods in China, this study used Arcgis10.5 software to visualize the data, and the results of a temporal and spatial variation of agricultural flood vulnerability in China from 2000 to 2020 were shown in Figure 1.
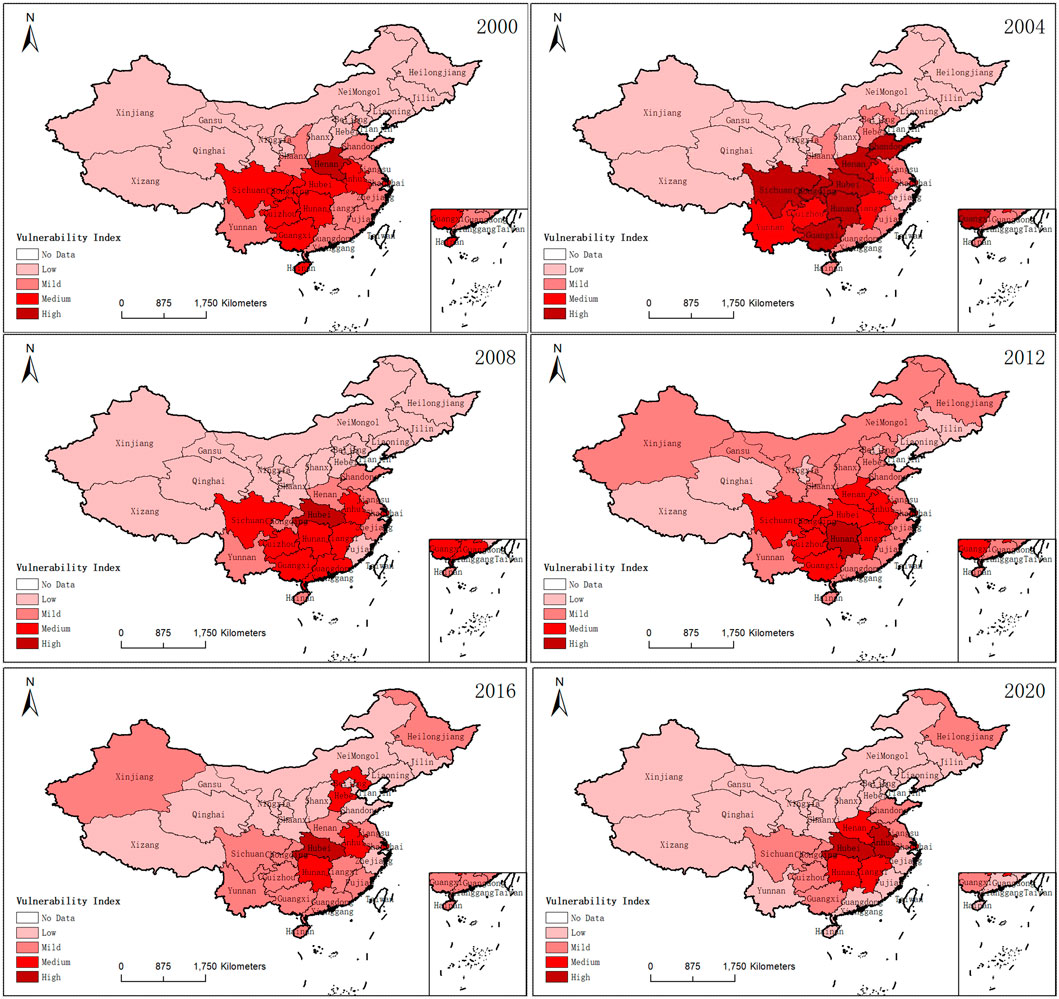
FIGURE 1. Temporal and spatial variation of agricultural flood vulnerability in China.
The vulnerability of agricultural floods in China is weakening from the central and southern regions to the northwest regions. Compared with the northwest provinces, the central and southern provinces have relatively more annual precipitation, high population density, and high intensity of agricultural and economic activities.
The number of highly and moderate vulnerable areas is relatively small, mainly concentrated in south-central and southwest areas, including Henan, Hubei, Hunan, Anhui, Sichuan, Guangxi, Jiangxi, Guizhou and Shanghai. The first is geographical factors. There are problems such as instability, flooding, short river channels, concentrated rainstorms, and poor circulation in the Yellow River (Wu et al., 2012), so the Henan near the Yellow River is more vulnerable to floods. Hunan and Hubei are located in the middle and lower reaches of the Yangtze River, the largest river in China. The topography of Sichuan, Guizhou and Guangxi is mainly mountainous and hilly, with frequent floods in mountainous areas (Zeng et al., 2021). Secondly, compared with other regions, these regions are provinces with higher population density in China, and their cultivated land area ranks among the top in the country. The natural conditions for agricultural development are good, and the exposure and sensitivity to flood disasters are relatively high. Therefore, the vulnerability is high.
Low and mildly vulnerable areas maintain an absolute majority in aggregate, accounting for more than two-thirds of all areas in the country. Mainly concentrated in the Northeast and West. Among them, Jilin, Heilongjiang and Liaoning in the northeast have long been in low and mild vulnerability levels, with high forest coverage, per capita grain production, total power of agricultural machinery, and total reservoir capacity, and have strong adaptability to flood disasters. Xinjiang, Tibet, Gansu, Qinghai, Ningxia, Inner Mongolia, Shaanxi, and other regions in the western region have been in low vulnerability level for a long time. These regions have relatively arid climate, low precipitation, many sunshine hours, and weak sensitivity to flood disasters.
Spatio-Temporal Dynamics Analysis of Agricultural Flood Exposure in China
Figure 2 shows the evaluation results of agricultural flood exposure and the spatial distribution of exposure index levels in each province in China from 2000 to 2020.
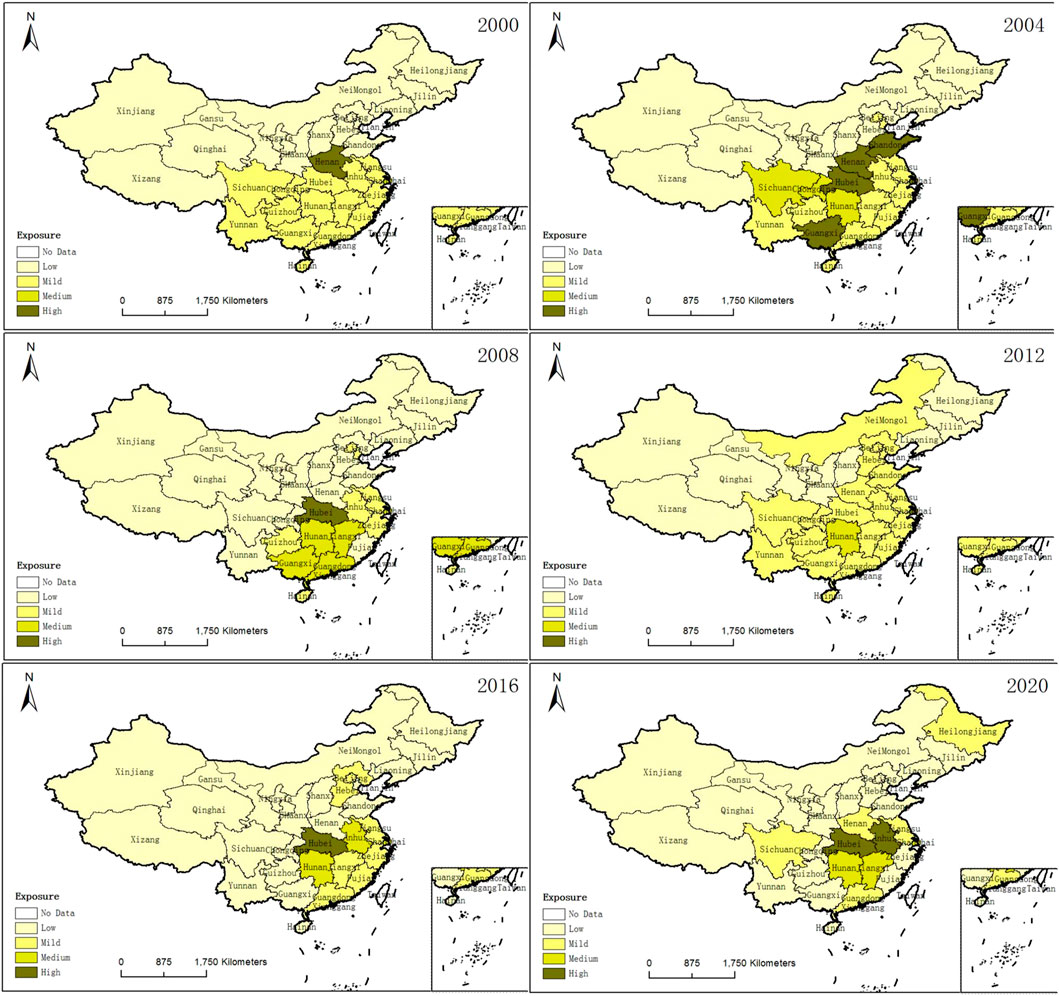
FIGURE 2. Temporal and spatial variation of agricultural flood exposure in China.
From 2000 to 2020, China’s overall agricultural flood exposure showed a trend of increasing first and then decreasing. Xinjiang, Tibet, Gansu, Qinghai, Ningxia, Inner Mongolia and other places have the lowest exposure to agricultural floods, belonging to low-exposure areas, concentrated in the western region and west of the Huyong line, which may not only be arid and less rainy, but also have a small population density. related. The lightly exposed areas were concentrated in the southwest and southeast coastal areas, mainly in Sichuan, Yunnan, Guizhou, Fujian, and Guangdong. Similar to the vulnerability index distribution, low and mild exposures account for the vast majority of the national area. Anhui, Henan, Hunan, Hubei and Shanghai have the highest exposure to agricultural floods. This may be due to the fact that these places are located in the Yangtze River and Yellow River basins, with abundant water resources, and the scale of agricultural production and population are at the forefront of the country. Among them, Shanghai is located in the coastal area, and typhoons are frequent., easy to bring heavy rain, resulting in high exposure.
Spatio-Temporal Dynamics Analysis of Agricultural Flood Sensitivity in China
Figure 3 shows the results of agricultural flood sensitivity evaluation and the spatial distribution of sensitivity index levels in various provinces in China from 2000 to 2020.
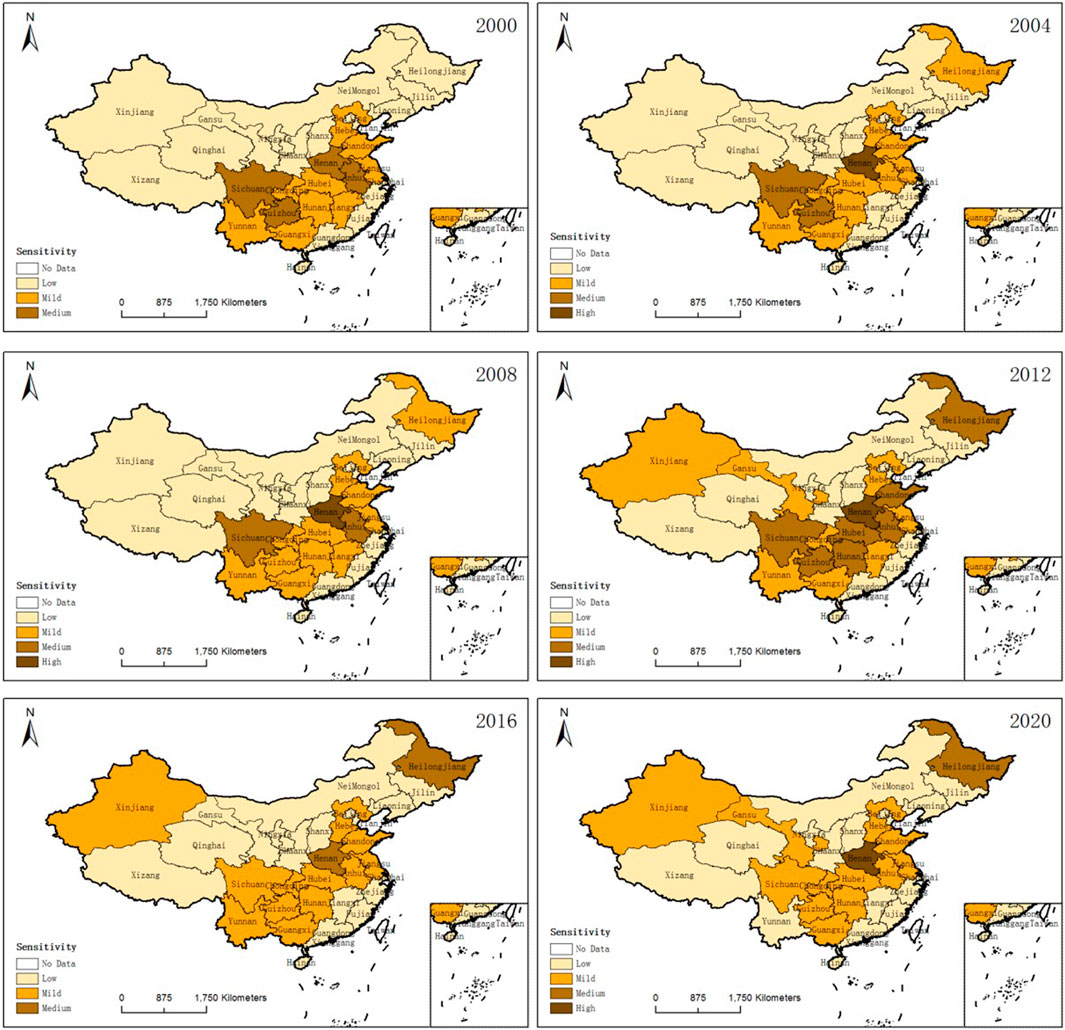
FIGURE 3. Temporal and spatial variation of agricultural flood sensitivity in China.
From 2000 to 2020, the main distribution areas of high-value and medium-value areas of agricultural flood sensitivity in China are similar to the exposure, mainly in Shandong, Henan, Hubei and Anhui. Shandong, Henan and Hubei are major agricultural provinces in China. Agriculture accounts for the proportion of gross domestic product and the sown area of crops is relatively high. Once a flood disaster occurs, agriculture suffers huge losses. Mild flood-sensitive areas are mainly distributed in western China, including Qinghai, Ningxia, Tibet, Gansu, Shaanxi, Xinjiang, Shanxi, and Inner Mongolia. These areas are deep inland, not easily affected by monsoons, and have little rainfall. In addition, more than two-thirds of the provinces in China are at the level of mild and low flood sensitivity.
Spatio-Temporal Dynamics Analysis of Agricultural Flood Adaptability in China
Figure 4 shows the results of agricultural flood adaptability evaluation and the spatial distribution of adaptability index levels in various provinces in China from 2000 to 2020.
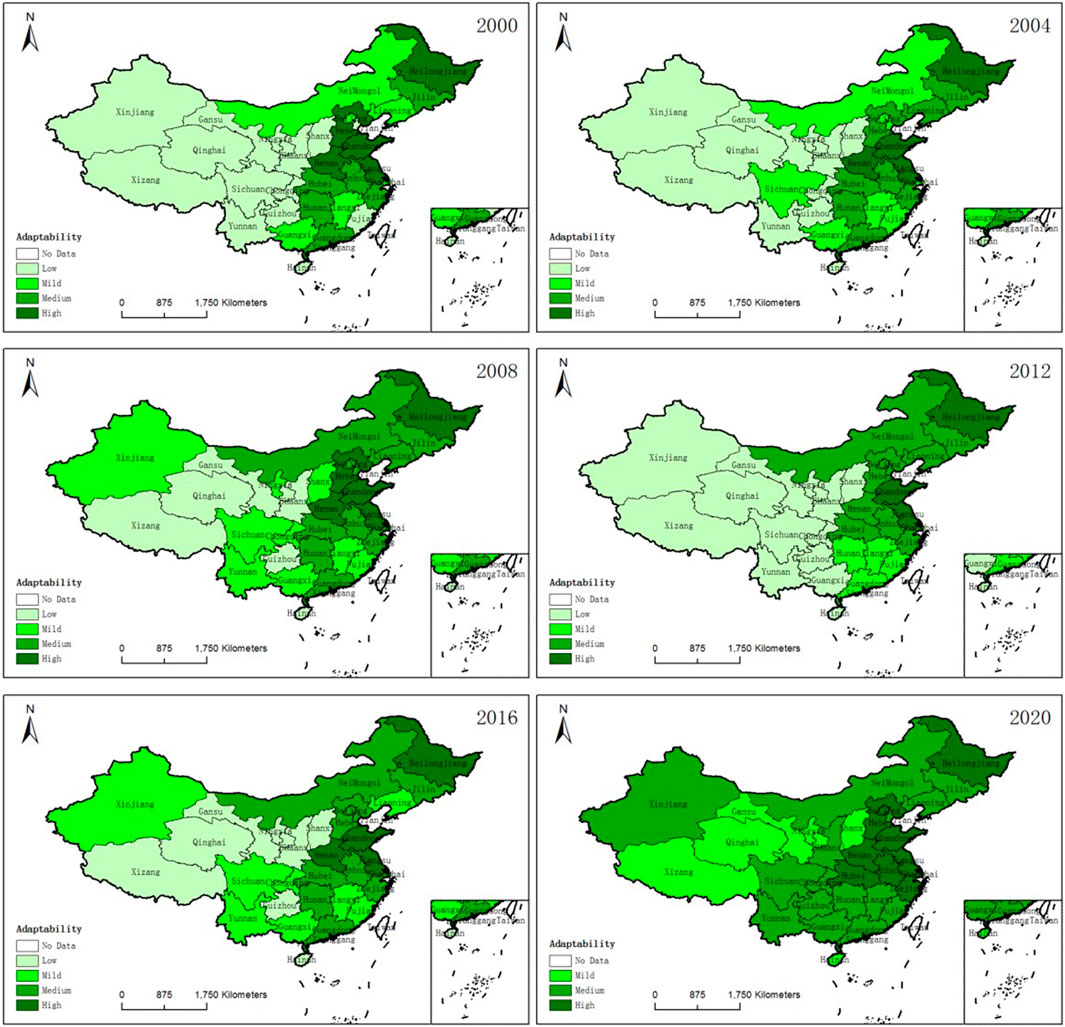
FIGURE 4. Temporal and spatial variation of agricultural flood adaptability in China.
From 2000 to 2020, the adaptability of agricultural floods in China’s provinces has shown a significant improvement trend. The number of provinces with high adaptability has increased from 5 in 2000 to 10 in 2020. The adaptability of agricultural floods in China has been significantly enhanced. Over time, the adaptive index of the central and western provinces improved significantly. At present, the areas with mild adaptability to agricultural floods are mainly in Gansu, Qinghai, Tibet, Hainan and other places, which may be related to the backward agricultural development and low agricultural investment in these places.
Factor Contribution Analysis of Agricultural Flood Vulnerability in China
In order to further analyze the factors that affect the vulnerability of agricultural floods in China, this study uses the factor contribution model to calculate the contribution of each factor to the vulnerability to agricultural floods and lists the top three factors with the largest contributions in 2020 in Supplementary Data Sheet S3.
It is noted that in Supplementary Data Sheet S3 that the main contributing factors of agricultural flood exposure in China are E4 (Soil erosion control area) and E3 (Annual precipitation). Therefore, it is necessary to improve the ecology and environment, restore forest and grass vegetation, and adjust the land use structure to continuously increase the area of soil erosion control. The main contributing factors to my country’s agricultural flood sensitivity are S4 (The forest coverage rate) and S2 (Annual sunshine duration). The principle of adapting measures to local conditions, combined with climate and soil conditions, restores forest and grass vegetation in ecologically fragile areas, and gives full play to the role of forests in conserving water and soil and weakening flood disasters. The main contributors to China’s agricultural flood resilience are A4 (Total reservoir capacity) and A5 (Total power of agricultural machinery). It is necessary to strengthen the construction of agricultural infrastructure such as water conservancy, improve the level of agricultural mechanization and ensure China’s food security.
At the same time, from the perspective of regional characteristics. Soil erosion control area is the main exposure factor and annual sunshine duration is the main sensitivity factor that affect the vulnerability of agricultural floods in western provinces such as Tibet, Shaanxi, Gansu, Qinghai, Ningxia and Xinjiang. The main factors affecting the exposure, sensitivity and adaptability of Yunnan, Guizhou and Sichuan are annual precipitation, forest coverage rate and total reservoir capacity respectively.
Conclusion and Discussion
This study constructed the vulnerability evaluation system of agricultural flood in China. The vulnerability, exposure, sensitivity and adaptability of agricultural floods in China from 2000 to 2020 were calculated by entropy weight method, and their temporal and spatial evolution was analyzed. The main conclusions are as follows:
1) From the perspective of the whole country, from 2000 to 2020, the vulnerability of China’s agricultural floods showed a fluctuating downward trend. Specifically, the vulnerability to agricultural flooding decreases from the central south to the northwest. Central regions such as Hunan, Henan, Hubei, and Anhui have long-term high vulnerability to floods, while northwestern provinces such as Gansu, Ningxia, and Shaanxi, and northern provinces such as Beijing and Hebei are mildly vulnerable, and Heilongjiang Province in northeastern China has increased vulnerability to agricultural floods over time.
2) The number of highly and moderately vulnerable areas is relatively small, mainly concentrated in south-central and southwest areas. The main distribution areas of high-value and medium-value areas of agricultural flood sensitivity in China are similar to the exposure, mainly in Shandong, Henan, Hubei and Anhui. The areas with mild adaptability to agricultural floods are mainly in Gansu, Qinghai, Tibet, and Hainan.
3) Henan, Hubei and Anhui, which are located in central China, are big agricultural provinces and important agricultural producing areas to ensure national food security. However, in the past 21 years, their vulnerability to agricultural flooding has been high and medium. For food security and sustainable agricultural development, the central provinces should take effective measures to reduce the vulnerability of agricultural floods.
4) The main contributing factors of agricultural flood exposure ar soil erosion control area and annual precipitation. The main contributors to sensitivity are the forest coverage rate and annual sunshine hours. The main contributors to resilience are total reservoir capacity and total power of agricultural machinery.
This study expanded the research scope of agricultural vulnerability, and based on the vulnerability analysis framework, the vulnerability assessment system of agricultural floods in China was constructed from three aspects: exposure, sensitivity and adaptability. This paper analyzes the vulnerability of agricultural floods in China from two dimensions of time and space, and points out the provinces that are still in high vulnerability, providing reference for the formulation of disaster prevention and mitigation planning. Secondly, this paper calculates the factor contribution of different indicators, so as to better identify the main indicators that affect the vulnerability of agricultural floods. This has certain policy significance for reducing the vulnerability of agricultural floods in China and realizing the sustainable development of agriculture. However, this paper also has shortcomings. For example, due to the consideration of data availability, the vulnerability index selected in this paper mainly comes from social and economic factors, without taking topographic structure, climatic conditions, soil and other factors into account. It is necessary to further study it in the future.
Data Availability Statement
Publicly available datasets were analyzed in this study. This data can be found here: http://data.cma.cn and http://www.stats.gov.cn.
Author Contributions
Conceptualization, JZ and YL; methodology, HL; software, HL; validation, YL, HL and XL; formal analysis, JZ and YL; investigation, JZ and YL; resources, JZ and XL; data curation, YL; writing—original draft preparation, YL; writing—review and editing, JZ; supervision, HL; project funding acquisition, JZ. All authors have read and agreed to the published version of the manuscript.
Funding
This project was supported by the 2021 Discipline Construction coordination project of Zhongnan University of Economics and Law, “A Study on the Effective Connection between Consolidating and Expanding Poverty Alleviation Achievements and Rural Revitalization” (Project No.: XKHJ202118).
Conflict of Interest
The authors declare that the research was conducted in the absence of any commercial or financial relationships that could be construed as a potential conflict of interest.
Publisher’s Note
All claims expressed in this article are solely those of the authors and do not necessarily represent those of their affiliated organizations, or those of the publisher, the editors and the reviewers. Any product that may be evaluated in this article, or claim that may be made by its manufacturer, is not guaranteed or endorsed by the publisher.
Supplementary Material
The Supplementary Material for this article can be found online at: https://www.frontiersin.org/articles/10.3389/fenvs.2022.902968/full#supplementary-material
References
Ahmed, K., and Balica, S. (2019). A New Flood Vulnerability Index Adapted for the Pre-Saharan Region. Int. J. River Basin Manag., 1814–2060. doi:10.1080/15715124.2019.1583668
Aroca-Jiménez, E., Bodoque, J. M., and García, J. A. (2020). How to Construct and Validate an Integrated Socio-Economic Vulnerability Index: Implementation at Regional Scale in Urban Areas Prone to Flash Flooding. Sci. Total Environ. 746, 140905. doi:10.1016/j.scitotenv.2020.140905
Desalegn, H., and Mulu, A. (2021). Flood Vulnerability Assessment Using GIS at Fetam Watershed, Upper Abbay basin, Ethiopia. Heliyon 7 (1), e05865. doi:10.1016/j.heliyon.2020.e05865
Fatemi, F., Ardalan, A., Aguirre, B., Mansouri, N., and Mohammadfam, I. (2017). Social Vulnerability Indicators in Disasters: Findings from a Systematic Review. Int. J. Disaster Risk Reduction 22, 219–227. doi:10.1016/j.ijdrr.2016.09.006
Guo, H., Chen, J., and Pan, C. (2021). Assessment on Agricultural Drought Vulnerability and Spatial Heterogeneity Study in China. Ijerph 18 (9), 4449. doi:10.3390/ijerph18094449
Guo, H., Xu, S., and Pan, C. (2020). Measurement of the Spatial Complexity and its Influencing Factors of Agricultural Green Development in China. Sustainability 12, 9259. doi:10.3390/su12219259
Gurri, F. D., Ruiz-García, W., Molina-Rosales, D. O., and Vallejo-Nieto, M. I. (2018). Measuring Individual Vulnerability to Floods in the Lower and Middle Grijalva River Basin, Tabasco, Mexico. Nat. Hazards 96, 149–171. doi:10.1007/s11069-018-3533-3
IPCC (2001). in Climate Change 2001: The Scientific Basis [M]. J. E. T. Houghton, Y. H. Ding, D. J. Griggs, and M. Noguer. Editors (Cambridge, United Kingdom and New York, NY, USA: Cambridge University Press), 881.
IPCC (2014). in Climate Change 2014: Synthesis Report [M]. Core Writing Team, R. K. Pachauri, and L. A. Meyer. Editors (Cambridge, United Kingdom and New York, NY, USA: Cambridge University Press).
Kociper, D., Mally, K. V., and Bogataj, L. K. (2019). Climate Vulnerability of Agriculture in Statistical Regions of Slovenia[J]. Ital. J. Agrometeorology 2, 35–48. doi:10.13128/ijam-651
Li, J., Chou, J., Zhao, W., Li, Y., Xu, Y., and Sun, M. (2022). Droughts and Floods Vulnerability Assessment of China’ S Agricultural Ecosystem from 1991 to 2019 [J]. Climatic Environ. Res. (in Chinese) 27 (1), 19–32. doi:10.3878/j.issn.1006-9585.2021.21073
Li, Y., Xiong, W., Hu, W., Berry, P., Ju, H., Lin, E., et al. (2015). Integrated Assessment of China’s Agricultural Vulnerability to Climate Change: A Multi-Indicator Approach[J]. Climatic Change 128 (3), 355–366. doi:10.1007/s10584-014-1165-5
Lian, X., and Morimoto, T. (2019). Spatial Analysis of Social Vulnerability to Floods Based on the MOVE Framework and Information Entropy Method: Case Study of Katsushika Ward, Tokyo. Sustainability 11, 529. doi:10.3390/su11020529
Mahmood, M. I., Elagib, N. A., Horn, F., and Saad, S. A. G. (2017). Lessons Learned from Khartoum Flash Flood Impacts: An Integrated Assessment. Sci. Total Environ. 601-602, 1031–1045. doi:10.1016/j.scitotenv.2017.05.260
Moreira, L. L., de Brito, M. M., and Kobiyama, M. (2021). Review Article: A Systematic Review and Future Prospects of Flood Vulnerability Indices. Nat. Hazards Earth Syst. Sci. 21 (5), 1513–1530. doi:10.5194/nhess-21-1513-2021
Munyai, R. B., Musyoki, A., and Nethengwe, N. S. (2019). An Assessment of Flood Vulnerability and Adaptation: A Case Study of Hamutsha-Muungamunwe Village, Makhado Municipality. Jàmbá 11, a692. doi:10.4102/jamba.v11i2.692
Muqtada, M., Khan, A., Ashikin, N., Shaari, B., Muchtar, A., Bahar, A., et al. (2014). Flood Impact Assessment in Kota Bharu , Malaysia : A Statistical Analysis. World Appl. Sci. J. 32(4), 626–634. doi:10.5829/idosi.wasj.2014.32.04.422
Nazeer, M., and Bork, H.-R. (2021). A Local Scale Flood Vulnerability Assessment in the Flood-Prone Area of Khyber Pakhtunkhwa, Pakistan. Nat. Hazards 105, 755–781. doi:10.1007/s11069-020-04336-7
O'Keefe, P., Westgate, K., and Wisner, B. (1976). Taking the Naturalness Out of Natural Disasters[J]. Nature 260 (5552), 566–567. doi:10.1038/260566a0
Percival, S., and Teeuw, R. (2019). A Methodology for Urban Micro-scale Coastal Flood Vulnerability and Risk Assessment and Mapping. Nat. Hazards 97 (1), 355–377. doi:10.1007/s11069-019-03648-7
Rehman, S., Sahana, M., Hong, H., Sajjad, H., and Ahmed, B. B. (2019). A Systematic Review on Approaches and Methods Used for Flood Vulnerability Assessment: Framework for Future Research. Nat. Hazards 96, 975–998. doi:10.1007/s11069-018-03567-z
Sahana, M., and Sajjad, H. (2019). Vulnerability to Storm Surge Flood Using Remote Sensing and GIS Techniques: A Study on Sundarban Biosphere Reserve, India. Remote Sensing Appl. Soc. Environ. 13, 106–120. doi:10.1016/j.rsase.2018.10.008
Tessema, I., and Simane, B. (2019). Vulnerability Analysis of Smallholder Farmers to Climate Variability and Change: An Agroecological Systembased Approach in the Fincha’ a Sub-basin of the Upper Blue Nile basin of Ethiopia [J]. Ecol. Process. 8 (1), 49–66. doi:10.1186/s13717-019-0159-7
Wu, P., Li, J., and Fei, J. (2012). The Characteristics of the Urban Flood Disasters in Henan Province in Ming Dynasty [J]. J. Arid Land Resour. Environ. (in Chinese) 26 (5), 13–17. doi:10.1007/s11783-011-0280-z
Xu, D., Liu, Y., Deng, X., Qing, C., Zhuang, L., Yong, Z., et al. (2019). Earthquake Disaster Risk Perception Process Model for Rural Households: A Pilot Study from Southwestern China. Ijerph 16 (22), 4512. doi:10.3390/ijerph16224512
Xu, D., Peng, L., Liu, S., Su, C., Wang, X., and Chen, T. (2017). Influences of Sense of Place on Farming Households' Relocation Willingness in Areas Threatened by Geological Disasters: Evidence from China. Int. J. Disaster Risk Sci. 8 (1), 16–32. doi:10.1007/s13753-017-0112-2
Yuan, C., Shi, X., Qian, H., Wang, H., and Yang, F. (2021). Vulnerability Assessment of Agricultural Droughts in Hebei Province From 2010 to 2018. J. Water Resour. Water Eng. 32 (5), 234–240. doi:10.3878/j.issn.1006-9585.2021.21073
Zeng, X., Guo, S., Deng, X., Zhou, W., and Xu, D. (2021). Livelihood Risk and Adaptation Strategies of Farmers in Earthquake hazard Threatened Areas: Evidence from Sichuan Province, China. Int. J. Disaster Risk Reduction 53, 101971. doi:10.1016/j.ijdrr.2020.101971
Keywords: agricultural flood vulnerability, exposure, sensitivity, adaptability, entropy method
Citation: Liu Y, Zheng J, Lu H and Li X (2022) Vulnerability Assessment and Spatio-Temporal Dynamics Analysis of Agricultural Flood in China. Front. Environ. Sci. 10:902968. doi: 10.3389/fenvs.2022.902968
Received: 23 March 2022; Accepted: 11 April 2022;
Published: 08 June 2022.
Edited by:
Dingde Xu, Sichuan Agricultural University, ChinaReviewed by:
Tongchao Zhang, Chongqing Academy of Governance, ChinaHuang Kai, University of Chinese Academy of Sciences, China
Copyright © 2022 Liu, Zheng, Lu and Li. This is an open-access article distributed under the terms of the Creative Commons Attribution License (CC BY). The use, distribution or reproduction in other forums is permitted, provided the original author(s) and the copyright owner(s) are credited and that the original publication in this journal is cited, in accordance with accepted academic practice. No use, distribution or reproduction is permitted which does not comply with these terms.
*Correspondence: Jiaxi Zheng, 470507355@qq.com; Honggang Lu, 879144704@qq.com