Environmental Factors Affecting Near-Surface Oxygen Content Vary in Typical Regions of the Qinghai-Tibet Plateau
 Dong Liu1,2
  Haiping Tang1,2*
- 1School of Natural Resources, Faculty of Geographical Science, Beijing Normal University, Beijing, China
- 2State Key Laboratory of Earth Surface Processes and Resource Ecology, Faculty of Geographical Science, Beijing Normal University, Beijing, China
Hypoxia threatens the health of people in highland regions around the world. Recent studies have shown that altitude has a significant effect on near-surface oxygen content at broad geographic scales, and whether this effect is manifested at the landscape scale, particularly on the Qinghai-Tibetan Plateau (QTP) in China, has not been documented. We investigated the relationship between altitude, vegetation (Net Primary Productivity, NPP; Leaf Area Index, LAI; Fractional Vegetation Cover, FVC; Length of the Growing Season, LOS and Vegetation Type), climate variables (Mean Monthly Temperature, MMT; Mean Monthly Precipitation, MMP and Wind Speed, WS), and near-surface oxygen content in five typical regions of the QTP, including the Qilian Mountains (QLM), the Three-River Headwater Area (THA), Ngari Prefecture (NAP), Hengduan Mountains (HDM) and Yajiang Valley (YJV). The results showed that 1) altitude, NPP, FVC, LOS, MMP and MMT were important variables for predicting near-surface oxygen content; 2) the local-scale relationship between altitude and oxygen content exhibited negative or no correlations across broad regions; and 3) oxygen content exhibited a great deal of spatial heterogeneity, with altitude being the main affecting factor, followed by vegetation. Different drivers of near-surface oxygen content should be incorporated into Earth system models to reduce uncertainty in predicting oxygen dynamics and its potential feedback to global warming.
Introduction
Oxygen is one of the most abundant components of the atmosphere and it is responsible for the survival and development of almost all organisms on Earth (Petsch, 2014; Shi et al., 2021a). However, climate change and intensified human activities have caused a steady decline in oxygen content (Liu et al., 2020). For high-altitude areas (≥2,500 m above sea level), the total area of which is 7.7% of the Earth’s land area and is home to 1.5% of the world’s total population, such subtle changes have posed challenges to economic, social, and environmental sustainability (Shi et al., 2021b). Chronic mountain sickness caused by hypoxia severely limits the use of resources and survival of the sedentary population in these areas (Vingrys and Garner, 1987; Hobkirk et al., 2013). Therefore, understanding the effect of altitude on the spatial patterns of oxygen content will help improve human resilience to the risk of hypoxia, which is important for sustainable development in these areas.
Previous studies suggested that the average annual decline in near-surface oxygen was approximately 4 ppm yr−1 (absolute oxygen content), equivalent in magnitude to the increase in atmospheric carbon dioxide (Wei et al., 2021). Estimates of oxygen fluxes found that land-use change (Zhang et al., 2018), fossil fuel (Wei et al., 2021) and industrial activities (Liu et al., 2020) were the main reasons for the significant decrease in oxygen content at both the global and regional scales. In addition to the long-term variability in atmospheric oxygen, high-resolution measurements capture seasonal changes (Keeling and Manning, 2014), and sudden environmental pollution events (Minejima et al., 2012) and wildfires (Lueker et al., 2001) have important effects on short-term fluctuations in atmospheric oxygen. Despite these recent advances, there have been few studies on the relative spatial variability of oxygen content. The oxygen content of the atmosphere is not spatially uniform and may vary with location due to social factors and natural conditions. Previous studies have suggested that atmospheric pressure and partial pressure of oxygen decrease with increasing altitude, while oxygen content remains nearly constant at all altitudes (relative oxygen content, which differs from the absolute oxygen content) (Beall, 2007). Measurements between 50°N and 60°S, over the ocean, also indicate that the oxygen content in dry air is nearly constant (Machta and Hughes, 1970). However, a recent analysis of samples collected on the Qinghai-Tibetan Plateau (QTP) showed that oxygen content was not only associated with altitude but was also strongly affected by surface vegetation cover and temperature (Shi et al., 2021a). To reconcile these conflicting findings, it is critical to understand the potential drivers and key processes associated with oxygen. Landscape and regional scales may be the most operational scale domains for understanding the potential drivers of oxygen content. In fact, due to the challenges encountered in detecting the relative changes in atmospheric oxygen, no studies have simultaneously focused on how the oxygen content varies with altitude, vegetation, and climatic factors at the landscape scale.
This study aimed to investigate the spatial distribution of near-surface oxygen content in typical regions of the QTP and its relationship with altitude, vegetation, and climatic factors. Specifically, this study focused on the following questions: 1) what is the spatial distribution pattern of the near-surface oxygen content in the typical regions of the QTP, and what are the key influencing factors? 2) How do the relationships between near-surface oxygen content and altitude, vegetation, and climate factors vary geospatially at the landscape scale on the QTP? It was hypothesized that 1) altitude has a greater influence on the spatial distribution of oxygen content than other factors and 2) climate factors are closely related to the oxygen content in different regions.
Materials and Methods
Study Area
The Qinghai-Tibetan Plateau (QTP) is the highest and largest plateau in the world, with a geographical range of 26°00′–39°47′N, 73°19′–104°47′E (Figure 1), covering an area of ∼2.5 × 10⁶ km2, with a mean elevation of 4,000 m (He et al., 2021). Due to the impact of topographical factors, the QTP has formed a unique climate. The mean annual temperature in this area varies from −4.9 to 6.1°C, and the mean annual precipitation ranges between 84.3 and 593.9 mm, with approximately 90% falling during the growing season (May–September) (Chen L. et al., 2021). The climatic gradient has triggered a dramatic change in vegetation composition, transitioning from subtropical rainforest in the southeast to high desert in the northwest.
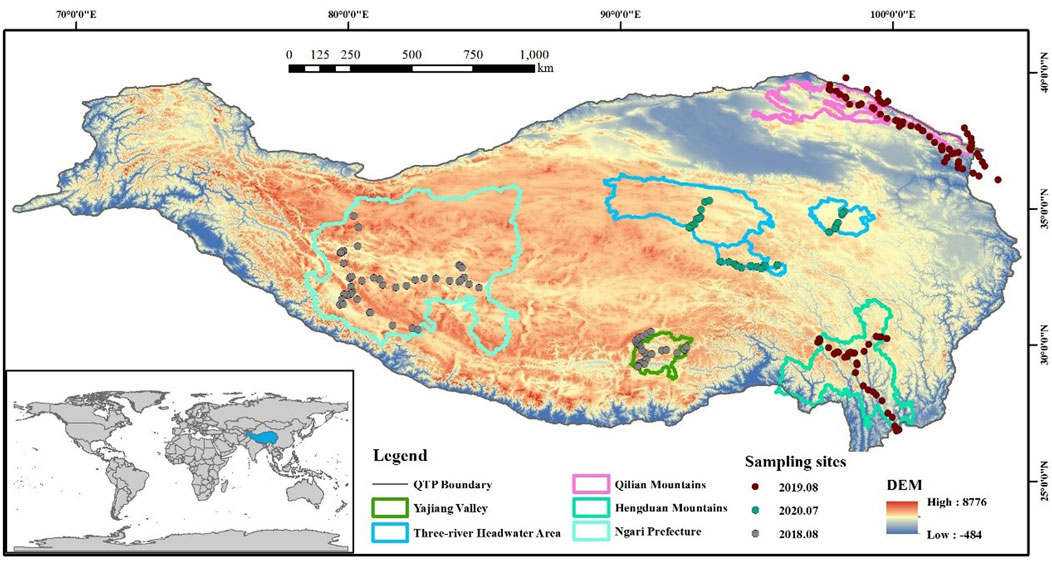
FIGURE 1. Location of sampling sites in QTP (data source: http://data.tpdc.ac.cn).
To test hypotheses of how climate variables (mainly precipitation, temperature and wind speed) broadly influence oxygen content, regions spanning a wide climate and vegetation type gradient were selected. This study was carried out in five typical regions of the QTP, including the Qilian Mountains (QLM), the southern part of the Hengduan Mountains (HDM), the Three-River Headwater Area (THA), Ngari Prefecture (NAP), and Yajiang Valley (YJV) (Figure 1). The NAP is located in the hinterland of the QTP, with a cold and dry climate, and the main vegetation is alpine desert grassland. The HDM, located in the east of the QTP, possesses extreme topography, including deeply parallel gorges and glaciated peaks over 6,700 m above sea level, most of which are covered by global biodiversity hotspots needing priority conservation (Ao et al., 2021). The YJV is representative of river valley agriculture on the QTP, with a warm and humid climate and an average altitude of 3,100 m (Zhang et al., 2019). The THA and QLM, with an average altitude of over 4,000 m and covering areas of 302,500 km2 and 50,200 km2, respectively, are the birthplaces of many rivers in Asia, including the Lancang, Yangtze, Yellow, Black, Shule, and Shiyang rivers, and are occupied with alpine wetlands and alpine meadows (Gao et al., 2019; Cao et al., 2021).
Large-Scale Near-Surface Oxygen Content Measurements
During July and August from 2017 to 2020, several field investigations were conducted along sample lines on the QTP and its vicinities (Figure 1). The altitude, geographical location, and near-surface oxygen content were recorded from 487 sites, of which 214 samples were selected in the present study (more details in Shi et al., 2021b). Each site’s geographical location and altitude were recorded using an Oregon 450 Satellite Navigation device (Garmin., Schaffhausen, Switzerland). Near-surface oxygen content was measured by an electrochemical oxygen meter (all measured values in this study are relative oxygen content) (Xinan., Zhejiang, China). Each of these parameters was measured simultaneously with three devices, and all parameters were measured between 8 a.m. and 4 p.m. Due to challenges encountered in obtaining oxygen content simultaneously at larger scales, analysis and presentation were focused on how the local-scale relationship for oxygen content varies over a wide area.
Vegetation and Climate Data Collection
Fractional vegetation cover (FVC), length of the growing season (LOS), net primary productivity (NPP), leaf area index (LAI), vegetation type, mean monthly temperature (MMT), mean monthly precipitation (MMP) and Wind Speed (WS) were used to explore the relative importance of vegetation and climate variables on the spatial variation in oxygen content. Data on FVC, LOS, NPP, and LAI were from the Moderate Resolution Imaging Spectroradiometer (2018–2020, Terra MOD09A1 Version 6.1) (https://lpdaac.usgs.gov/), with a spatial resolution of 500 × 500 m2 (Chen L. et al., 2021). These vegetation parameters were calculated as the average during the corresponding monitoring period, and the temporal variation in the parameters was almost negligible compared to the spatial variation (Huang et al., 2017). The vegetation type data were from Zhang et al. (2021), and the classification system used for the vegetation map was specifically designed for the QTP vegetation with a spatial resolution of 250 × 250 m2. The vegetation types involved in this study included grasslands, forests, scrub, wetlands, agricultural lands, alpine vegetation and others. Data on MMT and MMP in the period of 2018–2020 were obtained from the National Tibetan Plateau Data Center (Yang and Luo, 2021; http://data.tpdc.ac.cn) based on the geographic coordinates of each sampling site. For Wind Speed (WS), we used a reanalysis dataset from the European Center for Medium Range Weather Forecasts (ECMWF/ERA5-Land), ERA5-Land dataset has a spatial resolution of 0.1°. Considering that climatic variables could exert lagged and accumulative effects on oxygen production, we used the monthly averages of climatic variables during the vegetation growth period (May–September) to explore their effects on oxygen content.
Statistical Analyses
All statistical analyses were conducted in the R environment (v4.1.1; http://www.r-project.org/). Before statistical analyses, we performed the Shapiro–Wilk test to examine data normality and conducted logarithmic transformation when necessary. Then, the statistical analyses were carried out as follows. First, differences in oxygen content between regions were determined by using a nonparametric factorial Kruskal–Wallis (KW) analysis. Then, a significance analysis was performed using the Wilcoxon test. The relationships between oxygen content and vegetation variables (i.e., NPP, FVC, LAI, and LOS), altitude, and climate variables (i.e., MMT, MMP and WS) were analyzed with partial correlation analysis.
As the predictive power of Random Forest (RF) is not influenced by multi-collinearity issues, the relative importance of the abovementioned variables in the spatial variation of oxygen content was quantified by RF. Initially, 70% of the data was randomly selected for generating the models and the remaining 30% for validating the models. Then, the optimal model was selected based on the coefficient of determination (R2) of the test data to derive optimal model parameters (ntree, the total number of trees to be grown in the model run and mtry, the number of predictors for splitting at each node) (Araújo and New, 2007). The precision of the optimal models was also evaluated using standard residuals and slopes between predicted and observed values (Supplementary Figure S1). To estimate the importance of these variables, percentage increases were used in the MSE (mean squared error) of variables: higher MSE% values imply more important variables (Jiao et al., 2018). The significance of the models and cross-validated R2 values were assessed with 1,000 permutations of the response variable.
Partial least squares path modeling (PLS-PM) analysis was performed to further disentangle the regulatory pathways of all these factors on oxygen content. PLS-PM is a data analysis method for variables that can be summarized by using latent variables, and linear relationships exist between latent variables (Sanchez, 2013). Models with different structures are evaluated using the goodness of fit (GOF) statistics, a measure of their overall predictive power, with GOF >0.7 considered acceptable values (Sanchez, 2013; Tian et al., 2021). The model selected the main predictors as environmental drivers according to their contribution to variation based on RF analysis (% increase in MSE). Based on the importance and the maximum explanation for variations in oxygen, the environmental drivers selected in the model include altitude, MMT, MMP, NPP, FVC, and LOS (Figure 3).
Results
Spatial Patterns of Near-Surface Oxygen Content Over a Broad Geographic Scale
The oxygen content exhibited large spatial variability in different regions of the QTP (Figure 2). Among all sites in the selected regions, the oxygen content varied from 19.96% to 21.96%, with a mean value of 20.44% (n = 214). Specifically, the oxygen content was highest in the YJV (20.83%; n = 27) and significantly greater than in other regions (all p < 0.05). The lowest oxygen content was found in the NAP (20.17%, n = 48) and HDM (20.26%, n = 41) and was significantly lower than that in other regions (all p < 0.05). There was no significant difference in oxygen content between the QLM and THA (20.59%, n = 64 and 20.42%, n = 34, respectively).
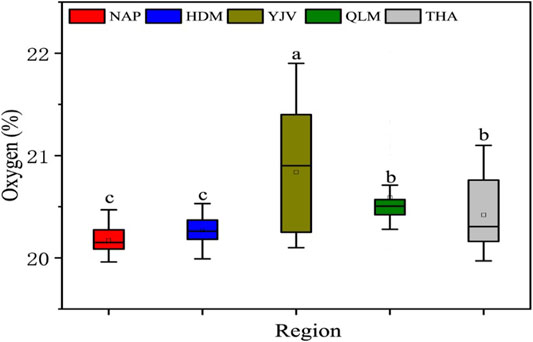
FIGURE 2. The difference in atmospheric oxygen content among different regions. For individual plots, nonmatching letters indicate a significant difference between regions. NAP, Ngari Prefecture; HDM, Hengduan Mountains; YJV, Yajiang Valley; QLM, Qilian Mountains; THA, Three-River Headwater Area.
Associations of Oxygen Content With Altitude, Climate, and Vegetation Factors in Different Regions
Oxygen content was closely associated with altitude, climate, and vegetation factors. The key influencing factors that affect the oxygen content in different regions showed much in common yet differed subtly (Table 1). In HDM and NAP, oxygen content significantly decreased with altitude (p < 0.01) and increased with MMT (p < 0.05). For QLM and THA, the oxygen content was significantly positively correlated with NPP, LAI, FVC, and MMP (p < 0.05), but did not exhibit any significant relationship with altitude (p > 0.05). In addition, the oxygen content was also significantly positively correlated with MMT and significantly negatively correlated with WS in THA. LOS was only significantly positively correlated with oxygen content in YJV (p < 0.01).
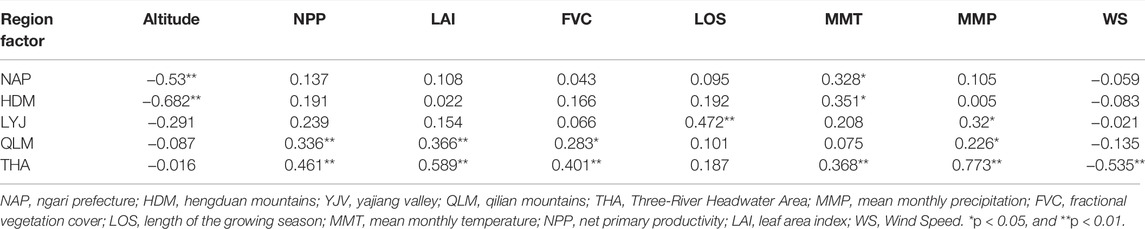
TABLE 1. Values of r for the partial correlation analysis between oxygen content and altitude, climate, and vegetation factors in different regions.
The Dominant Factors Influencing Oxygen Content
To disentangle the potential main drivers for the spatial variation in oxygen content, we identified the main environmental predictors for the oxygen content by RF analysis (Figure 3). The models for oxygen content were significant at the 0.001 level (R2 = 0.48). We observed that altitude and MMP were the two most important predictors of oxygen content (24.23% and 24.12%, respectively). Furthermore, the FVC (23.09%), LOS (22.86%), MMT (19.85%), and NPP (19.32%) contributed significantly to the spatial variability of oxygen content (Figure 3). Based on the RF results, partial least squares path modeling (PLS-PM; GOF of 0.72; Figure 4) was designed to explore the potential direct and indirect effects of altitude, climate, and vegetation on oxygen content. Vegetation had a direct effect on oxygen content (the standardized direct effect was 0.37; Figure 5A). Altitude exerted a direct effect on oxygen content, and it also had indirect effects on oxygen content by affecting both vegetation and climate (the standardized total effect was −0.57; Figures 4, 5A,5B). Compared to vegetation and altitude, the climate was less responsible for the spatial variations in the oxygen content (the standardized direct and indirect effects were 0.19 and 0.06, respectively; Figures 5A,B).
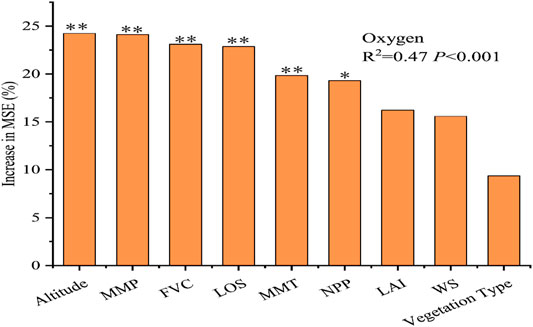
FIGURE 3. The relative importance of altitude, climate, and vegetation factors to variation of atmospheric oxygen content among different regions. Percentage increases in the MSE (mean squared error) of variables were used to estimate the importance of these predictors, and higher MSE% values imply more important predictors. Significance levels are as follows: *p < 0.05 and **p < 0.01. MSE, mean squared error; MMP, mean monthly precipitation; FVC, fractional vegetation cover; LOS, length of the growing season; MMT, mean monthly temperature; NPP, net primary productivity; LAI, leaf area index; WS, Wind Speed.
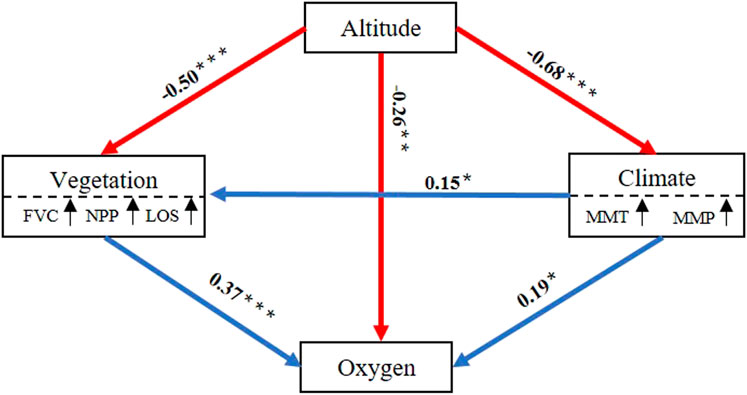
FIGURE 4. Partial least squares path modelling (PLS-PM) analysis showing the direct and indirect effects of altitude, climate, and vegetation on oxygen content. Blue and red solid arrows indicate positive and negative associations, respectively. Numbers adjoining the arrows indicate significant standardized path coefficients. Climatic factors include mean monthly precipitation (MMP) and mean monthly temperature (MMT). Vegetation factors include fractional vegetation cover (FVC), net primary productivity (NPP), and length of the growing season (LOS). *, p < 0.05; **, p < 0.01; ***, p < 0.001.
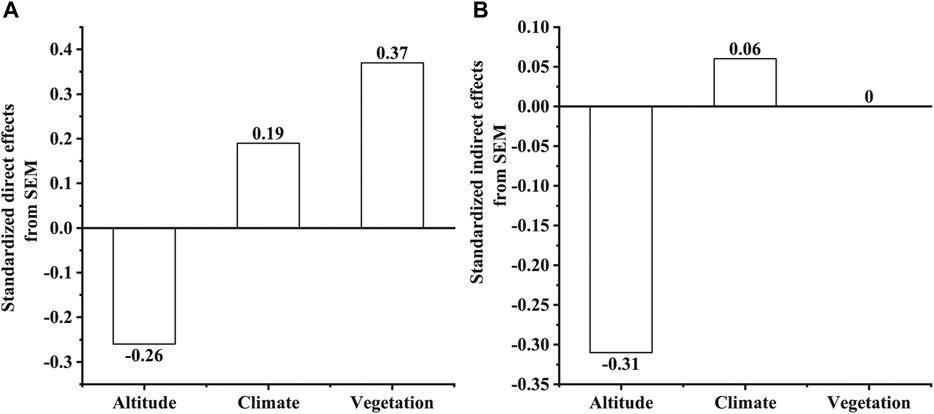
FIGURE 5. Standardized effects of each variable from the PLS-PM. (A) and (B) represent the standardized direct and indirect effects of altitude, climate, and vegetation, respectively. The values adjacent to the column represent the standardized coefficients in PLS-PM.
Discussion
Main Drivers of Spatial Variation in Oxygen Content
The spatial distribution of oxygen content showed high variations among the selected regions and was codetermined by the altitude, climate, and vegetation factors. RF and PLS-PM analyses revealed that altitude was the most critical factor affecting the spatial variation in oxygen content in typical regions of the QTP (Figures 3, 4) compared to climatic and vegetation conditions, supporting our first hypothesis. In the modern atmosphere, primary production in terrestrial and marine ecosystems is the main source of atmospheric oxygen (Keeling et al., 1993; Huang et al., 2021). Altitude, through its effect on microclimate shaping and a range of biological and physical processes, such as the weathering of organic matter, microbial activity (Battle et al., 2019; Cao et al., 2020; Shi et al., 2021b), and vegetation NPP (Chen S.-t. et al., 2021), may diminish the effect of vegetation on atmospheric oxygen. These findings jointly highlight the non-negligible role of altitude on oxygen flux estimates in highland ecosystems.
The QTP is a globally important oxygen source region, and oxygen content is more sensitive to changes in climate and vegetation than in other regions (Liu et al., 2020). In fact, the QTP vegetation NPP has increased significantly over the past few decades under a warming climate, with some differences in the dominant and interacting factors of ecological subregions (Piao et al., 2012; Shen et al., 2016; Wu et al., 2021). Guo et al. (2020) found that temperature and rainfall appear as the dominant factors for vegetation NPP in the arid regions of the QTP, while slope and aspect parameters have constantly assumed dominancy for the same in the tropical rainforest-monsoon ecological zone in southeastern. In our study, vegetation (i.e., NPP, LAI, FVC) factors were significantly correlated with oxygen content in the Qilian Mountains and Three-River Headwater Area (northern QTP), while in the Hengduan Mountains (southern QTP), oxygen content was mainly related to altitude (Table 1). Similar results were reported by Shi et al. (2021b), suggesting that changes in oxygen content over the northern QTP will be more sensitive under future climate change scenarios (Guo et al., 2022). Therefore, more research on changes in oxygen content in the region is strongly needed to ensure the sustainable development of high-altitude regions under global climate change. In the present study, the length of the vegetation growing season (LOS) had significant effects on the oxygen content in the Yajiang Valley, suggesting that the mechanism of how vegetation affects oxygen is complex. There are several ways that vegetation might affect oxygen content, including plant photosynthesis (Huang et al., 2021) and changes in vegetation type (Zhang et al., 2018).
Potential Uncertainties of Atmospheric Oxygen Estimates in the Earth System
This study demonstrated the crucial role of vegetation and climate factors in regulating near-surface oxygen at the regional scale. Despite some uncertainties involved in oxygen measurement and extraction of remote sensing data, the results have converged on the same conclusion as some previous studies (Zhang et al., 2018; Shi et al., 2021b). This is important because to date, there has been limited research on the relationship between near-surface oxygen and potential environmental factors.
Our study emphasized how the local-scale relationships between oxygen content and environmental factors vary on a large scale. Indeed, in addition to vegetation autotrophic respiratory consumption, soil microorganisms consume a substantial proportion of NPP through heterotrophic respiration (Lovett et al., 2006), but were not considered in our study due to the lack of regional-scale observations, which might have tended to decouple the relationship between oxygen concentration and vegetation factors. Therefore, future studies should pay more attention to the effect of soil heterotrophic respiration on oxygen content on the QTP.
Our study revealed that oxygen content did not have a significant linear relationship with vegetation factors in the Hengduan Mountains and Ngari Prefecture, indicating that the relationship between oxygen content and vegetation has geographical unit characteristics (Liu et al., 2020). The reason for this can be summarized as follows: 1) The Hengduan Mountains and Ngari Prefecture have high altitudes, and in the atmosphere with both horizontal and vertical motion and air exchange, measurements of oxygen may not be identical to the actual spatial concentration distribution (Zhang et al., 2018). 2) Our measurement sites were concentrated in the middle part of the Hengduan Mountains, where low vegetation productivity and similar vegetation conditions are found in Ngari Prefecture. The results reported above suggest that uncertainties might be induced in the estimation of oxygen fluxes based on carbon and oxygen balance theory (Keeling and Shertz, 1992). The empirical estimation rather than the direct observation was commonly applied in previous studies (Zhang et al., 2018; Huang et al., 2021; Wei et al., 2021), and more fixed continuous observations and satellite remote sensing should also be considered in future studies. This would allow the development of a comprehensive understanding of the synergistic relationship between the spatiotemporal variability of oxygen and environmental conditions.
Conclusion
In this study, based on large-scale field investigations, we observe that altitude, vegetation, and climate factors explain up to 47% of the spatial variation in near-surface oxygen content in typical regions of the Qinghai-Tibetan Plateau. The selected regions vary significantly in oxygen content, with altitude explaining this variability at larger scales, while vegetation and climate factors play an important role at local scales. For example, the oxygen content was significantly correlated with altitude and MMT in the Ngari Prefecture and Hengduan Mountains and with NPP, FVC, LAI, and MMP in the Three-River Headwater Area and Qilian Mountains. The differential controls over oxygen content between altitudes should be incorporated into Earth system models to reduce uncertainties in forecasting oxygen dynamics.
These findings also imply that oxygen content is more sensitive to climate change in the Qilian Mountains and Three-River Headwater Area, and policy-makers should consider providing more differentiated subsidies to increase the adaptive capacity of local populations to climate change. This study was conducted on a relatively short time scale, and to gain more extensive results and insights, further research is warranted with long continuous observation.
Data Availability Statement
The original contributions presented in the study are included in the article/Supplementary Material, further inquiries can be directed to the corresponding author.
Author Contributions
HT contributed to the conception and planning of the research, and critically reviewed the manuscript. DL performed the experiments and analyzed the data. DL and HT checked the format and wrote the article. All authors have read and agreed to the published version of the manuscript.
Funding
This study was supported by the Second Tibetan Plateau Scientific Expedition and Research Program (STEP, Grants No. 2019QZKK0606).
Conflict of Interest
The authors declare that the research was conducted in the absence of any commercial or financial relationships that could be construed as a potential conflict of interest.
Publisher’s Note
All claims expressed in this article are solely those of the authors and do not necessarily represent those of their affiliated organizations, or those of the publisher, the editors and the reviewers. Any product that may be evaluated in this article, or claim that may be made by its manufacturer, is not guaranteed or endorsed by the publisher.
Supplementary Material
The Supplementary Material for this article can be found online at: https://www.frontiersin.org/articles/10.3389/fenvs.2022.902006/full#supplementary-material
References
Ao, S., Chiu, M.-C., Li, X., Tan, L., Cai, Q., and Ye, L. (2021). Watershed Farmland Area and Instream Water Quality Co-Determine the Stream Primary Producer in the Central Hengduan Mountains, Southwestern China. Sci. Total Environ. 770, 145267. doi:10.1016/j.scitotenv.2021.145267
Araujo, M., and New, M. (2007). Ensemble Forecasting of Species Distributions. Trends Ecol. Evol. 22, 42–47. doi:10.1016/j.tree.2006.09.010
Battle, M. O., Munger, J. W., Conley, M., Sofen, E., Perry, R., Hart, R., et al. (2019). Atmospheric Measurements of the Terrestrial O2 : CO2 Exchange Ratio of a Midlatitude Forest. Atmos. Chem. Phys. 19, 8687–8701. doi:10.5194/acp-19-8687-2019
Beall, C. M. (2007). Two Routes to Functional Adaptation: Tibetan and Andean High-Altitude Natives. Proc. Natl. Acad. Sci. U.S.A. 104, 8655–8660. doi:10.1073/pnas.0701985104
Cao, J., Wang, X., Adamowski, J. F., Biswas, A., Liu, C., Chang, Z., et al. (2020). Response of Leaf Stoichiometry of Oxytropis Ochrocephala to Elevation and Slope Aspect. Catena 194, 104772. doi:10.1016/j.catena.2020.104772
Cao, J., Wei, C., Adamowski, J. F., Biswas, A., Li, Y., Zhu, G., et al. (2021). On China's Qinghai-Tibetan Plateau, Duration of Grazing Exclosure Alters R:S Ratio, Root Morphology and Attending Root Biomass. Soil Tillage Res. 209, 104969. doi:10.1016/j.still.2021.104969
Chen, L., Fang, K., Wei, B., Qin, S., Feng, X., Hu, T., et al. (2021a). Soil Carbon Persistence Governed by Plant Input and Mineral Protection at Regional and Global Scales. Ecol. Lett. 24, 1018–1028. doi:10.1111/ele.13723
Chen, S.-t., Guo, B., Zhang, R., Zang, W.-q., Wei, C.-x., Wu, H.-w., et al. (2021b). Quantitatively Determine the Dominant Driving Factors of the Spatial-Temporal Changes of Vegetation NPP in the Hengduan Mountain Area During 2000-2015. J. Mt. Sci. 18, 427–445. doi:10.1007/s11629-020-6404-9
Gao, X., Dong, S., Xu, Y., Wu, S., Wu, X., Zhang, X., et al. (2019). Resilience of Revegetated Grassland for Restoring Severely Degraded Alpine Meadows Is Driven by Plant and Soil Quality along Recovery Time: A Case Study from the Three-River Headwater Area of Qinghai-Tibetan Plateau. Agric. Ecosyst. Environ. 279, 169–177. doi:10.1016/j.agee.2019.01.010
Guo, B., Han, B., Yang, F., Chen, S., Liu, Y., and Yang, W. (2020). Determining the Contributions of Climate Change and Human Activities to the Vegetation NPP Dynamics in the Qinghai-Tibet Plateau, China, from 2000 to 2015. Environ. Monit. Assess. 192, 663. doi:10.1007/s10661-020-08606-6
Guo, B., Wei, C., Yu, Y., Liu, Y., Li, J., Meng, C., et al. (2022). The Dominant Influencing Factors of Desertification Changes in the Source Region of Yellow River: Climate Change or Human Activity? Sci. Total Environ. 813, 152512. doi:10.1016/j.scitotenv.2021.152512
He, M., Fang, K., Chen, L., Feng, X., Qin, S., Kou, D., et al. (2021). Depth‐Dependent Drivers of Soil Microbial Necromass Carbon across Tibetan Alpine Grasslands. Glob. Change Biol. 28, 936–949. doi:10.1111/gcb.15969
Hobkirk, J. P., Damy, T., Walters, M., Bennett, A., Smith, S. J., Ingle, L., et al. (2013). Effects of Reducing Inspired Oxygen Concentration for One Hour in Patients with Chronic Heart Failure: Implications for Air Travel. Eur. J. Heart Fail. 15, 505–510. doi:10.1093/eurjhf/hft003
Huang, J., Liu, X., He, Y., Shen, S., Hou, Z., Li, S., et al. (2021). The Oxygen Cycle and a Habitable Earth. Sci. China Earth Sci. 64, 511–528. doi:10.1007/s11430-020-9747-1
Huang, M., Piao, S., Janssens, I. A., Zhu, Z., Wang, T., Wu, D., et al. (2017). Velocity of Change in Vegetation Productivity Over Northern High Latitudes. Nat. Ecol. Evol. 1, 1649–1654. doi:10.1038/s41559-017-0328-y
Jiao, S., Chen, W., Wang, J., Du, N., Li, Q., and Wei, G. (2018). Soil Microbiomes with Distinct Assemblies Through Vertical Soil Profiles Drive the Cycling of Multiple Nutrients in Reforested Ecosystems. Microbiome 6, 146. doi:10.1186/s40168-018-0526-0
Keeling, R. F., and Manning, A. C. (2014). “Studies of Recent Changes in Atmospheric O2 Content,” in Treatise on Geochemistry (Elsevier), 385–404. doi:10.1016/B978-0-08-095975-7.00420-4
Keeling, R. F., Najjar, R. P., Bender, M. L., and Tans, P. P. (1993). What Atmospheric Oxygen Measurements Can Tell Us About the Global Carbon Cycle. Glob. Biogeochem. Cycles 7, 37–67. doi:10.1029/92gb02733
Keeling, R. F., and Shertz, S. R. (1992). Seasonal and Interannual Variations in Atmospheric Oxygen and Implications for the Global Carbon Cycle. Nature 358, 723–727. doi:10.1038/358723a0
Liu, X., Huang, J., Huang, J., Li, C., Ding, L., and Meng, W. (2020). Estimation of Gridded Atmospheric Oxygen Consumption from 1975 to 2018. J. Meteorol. Res. 34, 646–658. doi:10.1007/s13351-020-9133-7
Lovett, G. M., Cole, J. J., and Pace, M. L. (2006). Is Net Ecosystem Production Equal to Ecosystem Carbon Accumulation? Ecosystems 9, 152–155. doi:10.1007/s10021-005-0036-3
Lueker, T. J., Keeling, R. F., and Dubey, M. K. (2001). The Oxygen to Carbon Dioxide Ratios Observed in Emissions from a Wildfire in Northern California. Geophys. Res. Lett. 28, 2413–2416. doi:10.1029/2000gl011860
Machta, L., and Hughes, E. (1970). Atmospheric Oxygen in 1967 to 1970. Science 168, 1582–1584. doi:10.1126/science.168.3939.1582
Minejima, C., Kubo, M., Tohjima, Y., Yamagishi, H., Koyama, Y., Maksyutov, S., et al. (2012). Analysis of ▵O2/▵CO2 Ratios for the Pollution Events Observed at Hateruma Island, Japan. Atmos. Chem. Phys. 12, 2713–2723. doi:10.5194/acp-12-2713-2012
Petsch, S. T. (2014). “The Global Oxygen Cycle,” in Treatise on Geo-Chemistry. Editors H. D. Holland, and K. K. Turekian. 2nd ed. (Amsterdam: Elsevier Ltd), 437–473. doi:10.1016/B978-0-08-095975-7.00811-1
Piao, S., Tan, K., Nan, H., Ciais, P., Fang, J., Wang, T., et al. (2012). Impacts of Climate and CO2 Changes on the Vegetation Growth and Carbon Balance of Qinghai-Tibetan Grasslands over the Past Five Decades. Glob. Planet. Change 98-99, 73–80. doi:10.1016/j.gloplacha.2012.08.009
Sanchez, G. (2013). PLS Path Modeling with R. Berkeley: Trowchez Editions, 383. Available at: http://creativecommons.org/licenses/by-nc-sa/3.0/.
Shen, M., Piao, S., Chen, X., An, S., Fu, Y. H., Wang, S., et al. (2016). Strong Impacts of Daily Minimum Temperature on the Green-Up Date and Summer Greenness of the Tibetan Plateau. Glob. Change Biol. 22, 3057–3066. doi:10.1111/gcb.13301
Shi, P., Chen, Y., Ma, H., Ye, T., Tang, H., and Wang, J. A. (2021a). Further Research on the Factors Contributing to Oxygen Concentration Over the Qinghai-Tibet Plateau. Chin. Sci. Bull. 66, 4028–4035. (in Chinese). doi:10.1360/TB-2021-0072
Shi, P., Chen, Y., Zhang, G., Tang, H., Chen, Z., Yu, D., et al. (2021b). Factors Contributing to Spatial-Temporal Variations of Observed Oxygen Concentration over the Qinghai-Tibetan Plateau. Sci. Rep. 11, 17338. doi:10.1038/s41598-021-96741-6
Tian, J., Zong, N., Hartley, I. P., He, N., Zhang, J., Powlson, D., et al. (2021). Microbial Metabolic Response to Winter Warming Stabilizes Soil Carbon. Glob. Change Biol. 27, 2011–2028. doi:10.1111/gcb.15538
Vingrys, A. J., and Garner, L. F. (1987). The Effect of a Moderate Level of Hypoxia on Human Color Vision. Doc. Ophthalmol. 66, 171–185. doi:10.1007/BF00140454
Wei, Y., Wu, J., Huang, J., Liu, X., Han, D., An, L., et al. (2021). Declining Oxygen Level as an Emerging Concern to Global Cities. Environ. Sci. Technol. 55, 7808–7817. doi:10.1021/acs.est.1c00553
Wu, H., Guo, B., Xue, H., Zang, W., Han, B., Yang, F., et al. (2021). What Are the Dominant Influencing Factors on the Soil Erosion Evolution Process in the Yellow River Basin? Earth Sci. Inf. 14, 1899–1915. doi:10.1007/s12145-021-00655-w
Yang, F., and Luo, Z. (2021). HUST-ERA5, an Hourly Global Atmospheric De-aliasing Product (2002–2020). Natl. Tibet. Plateau Data Cent. doi:10.11888/Geo.tpdc.271147
Zhang, H., Zhao, C. L., and Zhu, W. Q. (2021). A Real Vegetation Map of Qinghai-Tibet Plateau Produced with the Integrated Classification Method Based on Multi-Source Data Products. J. B Norm. Univ. Nat. Sci. 57, 816–824. (in Chinese). doi:10.12202/j.0476-0301.2021171
Zhang, L., Zhang, B., Li, W., Li, X., Sun, L., Jiang, L., et al. (2018). Spatiotemporal Changes and Drivers of Global Land Vegetation Oxygen Production Between 2001 and 2010. Ecol. Indic. 90, 426–437. doi:10.1016/j.ecolind.2018.03.041
Keywords: near-surface oxygen, altitude, vegetation coverage, qinghai-tibetan plateau (QTP), controlling factors
Citation: Liu D and Tang H (2022) Environmental Factors Affecting Near-Surface Oxygen Content Vary in Typical Regions of the Qinghai-Tibet Plateau. Front. Environ. Sci. 10:902006. doi: 10.3389/fenvs.2022.902006
Received: 22 March 2022; Accepted: 21 April 2022;
Published: 17 May 2022.
Edited by:
Ali Danandeh Mehr, Antalya Bilim University, TurkeyReviewed by:
Bing Guo, Shandong University of Technology, ChinaSadegh Partani, University of Bojnord, Iran
Copyright © 2022 Liu and Tang. This is an open-access article distributed under the terms of the Creative Commons Attribution License (CC BY). The use, distribution or reproduction in other forums is permitted, provided the original author(s) and the copyright owner(s) are credited and that the original publication in this journal is cited, in accordance with accepted academic practice. No use, distribution or reproduction is permitted which does not comply with these terms.
*Correspondence: Haiping Tang, tanghp@bnu.edu.cn