Vulnerability Assessment of Climate Change in Vietnam: A Case Study of Binh Chanh District, Ho Chi Minh City
 Dinh Duc Truong
 Tran Tho Dat2*
 - 1Faculty of Environmental, Climate Change and Urban Studies, National Economics University, Hanoi, Vietnam
- 2CFVG, Hanoi, Vietnam
Climate change poses additional obstacles to poverty eradication and social justice. Rising temperatures, abnormal rainfall increases, storms, floods, and droughts have become more frequent and severe phenomena in Vietnam. This causes serious consequences for the livelihood security of the poor. Binh Chanh district (Ho Chi Minh City) is an area subject to severe risks of climate change in the Mekong River Delta, Vietnam. Here, the low-income groups are the most vulnerable because their adaptive capacity is still limited and low. This study uses the livelihood vulnerability index (LVI) to assess the level of vulnerability to climate change in households and communes in the Binh Chanh district. LVI includes three components: exposure (E), sensitivity (S), and adaptive capacity (AC) based on 23 indicators selected by reviewing the literature and consulting with experts. The article also conducted surveys with 931 households in 16 administrative communes in Binh Chanh for primary data. The research results showed that Tan Kien and An Phu Tay communes have the highest level of vulnerability since they are areas with mainly low-lying terrain and contiguous location rivers; the people in these towns are also vulnerable groups because they do not have a stable source of income, skills, and have low education and experience in climate change adaptation. The study also proposes some solutions to improve the capacity to adapt to climate change of vulnerable communes specifically: 1) creating diversified livelihoods with stable incomes; 2) deploying community-based climate change adaptation models for communes adjacent to rivers; 3) implementing adaptive agriculture and improving social capital for vulnerable households; 4) building resettlement areas for households heavily affected by disasters; and 5) raising awareness among low-income households to respond to natural hazards in the context of climate change.
Introduction
Climate change has impacted so many communities, making them exposed to increasing threats and becoming more vulnerable. In the years to come, climate change will become more apparent and will spell disaster for many communities (IPCC 2007; ADB 2015; UNDRR 2019; World Bank 2020). For effective adaptation planning, scientific analyses of climate change in a macro context are essential (Garschagen 2013; Moe and Pathranarakul 2016; Mojtahedi and Oo, 2017). However, at the local level, it is the analysis and conclusions of regional stakeholders that provide the most relevant information and knowledge (Eakin and Bojorquez, 2008; Adger et al., 2009; Below et al., 2012; Kootval et al., 2015). Indigenous knowledge is also a reliable source of information, serving as a basis for policymaking and influencing policy. To ensure that development programs reduce people’s vulnerability to the effects of climate change, it is imperative that we understand who is vulnerable and why. We must then apply this information to design, implement, monitor, and evaluate activities (Cutter et al., 2003; Ford and Smit 2004; Vincent 2007; Deressa 2010).
Vietnam is one of the five countries most heavily affected by climate change (ADB 2013; ADPC 2021). In Vietnam, Ho Chi Minh City (HCMC) in the Mekong Delta is the economic engine of the country. However, according to the World Bank (2020), this is also the most vulnerable area to climate change due to its natural, economic, and social characteristics (Bubeck et al., 2012; Chau et al., 2013; Hung et al., 2014; Zevenbergen et al., 2018).
Binh Chanh district is a suburban district of HCMC with a convenient river system for agricultural development and waterway traffic. However, due to low-lying terrain, adjacent to large rivers, Binh Chanh is one of the districts at the highest risk of vulnerability to climate change, in which low-income households (poor and near-poor families) are the most affected because they have few resources and conditions to maintain and adapt to climate change (UNDP 2015; World Bank & GFDRR 2018, HCMC People Committee 2020). In recent years, the Binh Chanh district has been heavily affected by natural disasters and sea-level rise. The frequency of heavy rain tends to increase and concentrate in the rainy season, causing flooding and narrowing the arable land; the infrastructure system (production equipment, factories, internal traffic, drainage system, etc.) of industrial zones was heavily flooded, affecting the production process of enterprises. The rising sea level causes salinity in rice-growing areas and aquaculture ponds, leading to large economic damage. In addition, the climate change increases tropical diseases that threaten the people’s health (World Bank & GFDRR 2018, HCMC 2020).
To respond to climate change, the Binh Chanh district must conduct adaptation and mitigation actions simultaneously, in which the building capacity to adapt to climate change is the focus. However, the community’s ability to adapt to climate change is still limited, in which the ability to adapt to climate change of low-income households is still low, so they are the most vulnerable. Therefore, in order to actively respond to the climate change for households in the Binh Chanh district, the capacity building to adapt to climate change needs to be improved to effectively and promptly respond to the unpredictable changes of climate change.
The objective of this study was to assess the climate change vulnerability of communes in the Binh Chanh district, HCMC, and to evaluate the perception of households on adaptation and response to impacts of climate change, thereby proposing some solutions to improve the awareness and enhance the adaptive capacity to climate change for the district and its communities.
Study Area
Binh Chanh is a rural district located in the southwest of HCMC, Vietnam. It covers an area of 253 km2. The Bình Chanh district borders the Bình Tân district, Hoc Môn district, and Nha Be district (Figure 1). The natural area of the Binh Chanh district is fairly wide and long, of which the agricultural land still occupies a large part. In recent years, many technical and social infrastructure projects have been invested, helping to expand the urban space in the Binh Chanh district, the rural face “changing flesh” day by day. A part of the Binh Chanh district has also become a new urban area in the South of HCMC. Infrastructure, transport network synchronously connected with the central districts of Saigon, and convenient travel and trade make Binh Chanh’s population tend to increase rapidly (Binh Chanh District People Committee 2020; HCMC People Committee 2020,World Bank 2020).
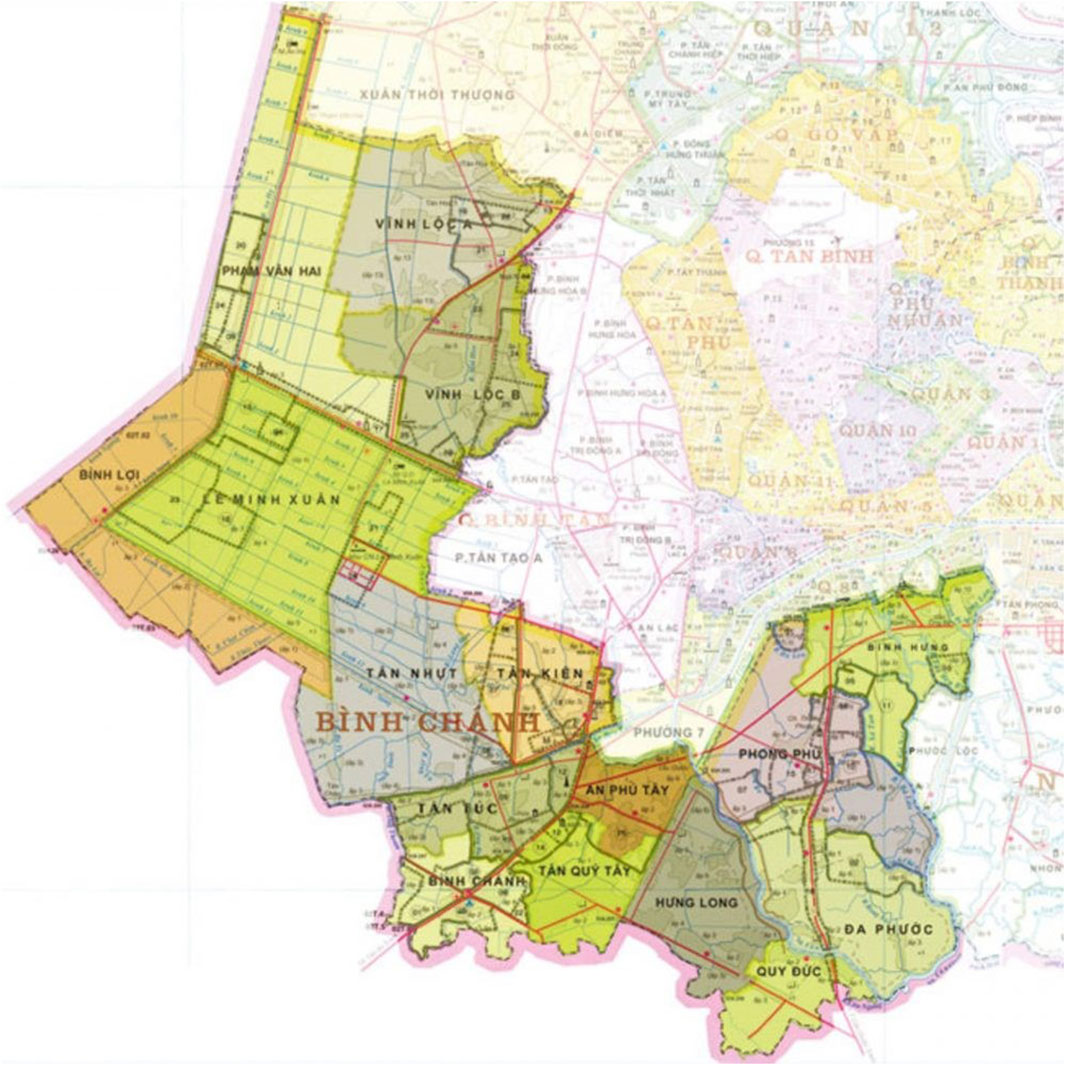
FIGURE 1. Binh Chanh district location in Ho Chi Minh City.
Positioned as a gateway to trade with the Mekong Delta, a large economic region in the South, the Binh Chanh district has gradually become a bridge for economic exchange between the Mekong Delta and the southeast economic region key industrial zones. From a district with a large area of agricultural land, the agricultural production reached a significantly higher share in the economic structure than in the inner city districts; Binh Chanh’s economic structure has quickly shifted to the industrial group—construction and trade services. With the advantage of a special location in regional linkages and convenient access to 13 provinces and cities of the Mekong Delta, Binh Chanh is a peril-urban district with potential for economic development and is now in the process of industrialization (Bubeck et at. 2012; Chau et al., 2014; Arouri et al., 2015).
The high urbanization rate has made Binh Chanh become one of the high population growth districts in the city. As of 2019, the district had a population of 680,000 with a population density of 2,793 people/km2. The Binh Chanh district has 16 affiliated commune-level administrative units, including Tan Tuc town (district capital) and 15 communes: an Phu Tay, Binh Chanh, Binh Hung, Binh Loi, Da Phuoc, Hung Long, Le Minh Xuan, Pham Van Hai, Phong Phu, Quy Duc, Tan Kien, Tan Nhut, Tan Quy Tay, Vinh Loc A, and Vinh Loc B (Binh Chanh District People Committee 2020).
During the 2015–2020 period, the district’s economy has developed stably, the proportion of industries and services has gradually increased, and the structure of the agricultural sector has shifted toward urban agriculture. In Binh Chanh, rice is the most important crop. It is grown in most of the communes. The other main food crops are maize, potatoes, and nuts. There are also plantations of banana and coconut, and most of them are found in Tan Qui Tay, Binh Loi, and Binh Hung communes. Agriculture is fairly labor-intensive in the district with farming activities being performed manually. During the tenure, the district has maintained an average annual growth rate of 20.5%/year, of which the industry—construction industry—has had a stable growth rate over the years, increasing by 20.9% on average; the trade, service industry has grown quite well, reaching an average of 20.6%/year; the average agricultural sector achieves 5.1%/year (Binh Chanh District People Committee 2020).
In terms of climate change impacts, due to its lowland natural features (nearly 60% of the total area is below the elevation of 1.5 m of sea level) and the terrain being divided by a system of rivers and canals, the Binh Chanh district is heavily affected by climate change. Currently, the district faces frequent flooding problems during the rainy season from June to November and the high tide cycle from September to December every year and the discharge from upstream of the Sai Gon–Dong Nai River. The atrophy of the tidal–rain—flood updated scenario (MONRE 2017) shows that the annual cropland area of the Binh Chanh district that is likely to be deeply flooded is 82.1% total annual acreage of the whole district (Figure 2). The flooded area of perennial crops in Binh Chanh is about 3,208 ha (77% total cultivation area). The majority of low-income households in Binh Chanh have their main livelihoods from farming, animal husbandry, and aquaculture and thus are highly vulnerable to bad weather and climate factors (Binh Chanh District People Committee 2020; HCMC People Committee 2020).
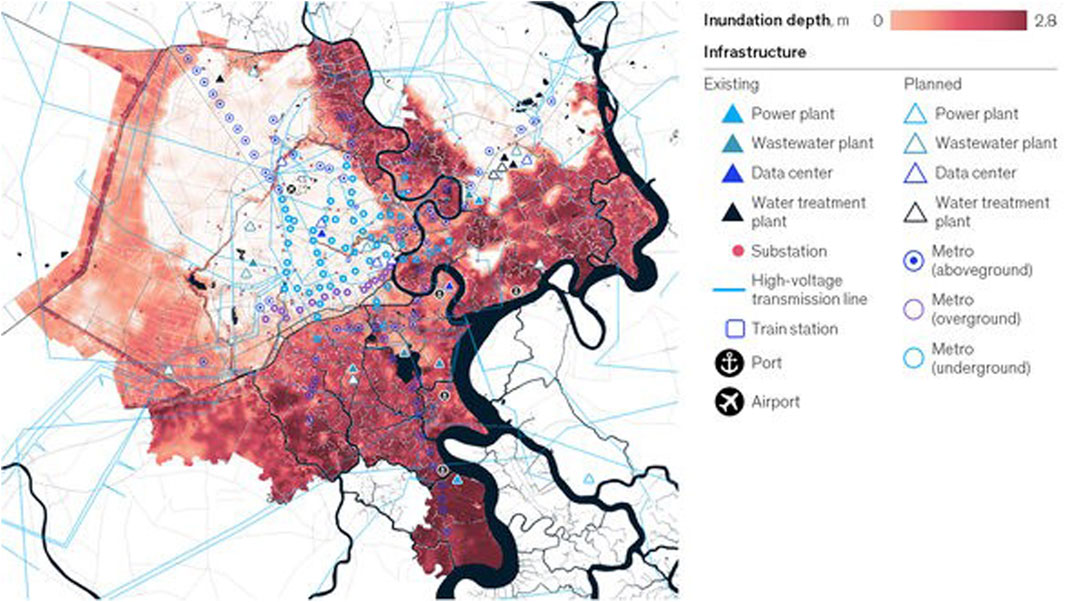
FIGURE 2. Inundation map of the Binh Chanh district.
Methodology and Data
Approaches to Assess Climate Change Vulnerability
According to IPCC (2012), vulnerability to climate change is defined as “the degree to which a system is susceptible to or unable to cope with the effects of climate change, including climate change and extremes”. McCarthy et al. (2001) also identified the three variables needed to assess vulnerability: exposure, sensitivity, and adaptive capacity. Exposure (E) is the nature and extent to which a system is exposed to significant changes in climate. Sensitivity (S) is the degree to which a system is affected either for good or bad by climate-related agents. The adaptive capacity (AC) reflects the ability of a system to adapt to climate change (including extreme events) or to mitigate its potential damage.
Although climate change is a global process, vulnerability is very site-specific (Hassan and Ringler 2009). Many scholars have, therefore, recommended the localized assessment of climate change vulnerability (Vincent 2007; Pandey and Jha, 2012a; Ahsan and Warner, 2014; Bosher et al., 2019). Hahn et al. (2009) and Urothody et al. (2010) recommended testing climate change vulnerability at the community level so that vulnerability of communities within a district or region can be compared. The indicator methods are widely used to assess climate change vulnerability. Because of the simplicity of aggregating indicators to form an index, different vulnerability indexes have been developed (Duriyapong and Nakhapakorn, 2011; Tessema et al., 2013; Wolf et al., 2013; Didar et al., 2015; Seinn et al., 2015).
This study uses the livelihood vulnerability index (LVI) developed by Hahn et al. (2009) for assessing the climate change vulnerability of the communes in Binh Chanh. This index can be estimated using primary data from households and commune levels.
LVI consists of seven main components including the socio-demographic profile (SDP), livelihood strategy (LS), natural hazards (NH), social network (SN), food (F), water (W), and health (H). Each component is composed of several indicators or sub-components. The indicators are standardized as follows:
Xij: normalized value of the indicator in commune j, Min Xij: minimum actual value of the indicator ij in all communes, and Max Xij: maximum actual value of the indicator ij in all communes.
The LVI uses a balanced weighted average approach where each sub-component contributes equally to the overall index. The LVI was calculated based on the sub-components of each of the major components. The average sub-component can be calculated after each index has been standardized by the following equation:
where Mt represents one of seven main components of LVI for the commune t, index St denotes the subcomponent, index by i and n is the number of sub-components in each major component. After sub-components of the commune t for each of the main components have been deduced, the LVI can be calculated as follows:
where LVIt is the livelihood vulnerability index for commune t, and i is the index of different households in commune t.
In addition, in this study, we also used an alternative method by IPCC for calculating LVI by combining the components of exposure, sensitivity, and adaptive capacity with the following equation:
CF j is contributing the components (exposure, sensitivity, and adaptive capacity) for commune j, Wmi is determined by sub-components setting up the vulnerability component, and Mij is the major component for j commune indexed by i.
LVI-IPCC is calculated by the following formula:
where E is the exposure index, AC is the adaptive capacity index, and S is the sensitivity index. LVI-IPCC ranges from –1 to +1, where –1 is the least vulnerable (adaptive capacity is more than exposure), 1 is extremely vulnerable (exposure is higher than the adaptive capacity), and 0 is moderately vulnerable (exposure and adaptive capacity are equal) (Khan 2012; Oo et al., 2018).
Selection of Indicators for Assessing LVI
The study selected a combination of vulnerability indicators that represent the seven components abovementioned from the studies of Hahn et al. (2009), Pandey and Jha (2012b), and Oo et al. (2018). The initial 37 indicators were taken out from these studies. Then, we interviewed experts on vulnerability, climate change, and livelihoods to filter out the most suitable indicators for LVI for the study. The authors consulted 10 experts including management agencies, local leaders, key farmers and NGO project leaders to assess the validity of indicators based on a 5-level Likert scale for each indicator (score 5 is very suitable, and score 1 is not very suitable). The final 23 indicators were chosen by all experts as suitable and very suitable, as follows: socio-demographic profile: household income per month (SDP1), the dependency ratio (SDP2), rate of poor households (SDP3), percentage of households with a head having no secondary school (SDP4), and percentage of households who have the burden of loan (SDP5).
Natural hazard: number of high tides causing flooding in the year (HZ1), percentage of flooded areas (HZ2), percentage of households with family members injured in recent disasters (HZ3), percentage of households reporting loss of livestock due to disaster (HZ4), percentage of households reporting a loss of assets due to disasters (HZ5), and percentage of households reporting not received early warning information (HZ6). Livelihood strategy: percentage of households using the natural resource for livelihood (LS1) and percentage of households dependent solely on agriculture as an income source (LS2).
Social network: number of local civic organizations attended by households (SN1), percentage of households not in receipt of government loans (SN2), and access to information (radio, television, and internet) (SN3).
Food: percentage of households lacking food in the last year (F1).
Water: percentage of households not using clean water (W1), percentage of households that utilize the natural water source (W2), and average for collecting water in a day by households (W3).
Health: percentage of households with a family member having health support from the local government (H1) and average time to the nearest health center (H2).
Data Collection
This study combines qualitative and quantitative data collection methods. From August to October 2021, the research team surveyed households in 16 communes of Binh Chanh to collect data.
The household sample was selected in two phases. First, we implemented a household spatial mapping in all communes. Then, we selected the households in each commune using random sampling based on a list of households provided by 16 communes’ People Committee (local government). According to Ho Chi Minh City Statistical Office (2020), 119,298 households are living in 16 studied communes with about 680,000 people (on average, each household has 5.7 people). The study uses the following formula (Creswell 2014) to estimate the number of sampled households:
where n is the sample size, N is the total number of households in the population, and e is the accepted errors. With e = 0.05 (the estimated error is 5%) and for a total population, the estimated number of households surveyed to ensure reliability was 931. Thus, 931 households were chosen (0.78% of total households). To ensure the representation, researchers selected 0.78% of households of each commune for the survey (Table 1).
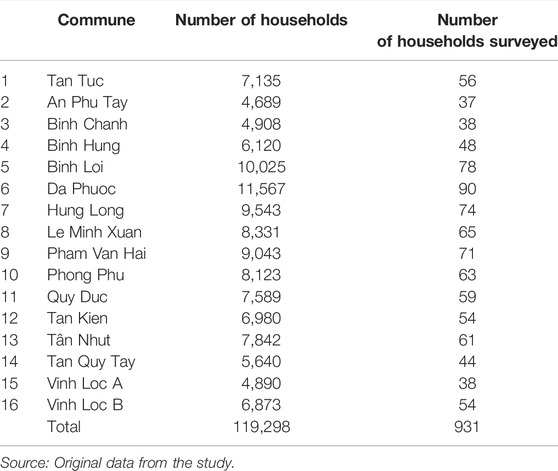
TABLE 1. Distribution of surveyed households by the communes in the Binh Chanh district.
In addition, data on flooded areas, inundation depth, and inundation time under exposure component are collected from data of the HCMC Flood Control Center; other data on the sensitivity and adaptive capacity indicator are collected from the data sources of the Statistical Yearbook of the Binh Chanh district in 2019 and 2020.
Results and Discussion
Overall Results of the Vulnerability Assessment
The results of the vulnerability assessment to climate change for major components of 16 communes in Binh Chanh district and LVIs are presented in Table 2. As shown, the normalized value of vulnerability indicators ranges from 0.445 to 0.812. From the result, the studied communes are divided into three groups: the first group is those with high exposure and sensitivity and low adaptive capacity (Da Phuoc, Quy Duc, Hung Long, An Phu Tay, and Tan Kien); the second group is the communes with medium exposure, sensitivity, and adaptive capacity (Tan Qui Tay, Tan Nhat, Tan Tuc, Binh Hung, and Phong Phu); and the third group is the communes with high adaptive capacity and low exposure and sensitivity (Binh Loi, Binh Chanh, Pham Van Hai, Le Minh Xuan, Vinh Loc A, and Vinh Loc B).
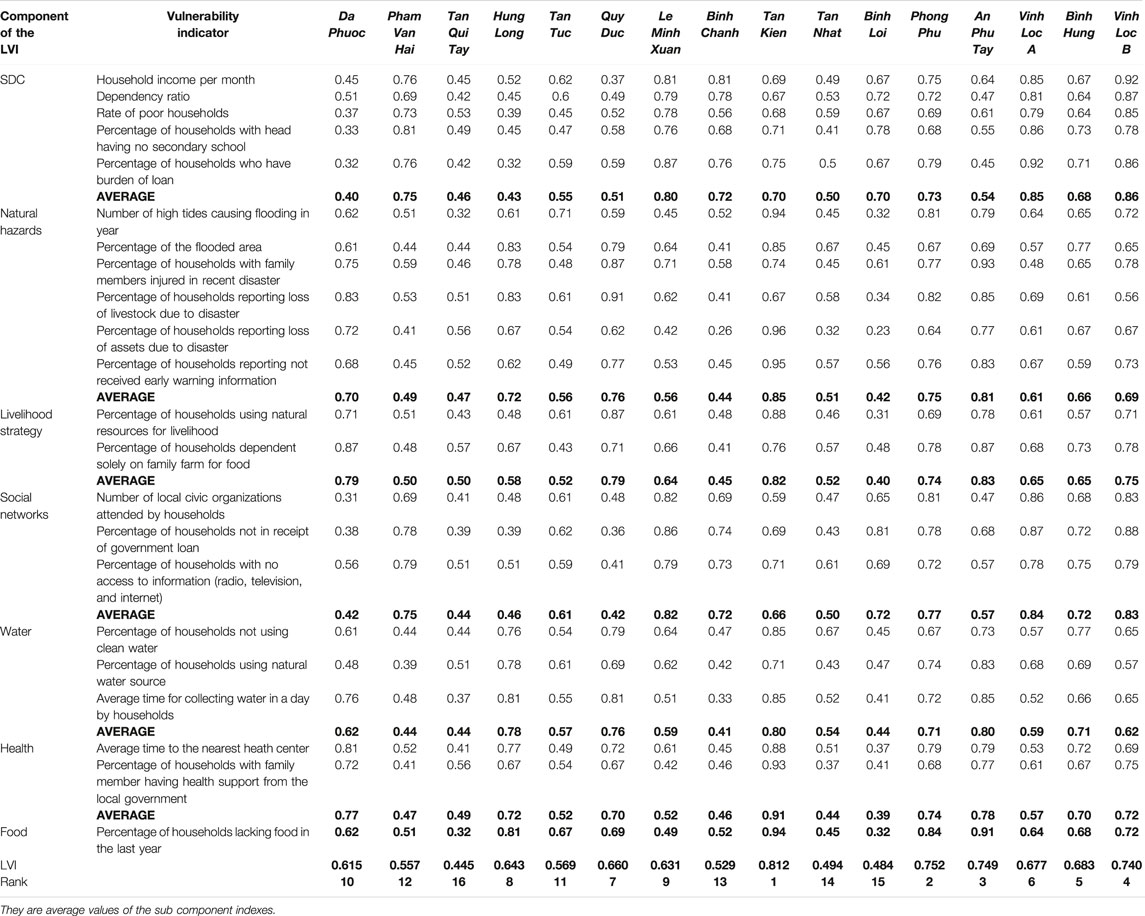
TABLE 2. Livelihood vulnerability index (LVI) of components for the communes of the Binh Chanh district.
The LVI index values are compared for 16 communes of Binh Chanh. Tan Kien is found to be the commune with the highest vulnerability to climate change (score: 0.812), followed by An Phu Tay (score: 0.752). In contrast, the least vulnerable commune is Tan Qui Tay (score: 0.445).
In terms of the exposure components, the score is highest in the Tan Kien commune (0.85) and the lowest in Binh Loi town (0.42). Tan Kien is also the commune with the highest sensitivity (0.86). This is a riverside commune, heavily affected by inundation and saltwater intrusion, and has many poor households and low socioeconomic conditions, leading to low adaptive capacity. In contrast, the Binh Loi commune is located deep in the mainland and has a fairly flat topography, not adjacent to rivers, so the impact of climate change/flood is not high compared to the communes adjacent to the rivers. In addition, because the income source of the people of Binh Loi commune is stable, their livelihood is less dependent on the climate, so they have the economic potential to purchase equipment and tools to cope with climate change. In terms of adaptive capacity, Da Phuoc commune has the lowest score (0.4), which is the best-adapting capacity town to climate change.
Socio-Demographic Profile
The first component of the LVI conceptual framework is SDP. As indicated in Table 2, Vinh Loc B is the most vulnerable town in terms of socioeconomic profile, with an average score of 0.86, followed by Vinh Loc A (0.85). Da Phuoc has the lowest vulnerability in this component (0.32). Zooming into this component, Vinh Loc A has the highest percentage (85%) of household heads with no secondary education, whereas in Tan Qui Tay, this number is only 33%. In fact, in the communes where the education level is low, then levels of formal and informal skills are also low and they affect the score of socio-demography in the studied communes. Also, Vinh Loc B has a higher dependency ratio than Vinh Loc A and Da Phuoc. The findings show that socioeconomic indicators and water and natural disaster indicators are most influential indicators of exposure and sensitivity in Vinh Loc B, Vinh Loc A, and Da Phuoc. This might lead to greater socioeconomic and climate change vulnerability in these communes than in the others. In this research, Hung Long has the lowest water, electricity, and health scores than other towns since this town is now fairly weak in providing clean water, sanitation equipment, health service, and basic infrastructure. In addition, An Phu Tay and Tan Kien have the highest exposure to the impact of natural disasters and climate change in terms of this vulnerability component index. In climatic events, such as the 2018–2019 floods, the agricultural lands in these towns were severely flooded and could not be used for cultivation. After floods, some areas of cultivable land would be lost, and some cannot be restored for planting. In addition, after disasters, households also lost cattle and household assets. Although the local government has worked hard for rehabilitation of the impacted areas, the situation has not fully recovered.
Natural Hazard
Tan Kien is shown as the highest vulnerability town (score: 0.85); the second most vulnerable commune is An Phu Tay, while Binh Loi is the least vulnerable (0.42). The farming households said that the loss of livestock impacted their livelihoods most, even more than assets or housing damages and losses. They also reported that the loss of human livestock is caused by the lack of climate change awareness by the local people and lack of disaster preparedness by the local government, as well as poor restoration and reconstruction processes after hazards. Thus, it is imperative to carry out climate change awareness-raising programs, preventive measures, and climate change adaptation solutions in the district.
Livelihood Strategies
The livelihood strategies of the households in the study area are diverse as the households’ knowledge and experience of disaster adaptation are different. Among the study communes, the livelihood index is best at Tan Nhat (0.40) and Binh Chanh (0.45) compared to the other towns. Of all the respondents in An Phu Tay, 78% reported that agriculture is still their main livelihood activity. The farming households say that lack of alternative income chances, especially off-season, is a big constraint for their livelihoods. As a result, the household members have to migrate to cities for jobs; 46.9% of the respondents in An Phu Tay indicated insufficient loan provision by the government. In addition, the lack of infrastructure and accessible markets are also the main challenges for developing households’ livelihoods in the study site.
Social Network
With the social network component, Vinh Loc A is the most vulnerable commune (0.84), while Vinh Loc B is the second most vulnerable town (0.83), and Da Phuoc is the least vulnerable commune (0.42). The households in Vinh Loc B town reported having an average of 3.3 local civic organizations to participate by their family, whereas this number for An Qui Tay and Quy Duc are only 2.7 and 2.4, respectively. The households indicated that participating in local organizations is good not only for livelihoods and networks but also for sharing hazard information among the community members and local agencies. A better access to credit and information can be ensured by improving the social capital. Thus, enhancing the social capital and social involvement is important to reduce the risks of disasters for poor households in light of a changing climate.
Water and Health
In terms of water indicators, Tan Kien and An Phu Tay are the most vulnerable towns with a score of 0.8, whereas Binh Chanh is found to be the least vulnerable commune with a score of 0.41. The majority of the households in Tan Kien and An Phu Tay limited access to clean piped water, rather they have to take water from ponds or rain. The average time spent collecting water is maximum at An Phu Tay and Tan Kien (nearly 3 h a day). Water is normally collected by women, and spending more time collecting water might affect the time for the household—caring with females. In addition, the lack of access to clean water would result in water-related illnesses and diseases. Therefore, the farmers reported that improving water management and provision is crucial in the Binh Chanh district.
Two indicators are used to make up the health component (“percentage of households with family members having health support from the local government” and “average time to the nearest health center”). When aggregated, Tan Kien again is found to be the most vulnerable health commune (0.91). The average time for reaching the nearest health center is the highest in this town due to poor infrastructure and communication systems. The poor access to health care services might result in a decrease in public health, hence increasing community vulnerability to natural hazards and climatic events.
Food
Foodstuff is another important item for adaptation to disasters and climatic impacts. These indicators are worse in Tan Kien and Vinh Loc B, whereas tan Qui Tay and Binh Lo have the lowest score (0.32). The survey indicates that farming is the primary profession for households in Binh Chanh. On average, 32.5% of the total households in Binh Chanh rely on non-cash food sources. The local people reported that on average, 2.9 months annually they have to struggle to provide sufficient food for families, especially during the off and inter-cultivation times.
Table 3 represents the vulnerability scores with a ranking according to LVI-IPCC for all communes of the study area. For LVI-IPCC index, the results are fairly consistent where households in Tan Kien and An Phu Tay towns are more vulnerable than those in other communes. This is because households in the three aforementioned communes are more exposed to disasters such as salt intrusion and flood while having low adaptive capacity. This LVI-IPCC index indicates that Vinh Loc A is the least vulnerable commune.
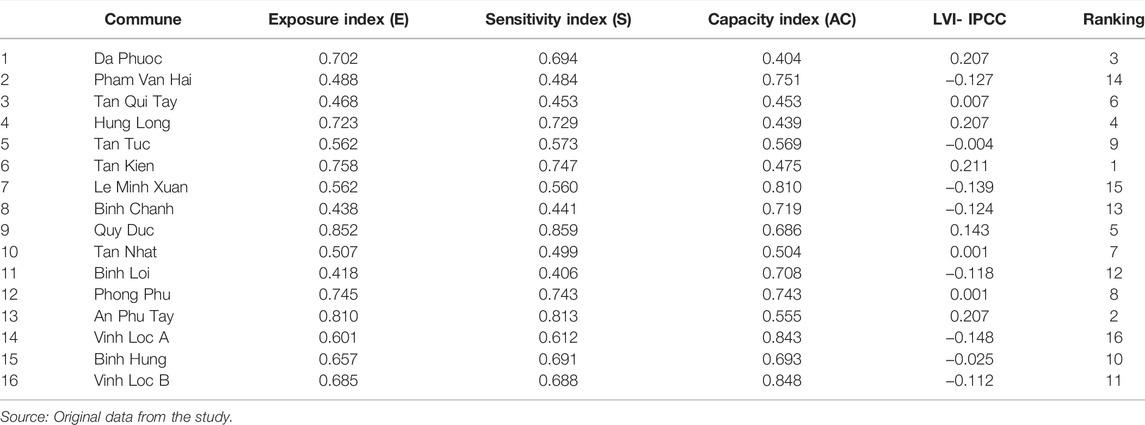
TABLE 3. LVI-IPCC for communes in the Binh Chanh district.
In both LVI assessment approaches, Binh Loi and Tay Qui Tay are the communes least affected by natural hazards and climate change in Binh Chanh. This is because these communes have medium exposure levels and better socioeconomic conditions and adaptive capacity. Among the 16 communes, Tan Kien is the most vulnerable commune with the highest level of exposure to natural disasters while having a low level of adaptive capacity, making this town more vulnerable than the others.
Recommendations to Improve Climate Change Adaptation Capacity of Households in the Binh Chanh District
Based on the abovementioned finding and combined with in-depth interviews relating livelihoods and climate change management stakeholders in Binh Chanh, some recommendations are raised as follows:
First, preparing disaster risk management strategies to reduce exposure, promoting climate change adaptation strategies, and strengthening the adaptive capacity of farm households should be the top priority. The study results show that the lack of households’ access to fundamental infrastructure, opportunities for additional income, and sole dependence on agriculture make households more sensitive to the impacts of climate change. Thus, their capacity needs to be improved so that they can make choices and turn these choices into actions to respond to climate change/disaster to ensure more stable current and future livelihoods.
Community-based adaptation (CBA) can be a good strategy for climate change management at Binh Chanh. CBA is a critical component of avoidance and management of climate change impacts by local community. It provides information on the potential impacts of CC and mitigation measures with location-specific and community-managed characteristics. CBA also provides information needs that can be replicated in a suitable way acceptable by the local communities (UNDP 2015). For example, ịn Binh Chanh, converting rice farming to high-tech shrimp farming is a new direction (Le Minh Xuan is the leading commune to deploy an effective high-tech shrimp farming model, which is now being replicated in other communes for development). The shrimp farming model applying high technology in the Le Minh Xuan commune has effectively contributed to changing the community’s awareness and income, which improves the capacity to adapt to climate change. In addition, strengthening the capacity and participation of the community, focusing on local response experiences, the role of grassroots mass organizations develop, multiplying traditional models, and experiences in climate change adaptation should also be carried out since the more social capital a household has, the better they can access to a source of information and resource for enhancing the adaptive capacity.
Second, this study has shown that the lack of adaptive capacity of local people (socioeconomic, social networks, and livelihood strategies) is a main cause of climate change vulnerability. Therefore, it would be good if the local governments encourage increased investments in education and income diversification. Moreover, we should develop a micro-finance mechanism for local farmers, providing basic infrastructure, sanitation equipment, clean water, electricity, and setting up more health community centers. In addition, HCMC government managers need to implement a detailed assessment of the impacts of disasters on local livelihoods so that they can design suitable preventive measures aimed at promoting the adaptive capacity and reducing vulnerability to climate change.
Third, this study found that lack of early warning systems and climate information is also a major indicator of climate change vulnerability of households to saltwater intrusion and natural hazards. Therefore, an early warning climate information system should be established in the communes to reduce the potential for loss of property through natural disasters. The localities located adjacent to rivers need to build proper flood control facilities and tidal control infrastructure, including rigid flood control systems (e.g., tidal sluices and flood barriers). Building resettlement areas for households affected by climate change should also be performed. Da Phuoc, An Phu Tay, and Tan Kien communes need to plan resettlement areas for the low-income households living near the banks of rivers and canals that are at the risk of landslides and flooding. At the same time, the commune authorities need to support the jobs and sustainable livelihood transformation solutions (e.g. agricultural and fishery extension services).
Fourth, it is necessary to continue raising public awareness of disaster risk management, specifically the awareness of local authorities and people working in disaster prevention, businesses, and residents with the motto “prevention is key”. This is an important solution to limit risks from natural disasters. Also, it would be good to diversify the forms of training activities, training and drills on natural disaster prevention and control, information, propaganda, communication and knowledge dissemination activities, and organize seminars and conferences to share the lessons learned in disaster prevention. Along with that, HCMC authorities should deploy the acquisition, research, and transfer of information technology and support tools to the vulnerable people, at the same time carrying out natural disaster awareness raising activities in the school system in disaster vulnerable areas.
Conclusion
This study examines the vulnerability to climate change of households in the Binh Chanh district in the Mekong River Delta in Vietnam. It estimates the LVI assessment method and compares the vulnerability indexes for 16 communes in the studied district. The indicators of different components show different vulnerability levels for different communes. The LVI and LVI-IPCC indexes indicate that residents in Tan Kien town are the most vulnerable people. This study confirms that farm households that fail to adopt any strategies for adaptation to the impacts of climate change are more vulnerable than adapted households.
The results also indicated that majority of the communes are highly vulnerable with high exposure and sensitivity levels compared to adaptive capacity. The local people still depend much on natural resources for maintaining livelihoods which means that the livelihoods of poor and nearly poor households are regulated by nature. The dependency on primary occupation makes the situation worse. Unskilled citizens have fewer employment opportunities and hence move to other areas for survival. The social ties facilitate local networks and improve support from local associations and government. The impacted people have to live to survive in poor situations by struggling with various natural hazards and lacking the capacity for changing their situation.
If the vulnerable areas get special supports and priorities by enhancing the perception of local households about climate change vulnerability (social, economic, and environmental factors), they can improve their resilience to face the challenges of climate change. This study has proposed some solutions to improve the awareness, adaptive capacity, and response to climate change for impacted households. In addition, this study consults managers and scientists to have a multidimensional view of the capacity to adapt to climate change for local households. The results are intended to provide a database to serve the overall socioeconomic planning and development of the locality toward climate change adaptation. However, this study is limited in terms of spatial investigation, so it is necessary to expand the research area in the future.
Data Availability Statement
The original contributions presented in the study are included in the article/Supplementary Material; further inquiries can be directed to the corresponding author.
Author Contributions
DT and TD conceived of the presented idea. NH and LH developed the theory and performed the computations. NH verified the analytical methods. DT and TD supervised the findings of this work. All authors discussed the results and contributed to the final manuscript.
Funding
This research is funded by the National Economics University, Vietnam.
Conflict of Interest
The authors declare that the research was conducted in the absence of any commercial or financial relationships that could be construed as a potential conflict of interest.
Publisher’s Note
All claims expressed in this article are solely those of the authors and do not necessarily represent those of their affiliated organizations, or those of the publisher, the editors, and the reviewers. Any product that may be evaluated in this article, or claim that may be made by its manufacturer, is not guaranteed or endorsed by the publisher.
References
ADB (2013). Vietnam Environment and Climate Change Assessment. Metro Manila, Philippines: Asian Development Bank.
ADB (2015). Strengthening City Disaster Risk Financing in Vietnam. Metro Manila, Philippines: Asian Development Bank.
Adger, W. N., Dessai, S., Goulden, M., Hulme, M., Lorenzoni, I., Nelson, D. R., et al. (2009). Are There Social Limits to Adaptation to Climate Change? Clim. Change 93, 335–354. doi:10.1007/s10584-008-9520-z
Ahsan, M. N., and Warner, J. (2014). The Socioeconomic Vulnerability Index: A Pragmatic Approach for Assessing Climate Change Led Risks—A Case Study in the South-Western Coastal Bangladesh. Intern. J. Disaster Risk Reduc. 8, 32–49. doi:10.1016/j.ijdrr.2013.12.009
Arouri, M., Nguyen, C., and Youssef, A. B. (2015). Natural Disasters, Household Welfare, and Resilience: Evidence from Rural Vietnam. World Dev. 70, 59–77. doi:10.1016/j.worlddev.2014.12.017
Asian Disaster Preparedness Center (ADPC) (2021). Disaster Risk Reduction in Vietnam: Status Report 2020. Bangkok, Thailand: United Nations Office for Disaster Risk Reduction UNDRR.
Below, T. B., Mutabazi, K. D., Kirschke, D., Franke, C., Sieber, S., Sieber, R., et al. (2012). Can Farmers' Adaptation to Climate Change Be Explained by Socio-Economic Household Level Variables? Glob. Environ. Change 22, 223–235. doi:10.1016/j.gloenvcha.2011.11.012
Bosher, L., Dainty, A., Carrillo, P., Glass, J., Price, A., and Price, A. (2009). Attaining Improved Resilience to Floods: a Proactive Multi‐stakeholder Approach. Disaster Prev. Manag. Int. J. 18, 9–22. doi:10.1108/09653560910938501
Bubeck, P., Botzen, W. J. W., Suu, L. T. T., and Aerts, J. C. J. H. (2012). Do flood Risk Perceptions Provide Useful Insights for Flood Risk Management? Findings from Central Vietnam. J. Flood Risk Manage 5, 295–302. doi:10.1111/j.1753-318X.2012.01151.x
Chau, V. N., Cassells, S., and Holland, J. (2014). Economic Impact upon Agricultural Production from Extreme Flood Events in Quang Nam, Central Vietnam. Nat. Hazards. 75, 1747–1765. doi:10.1007/s11069-014-1395-x
Chau, V. N., Holland, J., Cassells, S., and Tuohy, M. (2013). Using GIS to Map Impacts upon Agriculture from Extreme Floods in Vietnam. Appl. Geogr. 41, 65–74. doi:10.1016/j.apgeog.2013.03.014
Creswell, J. W. (2014). Research Design: Qualitative, Quantitative, and Mixed-Method Approaches. Fourth ed. Thousand Oaks: California SAGE Publications, Inc. (International student edition ed).
Cutter, S. L., Boruff, B. J., and Shirley, W. L. (2003). Social Vulnerability to Environmental Hazards. Soc. Sci. Q. 84 (2), 242–261. doi:10.1111/1540-6237.8402002
Deressa, T. T. (2010). Assessment of the Vulnerability of Ethiopian Agriculture to Climate Change and Farmers' Adaptation Strategies. Ph.D. Thesis. Pretoria SA: University of Pretoria. Available at: http://hdl.handle.net/2263/28969.
Didar, I., Bhuiyan, M., and Ramanathan, A. I. (2015). Climate Change Impacts and Vulnerability Assessment in Coastal Region of Bangladesh: A Case Study on Shyamnagar Upazila of Satkhira District. J. Clim. Change 1 (2), 37–45. doi:10.3233/JCC-150003
Duriyapong, F., and Nakhapakorn, A. (2011). Coastal Vulnerability Assessment: a Case Study of SamutSakhon Coastal Zone. Sonklanakarin J. Sci. 33 (4), 469–476. doi:10.4314/sajg.v4i2.5
Eakin, H., and Bojórquez-Tapia, L. A. (2008). Insights into the Composition of Household Vulnerability from Multicriteria Decision Analysis. Glob. Environ. Change 18, 112–127. doi:10.1016/j.gloenvcha.2007.09.001
Ford, J. D., and Smit, B. (2004). A Framework for Assessing the Vulnerability of Communities in the Canadian Arctic to Risks Associated with Climate Change. Arctic 3, 389–400. doi:10.14430/arctic516
Garschagen, M. (2013). Resilience and Organisational Institutionalism from a Cross-Cultural Perspective: an Exploration Based on Urban Climate Change Adaptation in Vietnam. Nat. Hazards. 67, 25–46. doi:10.1007/s11069-011-9753-4
Hahn, M. B., Riederer, A. M., and Foster, S. O. (2009). The Livelihood Vulnerability Index: a Pragmatic Approach to Assessing Risks from Climate Variability and Change-A Case Study in Mozambique. Glob. Environ. Change 19, 74–88. doi:10.1016/j.gloenvcha.2008.11.002
Hassan, R. M., and Ringler, C. (2009). Assessing Household Vulnerability to Climate Change: The Case of Farmers in the Nile Basin of Ethiopia. Washington, D.C: International Food Policy Research Institute. IFPRI Discussion Paper No. 00935.
Hung, N. N., Delgado, J. M., Güntner, A., Merz, B., Bárdossy, A., and Apel, H. (2014). Sedimentation in the Floodplains of the Mekong Delta, Vietnam. Part I: Suspended Sediment Dynamics. Hydrol. Process. 28, 3132–3144. doi:10.1002/hyp.9856
Intergovernmental Panel on Climate Change (IPCC) (2012) Managing the Risks of Extreme Events and Disasters to Advance Climate Change Adaptation. A Special Report of Working Groups I and II of the Intergovernmental Panel on Climate Change. Editors C. B. Field, V. Barros, T. F. Stocker, D. Qin, D. J. Dokken, K. L. Ebiet al. (Cambridge, UK: Cambridge University Press)
Khan, S. (2012). Vulnerability Assessments and Their Planning Implications: a Case Study of the Hutt Valley, New Zealand. Nat. Hazards. 64, 1587–1607. doi:10.1007/s11069-012-0327-x
Kootval, H., Davidson, J., and Wong, M. (2015). Guidelines on Integrating Severe Weather Warnings into Disaster Risk Management. Switzerland: World Meteorological Organization.
McCarthy, J. J., Canzlani, O. F., Leary, N. A., Dokken, D. J., and White, K. S. (2001). “Climate Change 2001: Impacts, Adaptation, and Vulnerability,” in Contribution of Working Group II to the Third Assessment Report of the Intergovernmental Panel on Climate Change (Cambridge: Cambridge University Press).
Moe, T., and Pathranarakul, P. (2016). An Integrated Approach to Natural Disaster Management: Public Project Management and its Critical Success Factors. Disaster Prev. Manag. Int. J. 15, 396–413. doi:10.1108/09653560610669882
Mojtahedi, M., and Oo, B. L. (2017). Critical Attributes for Proactive Engagement of Stakeholders in Disaster Risk Management. Int. J. Disaster Risk Reduct. 21, 35–43. doi:10.1016/j.ijdrr.2016.10.017
Oo, A. T., Huylenbroeck, G. V., and Speelman, S. (2018). Assessment of Climate Change Vulnerability of Farm Households in Pyapon District, a Delta Region in Myanmar. Int. J. Disaster Risk Reduct. 28, 10–21. doi:10.1016/j.ijdrr.2018.02.012
Pandey, M. K., and Jha, A. (2012a). Widowhood and Health of Elderly in India: Examining the Role of Economic Factors Using Structural Equation Modeling. Int. Rev. Appl. Econ. 26 (1), 111–124. doi:10.1080/026921.71.2011.587109
Pandey, R., and Jha, S. (2012b). Climate Vulnerability Index - Measure of Climate Change Vulnerability to Communities: a Case of Rural Lower Himalaya, India. Mitig. Adapt Strateg. Glob. Change 17 (5), 487–506. doi:10.1007/s11027-011-9338-2
Seinn, S. M. U., Ahmad, M. M., Thapa, G. B., and Shrestha, P. P. (2015). Farmers' Adaptation to Rainfall Variability and Salinity through Agronomic Practices in Lower Ayeyarwady Delta, Myanmar. J. Earth Sci. Clim. Change 6, 258. doi:10.4172/2157-7617.1000258
Tessema, Y. A., Aweke, C. S., and Endris, G. S. (2013). Understanding the Process of Adaptation to Climate Change by Smallholder Farmers: the Case of East Hararghe Zone, Ethiopia. J. Agric. Food Econ. 1, 13. doi:10.1186/2193-7532-1-13
UNDP (2015). Vietnam Special Report on Managing the Risks of Extreme Events and Disasters to Advance Climate Change Adaptation. Hanoi, Vietnam.
UNDRR (2019). Global Assessment Report on Disaster Risk Reduction. GenevaGeneva: United Nations Office for Disaster Risk Reduction.
Urothody, A. A., and Larsen, H. (2010). Measuringclimate Change Vulnerability: a Comparison of Two Indexes Bank. Janakari 20 (1), 9–16. doi:10.3126/banko.v20i1.3503
Vincent, K. (2007). Uncertainty in Adaptive Capacity and the Importance of Scale. Glob. Environ. Change 17 (1), 12–24. doi:10.1016/j.gloenvcha.2006.11.009
Wolf, S., Hinkel, J., Hallier, M., Bisaro, A., Lincke, D., Ionescu, C., et al. (2013). Clarifying Vulnerability Definitions and Assessments Using Formalisation. Int. J. Clim. Change Strateg. Manag. 5 (1), 54–70. doi:10.1108/17568691311299363
World Bank (2020). Resilient Shores: Vietnam's Coastal Development between Opportunity and Disaster Risk. Washington, DC: World Bank. Available at: https://openknowledge.worldbank.org/handle/10986/34639.
World Bank and GFDRR (2018). Mainstreaming Disaster Resilience in Vietnam: Engaging with Communities to Build Resilience. Available at: https://reliefweb.int/report/viet-nam/mainstreaming-disaster-resilience-vietnam-engaging-communities-build-resilience.
Keywords: climate change, vulnerability, exposure, sensitivity, LVI, Ho Chi Minh City
Citation: Truong DD, Dat TT, Hang ND and Huan LH (2022) Vulnerability Assessment of Climate Change in Vietnam: A Case Study of Binh Chanh District, Ho Chi Minh City. Front. Environ. Sci. 10:880254. doi: 10.3389/fenvs.2022.880254
Received: 21 February 2022; Accepted: 16 May 2022;
Published: 28 June 2022.
Edited by:
Kun Guo, University of Chinese Academy of Sciences, ChinaReviewed by:
Zhewen Liao, Beijing Financial Holdings Group, ChinaHui Liu, China Institute of Water Resources and Hydropower Research, China
Copyright © 2022 Truong, Dat, Hang and Huan. This is an open-access article distributed under the terms of the Creative Commons Attribution License (CC BY). The use, distribution or reproduction in other forums is permitted, provided the original author(s) and the copyright owner(s) are credited and that the original publication in this journal is cited, in accordance with accepted academic practice. No use, distribution or reproduction is permitted which does not comply with these terms.
*Correspondence: Tran Tho Dat, tranthodat@neu.edu.vn