Distribution Characteristics and Formula Revision of Lightning Current Amplitude and Cumulative Probability in Zhejiang Province
 Li Xia
 Song Nannan3*
 - 1Key Laboratory for Aerosol-Cloud-Precipitation of China Meteorological Administration, Collaborative Innovation Center on Forecast and Evaluation of Meteorological Disaster, Nanjing University of Information Science and Technology, Nanjing, China
- 2State Key Laboratory of Severe Weather, Chinese Academy of Meteorological Sciences, Beijing, China
- 3Tianjin Meteorological Disaster Defense Technology Centre, Tianjin, China
- 4Meteorological Bureau in Taizhou, Taizhou, China
The cumulative probability distribution of the lightning current amplitude can reflect the lightning activity and is important for the lightning protection engineering technology. Based on the lightning location data from 2009 to 2019, the distribution characteristics of the lightning current amplitude and cumulative probability are studied. The results show that a total of 8,634,858 lightning flashes occurred in Zhejiang province in last 11 years. Negative flashes are much more common than positive ones, accounting for 87.44% of the total. The percentage of the lightning current amplitude between 2 and 100 kA is 94.3%. The average amplitude of positive flashes is significantly higher than that of negative flashes. For the current amplitude of positive flashes, the peak occurs in March and gradually decreases with the increase of the month, reaching its lowest in December. But the monthly distribution of negative flashes is relatively concentrated, especially from February to October. When lightning current amplitude is higher than 25.5 kA, the cumulative probability of positive flashes is significantly higher than that of negative flashes and vice versa. The cumulative probability distribution of negative flashes is closer to that of total flashes and is significantly different from that of positive flashes. In order to get a more suitable cumulative probability formula of lightning current amplitude and corresponding parameters in Zhejiang province, the Levenberg–Marquardt method is used. By fitting the measured data with the formulas recommended by the Institute of Electrical and Electronics Engineers (IEEE) and Electric Power Industry Standard of China (Code for design of overvoltage protection and insulation coordination for AC electrical installations GB/T 50064-2014), respectively, the correlation coefficients of different polarities are obtained. By comparing the aforementioned two fitting results, it is found that the formula recommended by the IEEE can more objectively reflect the probability distribution characteristics in Zhejiang province, and the accuracy of the derived formula is verified by using the lightning current data in 2020. It shows that the curve based on the measured values is consistent with that fitted by the IEEE formula but quite different from that fitted by the GB/T 50064-2014 formula.
Introduction
As lightning discharges often lead to lightning disasters (Paisios et al., 2007; Ma et al., 2008; Chemartin et al., 2012), the study of lightning physical characteristics has become more and more important (Finke and Hauf, 1996; Christian et al., 2003; Pinto et al., 2003; Soriano et al., 2005; Fleenor et al., 2009). Lightning’s current amplitude of return stroke is one of its important parameters, closely responding to the lightning disaster. The cumulative probability of the lightning current amplitude has been widely used in the lightning protection engineering technology, which represents the distribution of lightning current amplitude (Yue et al., 2013; Zhao et al., 2017). The precise expression is useful for studying lightning activity, protecting the transmission line, and assessing the lightning disaster risk (Metwally t al. 2004; Zhang et al., 2011; He et al., 2017).
At present, more researchers have been studying about lightning current amplitude (Borghetti et al., 2004; Chowdhuri et al., 2005). As early as the 1880’s, Kohlrausch had carried out the work of measuring the lightning current amplitude (Kohlrausch et al., 1888). Pobolansky (1977) proposed a formula for calculating the cumulative probability of lightning current amplitude based on data in Europe, Australia, and the United States (Shim et al., 2002). Thereafter, considerable progress has also been made on proposing different calculation formulas based on data in different regions (Grant et al., 1985; Orville and Huffines, 1999). The approximate expression of the cumulative probability of the lightning current amplitude was first given by Anderson based on the data of Berger, which was later recommended by the IEEE (Anderson et al., 1980). In China, the regulation method is mainly used to calculate the cumulative probability of lightning current amplitude in the lightning protection engineering technology (Du., 1996; Li, R.F et al., 2011). The corresponding logarithmic expression is recommended by GB/T 50064-2014. In the early days, lightning data were lacking, and the parameters of the formula were obtained by inversion using the data recorded by the Xinhang line from 1962 to 1987 (Li et al., 2019). It is still in use today.
Due to the vast territory and environmental differences in China, using the identical parameters in different regions shows great uncertainty. For example, the calculation results indicate that the most prominent manifestation is not wholly accurate, and thus, it perhaps cannot accurately reflect the cumulative probability of lightning current amplitude in the area, which affects its application in engineering. With the widespread application of lightning location systems, most of the systems have been running for more than 10 years. A large amount of lightning data has been accumulated, and so it provides the basis for research on parameters of temporal and spatial differences, such as lightning current amplitude and its cumulative probability (Wang et al., 2016; Zhao et al., 2018; Li et al., 2019). Li, J.Q et al. (2011) found that significant differences lay in the distribution characteristics of the cumulative probability of lightning current amplitude with the polarity in Chongqing, and the cumulative probability formulas recommended by the IEEE had better fitting effects than other formulas. Cheng et al. (2021) found that the cumulative probability curve of lightning current amplitude dropped faster in the interval of 20–50 kA and was consistent with the IEEE recommended formula in Liaoning. These research results provide the distribution characteristics of the lightning current amplitude and cumulative probability that are suitable for local use.
There is a subtropical monsoon climate with frequent lightning disasters in Zhejiang province, which lies in the central-eastern part of China. According to statistics, there were 9,728 recorded lightning disasters from 1998 to 2020, including 357 casualties, 282 injuries, and 307 deaths (Gu et al., 2021). The temporal and spatial characteristics of lightning activities have been mainly studied based on the lightning location system in Zhejiang province (Liu et al., 2009; Cui et al., 2021; Zhang et al., 2021). But the relevant research on lightning current amplitude and cumulative probability has not been carried out. Based on the lightning location system in Zhejiang province from 2009 to 2019, this article studies the characteristics of lightning current amplitude and localizes its parameters in the cumulative probability formula. The accuracy of the calculation results is helpful to the development of the lightning protection engineering technology.
Data and Methods
The data are collected by using the lightning location positioning system of the Meteorological Departments in Zhejiang province. The system is uniformly deployed by the China Meteorological Administration, and it has 11 substations in Zhejiang province, which are shown in Figure 1. Also, it has a monitoring accuracy of 300 m and a detection efficiency of over 85%. Based on the principle of magnetic field positioning and time difference positioning, the system can accurately determine the location and time of a lightning occurrence, using satellite positioning systems and geographic information systems. It is mainly used for the detection of cloud-to-ground flashes and provides basic data for the study of the physical characteristics of lightning current.
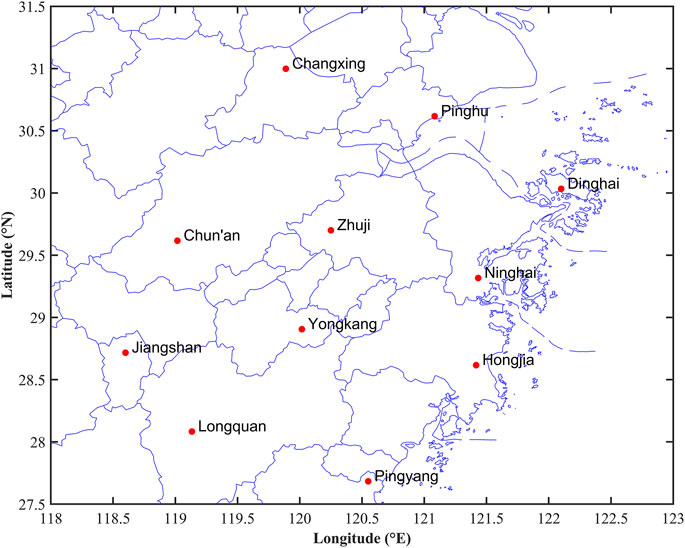
FIGURE 1. Site distribution map for the lightning location system in Zhejiang province.
The cumulative probability formula for lightning current amplitude recommended by the IEEE is as follows:
The cumulative probability formula for lightning current amplitude recommended by GB/T 50064–2014 is as follows:
where
The parameters recommended by the IEEE are the average results of global lightning current amplitude, and lightning activities vary greatly with time and space, so it is not appropriate to use the average results directly in Zhejiang province, and for Eq. 2, the parameters were obtained by inversion using the data recorded by the Xinhang line from 1962 to 1987. Therefore, the accuracy needs further verification according to the lightning observed data. In order to obtain a more suitable cumulative probability formula of lightning current amplitude and corresponding parameters in Zhejiang province, the least squares criterion is often used, and the Levenberg–Marquardt method is a commonly used method.
The study counts the observed data of the lightning location system in Zhejiang province from 2009 to 2019 and carries out quality control. According to IEEE regulations, the application range of the current is defined as 2–200 kA. Therefore, records with lightning current amplitudes of less than 2 kA and greater than 200 kA are excluded. The lightning number is counted according to the rule, which is that the current amplitude starts at 2 kA, then 5 kA, and increases by 5 kA until 200 kA. According to the results, the distribution characteristics of the lightning current amplitude are analyzed. According to the definition of the cumulative probability of lightning current amplitude, the percentages of positive flashes, negative flashes, and total flashes are calculated, respectively, based on the above intervals. Finally, the statistical points of the cumulative probability distribution of positive flashes, negative flashes, and total flashes are obtained.
In order to get a more suitable cumulative probability formula of the lightning current amplitude and corresponding parameters in Zhejiang province, the Levenberg–Marquardt method is used to fit the measured data with the formulas recommended by IEEE and GB/T 50064–2014, respectively, and the correlation coefficients of different polarities are obtained. The Levenberg–Marquardt method is a commonly used method that solves the non-linear least squares problem. In order to strengthen the robustness of the algorithm, it adds a damping factor on the basis of the Gauss-Newton method. The following is an example:
The vector
where
The objective function
Here
The partial derivatives of the residual vector
In this study, based on Eq. 1,
On the basis of the initial value
where
In each iteration, the Levenberg–Marquardt method can have various indicators to measure the quality of this iteration, and the value of
In order to verify the effect of fitting, the median current method is applied to test the results by the Levenberg–Marquardt method.
Results and Analysis
Analysis of the Characteristics of Lightning Current Amplitude
Table 1 indicates the counts of positive flashes, negative flashes, and total flashes from 2009 to 2019 in Zhejiang province. They are based on different intervals of 2, 5, 10, ... 195, and 200 kA. The total number of flashes is 8,634,858, with positive flashes of 1,084,961 and negative flashes of 7,549,897, accounting for 12.56 and 87.44%, respectively. Therefore, the number of negative flashes is far greater than that of positive flashes. For instance, the percentage of positive flashes is lower than what has been observed, in Belgium (Dieter 2014). For the average value of lightning current amplitude, it is 54.59 kA for positive flashes, and 41.39 kA for negative flashes. Lightning current amplitude is mainly concentrated in the range of 2–100 kA, with a total number of 8,142,671, accounting for 94.3%. In the range of 160–200 kA, the number becomes smaller, accounting for only 0.94%. Of the annual variations, the number of total flashes reached a maximum value of 1,658,026 in 2019, and a minimum value of 236,851 in 2015, and the average annual number of lightning strikes is 784,978, higher than that of Hubei province, which is 393,724 (Yu et al., 2021).
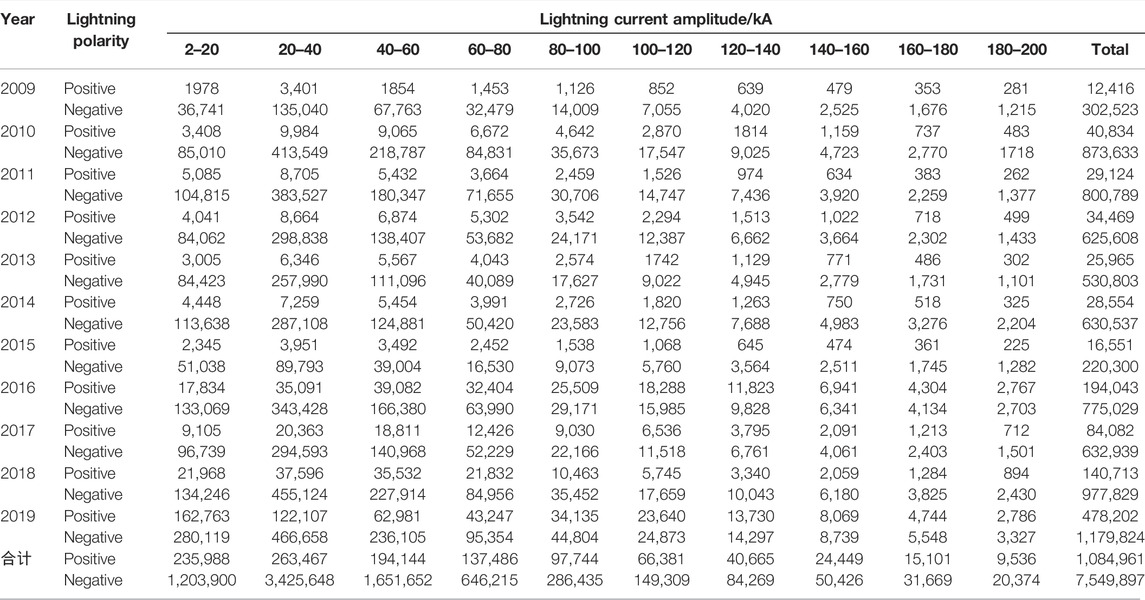
TABLE 1. Lightning Current Amplitude Statistics from 2009 to 2019.
The monthly and hourly distributions of lightning current amplitude are shown in Figure 2. It is found that positive flashes greater than 60 kA account for 53.96% of the total and negative flashes account for 38.68% of the total in Zhejiang province. The average current amplitude of positive flashes is significantly higher than that of negative flashes, and the monthly distribution presents a significant shape of a single peak. January is the first month with high current amplitude, and the peak value is reached in February. After that, the current amplitude gradually decreases. For negative flashes, the monthly distribution is relatively concentrated, especially from February to October, showing a significant shape of downward convexity, and the high currents mostly occur from November to January of the following year. In Zhejiang province, Figure 2 shows that positive flashes are frequent in spring, followed by winter, while negative flashes are mainly concentrated in summer and autumn. In winter, there are fewer lightning activities, but the average current intensity is stronger than in other seasons. This is basically consistent with the observed results in Beijing (Gao et al., 2019). In an hourly distribution, the current amplitude variation of positive flashes is more significant than that of negative flashes, while in spring high values are mainly concentrated in 12–19, in summer mainly in 12–18, in autumn mainly in 19–23, and in winter mainly in 12–14. Otherwise, for negative flashes, the hourly variation is more significant in winter, mainly concentrated in 09–20, and changes little in other seasons.
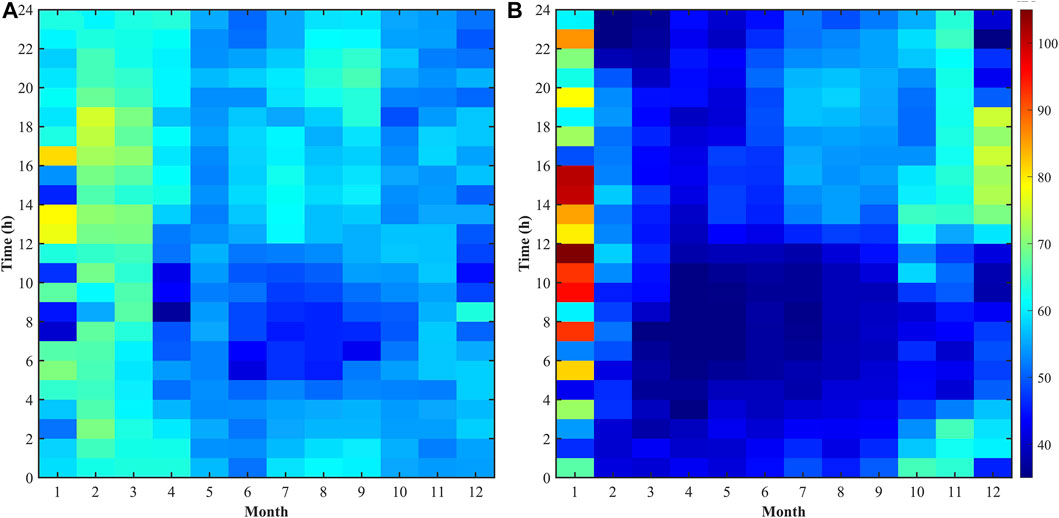
FIGURE 2. Time distribution diagram of lightning current amplitude (A) Positive flashes and (B) Negative flashes.
Characteristics of the Cumulative Probability Distribution of Lightning Current Amplitude
For different polarities, the cumulative probability distribution curves of lightning current amplitude are shown in Figure 3, which are quite different. The curve of negative flashes is steeper than that of positive flashes, that is, the cumulative probability distribution of negative flashes is more concentrated than that of positive flashes. When lightning current amplitude is higher than 25.5 kA, the cumulative probability of positive flashes is greater than that of negative flashes, and vice versa. The curve of negative flashes is closer to that of total flashes, especially due to the high proportion of negative flashes to total flashes (87.44%). Therefore, the cumulative probability distribution of lightning current amplitude of total flashes is mainly affected by negative flashes, which is consistent with the results of lightning current amplitude characteristics in Hubei province and Beijing (Wang et al., 2016; Gao et al., 2019).
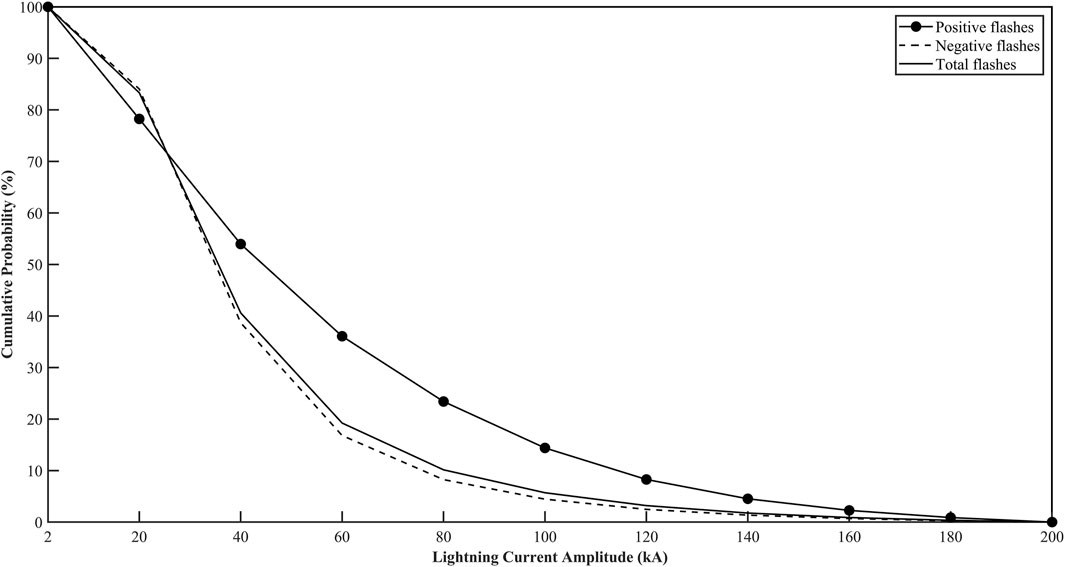
FIGURE 3. Cumulative probability distribution curves of lightning current amplitude.
When the cumulative probability of lightning current amplitude is 50%, the current of positive flashes, negative flashes, and total flashes is 44.4, 35.0, and 35.6 kA, respectively. It means that the median current of positive flashes, negative flashes, and total flashes in Zhejiang province is 44.4, 35.0, and 35.6 kA, respectively. The median current of total flashes (35.6 kA) is less than that in Guangzhou (36.7 kA) and greater than that in Liaoning (30.6 kA), which shows that the distribution in Zhejiang province is different from those in the southern and northern regions of China (Lu et al., 2009; Cheng et al., 2021). For the current amplitude of total flashes, which is higher than 80 and 100 kA, the corresponding cumulative probability is 10.15 and 5.7%, indicating that in Zhejiang province, less than 80 kA accounts for more than 89.85% and less than 100 kA accounts for more than 94.3%. It is similar to the result in Hubei province where lightning current amplitude is less than 100 kA, accounting for more than 98% (Wang et al., 2016). It is because the latitudes of Zhejiang and Hubei provinces are basically the same, and the water resources are relatively abundant, which provides abundant water vapor for the breeding of lightning. Therefore, lightning activity occurs more frequently, and the distribution characteristics of lightning current amplitude are relatively similar.
Formula Fitting
In order to calculate the exact parameters in the cumulative probability distribution formula of the lightning current amplitude for Zhejiang province, the Levenberg–Marquardt method is adopted. The data based on the lightning location system in Zhejiang province are fitted with the formula recommended by IEEE and GB/T 50064-2014, respectively. Then, the parameters and correlation coefficients of different current polarities for Zhejiang province are obtained, which are shown in Tables 2 and 3.

TABLE 2. Fitting parameters recommended by the IEEE and GB/T 50064-2014.
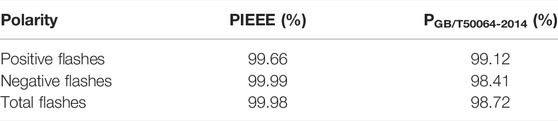
TABLE 3. Correlation coefficients between measured values and calculated values by the IEEE and GB/T 50064-2014.
For positive flashes, negative flashes, and total flashes, the trends of the fitting curves are more consistent with those recommended by the IEEE and quite different from those recommended by GB/T 50064-2014, which is shown in Figures 4 and 5.
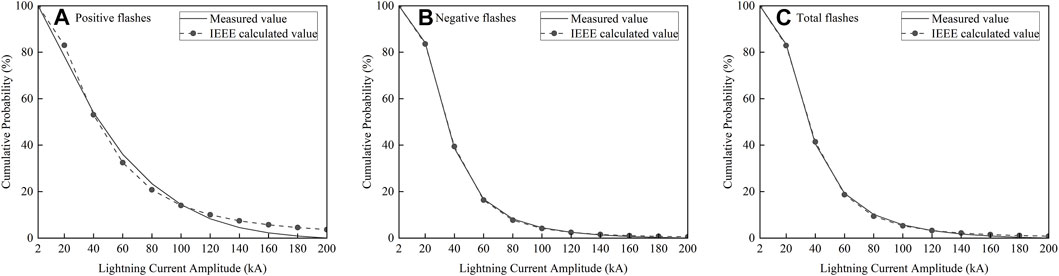
FIGURE 4. Fitting curves based on measured values and calculated values by the IEEE (A) Positive flashes, (B) Negative flashes, and (C) Total flashes.
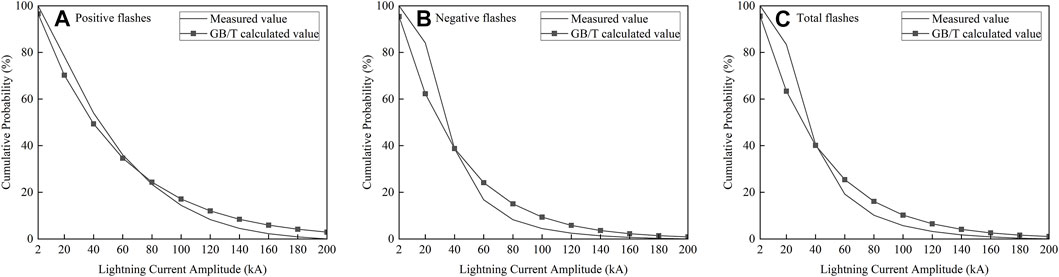
FIGURE 5. Fitting curves based on measured values and calculated values by GB/T 50064-2014 (A) Positive flashes, (B) Negative flashes, and (C) Total flashes.
The correlation coefficients between the curves in Figure 4 are greater than those between the curves in Figure 5. It shows that the correlation between the curves based on the measured values and the ones based on the IEEE formula is higher for Zhejiang province. Therefore, to calculate the cumulative probability of lightning current amplitude in Zhejiang province, it is more appropriate to use the IEEE formula. This conclusion is basically consistent with the results in other regions in China, such as Beijing, Yan’an, and Hubei province (Wang et al., 2016; Gao et al., 2019; Li et al., 2019).
Based on the aforementioned method, the formula for the cumulative probability distribution in Zhejiang province is shown in Eq. 9, which applies to the calculation of positive flashes.
The formula is shown in Eq. 10, which applies to the calculation of negative flashes.
Eq. 11 applies to the calculation of total flashes.
In order to test the accuracy of fitting results based on the Levenberg–Marquardt method, the median current method is used to test the fitting results. The test results are shown in Table 4. It is shown that the correlation coefficients (R2) used by the Levenberg–Marquardt method are greater than those based on the Median Current method, so the reliability of fitting results used by the Levenberg–Marquardt method is higher.
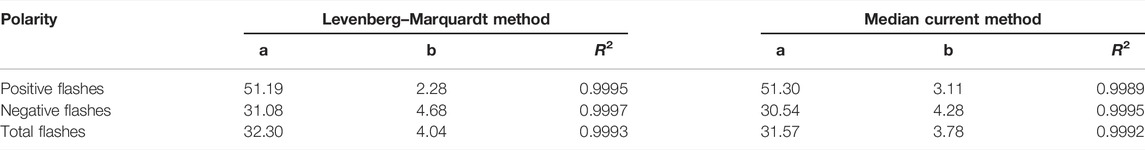
TABLE 4. Comparison of fitting results between the Levenberg–Marquardt method and the median current method.
Verification
In order to verify the accuracy of Eqs 9, 10, and 11, the data of lightning current amplitude in 2020 are taken as an example, and the results are shown in Figure 6. It clearly shows that compared to the formula recommended by GB/T50064-2014, the curves based on Eqs 9, 10, and 11 are closer to those of the measured lightning data in 2020. For the measured value curve and the IEEE fitted curve, Figure 6A shows that the two curves are closer when lightning current amplitude is around 80 kA, and the others are slightly divergent. However, the basic trend is the same. In Figures 6B,C, the two curves have the same trend of change. As observed data increase, the fit of the two curves will be higher. Therefore, the fitted formulas in this study are more suitable for describing the distribution characteristics of the cumulative probability of lightning current amplitude in Zhejiang province.
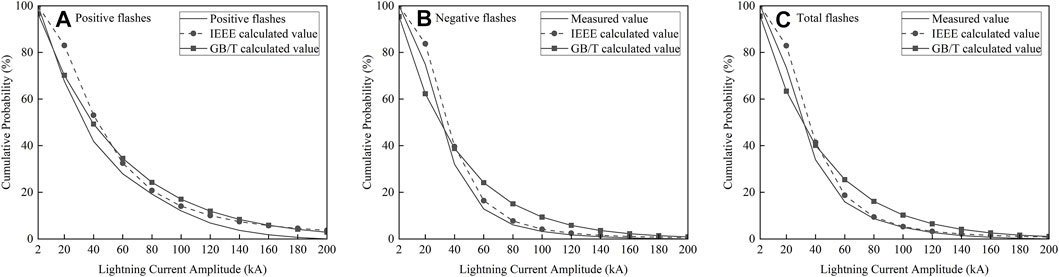
FIGURE 6. Comparison of the cumulative probability distribution between measured values and calculated values in 2020 (A) Positive flashes, (B) Negative flashes, and (C) Total flashes.
Summary and Discussion
In this work, a total of 8,634,767 flashes are used to analyze the characteristics of lightning current amplitude and cumulative probability, based on the lightning data from 2009 to 2019. In addition, the parameters in the formulas recommended by the IEEE are corrected, which can more objectively reflect the cumulative probability distribution of lightning current amplitude in Zhejiang province.
It is found that the number of negative flashes is far more than that of positive flashes in Zhejiang province. But the average current amplitude of positive flashes is significantly higher than that of negative flashes. Lightning current amplitude is mainly concentrated in the range of 2–100 kA, accounting for 94.3%. In the range of 160–200 kA, the number becomes smaller, accounting for only 0.94%. The seasonal characteristics are significant, and the monthly distribution of the positive lightning current amplitude has a unimodal distribution, while that of negative flashes is relatively concentrated. Positive flashes are frequent in spring, but summer is the season of negative flashes. The cumulative probability distribution of the negative lightning current amplitude is closer to that of total flashes and is significantly different from that of positive flashes. The variation law of total flashes is mainly affected by negative flashes. Based on the Levenberg–Marquardt method, the measured data are fitted with the formulas recommended by the IEEE and GB/T 50064-2014, respectively, and the parameters of different polarities are obtained. By analysis, the cumulative probability distribution formula recommended by IEEE is more suitable for Zhejiang province, which is basically consistent with the results in other regions in China.
In Figures 6B and C, the changing trend of the two curves basically coincides. But there are two intersections between the two curves in Figure 4A, and when the value is higher than 100 kA, the fit of the two curves becomes lower. In other words, for describing the distribution characteristics of the cumulative probability of lightning current amplitude in Zhejiang province, the formulas applying to negative flashes and total flashes are more realistic than those for positive flashes. With more lightning observation data, a subsection refinement of the cumulative probability of the lightning current amplitude can be carried out in the following research, in order to obtain a more accurate cumulative probability formula.
Data Availability Statement
The original contributions presented in the study are included in the article/Supplementary Material, further inquiries can be directed to the corresponding author.
Author Contributions
Data acquisition; LQ. Methodology; LX, FY and SN. Software; SN and GX. Validation: LY, LQ and GX. Investigation; LX and LY. Writing—original draft preparation, LX. Writing—review and editing; LX, SN, MP and GX. All authors have read and agreed to the published version of the manuscript.
Funding
This work was supported by the National Key Research and Development Program of China (No. 2017YFC1501502), the National Natural Science Foundation of China (No. 41975003), and the Open Grants of the State Key Laboratory of Severe Weather (No. 2020LASW-B08).
Conflict of Interest
The authors declare that the research was conducted in the absence of any commercial or financial relationships that could be construed as a potential conflict of interest.
Publisher’s Note
All claims expressed in this article are solely those of the authors and do not necessarily represent those of their affiliated organizations, or those of the publisher, the editors, and the reviewers. Any product that may be evaluated in this article, or claim that may be made by its manufacturer, is not guaranteed or endorsed by the publisher.
Acknowledgments
The authors are indebted to all members of the Department of Safety Engineering, especially Professor Shi Zheng, and the Zhejiang Meteorological Bureau. For further details, please contact LX (lixiasd74@163.com).
References
Anderson, R. B., and Eriksson, A. J. (1980). Lightning Parameters for Engineering Application. Electra 69, 65.
Borghetti, A., Nucci, C. A., and Paolone, M. (2004). Estimation of the Statistical Distributions of Lightning Current Parameters at Ground Level from the Data Recorded by Instrumented Towers. IEEE Trans. Power Deliv. 19 (3), 1400–1409. doi:10.1109/TPWRD.2004.829116
Chemartin, L., Lalande, P., Peyrou, B., Chazottes, A., Elias, P. Q., Delalondre, C., et al. (2012). Direct Effects of Lightning on Aircraft Structure: Analysis of the Thermal, Electrical and Mechanical Constraints. Aerospace Lab. 5, 1.
Cheng, P., Zeng, Y., Cheng, L., Pang, W. J., Xiao, G. L., and Rong, X. Y. (2021). Analysis of Characteristics of Lightning Current Amplitude in Liaoning Province from 2010 to 2018. J. Meteorology Environ. 37 (4), 107–113. doi:10.3969/j.issn.1673-503X.2021.04.015
Chowdhuri, P., Anderson, J. G., Chisholm, W. A., Field, T. E., Ishii, M., Martinez, J. A., et al. (2005). Parameters of Lightning Strokes: A Review. IEEE Trans. Power Deliv. 20 (1), 346–358. doi:10.1109/TPWRD.2004.835039
Christian, H. J., Blakeslee, R. J., Boccippio, D. J., Boeck, W. L., Buechler, D. E., Driscoll, K. T., et al. (2003). Global Frequency and Distribution of Lightning as Observed from Space by the Optical Transient Detector. J. Geophys. Res. 108 (D1), 4005. doi:10.1029/2002JD002347
Cui, X. D., Gu, Y., and Xu, Z. Y. (2021). Characteristic Analyses on Multi-Return Stroke of Lightning Parameters over Zhejiang Based on 3D Lightning Location System Data. Sci. Tech. Eng. 21 (23), 9706.
Du, S. C. (1996). Suggestion on Revising the Calculation Method and Some Parameters Used in Lightning Protection of Transmission Lines. Power Syst. Tech. 20 (12), 53–56. doi:10.13335/j.1000-3673.pst.1996.12.013
Finke, U., and Hauf, T. (1996). The Characteristics of Lightning Occurrence in Southern Germany. Beitr. Phys. Atmosph. 69 (3), 361.
Fleenor, S. A., Biagi, C. J., Cummins, K. L., Krider, E. P., and Shao, X.-M. (2009). Characteristics of Cloud-To-Ground Lightning in Warm-Season Thunderstorms in the Central Great Plains. Atmos. Res. 91, 333–352. doi:10.1016/j.atmosres.2008.08.011
Gao, J. G., Liu, Y., and Bu, W. (2019). Analysis on the Characteristics of Lightning Current Amplitude in Beijing Area Using ADTD Data. Torrential Rain and Disasters 38 (1), 92–96. doi:10.3969/j.issn.1004-9045.2019.01.012
Grant, I. S., Anderson, J. G., Hileman, A. R., Janischewskyj, W., Longo, V. J., Chisholm, W., et al. (1985). A Simplified Method for Estimating Lightning Performance of Transmission Lines. IEEE Trans. Power Apparatus Syst. 104 (4), 919.
Gu, Y., Xu, Z. Y., and Cui, X. D. (2021). Characteristics Analysis of Lightning Disasters in Zhejiang Province Province from 1998 to 2020. Bull. Sci. Tech. 37 (7), 38.
He, J. L., Yang, G., and Yu, Z. Q. (2017). A Study on Lightning Current Waveform Parameters for Lightning Protection. Building Electricity 36 (3), 3.
Kohlrausch, F. (1888). Ueber den electrischen leitungswiderstand des quecksilbers. Ann. Phys. Chem. 271 (12), 700–764. doi:10.1002/andp.18882711206
Li, J. Q., Wang, J. S., Shen, S. H., Li, B., Chen, H., and Lin, T. (2011). Analysis of the Cumulative Probability of Lightning Current Amplitudes Based on the Statistical Data Obtained from the ADTD System. Meteorol. Monthly 37 (2), 226–231.
Li, R. F., Wu, G. N., Cao, X. B., and Ma, Y. (2011). Formula for Probability of Lightning Current Amplitude. Trans. China Electrotechnical Soc. 26 (4), 161.
Li, T., Zhai, Y., Sun, Y., and Gao, H. (2019). Distribution Characteristics and Calculation Formula for Cumulative Probability of Lightning Current Amplitude in Yan’an Area. J. Nanjing Univ. Inf. Sci. Technology(Natural Sci. Edition) 11 (3), 360–366. doi:10.13878/j.cnki.jnuist.2019.03.01610.4236/jssm.2019.123024
Liu, Y., Wang, Z. H., Kang, F. Q., Zhang, H. L., Xiao, W. A., and Li, Z. R. (2009). Characteristics of Cloud-To-Ground Flashes in Zhejiang Province and Gansu Areas. Plateau Meteorology 28 (3), 669–674.
Lu, G. J., Xiong, J., Chen, J. H., Tong, X. F., and Gu, S. Q. (2009). Analysis of Ground Flash Density and Lightning Parameters of Guangzhou in 1999- 2008. High Voltage Eng. 34 (12), 2930–2936. doi:10.13336/j.1003-6520.hve.2009.12.015
Ma, M., Lv, W. T., Zhang, Y. J., Meng, Q., and Yang, J. (2008). Characteristics of Lightning Exposure in China from 1997 to 2006. J. Appl. Meteorol. (Science Chinese) 19 (4), 394.
Metwally, I. A., Heidler, F., and Zischank, W. (2004). Measurement of the Rear-Face Temperature of Metals Struck by Lightning Long-Duration Currents. Euro. Trans. Electr. Power 14 (4), 201–222. doi:10.1002/etep.16
Orville, R. E., and Huffines, G. R. (1999). Lightning Ground Flash Measurements over the Contiguous United States: 1995-97. Mon. Wea. Rev. 127 (11), 2693–2703. doi:10.1175/1520-0493(1999)127<2693:lgfmot>2.0.co;2
Paisios, M. P., Karagiannopoulos, C. G., and Bourkas, P. D. (2008). Estimation of the Temperature Rise in Cylindrical Conductors Subjected to Heavy 10/350μs Lightning Current Impulses. Electric Power Syst. Res. 78 (1), 80–87. doi:10.1016/j.epsr.2007.01.002
Pinto, O., Regina C.A. Pinto, I., H. Diniz, J., Cazetta Filho, A., C.L. Cherchiglia, L., and M. Carvalho, A. (2003). A Seven-Year Study about the Negative Cloud-To-Ground Lightning Flash Characteristics in Southeastern Brazil. J. Atmos. Solar-Terrestrial Phys. 65, 739–748. doi:10.1016/S1364-6826(03)00077-4
Poelman, D. R. (2014). A 10-Year Study on the Characteristics of Thunderstorms in Belgium Based on Cloud-To-Ground Lightning Data. Monthly Weather Rev. 142, 4839–4849. doi:10.1175/MWR-D-14-00202.1
Rivas Soriano, L., de Pablo, F., and Tomas, C. (2005). Ten-Year Study of Cloud-To-Ground Lightning Activity in the Iberian Peninsula. J. Atmos. Solar-Terrestrial Phys. 67, 1632–1639. doi:10.1016/j.jastp.2005.08.019
Shim, E. B., Woo, J. W., Han, S. O., and Moon, J. D. (2002). Lightning Characteristics in Korea and Lightning Performance of Power Systems. Proc. IEEE/PES Transm. Distribution Conf. Exhibition, 534–539.
Wang, X. L., Zhang, K. J., Yu, T. Y., and Wang, Z. H. (2016). Characteristics of Probability Distribution for Lightning Peak Current and Segment Revision for Cumulative Probability. Meteorol. Sci. Tech. 44 (6), 1037–1042. doi:10.19517/j.1671-6345.2016.06.028
Yu, T. Y., Wang, X. L., Zhang, K. J., Zhao, T., and Wang, X. F. (2021). The Distribution Characteristics of Ground Flash and Classification of Lightning Intensity in Hubei Province from 2007 to 2019. J. Meteorology Environ. 37 (6), 79.
Yue, P., Wu, M., Tan, J., Zhao, H. Y., Wang, C. C., Zhao, C., et al. (2013). Statistics and Application of Lightning Parameters Based on Tower Circle Method. Insulators and Surge Arresters. 35 (1), 107.
Zhang, Y., Bian, X. W., Wang, K. T., Zhang, W. B., and Wang, Z. H. (2021). Analysis of Lightning Characteristics and Their Relationship with Meteorological Parameters in Zhejiang Province and its Surrounding Areas Based on TRMM/LIS Data. J. Trop. Meteorology 37 (4), 602–610. doi:10.16032/j.issn.1004-4965.2021.057
Zhang, Y. J., Huang, H., Liu, H. Y., and Chen, Z. F. (2011). Lightning Strike Risk Evaluation of Power Grid with Distributed Hydropower. J. South China Univ. Technology(Natural Sci. Edition) 39 (10), 127.
Zhao, C., Lei, M. F., Chen, J. H., Gu, S. Q., Wang, P., and Zhao, J. J. (2017). Statistical Method of Lightning Current Amplitude Distribution along Transmission Line Corridor. High Voltage Eng. 43 (5), 1609–1614. doi:10.13336/j.1003-6520.hve.20170428029
Keywords: lightning current amplitude, cumulative probability, characteristics, median current, the Levenberg–Marquardt method
Citation: Xia L, Nannan S, Yanfeng F, Yinping L, Qing L, Xiaolin G and Pei M (2022) Distribution Characteristics and Formula Revision of Lightning Current Amplitude and Cumulative Probability in Zhejiang Province. Front. Environ. Sci. 10:880113. doi: 10.3389/fenvs.2022.880113
Received: 21 February 2022; Accepted: 16 March 2022;
Published: 11 April 2022.
Edited by:
Xinyao Xie, Institute of Mountain Hazards and Environment (CAS), ChinaCopyright © 2022 Xia, Nannan, Yanfeng, Yinping, Qing, Xiaolin and Pei. This is an open-access article distributed under the terms of the Creative Commons Attribution License (CC BY). The use, distribution or reproduction in other forums is permitted, provided the original author(s) and the copyright owner(s) are credited and that the original publication in this journal is cited, in accordance with accepted academic practice. No use, distribution or reproduction is permitted which does not comply with these terms.
*Correspondence: Song Nannan, songnannan1216@126.com