The Eco-Environmental Changes in Typical Coastal Zones of Southern China From 1987 to 2020: A Case Study of Guangdong Coastal Counties
 Yuchen Li
 Zaheer Abbas
 Danying Chen1,2
 - 1School of Geography, South China Normal University, Guangzhou, China
- 2Key Laboratory of Natural Resources Monitoring in Tropical and Subtropical Area of South China, Ministry of Natural Resources, Guangzhou, China
- 3Surveying and Mapping Institute, Lands and Resource Department of Guangdong Province, Guangzhou, China
Population growth, socioeconomic development, and rapid urbanization have exacerbated the deterioration of coastal ecosystems, particularly in the coastal region of southern China, which has experienced significant urbanization. A precise and timely insight into the ecological changes is indicative of economic and environmental harmonization in southern coast of China and other regions of the world. This study applied 731 Landsat images to assess quantitatively the spatial and temporal evolution of ecological environment quality in the coastal zone of South China during 1987─2020 based on the remote sensing ecological index (RSEI). The results show that 1) the correlation between the RSEI calculated using Landsat data and the parameters is more than 75%, and the results were significant when applied to assess the ecological environment of the coastal zone in South China. 2) The ecological quality of the coastal zone in South China as a whole showed a slight initial degradation during 1987─2020, followed by a gradual improvement trend and then a slight degradation; the area with good ecological quality decreased from 38.96 to 7.97%, and then gradually recovered to 56.61% in 2010. Subsequently, the regions with good ecological quality showed a significant decline, reducing to 1.72%, and then increasing to 38.46% until 2020. In addition, regional differences persisting during the study period are caused by the impact of human activities on the land use types of different landscapes. 3) Good and moderate ecological quality classes occupy most of the coastal zones in South China, but the pressure on the coastal zone is still not optimistic due to the sensitivity of the coastal zone and the accelerated urbanization in South China. As a large-scale, long time series of coastal zone ecological monitoring, this study can provide support for planning, ecological monitoring, environmental protection policy formulation, and integrated regional management of coastal zones and similar areas in South China.
Introduction
Coastal zones are the transitional areas between land and water, where the inherent vulnerability of the zone, coupled with the interactions between land, ocean, and human activities, predominantly makes these areas most vulnerable to environmental change (Melet et al., 2020). The rich resources and the concentration of the global population drive the ecological and environmental changes in the coastal zones that are closely related to the survival and development of human beings (Piracha 2015; Kummu et al., 2016; Wang et al., 2021). Rapid urban expansion and population growth in coastal zones have placed enormous pressure on natural ecosystems, resulting in severe environmental degradation such as the heat island effect (Kuang et al., 2015), biodiversity loss (Lin and Yu 2018), desertification (Salvati 2014), and even insignificant anthropogenic disturbances such as agricultural activities, which may lead to severe ecological degradation (Tian et al., 2016) and associated economic decline, which have become increasingly prominent and serious threats to the survival and development of the coastal communities (L. Xu et al., 2021).
Ecological environmental quality is defined as the degree of suitability for human survival and socioeconomic development in a certain spatial and temporal context. Ecological protection and restoration work needs to be based on quantitative ecological monitoring results to give targeted and scientific implementation plans so that ecological restoration and protection work can be truly effective. Therefore, ecological monitoring and assessment has attracted extensive research attention from scholars (Ye and Liu 2000; Hansen et al., 2013; Petrie et al., 2015). Studies conducted on evaluation approaches show that researchers have produced some commonalities. For example, some scholars have evaluated changes in ecosystem quality based on land use and land cover changes (LUCC) (Lambin and Meyfroidt 2011; Locher-Krause et al., 2017). LUCC are considered to be a reflection of the quality of the ecological environment at a certain temporal and spatial scale under human influence. Others have focused on the application of landscape models to analyze and assess the ecological environment quality, and a large number of researchers have also chosen modeling methods to evaluate the ecological simulation, such as the ecological index (EI) and sampling. However, these methods, which use more statistics for ecological evaluation, are subject to human influence, and it is difficult to assess a district with sufficient accuracy by only vague assessment (Chase and Knight 2013; Zhong et al., 2020).
In addition to ecological monitoring methods, this study also discusses the disparities in ecological monitoring methods for different land covers. For example, net primary productivity (NPP), normalized difference vegetation index (NDVI), fractional vegetation cover (FVC), and leaf area index (LAI) are mostly used to describe the ecological condition of vegetation in an area. A large number of studies have used urban green space, urban heat islands, and rates of urban sprawl to assess the ecological condition of urban habitats (Xu et al., 2016; Jin et al., 2019; Liang et al., 2019; Aram et al., 2019). The ecological quality of agricultural land is evaluated by monitoring of heavy metals and soil erosion (Weihong et al., 2017; Tong et al., 2021). Similarly, a large number of studies have applied remote sensing images or water transparency monitoring devices to assess the ecological environment of water (Chang et al., 2009; Houlei et al., 2018). However, it is difficult for any one of them to achieve an accurate and comprehensive assessment of land cover on a large scale. In contrast, RSEI reduces the impact of multiple types of land cover in large scale ecological assessments. In recent years, many studies have applied the RSEI to assess the ecological indicators of land cover and demonstrated the usefulness and credibility of the index. For example, ecological assessments in various regions in China such as the part of the Yellow River Basin in Inner Mongolia, the middle reaches of the Yangtze River region, Tibet, and Xiongan, have yielded objective and accurate results (Xu H. et al., 2018; Gao et al., 2021; Huang et al., 2021; Yang et al., 2021). However, current research mainly focuses on inland area, watersheds, and less on coastal zones (Li et al., 2016). Most coastal studies focus on shoreline change detection (Bouchahma and Yan 2014; Liu et al., 2017), only Zheng’s research has applied MODIS data combined with comprehensive nighttime light index (CNLI) to conduct ecological assessments of the national coastal zone and reached an accurate conclusion (Zheng et al., 2020). However, the low spatial resolution of MODIS data compared to 30 m Landsat imagery prevented observation of many fine-grained processes to the ecological changes and cannot adequately reflect the actual local ecological differences or provide a targeted study of South China’s rapidly growing economic coastal zone (Kennedy et al., 2014).
In this regard, China has been experiencing rapid economic development over the past 40 years, especially in the southern coastal belt, where the fragility of the ecological environment in tropical and subtropical areas has inevitably led to the degradation and loss of surrounding natural habitats, including ecological zones such as forests, peat swamps, planted forests, and wetlands (Lin and Yu 2018), as well as long-term international and national interests in the coastal zone. Therefore, this study employs the RSEI to describe in detail the ecological evolution of the land portion of South China’s coastal counties during 1987–2020, to gain experience from the past ecological evolution of the coastal zone in South China, and to lay the foundation for the future development of the coastal zone as well as the ecological planning and management of coastal zones in other regions.
Materials and Methods
Study Area
The South China coastal zone is located (20°08′–24°14′N、109°24′–117°31′E) in the coastal region of southern China, with a land area of about 4.93 × 10⁴ km2 (Figure 1A). The entire South China coastal zone has a humid subtropical climate, with an average annual temperature of 22°C, and a rainy season mainly from April to September. Typical vegetation types are subtropical evergreen broad-leaved forest and conifer-broadleaved mixed forest. Since 1978, with the development of the socioeconomic and tourism industries, there has been a general increase in the exploitation of land resources, most notably in the coastal areas of Guangdong Province, and it is widely believed that the rapid expansion of the impervious surface has seriously affected the ecological patterns and processes of the coastal zone (Zhai et al., 2020). In addition, as the economic development of China’s coastal zone is constrained by administrative divisions, the nearest county-level administrative districts along the Guangdong coast are selected as the study area in this study (Brenner et al., 2006; Zhi-bing and Zhang, 2021).
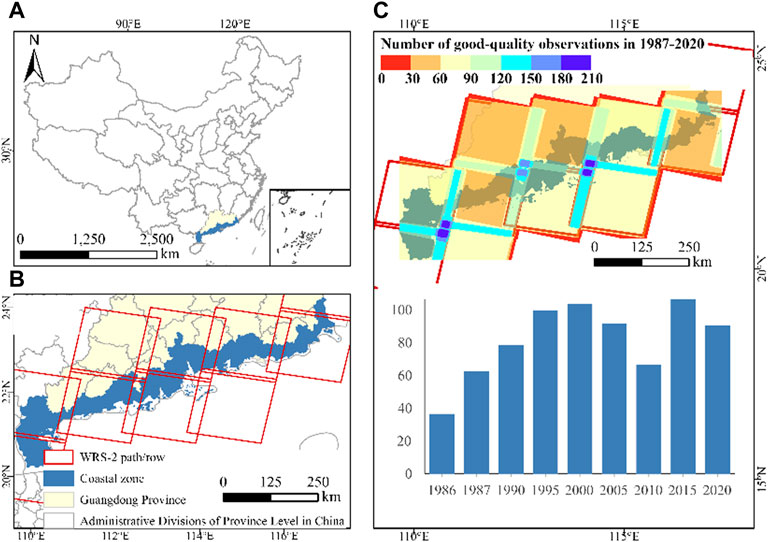
FIGURE 1. Location of the study area (A), spatial distribution of Landsat WRS-2 paths/rows in the South China coastal zone (B), and the spatial distribution of the number of good-quality observations within individual pixels of Landsat 5/8 images in 1987–2020 (C).
Materials
In this study, the surface reflectance of Landsat was collected from the USGS. The Landsat imageries of South China coastal zone is covered by five Worldwide Reference System (WRS-2) paths/rows (123/44, 123/45, 121/44, 121/45, 124/45, 124/46, 122/44, 122/45, 120/43, 120/44). From 1986 to 2020, there were 731 Landsat images available for the study area, 535 of which were Landsat-5 images for 1986, 1987, 1990, 1995, 2000, 2005, and 2010, and 196 were Landsat-8 images for 2015 and 2020 (Figure 1C). The area covered by good observations and the year distribution are shown in Figure 1C to generate a coastal zone dataset for the period 1987–2020. In particular, it is noted that the 1987 remote sensing image data cannot provide complete coverage of the study area, and the uncovered portion consists of high-quality Landsat observation data from 1986. In addition, the quality assessment (QA) band flags poor observations (e.g., clouds and cloud shadows) for each image and uses the QA band to remove poor observations. In addition, the DEM, the solar azimuth, and zenith angle of each image are used to identify and remove topographic shadows (Farr et al., 2007; Zou et al., 2018).
Human and Natural Data
Anthropogenic and natural factors have a profound impact on changes in ecological quality, and based on scholarly research (Ward et al., 2016; Xie et al., 2017; Ma et al., 2018; Zheng et al., 2020), eight factors have been selected for this study (Table 1) to detect its impact on the changes in ecological and environmental quality in the coastal zone of South China during 1987–2020.
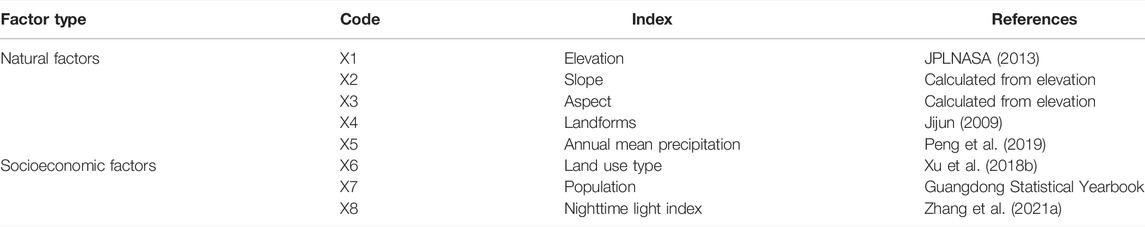
TABLE 1. Driving factors of eco-environment change.
Geodetector was used to assess the impact of driving factors. Since Geodetector can only handle categorical variables, this study therefore used the method of natural breaks (Jenks) discrete and categorized the elevation, slope, aspect, precipitation, and night light remote sensing data into six types of stratification based on the intrinsic properties of the data and previous research (Shi et al., 2019; Sun et al., 2020; Zhu et al., 2020).
Methods
Construction of RSEI
The rapid changes in land cover in the study area are manifested in the transition from ecological land to construction land, especially vegetation to construction land; on the other hand, the current state of the environment, the quality and quantity of resources, and their change over time are accompanied by rapid changes in the regional climate, a process that can be felt between heat and wetness as well as dryness. The RSEI is a description of ecological quality by integrating four parameters (greenness, dryness, wetness, and heat) and the principal component analysis (PCA) (H. Xu 2013). These parameters are based entirely on remote sensing technology; indicators are easily available, without human involvement, and the results can be visualized, and it can quickly and objectively evaluate the quality of the regional ecological environment. At the same time, the application of the PCA can bring together the main information of the four indicators to achieve a quantitative evaluation of the regional ecological environment. Therefore, it is considered that RSEI can efficiently complete the ecological environmental assessment of the coastal zone. In addition, the first band of PCA has the most information of the four parameters, so we choose the first band as the RSEI for evaluation, which is calculated using the following equation:
The normalized difference vegetation index (NDVI) is the most frequently used vegetation index and is directly related to biomass, leaf area index, and vegetation cover, so NDVI is chosen to represent the greenness (Song et al., 2018).
In the regional context, the main causes of surface cover drying are construction land and bare ground, so the dryness index can be calculated using the bare soil index (BI) and the index-based built-up index (IBI) given as follows:
The brightness, greenness, and wetness components obtained from Kauth–Thomas (K-T) transformation have been widely used in ecological environment monitoring, and their wetness components reflect the wetness of soil and vegetation, which are closely related to the ecological environment. Therefore, the wetness index is represented by the wetness component of K-T transformation. The wetness calculation used in this study is as follows (E. P. Crist 1985; E. Crist and Kauth 1986):
Here,
The study uses the surface temperature as the thermal component. Based on the statistical mono-window (SMW) algorithm, the empirical relationship between the apparent brightness of the atmosphere and the surface temperature obtained from the single thermal infrared band is implemented to obtain the surface temperature, and thus, the surface temperature is calculated using the following equation (Kalnay et al., 1996; Duguay-Tetzlaff et al., 2015; Hulley et al., 2015; Ermida et al., 2020):
In this formula, Tb is the brightness temperature data of the apparent reflectance of the atmosphere (TOA) and e is the apparent emissivity of the corresponding waveband. The algorithm coefficients
In addition, due to the non-uniformity of the magnitudes of the four calculated indices, in this study, the four indices were normalized separately to ensure that they are comparable with each other.
In this formula,
To compare the RSEI of different years, the RSEI is normalized to a value between [0,1], with higher values indicating better ecological quality.
In this formula,
GeoDetector
The GeoDetector is a spatial heterogeneity detection method that is commonly used to quantify the influence of dependent variables. We use Excel GeoDetector software developed by Wang et al. to achieve impact factor detection (J. Wang and Chengdong, 2017). GeoDetector includes factor detectors, risk detectors, ecological detectors, and interactive detectors. Specifically, it detects whether the independent variable x is an impact factor of variable y (RSEI) and explains, to some degree, the spatial heterogeneity mechanism of variable y. The degree of impact can be measured by the value of q; the value of q is calculated by the following formula:
where q is an indicator of the explanatory power of ecological influences. The larger the value of q, the greater the influence of the variable x on ecological heterogeneity.
The technical route of ecological environment quality monitoring and impact factor detection of the coast in this study is shown in Figure 2, and the aforementioned method is done using Google Earth engine, ENVI 5.3, and ArcGIS 10.2. Furthermore, to avoid water information to influence the PCA, the NDWI was applied to the images of each year for water rejection during data pre-processing.
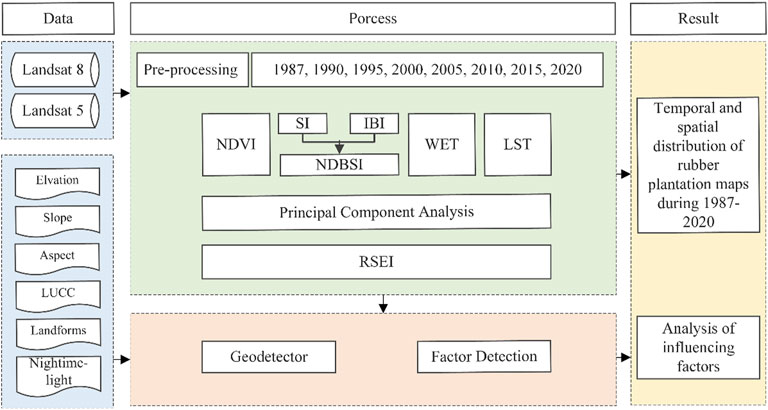
FIGURE 2. Methodology for evaluating and monitoring ecological quality evolution in typical coastal zones of the southern China.
Results
Performance of RSEI
The results of the PCA for each year from 1987 to 2020 show the good adaptability of the RSEI. The percentage of the first eigenvalue for each year is greater than 75%, which indicates that the characteristics of all variables are mainly integrated in the first feature (Table 2), where the largest percentage of eigenvalues is 99.66% for 2010 and the smallest is 75.10% for 2020.
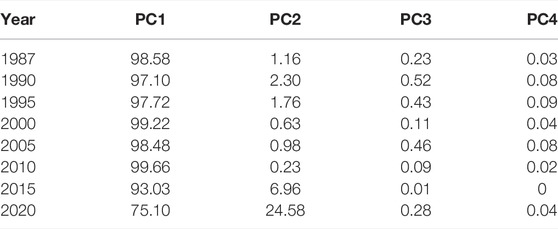
TABLE 2. Principal component analysis of five factors.
The correlation between RSEI and the four parameters was high for each year from 1987 to 2020 (Table 3). The mean absolute values of the RSEI correlation coefficients for each year were 0.652, 0.751, 0.747, 0.867, 0.914, 0.828, 0.822, and 0.904. The correlation between RSEI and each parameter was good, which indicates that compared with individual parameters, the RSEI index is more representative and universal than any single indicator used independently. Hence, it can be used to adequately reflect the quality of the ecological environment in the coastal zone of South China.
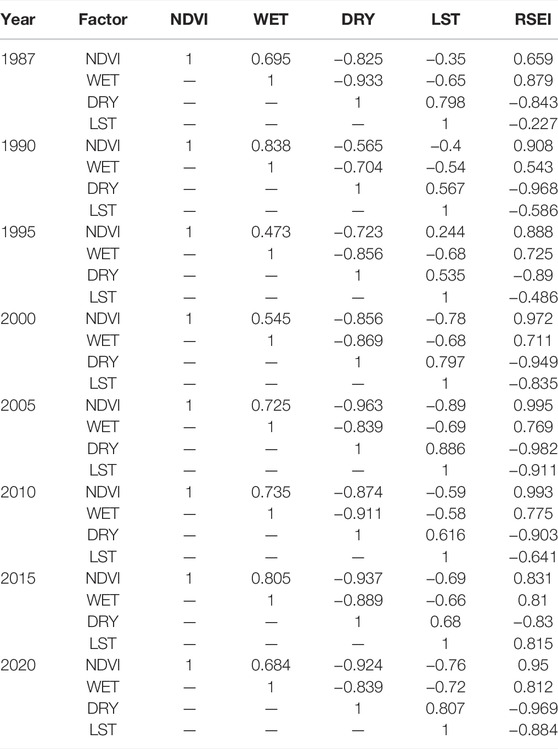
TABLE 3. Correlation matrix among RSEI, NDVI, WET, DRY, and LST in 1987–2020.
Temporal Evolution of the Quality of the Ecological Environment
To observe changes in ecological quality, spatial analysis and equal interval classification were used to create the RSEI ecological values into five ecological quality classes. To clearly describe the flow, distribution, and changes of ecological quality between time intervals, the form of Sankey diagram was used to describe the transfer of ecological quality from 1987 to 2020 (Figure 3). From 1987 to 2020, in general, the distribution of ecological quality classes in the coastal zone of South China was dominated by good, moderate, and fair, with all reaching over 95%, and the major change in ecological classes was mainly the mutual flow between these three classes.
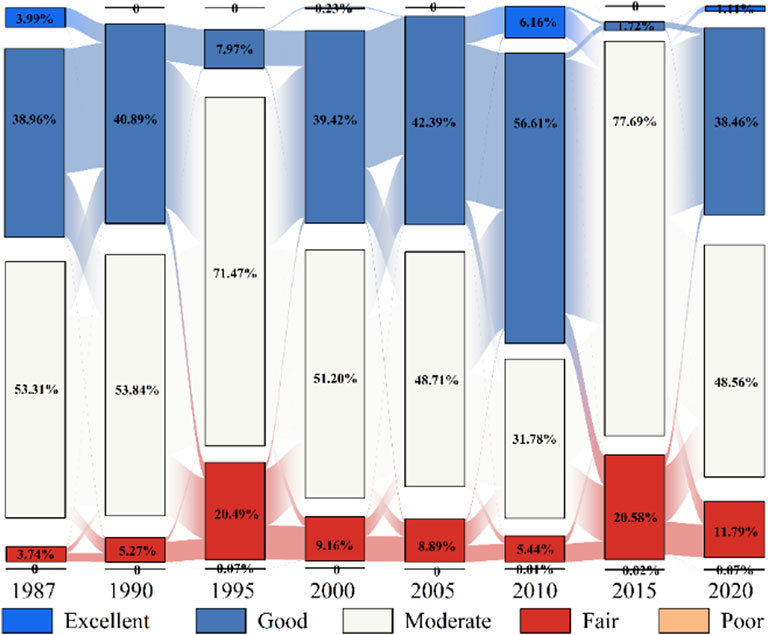
FIGURE 3. Sankey diagram of ecological quality class transitions in the South China coastal zone.
From 1987 to 2010, the area with good ecological quality grade decreased and then increased from 38.96 to 7.97% in 1995, and then gradually rebounded until 2010, when the area with good ecological grade accounted for 56.61% of the entire area. The area with moderate ecological class showed the opposite trend, gradually increased from 53.31 to 71.47%, and then decreased to 31.78% of the total area. Overall, the ecological quality of the coastal zone, dominated by good and moderate, showed a decreasing and then a increasing trend between 1987 and 2010. Similarly, it showed a clear trend of decreasing and then rebounding between 2010 and 2020. The area with good ecological quality accounted for 56.61% of the total area during 2010 and then decreased to 1.72%; the area with moderate ecological quality gradually increased from 31.78 to 77.69% during this period, and then the overall ecological quality rebounded to a certain degree mainly because the area with moderate ecological quality gradually returned to good, and the total area also increased from 1.72 to 38.46%. The overall ecological quality exhibited a gradually improving trend.
Spatial Evolution of the Quality of the Ecological Environment
To determine whether the spatial distribution of different classes of ecological environmental quality has specific spatial characteristics, based on spatial differences, the study area is divided into three parts: eastern, middle, and western, which can reflect the inter-regional differences more intuitively when combined with the spatial distribution of RSEI. From Figure 4, we can clearly find the RSEI has a significant tendency to aggregate, with low values mainly distributed in Zhanjiang in the west, the middle Zhujiang delta, and the eastern offshore side, and high values are mainly distributed in Jiangmen in the central region, Huidong in the east, Maoming in the west, and a part of Yangjiang.
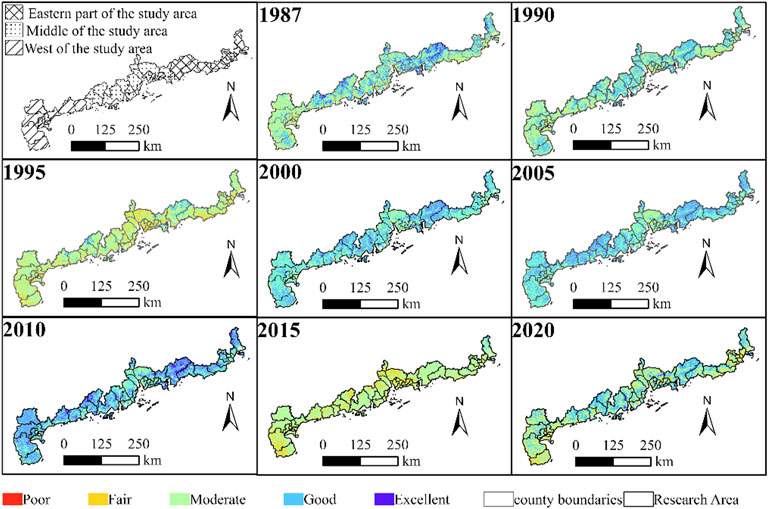
FIGURE 4. Eco-environmental quality class of spatial variation in coastal zone.
Analyzing the overall evolution trend of the RSEI from 1987 to 2020, it was found that the spatial heterogeneity of the RSEI in the study area was obvious, and the ecological quality in the western region gradually improved between 1987 and 2010, and then declined until it began to improve again in 2020. The RSEI of the middle region gradually declined from 1987 to 1995, then maintained relatively moderate until 2010, and then the ecological quality of the central region gradually improved to fair. In the eastern part of the study area, there was less variation, especially near the coastline, which has maintained a fair ecological quality during 1987–2020, indicating that the ecological quality in this area is relatively poor and has not improved significantly.
Driving Factors for the Evolution of Ecological Environment
The impact of different driving factors on the ecological quality varied, and the strength of each factor and the significance level of each factor p were measured by the GeoDetector (Table 4). Overall, all the q values of LUCC and landform ranked high for land use intensity in each year, with the largest q values for LUCC, so LUCC were considered to be the factor with stronger explanatory power for ecological change in the coastal zone of South China. Then, the landform including elevation and slope demonstrates that landform is a significant factor in the variation of ecological change, and the population reached 0.157 only in 2015, with weak explanatory power in the rest of the years. In addition, the overall explanatory power of nighttime light, precipitation, and aspect on ecological quality was weak.
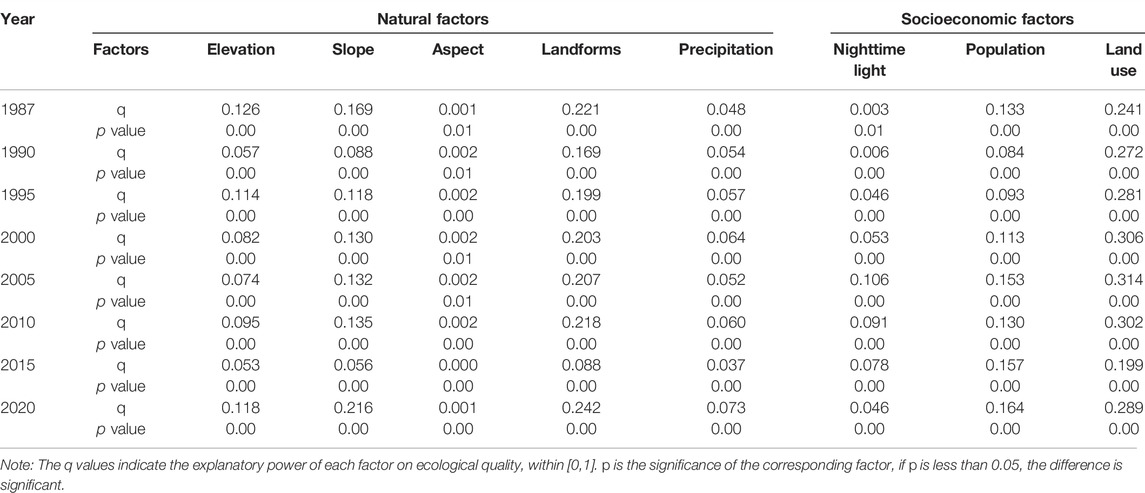
TABLE 4. Influence of anthropogenic and natural factors on ecological changes between 1987 and 2020.
Discussion
Possibility and Advantages of RSEI
The ecological environmental quality of the South China’s coastal zone during 1987–2020 was obtained from four indexes calculated from an open-source, freely accessible remote sensing dataset, followed by the first principal component of the PCA as the RSEI. The results of PCA show that the contribution rate of the first principal component is more than 75%, and the average contribution rate is 94.86%. RSEI has a high correlation with each index, which can well represent the overall information of the four indexes of greenness, dryness, wetness, and heat. On the other hand, the RSEI allows us to obtain the real eco-environmental condition quickly and easily compared with the traditional eco-environmental quality assessment method. In addition, we can also conduct large-scale ecological quality assessment and spatial and temporal visualization (S. Zhang et al., 2021b), and this will help scholars to further delineate the scope of the coastal zone ecological reserve precisely and further improve the efficiency of ecological protection (Lin et al., 2016). Simultaneously, it also avoids the inaccuracies caused by the use of statistics in the traditional ways of ecological environment quality evaluation. Therefore, the combined results of four ecological environment-related indicators used in this study will reflect the ecological environment quality of the coastal zone more comprehensively and accurately than the single-factor indicator method, avoiding the limitations of applying single-factor evaluation.
Potential Driving Factors of Ecological Quality in the Coastal Zones of Southern China
The RSEI of the South China coastal zones between 1987 and 2020 is divided into five classes (H. Xu 2013). The results showed a trend of decreasing and then increasing ecological quality of the coastal zone dominated by good and moderate values between 1987 and 2010, and the same trend of decreasing and then rebounding ecological quality between 2010 and 2020. Further analysis of the spatial differences in the evolution of ecological and environmental quality in the coastal zone of South China during the study period showed that it formed a spatial distribution pattern of three parts with obvious evolutionary differences in the east, middle, and west. Combining the results of the GeoDetector’s analysis of influencing factors, we can conclude that the hills, mountains, the areas with relatively high altitude, significant vegetation growth, and low levels of reclamation and utilization appear to have better ecological environment quality in the study area, and this is consistent with the findings of Qiu et al. (2013). In the eastern part of the study area, areas with poor ecological quality are concentrated in the offshore part, and this area is mostly used for construction and agriculture. In the middle part of the study area, there are low-elevation plains and terraces that are easy to develop and transform. Consequently, it became an economic development center in the coastal region of southern China, where economic development promotes the artificial surface at an unprecedented scale. Gradually, this has led to a variety of urban ecological problems, including urban heat islands. In the western part of the study area, Google Earth’s high-resolution image analysis revealed that the dominant land type in the area is agricultural land, abandoned land, and sharply reduced forest land. These findings indicate that urban expansion and encroachment of agricultural activities on forest land will contribute to a significant decline in ecological quality, which is consistent with the results of Chen’s study (Cabecinha et al., 2007; Chen et al., 2009). Therefore, we conclude that with rapid economic development and urban expansion, impervious surfaces and the development of agricultural land took up an increasing amount of ecological land between 1987 and 2020. Therefore, we need to strictly limit urban expansion in the east and central parts of the country and strictly limit the use of land resources in the west to achieve a scientific and rational use of land and to protect the ecological environment of the bay area.
Development of Ecological Quality Conservation Measures in Coastal Zones of Southern China
The South China coastal zone is an important area for China’s economic development and contributes a major part of country’s GDP (Z. Sun and Graham 2015). Although some studies have shown that the ecological quality of coastal areas as a whole is improving, non-urbanized areas are the major contributor to this improvement (Zheng et al., 2020). The quality of the ecological environment in the southern coastal region of China is not yet optimistic. Poor quality is predominantly concentrated in densely populated urban areas, and the demand for economic development has fueled human-dominated land cover changes, resulting in a series of ecological challenges within urban environments, including the transition of ecological and vegetated land into impervious surfaces, which leads to an increase in the surface temperature (Zhou et al., 2016; Ouyang et al., 2021). On the other hand, the quality of the ecological environment in less populated areas is also degraded due to the illegal transformation of ecological land through agricultural and other anthropogenic activities.
Human development activities on the earth’s surface will continue to have an adverse impact on the quality of the ecological environment in the future. Therefore, it is critical to rationally design the link between increasing impervious surfaces and ecology within urban environments (Ramadan et al., 2004). At present, the primary focus of governance and protection in southern coastal region of China is on macro-scale policy formulation, resulting in significant disparities between urban and rural areas, as well as between regions (Ling and Ping-Xiang 2016; Kuang 2020). Administrative districts are unreasonably divided, resulting in both overlapping and cross-cutting, or even void, scope of governance. In addition, due to differences in objectives and standards between specific functions, there is a lack of coordination and cross-departmental communication between relevant management departments, and relevant planning or management systems are formulated only from the perspective of their own business or industry development, lacking macro-general principles and objectives, resulting in a lack of effective management of the ecological environment (Hou et al., 2016). It is therefore necessary to focus on county-level planning and remediation in order to improve the quality of the local ecological environment and the well-being of local residents. The ecological quality can be improved through the reasonable configuration of urban green spaces, which not only reduces the density of impervious surface but also helps to achieve harmonious economic development.
The Challenges for Future Study
Although this study obtained satisfactory results in the evolution of ecological quality from 1987 to 2020, there are still some challenges. First, only Landsat TM and OLI multispectral images were used in this study; however, the application of hyperspectral and high-resolution imagery may lead to better ecological quality assessment results. Second, because the South China coastal region is more sensitive to external changes, a shorter time interval for ecological evaluation of the coastal region may be needed to better understand the ecological quality of the coastal zone. Therefore, in the future work, we will adopt a six-month interval to assess the ecological quality and will also consider a rich collection of meteorological, physical, and socioeconomic driving factors for ecological quality assessment to provide meaningful insights for solving ecological challenges in the coastal zone of southern China.
Conclusion
The qualitative trend of the ecological environment quality of the southern coastal zone of China from 1987 to 2020 was analyzed considering various driving factors. We found that the application of Landsat data to obtain the RSEI can provide more meaningful information for evaluating coastal ecology, and the RSEI can be considered as a feasible tool for rapid and high-precision assessment of ecological quality in broad spatial and temporal distributions. Similarly, the results revealed that the majority of the study area is of good to moderate ecological quality, indicating a considerable need for specific approaches to improve the ecological quality. Furthermore, the evolutionary process of ecological environment quality in South China’s coastal zone over time and space exhibits frequent variations. Temporally, the overall change in the RSEI from 1987 to 2020 shows a trend of “first decreasing, then increasing, and then decreasing,” and the highest RSEI value was obtained in 2010, leading to a decline of ecological environment quality. Spatially, this study found that the study area consists of three parts, each with significant differences. The western and central parts are ecologically worse, while the eastern part is more degraded on the seaside but relatively better on the other side. Based on GeoDetector results, we found that this is primarily due to variances in geomorphology and land use patterns, resulting in regional differences in ecological and environmental quality. In conclusion, the ecological environment quality in the southern coastal zone of China is still not satisfactory, and strong measures are required to create a balance between the rapid landscape changes and ecological environment; at the same time, authorities should use the ecological monitoring techniques of remote sensing to identify ecological reserves and to achieve inter-departmental and inter-regional cooperation and development in the management of ecologically of ecologically poor areas, as well as to achieve monitoring and quantitative assessment of regional ecology through remote sensing technology.
Data Availability Statement
Publicly available datasets were analyzed in this study. This data can be found at: https://earthengine.google.com/ https://earthexplorer.usgs.gov/.
Author Contributions
YL had the original idea and designed this study. DC, ZZ, and HG were responsible for data processing and analysis. ZA contributed to the revision of the manuscript. YL and YZ contributed to writing—review and editing. All authors have read and agreed to the published version of the manuscript.
Funding
This research was supported by the National Natural Science Foundation of China (No. 41871292), the Science and Technology Program of Guangdong Province, China (No. 2018B020207002), the Marine Economy Development Foundation of Guangdong Province (No. GDNRC[2020]051) and The Guangdong Provincial Science and Technology plan project, (No.: 2021b1212100003).
Conflict of Interest
The authors declare that the research was conducted in the absence of any commercial or financial relationships that could be construed as a potential conflict of interest.
Publisher’s Note
All claims expressed in this article are solely those of the authors and do not necessarily represent those of their affiliated organizations, or those of the publisher, the editors, and the reviewers. Any product that may be evaluated in this article, or claim that may be made by its manufacturer, is not guaranteed or endorsed by the publisher.
Acknowledgments
We thank the Google Earth engine platform and developers for their support and thank the Guangdong Provincial Institute of Land and Resources Surveying and Mapping for their support of the field survey. We also thank the journal editors and reviewers for their comments and efforts on this article.
References
Aram, F., García, E. H., Solgi, E., and Mansournia, S. (2019). Urban Green Space Cooling Effect in Cities. Heliyon 5 (4), e01339. doi:10.1016/j.heliyon.2019.e01339
Bouchahma, M., and Yan, W. (2014). Monitoring Shoreline Change on Djerba Island Using Gis and Multi-Temporal Satellite Data. Arab J. Geosci. 7 (9), 3705–3713. doi:10.1007/s12517-013-1052-9
Brenner, J., Jimenez, J. A., and Sardá, R. (2006). Definition of Homogeneous Environmental Management Units for the Catalan Coast. Environ. Manage. 38 (6), 993–1005. doi:10.1007/s00267-005-0210-6
Cabecinha, E., Silva-Santos, P., Cortes, R., and Cabral, J. A. (2007). Applying a Stochastic-Dynamic Methodology (StDM) to Facilitate Ecological Monitoring of Running Waters, Using Selected Trophic and Taxonomic Metrics as State Variables. Ecol. Model. 207 (2), 109–127. doi:10.1016/j.ecolmodel.2007.04.009
Chang, C.-H., Liu, C.-C., Wen, C.-G., Cheng, I.-F., Tam, C.-K., and Huang, C.-S. (2009). Monitoring Reservoir Water Quality with Formosat-2 High Spatiotemporal Imagery. J. Environ. Monit. 11 (11), 1982–1992. doi:10.1039/B912897B
Chase, J. M., and Knight, T. M. (2013). Scale-Dependent Effect Sizes of Ecological Drivers on Biodiversity: Why Standardised Sampling Is Not Enough. Ecol. Lett. 16 (Suppl. 1), 17–26. doi:10.1111/ele.12112
Chen, S., Zhou, F., and Wu, X. (2009). Evaluation of Regional Land Use Sustainability Based on Performance Model. Trans. Chin. Soc. Agric. Eng. 31 (6), 249–253.
Crist, E., and Kauth, R. (1986). The Tasseled Cap De-mystified. Photogrammetric Eng. Remote Sensing 52 81–86.
Crist, E. P. (1985). A TM Tasseled Cap Equivalent Transformation for Reflectance Factor Data. Remote Sensing Environ. 17 (3), 301–306. doi:10.1016/0034-4257(85)90102-6
Duguay-Tetzlaff, A., Bento, V., Göttsche, F., Stöckli, R., Martins, J., Trigo, I., et al. (2015). Meteosat Land Surface Temperature Climate Data Record: Achievable Accuracy and Potential Uncertainties. Remote Sensing 7 (10), 13139–13156. doi:10.3390/rs71013139
Ermida, S. L., Soares, P., Mantas, V., Göttsche, F.-M., and Trigo, I. F. (2020). Google Earth Engine Open-Source Code for Land Surface Temperature Estimation from the Landsat Series. Remote Sensing 12 (9), 1471. doi:10.3390/rs12091471
Farr, T. G., Rosen, P. A., Caro, E., Crippen, R., Duren, R., Hensley, S., et al. (2007). The Shuttle Radar Topography MissionThe Shuttle Radar Topography Mission. Rev. Geophys. 45 (2), 183. doi:10.1029/2005RG000183
Gao, W., Zhang, S., Rao, X., Lin, X., and Li, R. (2021). Landsat TM/OLI-Based Ecological and Environmental Quality Survey of Yellow River Basin, Inner Mongolia Section. Remote Sensing 13, 4477–4514. doi:10.3390/rs13214477
Hansen, M. C., Potapov, P. V., Moore, R., Hancher, M., Turubanova, S. A., Tyukavina, A., et al. (2013). High-Resolution Global Maps of 21st-Century Forest Cover Change. Science 342 (6160), 850–853. doi:10.1126/science.1244693
Hou, X., Jing, L., Yang, S., and Li, X. (2016). Environmental-Ecological Effect of Development and Utilization of China’s Coastline and Policy Recommendations. Bull. Chin. Acad. Sci. 44, 21–35. doi:10.16418/j.issn.1000-3045.2016.10.002
Huang, H., Chen, W., Zhang, Y., Qiao, L., and Du, Y. (2021). Analysis of Ecological Quality in Lhasa Metropolitan Area during 1990-2017 Based on Remote Sensing and Google Earth Engine Platform. J. Geogr. Sci. 31 (2), 265–280. doi:10.1007/s11442-021-1846-8
Hulley, G. C., Hook, S. J., Abbott, E., Malakar, N., Islam, T., and Abrams, M. (2015). The ASTER Global Emissivity Dataset ( ASTER GED ): Mapping Earth's Emissivity at 100 Meter Spatial Scale. Geophys. Res. Lett. 42 (19), 7966–7976. doi:10.1002/2015GL065564
Houlei, Jia, Su, Wen, Huang, Huamei, Sun, Qingyang, Jiang, Guangjia, and Ma, Ronghua (2018). Dynamic Change Characteristics and its Dominant Influencing Factors of Secchi Disk Depth in Coastal and Inland Waters. Acta Opt. Sin. 38 (3), 0301001. doi:10.3788/AOS201838.0301001
Jijun, Li. (2009). Geomorphological Atlas of the People’s Republic of China. Beijing: Science Press.
Jin, G., Chen, K., Wang, P., Guo, B., Dong, Y., and Yang, J. (2019). Trade-Offs in Land-Use Competition and Sustainable Land Development in the North China Plain. Technol. Forecast. Soc. Change 141 36–46. doi:10.1016/j.techfore.2019.01.004
JPL, NASA. 2013. NASA Shuttle Radar Topography Mission Global 1 Arc Second [Data Set]. NASA EOSDIS Land Process. DAAC. Available at: https://doi.org/10.5067/MEaSUREs/SRTM/SRTMGL1.003 (Accessed December 24, 2021).
Kalnay, E., Kanamitsu, M., Kistler, R., Deaven, D., Gandin, L., Iredell, M., et al. (1996). The NCEP/NCAR 40-Year Reanalysis Project. Bull. Amer. Meteorol. Soc. 77 (3), 437–471. doi:10.1175/1520-0477(1996)077<0437:TNYRP>2.0
Kennedy, R. E., Andréfouët, S., Cohen, W. B., Gómez, C., Griffiths, P., Hais, M., et al. (2014). Bringing an Ecological View of Change to Landsat-Based Remote Sensing. Front. Ecol. Environ. 12 (6), 339–346. doi:10.1890/130066
Kuang, W., Liu, Y., Dou, Y., Chi, W., Chen, G., Gao, C., et al. (2015). What Are Hot and what Are Not in an Urban Landscape: Quantifying and Explaining the Land Surface Temperature Pattern in Beijing, China. Landscape Ecol. 30 (2), 357–373. doi:10.1007/s10980-014-0128-6
Kuang, W. (2020). National Urban Land-Use/Cover Change since the Beginning of the 21st Century and its Policy Implications in China. Land Use Policy 97 (January 2019), 104747. doi:10.1016/j.landusepol.2020.104747
Kummu, M., De Moel, H., Salvucci, G., Viviroli, D., Ward, P. J., and Varis, O. (2016). Over the Hills and Further Away from Coast: Global Geospatial Patterns of Human and Environment over the 20th-21st Centuries. Environ. Res. Lett. 11 (3), 034010. doi:10.1088/1748-9326/11/3/034010
Lambin, E. F., and Meyfroidt, P. (2011). Global Land Use Change, Economic Globalization, and the Looming Land Scarcity. Proc. Natl. Acad. Sci. U.S.A. 108 (9), 3465–3472. doi:10.1073/pnas.1100480108
Li, Q., Lu, Y., Hu, S., Hu, Z., Li, H., Liu, P., et al. (2016). Review of Remotely Sensed Geo-Environmental Monitoring of Coastal Zones. J. Remote Sensing 20 (5), 1216–1229. doi:10.11834/jrs.20166168
Liang, L., Wang, Z., and Li, J. (2019). The Effect of Urbanization on Environmental Pollution in Rapidly Developing Urban Agglomerations. J. Clean. Prod. 237, 117649. doi:10.1016/j.jclepro.2019.117649
Lin, Q., and Yu, S. (2018). Losses of Natural Coastal Wetlands by Land Conversion and Ecological Degradation in the Urbanizing Chinese Coast. Sci. Rep. 8 (1), 1–10. doi:10.1038/s41598-018-33406-x
Lin, Y., Jingfeng, F., Quan, W., Shuxi, L., and Binyong, L. (2016). Primary Exploration of Ecological Theories and Technologies for Ecological Redline Zones Delineation. Acta Eco Sin 36 (5), 9. doi:10.5846/stxb201407091405
Ling, L. W., and Ping-Xiang, Y. U. (2016). Analysis and Prediction of Coupled Coordination Level of Urbanization and Eco-Environment in Guangdong Province. J. Northwest A&F Univ. 129, 107864. doi:10.13968/j.cnki.1009-9107.2016.04.20
Liu, Q., Trinder, J., and Turner, I. L. (2017). Automatic Super-resolution Shoreline Change Monitoring Using Landsat Archival Data: a Case Study at Narrabeen-Collaroy Beach, Australia. J. Appl. Remote Sens 11 (1), 016036. doi:10.1117/1.jrs.11.016036
Locher-Krause, K. E., Volk, M., Waske, B., Thonfeld, F., and Lautenbach, S. (2017). Expanding Temporal Resolution in Landscape Transformations: Insights from a Landsat-Based Case Study in Southern Chile. Ecol. Indicators 75, 132–144. doi:10.1016/j.ecolind.2016.12.036
Ma, X., Wang, C., Yu, Y., Li, Y., Dong, B., Zhang, X., et al. (2018). Ecological Efficiency in China and its Influencing Factors-A Super-efficient SBM Metafrontier-Malmquist-Tobit Model Study. Environ. Sci. Pollut. Res. 25 (21), 20880–20898. doi:10.1007/s11356-018-1949-7
Melet, A., Teatini, P., Le Cozannet, G., Jamet, C., Conversi, A., Benveniste, J., et al. (2020). Earth Observations for Monitoring Marine Coastal Hazards and Their Drivers. Surv. Geophys. 41, 1489–1534. doi:10.1007/s10712-020-09594-5
Ouyang, X., Tang, L., Wei, X., and Li, Y. (2021). Spatial Interaction between Urbanization and Ecosystem Services in Chinese Urban Agglomerations. Land Use Policy 109 (March), 105587. doi:10.1016/j.landusepol.2021.105587
Peng, S., Ding, Y., Liu, W., and Li, Z. (2019). 1 Km Monthly Temperature and Precipitation Dataset for China from 1901 to 2017. Earth Syst. Sci. Data 11 (4), 1931–1946. doi:10.5194/essd-11-1931-2019
Petrie, B., Barden, R., and Kasprzyk-Hordern, B. (2015). A Review on Emerging Contaminants in Wastewaters and the Environment: Current Knowledge, Understudied Areas and Recommendations for Future Monitoring. Water Res. 72 (0), 3–27. doi:10.1016/j.watres.2014.08.053
Piracha, A. (2015). “EDevelopment-Assessment as “Smart Eplanning” for New South Wales (NSW) Australia,” in Planning Support Systems and Smart Cities: Proceedings of CUPUM 2015: The 14th International Conference on Computers in Urban Planning and Urban Management, MIT, Cambridge, MA, July 7-10, 2015, 273-1–273–19.
Qiu, B., Zeng, C., Chen, C., Zhang, C., and Zhong, M. (2013). Vegetation Distribution Pattern along Altitudinal Gradient in Subtropical Mountainous and Hilly River Basin, China. J. Geogr. Sci. 23 (2), 247–257. doi:10.1007/s11442-013-1007-9
Ramadan, E., FengFeng, X.-z., and Cheng, Z. (2004). Satellite Remote Sensing for Urban Growth Assessment in Shaoxing City, Zhejiang Province. J. Zheijang Univ.-Sci. 5 (9), 1095–1101. doi:10.1631/jzus.2004.1095
Salvati, L. (2014). A Socioeconomic Profile of Vulnerable Land to Desertification in Italy. Sci. Total Environ. 466-467, 287–299. doi:10.1016/j.scitotenv.2013.06.091
Shi, T., Weiteng, T., Zhang, W., and Zhou, Q. (2019). Spatiotemporal Relationship between Ecological Environment and Economic Development in Tropical and Subtropical Regions of Asia. Trop. Conservation Sci. 12, 194008291987896. doi:10.1177/1940082919878961
Song, X.-P., Hansen, M. C., Stehman, S. V., Potapov, P. V., Tyukavina, A., Vermote, E. F., et al. (2018). Global Land Change from 1982 to 2016. Nature 560 (7720), 639–643. doi:10.1038/s41586-018-0411-9
Sun, J., Li, G., Wang, Q., and Zhang, B. (2020). Ecological Environments of Tropical and Subtropical Regions in China. Trop. Conservation Sci. 13 (50), 194008292094202. doi:10.1177/1940082920942022
Sun, Z., and Graham, B. (2015). Explaining Regional Disparities of China’s Economic Growth: Geography, Policy and Infrastructure. Berkeley, CA: University of California. AvaliableAt: https://www.econ.berkeley.edu/sites/default/files/Thesis_ZhengyunSun.pdf.
Tian, B., Wu, W., Yang, Z., and Zhou, Y. (2016). Drivers, Trends, and Potential Impacts of Long-Term Coastal Reclamation in China from 1985 to 2010. Estuarine, Coastal Shelf Sci. 170, 83–90. doi:10.1016/j.ecss.2016.01.006
Tong, Y., Zhang, Z., Wang, X., Guo, X., and Xiao, Y. (2021). Feasibility Study on Monitoring Soil Erosion Using Persistent Scatterer Synthetic Aperture Radar Interferometry Technology. Trans. Chin. Soc. Agric. Eng. 37 (14), 127–134. doi:10.11975/j.issn.1002-6819.2021.14.014
Wang, F., Rencheng, Y. U., Jingxi, L. I., Dehua, M., Wang, C., Jia, M., et al. (2021). Big Earth Data in Support of Marine Sustainable Development. Bull. Chin. Acad. Sci. (Chinese Version) 36 (8), 932. doi:10.16418/j.issn.1000-3045.20210707003
Wang, J., and Chengdong, X. U. (2017). Geodetector: Principle and Prospective. Acta Geographica Sinica 72 (1), 116–134. doi:10.11821/dlxb201701010
Ward, R. D., Friess, D. A., Day, R. H., and MacKenzie, R. A. (2016). Impacts of Climate Change on Mangrove Ecosystems: A Region by Region Overview. Ecosystem Health and Sustainability 2 (4), e01211. doi:10.1002/ehs2.1211
Weihong, Z., Zhang, J., Mengmeng, Z., Xiaolong, D. U., Zhang, Y., Yang, Y., et al. (2017). The Detection and Monitoring of Available Heavy Metal Content in Soil: A Review. Chin. J. Eco-Agriculture 25 (4), 605–615. doi:10.13930/j.cnki.cjea.160904
Xie, H., He, Y., and Xie, X. (2017). Exploring the Factors Influencing Ecological Land Change for China's Beijing-Tianjin-Hebei Region Using Big Data. J. Clean. Prod. 142, 677–687. doi:10.1016/j.jclepro.2016.03.064
Xu, H. (2013). A Remote Sensing Index for Assessment of Regional Ecological Changes. China Environ. Sci. 33 (5), 889–897.
Xu, H., Wang, M., Shi, T., Guan, H., Fang, C., and Lin, Z. (2018a). Prediction of Ecological Effects of Potential Population and Impervious Surface Increases Using a Remote Sensing Based Ecological Index (RSEI). Ecol. Indicators 93 (May), 730–740. doi:10.1016/j.ecolind.2018.05.055
Xu, L., Zhang, L., and Du, Z. (2021). Coastal Ecological Environment Monitoring and Protection System Based on Multisource Information Fusion Decision. J. Sensors 2021 (October), 1–15. doi:10.1155/2021/5194700
Xu, S., Zhao, Q., Yin, K., Cui, B., and Zhang, X. (2016). Study on Urban Heat Island Effect and its Response to the Vegetation Eco-Environmental Quality. Nektarios Chrysoulakis 10008, 97–107. doi:10.1117/12.2240913
Xu, X., Liu, J. Y., Zhang, S. W., Li, R. D., Yan, C., and Wu, S. (2018b). China Multi Period Land Use and Land Cover Remote Sensing Monitoring Data Set (Cnlucc). Data Registration and Publishing System of Resource and Environmental Science Data Center of Chinese Academy of Sciences.
Yang, X., Meng, F., Fu, P., Zhang, Y., and Liu, Y. (2021). Spatiotemporal Change and Driving Factors of the Eco-Environment Quality in the Yangtze River Basin from 2001 to 2019. Ecol. Indicators 131, 108214. doi:10.1016/j.ecolind.2021.108214
Ye, Y. P., and Liu, L. J. (2000). A Preliminary Study on Assessment Indicator System of Provincial Eco-Environmental Quality in China. Res. Environ. Sci. 13 (3), 33–36. doi:10.13198/j.res.2000.03.36.yeyp.011
Zhai, T., Wang, J., Fang, Y., Qin, Y., Huang, L., and Chen, Y. (2020). Assessing Ecological Risks Caused by Human Activities in Rapid Urbanization Coastal Areas: Towards an Integrated Approach to Determining Key Areas of Terrestrial-Oceanic Ecosystems Preservation and Restoration. Sci. Total Environ. 708, 135153. doi:10.1016/j.scitotenv.2019.135153
Zhang, L., Ren, Z., Chen, B., Gong, P., Fu, H., and Xu, B. (2021a). A Prolonged Artificial Nighttime-Light Dataset of China (1984-2020).” National Tibetan Plateau Data Center. Natl. Tibetan Plateau Data Cent. doi:10.11888/Socioeco.tpdc.271202
Zhang, S., Yang, P., Xia, J., Qi, K., Wang, W., Cai, W., et al. (2021b). Research and Analysis of Ecological Environment Quality in the Middle Reaches of the Yangtze River Basin between 2000 and 2019. Remote Sensing 13 (21), 4475. doi:10.3390/rs13214475
Zheng, Z., Wu, Z., Chen, Y., Yang, Z., and Marinello, F. (2020). Exploration of Eco-Environment and Urbanization Changes in Coastal Zones: A Case Study in China over the Past 20 Years. Ecol. Indicators 119 (March), 106847. doi:10.1016/j.ecolind.2020.106847
Zhi-bing, C., and Zhang, K. (2021). Moderate Separation Reform OfEconomic Zone and Administrative Zone: Practice Logic, Typical Models and Orientation Choice. REFORM 11 (30), 30–41.
Zhong, L., Liu, X., and Yang, P. (2020). Regional Development Gap Assessment Method Based on Remote Sensing Images and Weighted Theil Index. Arab J. Geosci. 13 (22), 1176. doi:10.1007/s12517-020-06043-w
Zhou, Y., Bo, T., Ying, H., Wu, W., Qi, X., Shu, M., et al. (2016). Degradation of Coastal Wetland Ecosystem in China: Drivers, Impacts, and Strategies. Bull. Chin. Acad. Sci. 31 (10), 1157–1166. doi:10.16418/j.issn.1000-3045.2016.10.004
Zhu, L., Meng, J., and Zhu, L. (2020). Applying Geodetector to Disentangle the Contributions of Natural and Anthropogenic Factors to NDVI Variations in the Middle Reaches of the Heihe River Basin. Ecol. Indicators 117 (January), 106545. doi:10.1016/j.ecolind.2020.106545
Keywords: ecological quality, coastal zone of South China, RSEI, spatial and temporal, Landsat
Citation: Li Y, Abbas Z, Chen D, Zhu Z, Guo H and Zhao Y (2022) The Eco-Environmental Changes in Typical Coastal Zones of Southern China From 1987 to 2020: A Case Study of Guangdong Coastal Counties. Front. Environ. Sci. 10:874364. doi: 10.3389/fenvs.2022.874364
Received: 12 February 2022; Accepted: 14 March 2022;
Published: 13 April 2022.
Edited by:
Peng Liu, Institute of Remote Sensing and Digital Earth (CAS), ChinaReviewed by:
Iwan Rudiarto, Diponegoro University, IndonesiaGui Jin, China University of Geosciences Wuhan, China
Copyright © 2022 Li, Abbas, Chen, Zhu, Guo and Zhao. This is an open-access article distributed under the terms of the Creative Commons Attribution License (CC BY). The use, distribution or reproduction in other forums is permitted, provided the original author(s) and the copyright owner(s) are credited and that the original publication in this journal is cited, in accordance with accepted academic practice. No use, distribution or reproduction is permitted which does not comply with these terms.
*Correspondence: Yaolong Zhao, zhaoyaolong@m.scnu.edu.cn; Haijing Guo, guohaijing.gdgs@gmail.com