Meteorological Influence of Mineral Dust Distribution Over South-Western Africa Deserts Using Reanalysis and Satellite Data
 Lerato Shikwambana
 Mahlatse Kganyago
- 1Earth Observation Directorate, South African National Space Agency, Pretoria, South Africa
- 2School of Geography, Archaeology and Environmental Studies, University of the Witwatersrand, Johannesburg, South Africa
This study investigated the meteorological influence of mineral dust in the south-western African region using satellite and reanalysis datasets by studying 1) the seasonal transport and distribution of mineral dust in the region; 2) the relationship between precipitation, wind and desert dust, and 3) the long-term trends of dust column density, precipitation rate and surface wind speed. The results show that the Namib desert is the main source of dust in the region, with the density and distribution varying by seasons. The study found that the greatest dust distribution occurs in the June-July-August (JJA) season, attributed to the southwesterly winds which transport the dust into the interior of the region. Moreover, small dust aerosols less that 20 µm are observed at highest altitudes between 7 and 10.28 km. Favourable meteorological such as strong and fast winds and low precipitation, and low vegetation played a vital role in the production and distribution of dust aerosols. Over a long time (i.e., from 1990 to 2020), dust column density trend increased, while precipitation and surface wind speed trends decreased. This study provides significant basis for assessing and monitoring of the desertification processes and their effect on regional climate variability and change in Southwest Africa, where data is ground-based data is scarce and related efforts are rare.
1 Introduction
Tropospheric aerosols ascend from natural sources such as sea-spray, volcanoes and mineral dust. Other sources of tropospheric aerosols occur from anthropogenic activities such as biomass burning, combustion of fossil fuels and from gas-to-particles conversion processes (Feiyu et al., 2008). Aerosols have substantial ability to influence the radiation transfer through the atmosphere and atmosphere water cycle, thus influence the Earth’s climate directly and indirectly (Hui et al., 2005).
Mineral dust is a major component of atmospheric aerosol loading with the strongest source regions in the Saharan Desert (Caquineau et al., 2002; Washington et al., 2003; Papayannis et al., 2005; Adams et al., 2012; Ginoux et al., 2012; Chouza et al., 2016; Shikwambana and Sivakumar 2018). These dust aerosols fluctuate in space and time, with variability in mass of more than 4 orders of magnitude (Mahowald et al., 2009; Mahowald et al., 2014). Due to its specific optical properties, airborne mineral dust can absorb and scatter both terrestrial and solar radiation with direct and indirect effects on the climate (Li et al., 1996; Buseck and Mihaly 1999; Sokoliket al. 2001; Dufresne et al., 2002; Johnson and Osborne 2011; Gehlot et al., 2015). Mineral dust aerosols are accountable for substantial climate forcing through their indirect effects on cloud and precipitation processes and their direct effects on solar and thermal radiation. The transport of mineral dust by prevailing winds from the Saharan Desert (Prospero 1996; Prospero 1999; Kallos et al., 2006; Knippertz and Todd 2012; Ridley et al., 2014), and from the Arabian desert (Prakash et al., 2015; Shalaby et al., 2015; Francis et al., 2017) have been extensively reported. However, in southern Africa only a few studies concerning mineral dust have been reported by authors such as Tesfaye et al. (2015), Dansie et al. (2017) to name a few. Bryant et al. (2007) conducted a study that focused on dust emissions from the Makgadikgadi Pans of Botswana using various satellite data such as the Total Ozone Mapping Spectrometer (TOMS) and Moderate Resolution Imaging Spectrometer (MODIS) for the period of 1980–2000. In their study they found that surface wind speed variability, sediment inflows, the extent and frequency of lake inundation intermittently influenced the desert dust loadings. Furthermore, Bhattachan et al. (2012) showed that vegetation loss and dune remobilization in the Southern Kalahari can promote dust emissions comparable to those observed from major contemporary dust sources in the Southern African region. An update dust plume source inventory for southern Africa was presented by Vickery et al. (2013). In this work they detected 328 distinct daytime dust plumes which were attributed to 101 point sources. The point sources consisted largely of ephemeral inland lakes, coastal pans as well as dry river valleys originating from Namibia, Botswana, and South Africa. Furthermore, the plume observations identified sub-basin scale source clusters for the Etosha Pan, Makgadikgadi Pans as well as the south western Kalahari pan belt.
Over the past years, the use of satellites and reanalysis datasets have proven to being amongst the best methods to use for large continuous area coverage and long-time monitoring. Some of the disadvantages of satellites is that they have limited use of optical sensors in cloudy conditions. However, in this work satellite and reanalysis datasets are of great advantage since they offer the ability to view broad areas which is important for studying the distribution of dust aerosols. Mineral dust aerosol data from the Cloud-Aerosol Lidar and Infrared Pathfinder Satellite Observations (CALIPSO) (Amiridis et al., 2013; Huang et al., 2015; Zhao et al., 2015) and the Modern-Era Retrospective analysis for Research and Applications, Version 2 (MERRA-2) (Schepanski et al., 2016; Provençal et al., 2017) have been used in the past by several researchers. CALIPSO can identify the different types of aerosols such as dust and can further provide vertical height profiles of dust. MERRA-2 provides the spatial distribution of dust extinction and wind vector data.
This research aims to 1) study the seasonal distribution of mineral dust, 2) study the seasonal distribution of meteorological parameters that impact on the mineral dust, 3) study the seasonal vertical height profiles of dust and 4) study the trend analysis of dust and some meteorological parameters that influence the dust distribution. The study presented here is organised as follows: the study region is discussed in Section 2 while details of the data used is given in Section 3. Section 4 contains a discussion of the results and conclusions are given in Section 5.
2 Study Site
Figure 1 shows the two main deserts in southern Africa, i.e. the Namib and Kalahari. The Namib is a costal desert which stretches <2000 km along the Atlantic coasts of South Africa, Namibia and Angola. The descent of dry air of the Hadley Cell cooled by the cold Benguela current along the coast causes the Namib’s aridity. In central Namib, the desert extends for approximately 140 km inland (Lancaster et al., 1984), becoming narrower at its northern and southern extremities (Lancaster et al., 1984). Within the desert, coastal plains are characterised by high air humidity, no rain and mild air temperatures. On the other hand, eastern part of the desert is characterized by low air humidity, high air temperatures, and summer rainfall prevail (Hachfeld and Jürgens 2000).
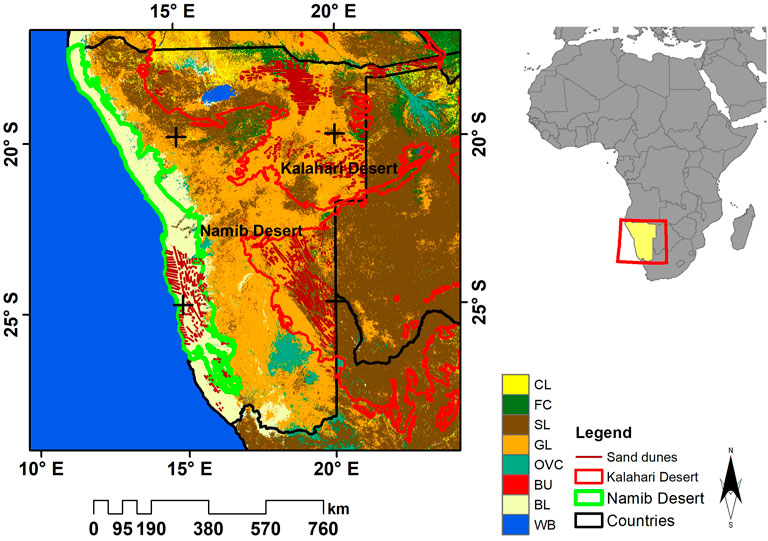
FIGURE 1. Locations of deserts and selected pans in southern Africa.
The Kalahari Desert (a large semi-arid sandy savannah) is located approximately 600 km east of the Namib desert. It occupies the northernmost part of the Northern Cape province in South Africa, the eastern third of Namibia, the southeastern parts of Angola and almost all of Botswana. The longest north-south extent is ∼1,600 km, and its greatest east-west distance is ∼970 km. Precipitation in the northern Kalahari can reach ∼635 mm annually and the precipitation in the southern Kalahari can reach ∼254 mm annually.
3 Data and Methods
3.1 Data
3.1.1 CALIPSO
CALIPSO has been in orbit since 2006 and has been collecting data ever since. The specifications of CALIPSO are discussed in detail by Winker et al. (2003, 2010). One the objectives for CALIPSO is to provide measurements on the spatial and vertical distribution of aerosols globally. There are three basic types of Level 2 data products: profile products, layer products, and the vertical feature mask (VFM), and these data products are provided at various spatial resolutions. The level 2 processing involves three major steps which are discussed in detail by Winker et al. (2009).
Level 3 aerosol profile product reports monthly averaged statistics based on quality-screened level 2 aerosol extinction profiles at 532 nm below 12 km in altitude, vertically gridded to mean-sea-level. Further details on the methodology used for the generation of the Level 3 products can be found in Winker et al. (2013), Tackett et al. (2018). The mean bias becomes much larger for altitudes lower that 3 km (of the order of 60%) which is attributed to the decrease of the CALIOP signal-to-noise ratio, as well as to the incomplete overlap height region of the ground based lidar and finally to the distance between the two instruments, resulting to the observation of possibly different air masses. The data, used in this study, is the all-sky dust extinction coefficients at 532 nm available from the CALIOP Level 3 aerosol profile monthly products with a horizontal resolution of 2° × 5° (latitude/longitude) and a vertical resolution of 60 m.
3.1.2 MERRA-2
The Modern-Era Retrospective analysis for Research and Applications, Version 2 (MERRA-2) was introduced to replace and extend the original MERRA dataset (Rienecker et al., 2011). It is produced using version 5.12.4 of the Goddard Earth Observing System Model (GEOS) Data Assimilation System (DAS). Gridded data are released at a 0.625° longitude × 0.5° latitude resolution on 72 sigma–pressure hybrid layers between the surface and 0.01 hPa. MERRA-2 contains the assimilation of bias-corrected AOD from the Advanced Very High Resolution Radiometer (AVHRR) and MODIS, AOD over bright surfaces obtained from the Multiangle Imaging SpectroRadiometer (MISR), and AOD from the AErosol RObotic NETwork (AERONET) (Randles et al., 2016). More details on MERRA and MERRA-2 can be found in Rienecker et al. (2008, 2011), Buchard et al. (2015, 2016), respectively. The data used in this study are the dust column density products.
3.1.3 AIRS
The Atmospheric Infrared Sounder (AIRS) instrument was launched on 4 May 2002 on the Earth Observing System (EOS) Aqua Platform. It collects information on the different layers of the atmosphere and provides hyperspectral imagery through applying various processing algorithms. The instrument collects climate data and turns it into 3-D maps of water vapour, cloud properties, and air/surface temperature. Moreover, AIRS can measure the atmospheric temperature in the troposphere with precision of ∼1 K over 1 km-thick layers under cloudy and clear conditions. AIRS also has 4 visible (VIS) and near-IR (NIR) channels between 0.40 and 0.94 μm, which are utilized for the detection of clouds in the IR FOV. The IR resolution for AIRS is 1 km in the vertical and 13.5 km in the horizontal. The VIS/NIR spatial resolution, on the other hand, is ∼2.3 km. The uncertainty of estimate for temperature profiles are 1) between 1 and 2 K/km in the troposphere and 2) between 2 and 3 K/km above the troposphere. More details of the instrument are discussed by Hartmut et al. (1995), Chahine et al. (2006), Menzel et al. (2018). In this study, we use the air temperature product.
3.1.4 TRMM
In November 1997 the Tropical Rainfall Measuring Mission (TRMM) was launched. TRMM has 5 instruments onboard namely, the Lightning Imaging Sensor (LIS), TRMM Microwave Imager (TMI), Visible and Infrared Scanner (VIRS), the Precipitation Radar (PR), Clouds and the Earth’s Radiant Energy System (CERES). Kummerow et al. (2000), Liu et al. (2012) provide comprehensive details on the specifications of the TMI, PR, VIRS and LIS instruments. The overall objective of TRMM was to use 1) to obtain and study multi-year science data sets of tropical and subtropical rainfall measurements, 2) to understand how interactions between the sea, air and landmasses produce changes in global rainfall and climate, 3) to improve modelling of tropical rainfall processes and their influence on global circulation to predict rainfall and variability at various periods, and 4) to test, evaluate and improve satellite rainfall measurement techniques. The relative bias of preceipitation has been calculated elevation wise, and the values have been characterized under three categories as under-estimation (bias <10%), overestimation (bias >10%), and approximately equal (bias range from 10% to 10%) (Yang and Luo, 2014). In this study, the precipitation rate product was used.
3.1.5 MODIS Normalised Difference Vegetation Index
The Normalised Difference Vegetation Index (NDVI) products (MOD13Q1) collection 6 (C6) product, from Moderate Imaging Spectroradiometer (MODIS) sensors onboard Aqua satellites, were averaged by season, i.e., DJF, MAM, JJA, and SON, in Google Earth Engine (GEE). The products have a spatial resolution of 250 m and spanned from 2000–2020, thus were suitable to analyse the seasonal vegetation variations in this study. The NDVI quantifies vegetation by measuring the difference between near-infrared (where there is high scattering by vegetation structure) and red light (where vegetation biochemistry causes intense absorption). Generally, NDVI values <0.1 indicate no green vegetation, values between 0.2 and 0.4 correspond to areas with sparse vegetation, values between 0.4 and 0.6 indicate moderate vegetation, while values >0.6 indicate a high density of green vegetation. The MOD13Q1 C6 product has achieved Stage 3 validation, i.e., uncertainties have been rigorously quantified over global sites. Its uncertainties are within ±0.025 (https://modis-land.gsfc.nasa.gov/ValStatus.php?ProductID=MOD13, accessed: 12/05/2022). Errors in the red band associated with residual atmospheric effects are the main source of the NDVI errors.
The summary of the data used is given in Table 1.
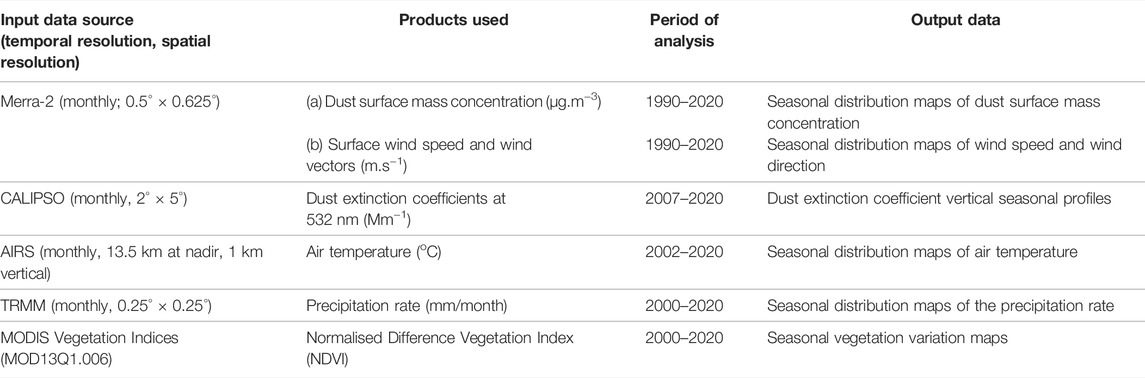
TABLE 1. Summary of the data used in this study.
3.2 Method
3.2.1 Statistical Analysis
Sneyers (1990) produced a statistical test to identify abrupt changes in significant trends. The Sequential Mann-Kendall (SQMK) test sets up two series, a progressive (forward) and a retrograde (backward) series (Sneyers, 1997; Sneyers et al., 1998; Lu et al., 2004). If the progressive and retrograde series intersect each other and diverge beyond some base value, then there is a statistically significant trend. The point where they intersect each other shows the approximate year at which the trend starts (Mosmann et al., 2004). Supplementary Appendix A1 gives the SQMK test steps in detail.
4 Results and Discussion
4.1 Seasonal Spatial and Vertical Distribution of Dust
Figure 2 shows an averaged seasonal spatial distribution of dust surface concentration overlay with 2-m wind vectors in the study region. The results clearly show that the Namib desert is the main source of dust in the region seasonally. In their study, Vickery et al. (2013) show that the Namib desert produces the highest number of plumes ∼85 compared to other dust sources in Southwest Africa. This is one of the reasons why a high dust concentration is observed in that region seasonally. Figure 2 results further show that the Kalahari Desert does not contribute significantly to the overall emission of dust in the southern African region. However, at a local scale, the Kalahari Desert could be the major contributor to the dust emissions. This is because the Kalahari is made up of biomes which is likely to trap the dust, especially during the rainy (DJF) season. The higher precipitation rate in the Kalahari also dampens the soil which reduces the formation of dust and sand. The low wind speeds also reduce the lifting and transport of sand and dust aerosols. The highest dust concentration between 0.25 and 0.30 μg m−3 in the Namib Desert is observed in the JJA season, followed up by the SON, DJF and MAM seasons, respectively. The high wind speeds in the JJA season (see Figure 2C) are the main source of the high concentration of dust. The strong winds lift large amounts of sand and dust from bare, dry soils into the atmosphere. The low precipitation seasonally also ensures that the sand and dust is always dry thus making it easier for the lifting process. This process also applies to moderate wind speeds in the SON season (see Figure 2D). In the SON season, a moderate dust concentration of between 0.15 and 0.23 μg m−3 is observed. A low dust concentration between 0.1 and 0.15 μg m−3 is observed in the DJF and MAM seasons, Figures 2A,B, respectively. The low wind speed is one of the factors that influence the low concentration of dust.
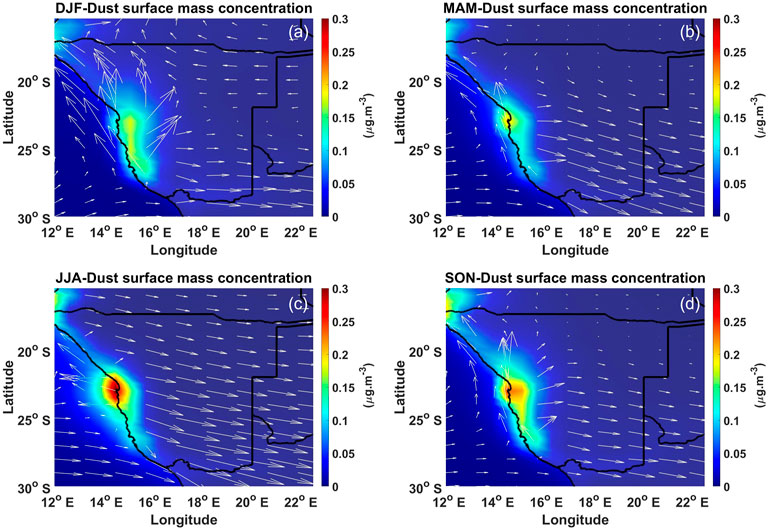
FIGURE 2. Seasonal averaged dust surface mass concentration overlay with wind vectors for the period 1998–2020 in (A) DJF, (B) MAM, (C) JJA and (D) SON, obtained from MERRA-2.
Dust aerosols exert a significant effect on the global radiative budget by scattering and absorbing longwave and shortwave radiation thereby impacting the vertical profile of temperature, atmospheric stability and precipitation (Denjean et al., 2016). It is for this reason that the knowledge of the vertical distribution of dust is important. Figure 3 shows dust extinctions profiles averaged in a latitude-longitude box. The largest dust extinction coefficients value of ∼2.7 Mm−1 is observed at the surface during the DJF season. This large extinction coefficient value implies a high dust aerosol loading at the surface. However, the dust extinction coefficients values decrease with increasing altitude indicating that most of the dust aerosols are concentrated at the surface and elevate at an altitude less than 4 km. The suppression of dust aerosols on ths surface might be due to higher precipitation rates and low wind speeds. On the other hand, elevated dust aerosols are observed during the SON season. Three distinct peaks at 7.05 km (0.25 Mm−1), 7.29 km (0.33 Mm−1) and 10.28 km (0.037 Mm−1) are observed during this period. The synthesis and elevation of these dust aerosols are due to the dry soil conditions and high wind speeds (Aili et al., 2016) experienced during this season. The high temperatures and lack of precipitation contribute favourably to the drying of the soil, which allows for the production of dust particles, and allows strong winds to transport the dust particles into the upper troposphere. Alfaro et al. (1998) showed that strong winds force particles of about 100–200 μm diameter to move in ballistic trajectories (“saltation”) close to the surface. These saltating particles can break apart or eject smaller soil particles upon impacting the soil. These smaller particles (<∼50 μm) are entrained into the boundary layer, after which they can be transported long distances.
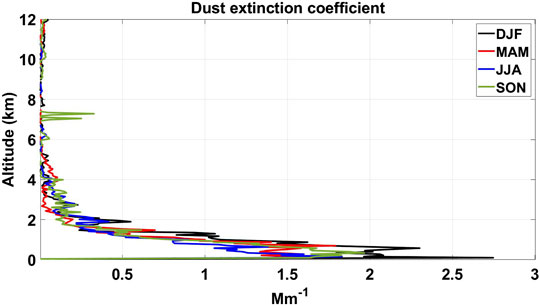
FIGURE 3. Seasonal mean dust extinction coefficient profiles from CALIPSO over the period 2007–2020, obtained from CALIPSO.
4.2 Seasonal Meteorological Conditions Over the Deserts
Meteorological parameters such as wind speed and wind direction are important to understand the dispersion and propagation directions of dust aerosols. Wind in the desert also has a vast effect on the formation of sand dunes. Wind speed and wind direction seasonal results obtained from MERRA-2 are presented in Figure 4. Although wind speed and wind direction show seasonal variations, the only consistency is the prevailing westerlies, from the Atlantic Ocean, travelling at high wind speeds of between 8.5 and 10 m s−1 every season. Moreover, the longshore southerly winds in the central coastline region are also present and are maintained by a strong pressure gradient between a permanent high-pressure cell over the ocean, the South Atlantic Anticyclone (SAA), and a thermal low over the hot, arid continental landmass (Shannon, 1985; Peard, 2007). The lowest wind speeds of between 4 and 6 m s−1 are observed over the Namib and Kalahari deserts in the DJF, MAM and SON seasons (see Figures 4A,B,D). The dominant wind directions in these seasons are the westerlies and southerlies. However, moderate wind speeds of between 7 and 8 m s−1 with dominant westerlies and easterlies winds are observed in the JJA season.
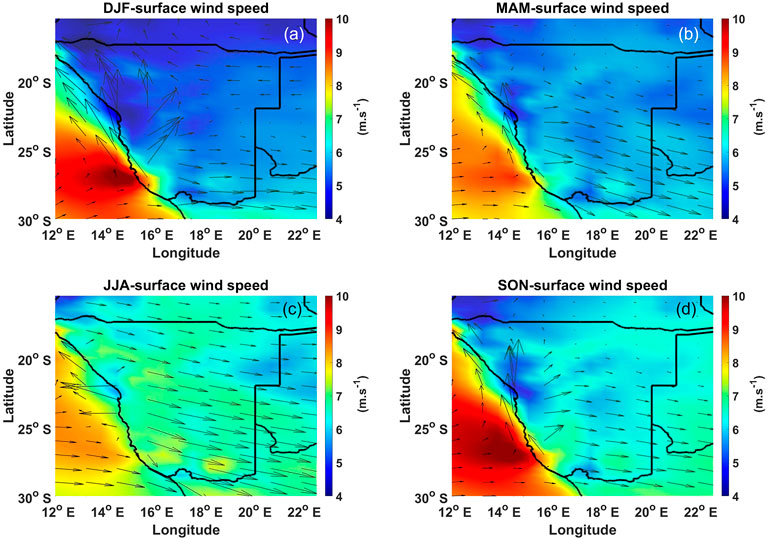
FIGURE 4. Seasonal averaged wind speed overlay with wind vectors from 1998 to 2020 in (A) DJF, (B) MAM, (C) JJA and (D) SON, obtained from MERRA-2.
Figure 5 shows the averaged seasonal precipitation rate over the study area. Overall, the precipitation over the Namib desert is extremely low, less than 50 mm/month. However, in the JJA season (see Figure 3C) the is an area (23°S, 15°E) on the southern part of the desert with a precipitation rate of ∼80 mm/month, which is the highest in the Namib Desert. On the other hand, the Kalahari Desert shows a precipitation rate variability for the different seasons. A high precipitation rate of ∼120 mm/month is observed in the DJF season (see Figure 5A) while the lowest precipitation rate of >50 mm/month is observed in the JJA and SON seasons (see Figures 5C,D). The MAM season shows a moderate precipitation rate of ∼80 mm/month. The low precipitation can be attributed to increased dust aerosol concentration. Lohmann and Feichter (2005) showed that dust aerosol can suppress precipitation by promoting the formation of small cloud droplets that do not lead to any rainfall. Furthermore, Brooks (2000) also showed that the increase in dust concentration leads to increasing atmospheric stability and reducing convection which results in decreasing rainfall. Therefore, increase concentrations of dust aerosols in the atmosphere lead to less precipitation in these deserts. Precipitation is important especially in the Kalahari Desert which has some biomes, which require some amount of water to survive.
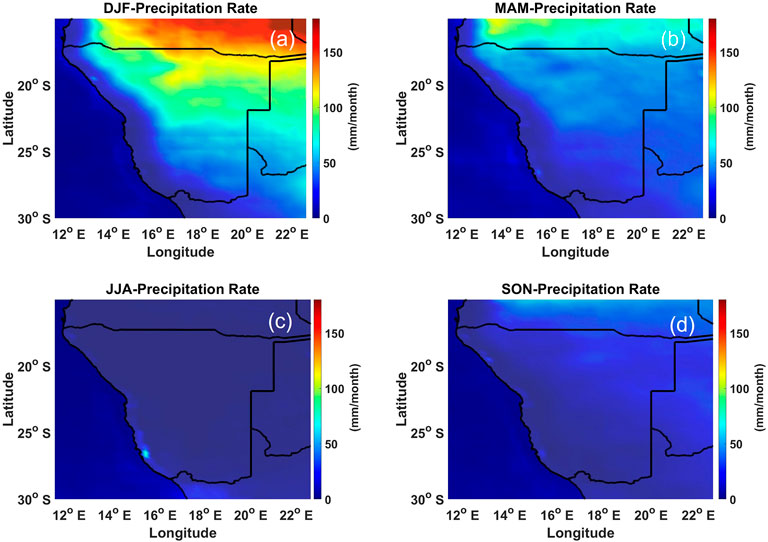
FIGURE 5. Seasonal averaged precipitation rate from 1998 to 2020 in (A) DJF, (B) MAM, (C) JJA and (D) SON, obtained from TRMM.
The average seasonal air temperature is shown in Figure 6. The highest average temperature of ∼33°C is observed over the Namib and Kalahari Deserts during the DJF season (see Figure 6A). The SON season also shows slightly high temperatures between 30 and 33°C over the Namib and Kalahari Deserts (see Figure 6D). The lowest temperature between 22 and 26°C over these deserts are observed in the JJA season (see Figure 6C), while moderate temperatures of between 26 and 30°C are observed in the MAM season (see Figure 6B). These results also show that the Namib Desert is generally warmer than the Kalahari Desert in every season. However, in the JJA season, winter fogs produced by upwelling cold currents, frequently blanket coastal deserts (such as the Namib Desert) and block solar radiation, thus making the JJA season cold. Overall, coastal deserts are relatively complex because they are at the juncture of terrestrial, oceanic, and atmospheric systems.
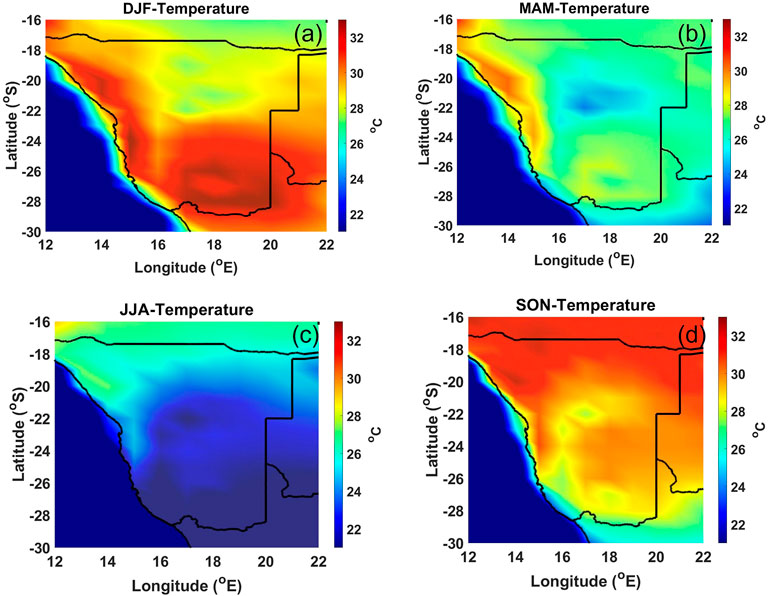
FIGURE 6. Seasonal averaged temperature for the period of 1998–2020 in (A) DJF, (B) MAM, (C) JJA and (D) SON, obtained from AIRS.
4.3 Seasonal and Spatial Variation of Vegetation
Figure 7 shows the seasonal distribution of NDVI over the study area. The Namib Desert shows NDVI values of <0.1 for all seasons, indicating that no vegetation is present at any time of the season over the area. This area is dominated by bare sand and dust. However, during the DJF and MAM seasons (see Figures 7A,B), high NDVI values >0.7 are observed in the northern parts of the Kalahari Desert. This indicates that these seasons have some vegetation. The higher precipitation rates in these seasons (see Figures 5A,B) aid in providing the water needed for the growth of the plants. Rainfall is the main determinant for the growth of plants in this area. Vegetation coverage in the Kalahari Desert is a crucial factor affecting wind erosion and airborne dust accumulation. High vegetation coverage traps the dust fall and thus reduces the transport and dispersion of the dust. This study does not aim to quantify the amount of dust trapped, but there are interesting studies aiming to quantify the trapping effect of different vegetation coverages on the aeolian dust to better understand the role of vegetation in aeolian dust accumulation in arid and semi-arid regions (Yan et al., 2011). The JJA and SON seasons (see Figures 7C,D) in the Kalahari Desert show low to moderate values of NDVI between 0.2 and 0.4. The northern parts of the Kalahari Desert show values of ∼0.4, while the southern parts of the Kalahari Desert show values of ∼0.2. These values indicate that during these seasons the area comprises sparse vegetation which is due to a lack of rainfall. Furthermore, with sparse vegetation, it is anticipated that slightly more dust would be removed from the soil and transported into the atmosphere. In fact, the NDVI for JJA and SON are consistent with the seasonally averaged dust surface mass concentration results (Figure 5).
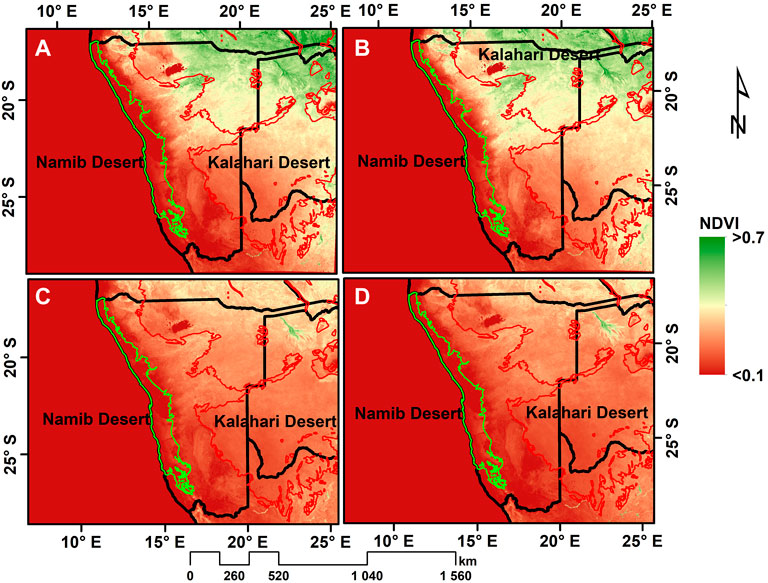
FIGURE 7. Seasonal NDVI map distribution in (A) DJF, (B) MAM, (C) JJA and (D) SON seasons, obtained from MODIS MOD13Q1 product.
4.4 Trend Analysis Observations
The SQMK test is applied to detect the trends in the dust column density, precipitation rate and surface wind speeds. One of the reasons the SQMK test is used in this study is that it is not very sensitive to outliers (Mondal et al., 2015). Furthermore, the precipitation rate and wind speed parameters were selected because they have some influence on the dust column density, therefore correlating the parameters can explain why the trend of the dust column density is observed. Figure 8A shows an increasing trend of the dust column density from the year 1990 to the year 2020. An increasing dust column density over time means an increase in dust aerosol loading which leads to the degradation in air quality. A decrease in precipitation over time would lead to dry soil conditions and great chances for the creation of dust from the bare soil. Figure 8B shows a decreasing precipitation rate from the year 2006 to the year 2020. This is the period with the highest/increasing dust column density. High wind speeds are responsible for 1) lifting the dust from the surface and 2) higher wind speeds would be responsible for the transport and distribution of the dust. Figure 8C shows a decreasing surface wind speed trend over time. This result means less of the dust is being transported to distant places but rather more dust particles are being removed from the bare soil thus increasing the column density of the dust. Overall, the precipitation and wind speed observations support the observation of the increasing dust density over time.
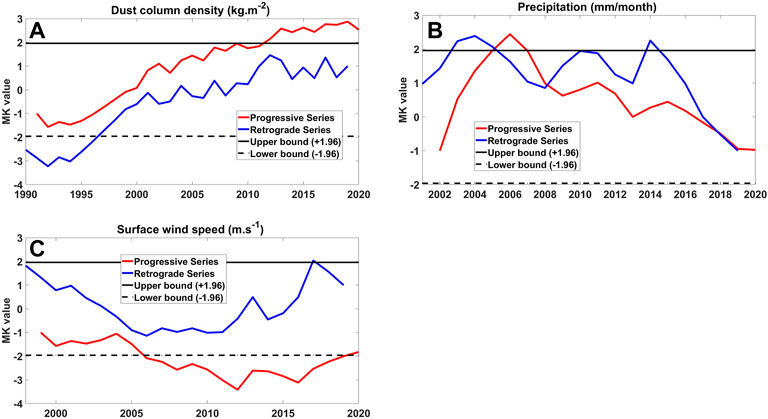
FIGURE 8. Progressive series and retrograde series trends from the SQMK test for (A) dust column density, (B) precipitation rate and (C) surface wind speed.
4.5 Relationship Between Precipitation, Wind and Desert Dust
Rosenfeld et al. (2001) showed that the reduction of precipitation affected by desert dust can cause drier soil, which in turn raises more dust, thus providing a possible feedback loop to further decrease precipitation. The elevated dust is then transported to various places by the wind. The transport of dust particles by wind occurs in several modes, which depend predominantly on particle size and wind speed. The dust particles are not normally directly lifted by wind because their inter-particle cohesive forces are large compared to aerodynamic forces, instead, these small particles are predominantly ejected from the soil by the impacts of saltating particles (Gillette et al., 1974). Following the ejection, dust particles are susceptible to turbulent fluctuation and thus usually enter short-term (∼20–70 µm diameter) or long-term (<20 µm diameter) suspension (Kok et al., 2012). Long-term suspended dust can remain in the atmosphere for up to several weeks and can thus be transported thousands of kilometres from source regions (Kok et al., 2012). However, the acceleration of particles with diameters over ∼500 μm is strongly limited by their large inertia, and these particles generally do not saltate (Shao, 2008).
5 Conclusion
The study uses a multi-dataset approach to study the relationship between meteorological parameters and desert dust aerosols. The study specifically looks at the deserts in south-western Africa as this is the least studied region. This study further closes the knowledge gap that exists in dust aerosols in south-western Africa, where the ground data are scarce and monitoring efforts are rare. The results clearly show that the Namib desert is the main source of dust in the Southwest African region seasonally. The greatest distribution of dust is observed in the JJA season and the southwesterly winds are accountable for the transport of dust into the interior. However, winds in the northerly direction are responsible for the transport of dust over the Atlantic Ocean. Furthermore, the highest dust aerosols were observed at ∼7 and 10 km which suggests that the dust particles are <20 µm in diameter (Kok et al., 2012). This study demonstrated that meteorological parameters play an important role in the production and distribution of dust aerosols. High temperatures and lack of precipitation contribute to the drying of the bare soil creating an enabling condition to produce dust. Strong winds lift the dust from the soil and distribute the dust. This study is important because it could be used as a basis to investigate desertification, primarily from a climate change point of view, in Southwest Africa. Moreover, the study can be expanded to study the transport of dust aerosol to other areas and how this dust impacts the local cloud fraction and precipitation in those areas.
Data Availability Statement
Publicly available datasets were analyzed in this study. This data can be found here: giovanni.gsfc.nasa.gov/.
Author Contributions
LS and MK contributed to conception and design of the study. LS and MK carried out the investigation. LS and MK carried out the formal analysis. LS wrote the first draft of the manuscript. MK wrote sections of the manuscript. All authors contributed to manuscript revision, read, and approved the submitted version.
Conflict of Interest
The authors declare that the research was conducted in the absence of any commercial or financial relationships that could be construed as a potential conflict of interest.
Acknowledgments
The author acknowledges the GES-DISC Interactive Online Visualization and Analysis Infrastructure (Giovanni) for providing the MERRA-2, TRMM and AIRS. The author thanks the NASA Langley Research Centre Atmospheric Science Data Centre for the CALIPSO data.
Supplementary Material
The Supplementary Material for this article can be found online at: https://www.frontiersin.org/articles/10.3389/fenvs.2022.856438/full#supplementary-material
Publisher’s Note
All claims expressed in this article are solely those of the authors and do not necessarily represent those of their affiliated organizations, or those of the publisher, the editors and the reviewers. Any product that may be evaluated in this article, or claim that may be made by its manufacturer, is not guaranteed or endorsed by the publisher.
References
Adams, A. M., Prospero, J. M., and Zhang, C. (2012). CALIPSO-derived Three-Dimensional Structure of Aerosol over the Atlantic Basin and Adjacent Continents. J. Clim. 25, 6862–6879. doi:10.1175/JCLI-D-11-00672.1
Aili, A., Kim Oanh, N. T., and Abuduwaili, J. (2016). Variation Trends of Dust Storms in Relation to Meteorological Conditions and Anthropogenic Impacts in the Northeast Edge of the Taklimakan Desert, China. Ojap 05, 127–143. doi:10.4236/ojap.2016.54010
Alfaro, S. C., Gaudichet, A., Gomes, L., and Maillé, M. (1998). Mineral Aerosol Production by Wind Erosion: Aerosol Particle Sizes and Binding Energies. Geophys. Res. Lett. 25, 991–994. doi:10.1029/98gl00502
Amiridis, V., Wandinger, U., Marinou, E., Giannakaki, E., Tsekeri, A., Basart, S., et al. (2013). Optimizing CALIPSO Saharan Dust Retrievals. Atmos. Chem. Phys. 13, 12089–12106. doi:10.5194/acp-13-12089-2013
Bhattachan, A., D’Odorico, P., Baddock, M. C., Zobeck, T. M., Okin, G. S., and Cassar, N. (2012). The Southern Kalahari: a Potential New Dust Source in the Southern Hemisphere? Environ. Res. Lett. 7, 024001. doi:10.1088/1748-9326/7/2/024001
Bou Karam Francis, D., Flamant, C., Chaboureau, J.-P., Banks, J., Cuesta, J., Brindley, H., et al. (2017). Dust Emission and Transport over Iraq Associated with the Summer Shamal Winds. Aeolian Res. 24, 15–31. doi:10.1016/j.aeolia.2016.11.001
Brooks, N. (2000). Environmental Change and Land-Atmosphere Interactions in Northern Africa: The Role of Saharan Dust. Norwich, U. K: Ph.D. thesis, Clim. Res. Unit, Univ. of East Anglia.
Bryant, R. G., Bigg, G. R., Mahowald, N. M., Eckardt, F. D., and Ross, S. G. (2007). Dust Emission Response to Climate in Southern Africa. J. Geophys. Res. 112, D09207. doi:10.1029/2005JD007025
Buchard, V., da Silva, A. M., Colarco, P. R., Darmenov, A., Randles, C. A., Govindaraju, R., et al. (2015). Using the OMI Aerosol Index and Absorption Aerosol Optical Depth to Evaluate the NASA MERRA Aerosol Reanalysis. Atmos. Chem. Phys. 15, 5743–5760. doi:10.5194/acp-15-5743-2015
Buchard, V., da Silva, A. M., Randles, C. A., Colarco, P., Ferrare, R., Hair, J., et al. (2016). Evaluation of the Surface PM2.5 in Version 1 of the NASA MERRA Aerosol Reanalysis over the United States. Atmos. Environ. 125, 100–111. doi:10.1016/j.atmosenv.2015.11.004
Buseck, P. R., and Pósfai, M. (1999). Airborne Minerals and Related Aerosol Particles: Effects on Climate and the Environment. Proc. Natl. Acad. Sci. U.S.A. 96, 3372–3379. doi:10.1073/pnas.96.7.3372
Caquineau, S., Gaudichet, A., Gomes, L., and Legrand, M. (2002). Mineralogy of Saharan Dust Transported over Northwestern Tropical Atlantic Ocean in Relation to Source Regions. J. Geophys. Res. 107, 247. doi:10.1029/2000JD000247
Chahine, M. T., Pagano, T. S., Aumann, H. H., Atlas, R., Barnet, C., Blaisdell, J., et al. (2006). Airs. Bull. Amer. Meteor. Soc. 87, 911–926. doi:10.1175/bams-87-7-911
Chouza, F., Reitebuch, O., Benedetti, A., and Weinzierl, B. (2016). Saharan Dust Long-Range Transport across the Atlantic Studied by an Airborne Doppler Wind Lidar and the MACC Model. Atmos. Chem. Phys. 16, 11581–11600. doi:10.5194/acp-16-11581-2016
Dansie, A. P., Wiggs, G. F. S., Thomas, D. S. G., and Washington, R. (2017). Measurements of Windblown Dust Characteristics and Ocean Fertilization Potential: The Ephemeral River Valleys of Namibia. Aeolian Res. 29, 30–41. doi:10.1016/j.aeolia.2017.08.002
Denjean, C., Cassola, F., Mazzino, A., Triquet, S., Chevaillier, S., Grand, N., et al. (2016). Size Distribution and Optical Properties of Mineral Dust Aerosols Transported in the Western Mediterranean. Atmos. Chem. Phys. 16, 1081–1104. doi:10.5194/acp-16-1081-2016
Dufresne, J.-L., Gautier, C., Ricchiazzi, P., and Fouquart, Y. (2002). Longwave Scattering Effects of Mineral Aerosols. J. Atmos. Sci. 59, 1959–1966. doi:10.1175/1520-0469(2002)059<1959:lseoma>2.0.co;2
Feiyu, M., Wei, G., Zhongmin, Z., and Pingxiang, L. (2008). The Ground-Based Lidar Combined with Sunphotometer for Aerosol Optical Depth Retrieval. Proc. SPIE 7145, 71452R. doi:10.1117/12.813083
Gehlot, S., Minnett, P. J., and Stammer, D. (2015). Impact of Sahara Dust on Solar Radiation at Cape Verde Islands Derived from MODIS and Surface Measurements. Remote Sens. Environ. 166, 154–162. doi:10.1016/j.rse.2015.05.026
Gillette, D. A., Blifford, I. H., and Fryrear, D. W. (1974). The Influence of Wind Velocity on the Size Distributions of Aerosols Generated by the Wind Erosion of Soils. J. Geophys. Res. 79, 4068–4075. doi:10.1029/JC079i027p04068
Ginoux, P., Prospero, J. M., Gill, T. E., Hsu, N. C., and Zhao, M. (2012). Global-scale Attribution of Anthropogenic and Natural Dust Sources and Their Emission Rates Based on MODIS Deep Blue Aerosol Products. Rev. Geophys. 50, RG3005. doi:10.1029/2012RG000388
Hachfeld, B., and Jürgens, N. (2000). Climate Patterns and Their Impact on the Vegetation in a Fog Driven Desert: The Central Namib Desert in Namibia. phyto 30, 567–589. doi:10.1127/phyto/30/2000/567
Hartmut, H., Aumann, H., and Miller, C. R. (1995). “Atmospheric Infrared Sounder (AIRS) on the Earth Observing System,” in Proc. SPIE 2583, Advanced and Next-Generation Satellites. Paris, France
Huang, J., Guo, J., Wang, F., Liu, Z., Jeong, M.-J., Yu, H., et al. (2015). CALIPSO Inferred Most Probable Heights of Global Dust and Smoke Layers. J. Geophys. Res. Atmos. 120, 5085–5100. doi:10.1002/2014jd022898
Hui, Y., Wenqing, L., Yihuai, L., Jianguo, L., Qingnong, W., Dexi, W., et al. (2005). Tropospheric Aerosol Observations by Lidar at Naqu, Optical Technologies for Atmospheric, Ocean, and Environmental Studies. Proc. SPIE 5832, 148–155. doi:10.1117/12.619550
Jish Prakash, P., Stenchikov, G., Kalenderski, S., Osipov, S., and Bangalath, H. (2015). The Impact of Dust Storms on the Arabian Peninsula and the Red Sea. Atmos. Chem. Phys. 15, 199–222. doi:10.5194/acp-15-199-2015
Johnson, B. T., and Osborne, S. R. (2011). Physical and Optical Properties of Mineral Dust Aerosol Measured by Aircraft during the GERBILS Campaign. Q. J. R. Meteorol. Soc. 137, 1117–1130. doi:10.1002/qj.777
Kallos, G., Papadopoulos, A., Katsafados, P., and Nickovic, S. (2006). Transatlantic Saharan Dust Transport: Model Simulation and Results. J. Geophys. Res. 111, D09204. doi:10.1029/2005JD006207
Knippertz, P., and Todd, M. C. (2012). Mineral Dust Aerosols over the Sahara: Meteorological Controls on Emission and Transport and Implications for Modeling. Rev. Geophys. 50, RG1007. doi:10.1029/2011RG000362
Kok, J. F., Parteli, E. J. R., Michaels, T. I., and Karam, D. B. (2012). The Physics of Wind-Blown Sand and Dust. Rep. Prog. Phys. 75, 106901. doi:10.1088/0034-4885/75/10/106901
Kummerow, C., Simpson, J., Thiele, O., Barnes, W., Chang, A. T. C., Stocker, E., et al. (2000). The Status of the Tropical Rainfall Measuring Mission (TRMM) after Two Years in Orbit. J. Appl. Meteor. 39, 1965–1982. doi:10.1175/1520-0450(2001)040<1965:tsottr>2.0.co;2
Lancaster, J., Lancaster, N., and Seely, M. K. (1984). Climate of the Central Namib Desert. Madoqua 14, 5
Li, X., Maring, H., Savoie, D., Voss, K., and Prospero, J. M. (1996). Dominance of Mineral Dust in Aerosol Light-Scattering in the North Atlantic Trade Winds. Nature 380, 416–419. doi:10.1038/380416a0
Liu, Z., Ostrenga, D., Teng, W., and Kempler, S. (2012). Tropical Rainfall Measuring Mission (TRMM) Precipitation Data and Services for Research and Applications. Bull. Am. Meteorol. Soc. 93, 1317–1325. doi:10.1175/bams-d-11-00152.1
Lohmann, U., and Feichter, J. (2005). Global Indirect Aerosol Effects: A Review. Atmos. Chem. Phys. 5, 715–737. doi:10.5194/acp-5-715-2005
Lu, A., He, Y., Zhang, Z., Pang, H., and Gu, J. (2004). Regional Structure of Global Warming across China during the Twentieth Century. Clim. Res. 27, 189–195. doi:10.3354/cr027189
Mahowald, N., Albani, S., Kok, J. F., Engelstaeder, S., Scanza, R., Ward, D. S., et al. (2014). The Size Distribution of Desert Dust Aerosols and its Impact on the Earth System. Aeolian Res. 15, 53–71. doi:10.1016/j.aeolia.2013.09.002
Mahowald, N. M., Engelstaedter, S., Luo, C., Sealy, A., Artaxo, P., Benitez-Nelson, C., et al. (2009). Atmospheric Iron Deposition: Global Distribution, Variability, and Human Perturbations. Annu. Rev. Mar. Sci. 1, 245–278. doi:10.1146/annurev.marine.010908.163727
Menzel, W. P., Schmit, T. J., Zhang, P., and Li, J. (2018). Satellite-Based Atmospheric Infrared Sounder Development and Applications. Bull. Am. Meteorol. Soc. 99, 583–603. doi:10.1175/bams-d-16-0293.1
Mondal, A., Khare, D., and Kundu, S. (2015). Spatial and Temporal Analysis of Rainfall and Temperature Trend of India. Theor. Appl. Climatol. 122, 143–158. doi:10.1007/s00704-014-1283-z
Papayannis, A., Balis, D., Amiridis, V., Chourdakis, G., Tsaknakis, G., Zerefos, C., et al. (2005). Measurements of Saharan Dust Aerosols over the Eastern Mediterranean Using Elastic Backscatter-Raman Lidar, Spectrophotometric and Satellite Observations in the Frame of the EARLINET Project. Atmos. Chem. Phys. 5, 2065–2079. doi:10.5194/acp-5-2065-2005
Prospero, J. M. (1999). Long-range Transport of Mineral Dust in the Global Atmosphere: Impact of African Dust on the Environment of the Southeastern United States. Proc. Natl. Acad. Sci. U.S.A. 96, 3396–3403. doi:10.1073/pnas.96.7.3396
Prospero, J. M. (1996). “Saharan Dust Transport over the North Atlantic Ocean and Mediterranean: An Overview,” in The Impact of Desert Dust across the Mediterranean. Editors S. Guerzoni, and R. Chester (Dordrecht: Springer), 133–151. doi:10.1007/978-94-017-3354-0_13
Provençal, S., Kishcha, P., da Silva, A. M., Elhacham, E., and Alpert, P. (2017). AOD Distributions and Trends of Major Aerosol Species over a Selection of the World's Most Populated Cities Based on the 1st Version of NASA's MERRA Aerosol Reanalysis. Urban Clim. 20, 168–191. doi:10.1016/j.uclim.2017.04.001
Randles, C. A., da Silva, A. M., Buchard, V., Darmenov, A., Colarco, P. R., Aquila, V., et al. (2016). “The MERRA-2 Aerosol Assimilation,” in NASA Technical Report Series on Global Modeling and Data Assimilation, 143. NASA/TM-2016-104606 45.
Rienecker, M. M., Suarez, M. J., Gelaro, R., Todling, R., Bacmeister, J., Liu, E., et al. (2011). MERRA: NASA's Modern-Era Retrospective Analysis for Research and Applications. j. Clim. 24, 3624–3648. doi:10.1175/jcli-d-11-00015.1
Rienecker, M. M., Suarez, M. J., Todling, R., Bacmeister, J., Takacs, L., Liu, H. –C., et al. (2008). Technical Report Series on Global Modeling and Data Assimilation, 27. NASA/TM–2008–104606, 92.
Schepanski, K., Mallet, M., Heinold, B., and Ulrich, M. (2016). North African Dust Transport toward the Western Mediterranean Basin: Atmospheric Controls on Dust Source Activation and Transport Pathways during June-July 2013. Atmos. Chem. Phys. 16, 14147–14168. doi:10.5194/acp-16-14147-2016
Shalaby, A., Rappenglueck, B., and Eltahir, E. A. B. (2015). The Climatology of Dust Aerosol over the Arabian Peninsula. Atmos. Chem. Phys. Discuss. 15, 1523–1571. doi:10.5194/acpd-15-1523-2015
Shannon, L. V. (1985). “The Benguela Ecosystem. 1. Evolution of the Benguela, Physical Features and Processes,” in Oceanography and Marine Biology. Editor M. Barnes, An Annual Review 23, 105
Shikwambana, L., and Sivakumar, V. (2018). Global Distribution of Aerosol Optical Depth in 2015 Using CALIPSO Level 3 Data. J. Atmos. Solar-Terrestrial Phys. 173, 150–159. doi:10.1016/j.jastp.2018.04.003
Sneyers, R. (1997). Climate Chaotic Instability: Statistical Determination and Theoretical Background. Environmetrics 8, 517–532. doi:10.1002/(sici)1099-095x(199709/10)8:5<517::aid-env267>3.0.co;2-l
Sneyers, R., Tuomenvirta, H., and Heino, R. (1998). Observations Inhomogeneities and Detection of Climate Change the Case of the Oulu (Finland) Air Temperature Series. Transp. Res. Rec. 34, 159
Sokolik, I. N., Winker, D. M., Bergametti, G., Gillette, D. A., Carmichael, G., Kaufman, Y. J., et al. (2001). Introduction to Special Section: Outstanding Problems in Quantifying the Radiative Impacts of Mineral Dust. J. Geophys. Res. 106, 18015–18027. doi:10.1029/2000jd900498
Tackett, J. L., Winker, D. M., Getzewich, B. J., Vaughan, M. A., Young, S. A., and Kar, J. (2018). CALIPSO Lidar Level 3 Aerosol Profile Product: Version 3 Algorithm Design. Atmos. Meas. Tech. 11, 4129–4152. doi:10.5194/amt-11-4129-2018
Tesfaye, M., Tsidu, G. M., Botai, J., Sivakumar, V., and deW. RautenbachRautenbach, C. J. (2015). Mineral Dust Aerosol Distributions, its Direct and Semi-direct Effects over South Africa Based on Regional Climate Model Simulation. J. Arid Environ. 114, 22–40. doi:10.1016/j.jaridenv.2014.11.002
Vickery, K. J., Eckardt, F. D., and Bryant, R. G. (2013). A Sub‐basin Scale Dust Plume Source Frequency Inventory for Southern Africa, 2005-2008. Geophys. Res. Lett. 40, 5274–5279. doi:10.1002/grl.50968
Washington, R., Todd, M., Middleton, N. J., and Goudie, A. S. (2003). Dust-storm Source Areas Determined by the Total Ozone Monitoring Spectrometer and Surface Observations. Ann. Assoc. Am. Geogr. 93, 297–313. doi:10.1111/1467-8306.9302003
Winker, D. M., Pelon, J., Coakley, J. A., Ackerman, S. A., Charlson, R. J., Colarco, P. R., et al. (2010). The CALIPSO Mission. Bull. Am. Meteor Soc. 91, 1211–1230. doi:10.1175/2010bams3009.1
Winker, D. M., Pelon, J. R., and McCormick, M. P. (2003). “The CALIPSO Mission: Spaceborne Lidar for Observation of Aerosols and cloudsProceedings. SPIE 4893,” in Lidar Remote Sensing for Industry and Environment Monitoring III. Hangzhou, China. doi:10.1117/12.466539
Winker, D. M., Tackett, J. L., Getzewich, B. J., Liu, Z., VaughanRogers, M. A. R. R., and Rogers, R. R. (2013). The Global 3-D Distribution of Tropospheric Aerosols as Characterized by CALIOP. Atmos. Chem. Phys. 13, 3345–3361. doi:10.5194/acp-13-3345-2013
Winker, D. M., Vaughan, M. A., Omar, A., Hu, Y., Powell, K. A., Liu, Z., et al. (2009). Overview of the CALIPSO Mission and CALIOP Data Processing Algorithms. J. Atmos. Ocean. Technol. 26, 2310–2323. doi:10.1175/2009jtecha1281.1
Yan, Y., Xu, X., Xin, X., Yang, G., Wang, X., Yan, R., et al. (2011). Effect of Vegetation Coverage on Aeolian Dust Accumulation in a Semiarid Steppe of Northern China. CATENA 87, 351–356. doi:10.1016/j.catena.2011.07.002
Yang, Y., and Luo, Y. (2014). Evaluating the Performance of Remote Sensing Precipitation Products CMORPH, PERSIANN, and TMPA, in the Arid Region of Northwest China. Theor. Appl. Climatol. 118, 429–445. doi:10.1007/s00704-013-1072-0
Keywords: dust aerosols, dust—extinction, CALIPSO, wind, MODIS, NDVI
Citation: Shikwambana L and Kganyago M (2022) Meteorological Influence of Mineral Dust Distribution Over South-Western Africa Deserts Using Reanalysis and Satellite Data. Front. Environ. Sci. 10:856438. doi: 10.3389/fenvs.2022.856438
Received: 17 January 2022; Accepted: 31 May 2022;
Published: 27 June 2022.
Edited by:
Zhenming Ji, Sun Yat-sen University, ChinaReviewed by:
Jose M. Baldasano, Universitat Politecnica de Catalunya, SpainShani Tiwari, Council of Scientific and Industrial Research (CSIR), India
Copyright © 2022 Shikwambana and Kganyago. This is an open-access article distributed under the terms of the Creative Commons Attribution License (CC BY). The use, distribution or reproduction in other forums is permitted, provided the original author(s) and the copyright owner(s) are credited and that the original publication in this journal is cited, in accordance with accepted academic practice. No use, distribution or reproduction is permitted which does not comply with these terms.
*Correspondence: Lerato Shikwambana, lshikwambana@sansa.org.za