A Quantitative Assessment on Ecological Compensation Based on Water Resources Value Accounting: A Case Study of Water Source Area of the Middle Route of South-To-North Water Transfer Project in China
 Junfei Chen
 Qian Wang
 Qian Li
- 1Business School, Hohai University, Nanjing, China
- 2Yangtze Institute for Conservation and Development, Hohai University, Nanjing, China
- 3Jiangsu Research Base of Yangtze Institute for Conservation and High-Quality Development, Nanjing, China
As an economic means to adjust the contradiction between ecology and development, ecological compensation plays an important role in promoting the good operation of interbasin water transfer projects and the sustainable development of regional economy. The accounting of ecological compensation is the key and difficult point of ecological compensation as well as the basis of ecological compensation policy and practice. Watershed ecological compensation based on water resources value accounting is an early exploration field of ecological compensation research, and water resources value calculation needs to consider both water quantity and water quality comprehensively. Taking the water source area of the Middle Route of South-to-North Water Transfer Project (SNWTP) as an example, this article tries to establish the payment standard of watershed ecological compensation from the perspective of water resources value. The results show that: 1) The water resources value of the six core regions in the water source area has shown an overall upward trend since 2000, and the northern regions have demonstrated higher value of water resources than the southern regions. 2) The LSTM neural network model is used to forecast the value of water resources in the six regions from 2020 to 2022, and it is found that the value of water resources would increase in the next few years. 3) The compensation price of the six regions in the water source area is predicted in the range of 0.5–1.5 yuan/m3 from 2020 to 2022, and an upward trend in the ecological compensation amount is forecast. Based on the above conclusions, this article puts forward suggestions to establish an ecological compensation accounting system in line with the Middle Route water source area from the perspectives of ecological compensation legislation, allocation of ecological compensation amount, and introduction of market mechanism.
1 Introduction
Ecological compensation is an important economic measure to ensure the sustainability of water quality and quantity in the interbasin water transfer project, which is beneficial to realize the efficiency and equity in the process of water supply and consumption in water source area and water-receiving area. One of the key points of ecological compensation lies in the accounting of ecological compensation. Different accounting methods produce different implementation effects, which have very important practical significance for the sustainability of water transfer projects and economic development of water source area. The existing studies on ecological compensation accounting methods mainly are carried out from the perspectives of ecosystem service value, beneficiary’s profit, conservator’s input and loss, payment, and compensation willingness (Xepapadeas, 2011; Hu, 2016). The common compensation accounting can be divided into protection compensation and cross-basin compensation (Wang and Hou, 2013). So far, compensation accounting methods in water source area have included ecosystem service value method (Zhang et al., 2002), water quality accounting method (Xu et al., 2008), water resources value method and willingness to pay method (Costanza, 2012), water ecological restoration cost method (Martinez-Paz et al., 2013), etc. And the ecosystem service value method is the most important accounting method. In the 1970s, the value assessment of ecosystem services begins to receive more attention from different countries and regions. Value quantity and physical quantity are mostly used to measure the value of ecosystem services internationally. Pimentel et al. (1995) proposed two methods (i.e., ecosystem optimal model and maintenance of biological balance model) to estimate the functional value of global biodiversity based on willingness to pay. Ouyang and Wang, 2000a; Ouyang et al., 2000b) divided the value of ecosystem services into four categories, namely direct use-value, indirect use-value, selection value, and heritage value, and calculated the value of six terrestrial ecological services. In the study of global environment and natural services, ecosystem service value is divided into use-value and non-use-value (Rawlins et al., 2018). Specifically, use-value includes direct use-value, choice use-value, and indirect use-value, while non-use-value is divided into existence value and heritage value (Gomez-Baggethun et al., 2010). By simulating the flow path and quantity of water supply services, Xu et al. (2019) provided a scientific theoretical basis for ecosystem service management and ecological compensation. Ma and Wang (1984) studied the complex ecosystem of Society-Economy-Nature, which marked ecologists’ march into the field of economics. Subsequently, empirical studies based on specific regions and basins began to emerge. Zhang et al. (2001) studied the service value evaluation method and divided it into three categories, namely actual market, alternative market, and simulated market. Zi (2010) evaluated the economic value of ecosystem services of water tourism resources in Heilongjiang Province, and believed that reasonable water tourism resources planning should be made with emphasis on the protection of wetlands, rivers, lakes, and other water bodies. Based on the existing achievements in this field, Xie (2012) compiled a table of equivalent factors of ecosystem service value in China. Based on the Research Report of the United Nations Environment Programme (UNEP) and combined with the theory of ecological economics, Ouyang et al. (2013) obtained the ecosystem service value evaluation methods of alternative market and simulated market. According to the existing problems in the ecological environment of the Chishui River, Qiu and Zhai (2014) established the ecological compensation mechanism. Based on the perspective of agricultural development, Hu (2015) concluded that the factors affecting the ecological compensation mechanism mainly include the loss of development opportunities, environmental protection cost, and public awareness. Yang et al. (2020) analyzed the current situation of ecological compensation in the Yellow River basin, and described the framework of water-related ecological compensation in the Yellow River Basin in detail. Xu et al. (2021) constructed a universal framework for interregional ecological compensation on the basis of considering differences among regional development.
The value of water resources was first discussed in the 1970s, and it was expressed as the maximum payment amount willing to transfer a unit of water. In the late 1980s, with the deepening of water resources crisis, water resources price has caused an upsurge of research by scholars. Lyman (1992) found that the maximum price of water resources fluctuated twice as much as the non-maximum price. Jiang (1998a) discussed the value basis of water resources from different perspectives, and his most significant contribution was to complete the calculation of the water resources value with the method of fuzzy mathematics. Wang and Qu (2001) incorporated the water resources indexes into the national economic accounting system. Piper (2003) explored the relationship between water quality and cost, and proposed the mechanism of water price affecting water quality. Wang et al. (2003) and Shen (2006) put forward the concept of “triple water price” and tried to use the general equilibrium model to calculate the actual water price in China. Subsequently, the value accounting of water resources began to cross departments and regions, and gradually tended to be market-oriented. Zhao et al. (2007) established a theoretical model of emission rights trading market based on experimental methods, and proposed the system construction scheme of resources trading market with optimal efficiency. Wei et al. (2008) analyzed the different profit levels of water conservancy departments under different water prices, so as to explore the maximization of income under the condition of the lowest water price. Du (2015) explored the improvement scheme of the real water price setting mechanism in view of the problems existing in the current water price scheme of SNWDP in China. Jia et al. (2018) used the improved fuzzy comprehensive evaluation model to calculate the maximum affordable water price of residents. Taking Taipu River as an example, Yang et al. (2019) adopted the game theory method to study the incentive policy, ecological compensation, and water quality accounting, and explored the establishment of trans-regional cooperation mechanism of water resources.
To sum up, there are many studies on ecological compensation accounting and value of water resources, but few ones connect the two to discuss, resulting in the lack of effective connection between the existing ecosystem service value accounting methods and water resources social-economic pricing. Considering that it is more easy to accept the cost (i.e., value of water resources) paid for protecting water resources as the compensation standard by both the water source area and the water receiving area, the paper takes the water source area of the Middle Route of SNWDP in China as the research object, and studies the ecological compensation accounting from the perspective of water resources value accounting, which could promote the research on the ecological compensation accounting method of water source area. The novelty of this study is that the machine learning method (i.e., K-means clustering model and LSTM model) in computer science is applied to the evaluation of water resources value in the field of ecosystem. It gives full play to the advantages of machine learning method in dealing with complex nonlinear social science topics and makes the research results more consistent with the reality.
2 Materials and Methods
2.1 Study Area
The water source area of the Middle Route of the SNWDP mainly refers to the basin area above the Danjiangkou Reservoir, which is located at the junction of Shaanxi, Henan, and Hubei provinces. The geographical coordinates of the water source area boundary are between 106°30′-112°18′E and 31°20′-34°10′N. The water source area of the middle route covers a total area of 130,906 square kilometers, with a total population of 24.26 million. The core cities in the water source area mainly include Shiyan of Hubei Province, Hanzhong, Ankang and Shangluo of Shaanxi Province, Nanyang and Sanmenxia of Henan Province (Figure 1). This area belongs to the north subtropical subhumid monsoon climate zone, with uneven distribution of precipitation. The average annual temperature is 16°C, and the annual average precipitation is about 800 mm. Han River is the main river, crossing the whole territory from west to east. The river water system in this area is relatively abundant, and large-scale water conservancy projects such as Xi River Reservoir and Shimen Reservoir have been built.
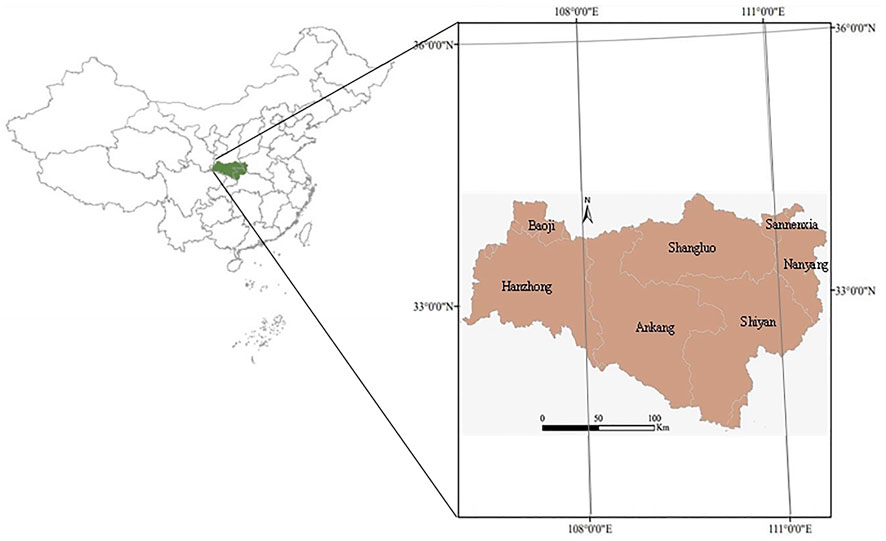
FIGURE 1. Water source district administrative zoning map. Note: The map was generated by ArcGIS 10.5. URL link: https://www.esri.com/en-us/arcgis/products/districting-for-arcgis/overview.
To protect the ecological environment of the water source area, all polluting enterprises and mines on both sides of the water source area have been closed, and garbage treatment and sewage purification plants in some cities with relatively concentrated populations have been set up by the local government. An area of 7,681 square kilometers has been brought under water and soil erosion control, more than 20,000 ha of basic farmland have been newly built and 270,000 ha of afforestation have been planted, which not only effectively controlled water and soil loss, but also promoted local economic development. In addition, the government of the water source region has actively implemented the natural forest protection project and stopped logging of natural forest commodities. Sixteen state-owned forest farms in 199 townships have been included in the project to protect natural forests, and provincial-level protected forests such as Hualongshan and Yinghu Wetland have been established. In these protected forests, the animal and plant communities are rich and complete, and the ecological environment is good as a whole. The drainage area is large and the rainfall is abundant; therefore, the water supply is sufficient, the self purification capacity is strong, and the water quality is excellent (Li et al., 2021).
The construction of the SNWDP has improved the irrigation conditions, promoted the development of fishery, forest industry, and its processing industry, and promoted the adjustment of agricultural industrial structure in the water source area. Take Nanyang, one of the core cities in the water source area, as an example. After the completion of the supporting water conservancy infrastructure related to the SNWDP, the water diversion for Nanyang can be increased by nearly 600 million cubic meters every year, with an effective irrigation area of 2,673 square kilometers, accounting for 31% of the total irrigation area of the city, which can effectively alleviate the current situation of agricultural water shortage and improve crop output in Nanyang (Wu, 2009; Yu, et al., 2021).
2.2 The Index System Construction
Referring to the existing evaluation index system of water resources value research (Fu, 2008; Hajkowicz and Higgins, 2008; Shen et al., 1998), the value of the water resources evaluation system for ecological compensation is constructed. And 21 indicators from three dimensions of nature, economy, and society are selected, as shown in Table 1. Specifically, the natural dimension indicators are considered from the perspectives of water quantity, water quality, and water development, which reflect the ecological environmental value of water resources. The economic dimension indicators reflect the economic value of water resources by considering the utilization efficiency of water resources, per capita income, and economic scale. Social dimension indicators are considered from the aspects of population, policy, social background, etc.
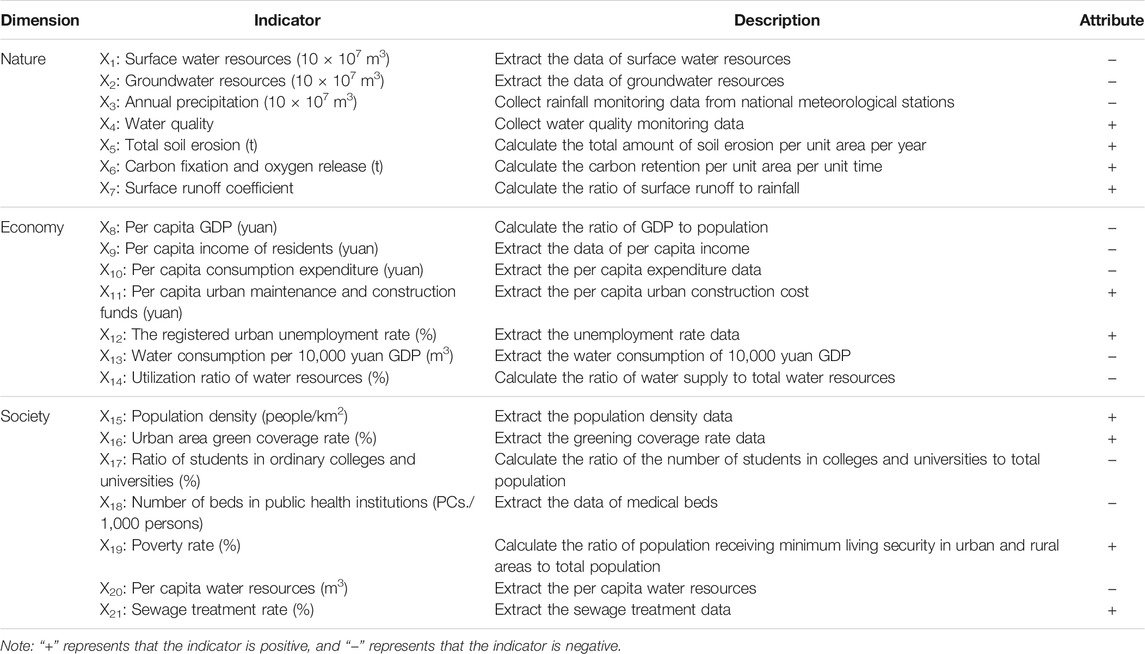
TABLE 1. Evaluation index system of water resources value.
2.3 Methods
This part mainly consists of three parts: 1) introduce the methods of water resources value measurement and comprehensive evaluation, 2) introduce the method to forecast the value of water resources in the next few years, and 3) introduce the accounting method of ecological compensation.
2.3.1 Value of Water Resources Measurement Model Based on K-Means Clustering Algorithm
The K-means clustering algorithm (Zhao et al., 2021; Liu et al., 2022) is used to measure the value of water resources in this study. Select the initialized n samples as the initial clustering center and divide n data into K sets (i.e.,
where x is the sample value,
The clustering obtained from Eq. 4 causes the data object x to be allocated to the nearest centroid. Taking the center of the observed value in the clustering as the new centroid, the family partition (i.e.,
2.3.2 Comprehensive Evaluation Method of Water Resources Value Based on Entropy Weight Method
Entropy weight method is an objective weight assignment method to determine the index weight according to the change range of information entropy (Zou et al., 2005). The indicators are divided into positive and negative, and different algorithms are needed for standardization.
When indicators are positive
When indicators are negative
Then, the information entropy and weight of indicator j are calculated as follows:
The comprehensive score of sample i is
Calculate the total score of each cluster of samples, and sort them according to the score, so as to distinguish the level of water resources value.
2.3.3 Value of Water Resources Prediction Model Based on LSTM Algorithm
As an improved algorithm of recurrent neural network (RNN), long short-term memory network (LSTM) model can preserve valid data information in long-term time series, which has good support for the persistence of data information. The LSTM model has both forward and back propagation functions. By changing part of the data into training set, the parameters are constantly updated in the learning process, and the processing and discarding of historical data are controlled by internal algorithm. Therefore, the LSTM model is suitable for dealing with time series problems (Omlin and Giles, 1996; Wang et al., 2018). When establishing the value of water resources prediction model based on LSTM to predict the evaluation index
The sequence Xi(m) is adopted to predict the value (i.e.,
The selection of sliding window d is very critical. In this article, referring to the existing literature (Gers et al., 2000; Wang et al., 2018) and combining with the data of the water source area, the size of the sliding window is set as 5. On the basis of first-order difference, regularization, and other preprocessing of the data, the data from 2000 to 2005 are used as the training set to predict the value of water resources grade in 2006, the data from 2001 to 2006 are used as the training set to predict the value of water resources grade in 2007, and so on, the data from 2015 to 2019 are used as the training set to predict the value of water resources grade in 2020.
The main steps of water resources value prediction using LSTM are as follows:
1) To improve the stability of the time series and solve the over-fitting phenomenon that may occur in the process of prediction, the data set is stabilized (i.e., difference) and regularized;
2) The training set D is constructed according to the size of the sliding window d;
3) Establish the value of water resources prediction model based on LSTM and initialize the model parameters;
4) The prediction model is trained by the training set D. The gradient descent method is used to back propagate, and update the model parameters until the prediction accuracy requirements are met;
5) Input the first d historical observation value sequence
2.3.4 Calculation Method of Ecological Compensation Amount Based on Value of Water Resources
In this article, the difference between the upper limit of water price and the cost of current water price is taken as the upper limit of compensation amount, and then the ecological compensation amount is calculated according to the value of water resources. The upper limit of water price presents the water price when it reaches the maximum water price bearing index. In the calculation of ecological compensation in water source area, to convert the dimensionless evaluation level of water resources value into the scalar value of corresponding water price, it is necessary to introduce the price vector (Jiang, 1998b; Li et al., 2010; Zhu et al., 2017). The water price is calculated as follows:
where P is the price of water resources, V is the value level of water resources, and
The price of water resources is calculated according to the water price bearing index method, which reflects the affordability of consumers to pay for water commodities.
where A is water cost bearing index, SW is water cost expenditure, and AE is income of residents. According to the international standard of water price bearing index for developing countries, 3% of residents’ per capita income is generally taken as the maximum water price bearing index for households (Gakidou et al., 2017).
At present, the current water price in China mainly includes water resources fee, water supply cost, and sewage treatment fee. The upper limit of the water resources compensation price is calculated as follows:
where PU is the upper limit of water resources compensation price, E is per capita disposable income of residents, B is per capita water consumption, C is water supply cost, D is water resources fee, and F is sewage treatment fee.
The compensation price upper limit PU is divided according to arithmetic series, and the compensation price vector is calculated as follows:
Finally, the ecological compensation in the water source area is calculated as follows:
where W is the amount of ecological compensation (100 million yuan/year), P is compensation price (yuan/m3), QW is the annual water regulation (108 m3/year), and G is the water quality adjustment coefficient.
2.4 Data Sources
The data of regions in the core water source area of the Middle Route of the SNWDP from 2000 to 2019 is collected and analyzed. The data are cited from Water Resources Bulletin of the study area (2000–2019), China Statistical Yearbook (2001–2020), and China Urban Construction Yearbook (2000–2019).
3 Results
3.1 Calculation of Water Resources Value in Water Source Area of the Middle Route of SNWTP
3.1.1 Classification of Water Resources Value Based on K-Means Algorithm
Since value of water resources accounting belongs to high-dimensional data clustering in clustering algorithm, dimension reduction is required. Feature extraction has become a common method, and its principle is to map the original feature set from high-dimensional space to low-dimensional space using the linear mapping method (Yu and Li, 2009). In this paper, principal component analysis (Cui et al., 2020) is adopted to extract features from high-dimensional data, and the two indicators of surface water resources and groundwater resources are finally selected to measure their dissimilarity, namely

FIGURE 2. Comparison diagram of k-means clustering results.
The optimal K value is determined by the elbow method. Based on the deviation sum of squares (SSE) index, when SSE decreases gently with the increase in K, it indicates that the K value corresponding to elbow is the optimal cluster number (Hou et al., 2005). SSE is calculated as follows:
The errors of water resources value accounting based on the K-means clustering algorithm under the selection of different cluster numbers are shown in Figure 3. When the curvature is the highest, the K value corresponding to the elbow is 5. Therefore, the value of water resources in the water source region is divided into five categories. At this time, there is no grade relationship between the five categories.
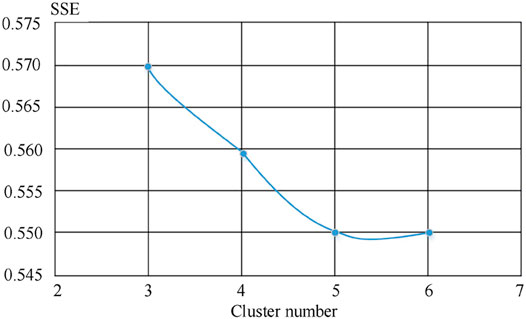
FIGURE 3. Relation diagram of K-means clustering on the evaluation error of water resources value and cluster number.
After obtaining the classification results of the water resources value data in the water source area based on the K-means algorithm, the entropy weight method could be used to comprehensively score each category. The total scores are sorted in order, namely, V1-V5, where V1 represents the lowest grade and V5 represents the highest grade. The scoring results of V1-V5 are shown in Table 2.

TABLE 2. Comprehensive evaluation results based on the entropy weight method.
3.1.2 Comprehensive Evaluation of Water Resources Value Based on Entropy Weight Method
The entropy weight method was used to calculate the weight of indicators in the value of water resources evaluation system constructed based on the three dimensions of nature, economy, and society. The results are shown in Figure 4.
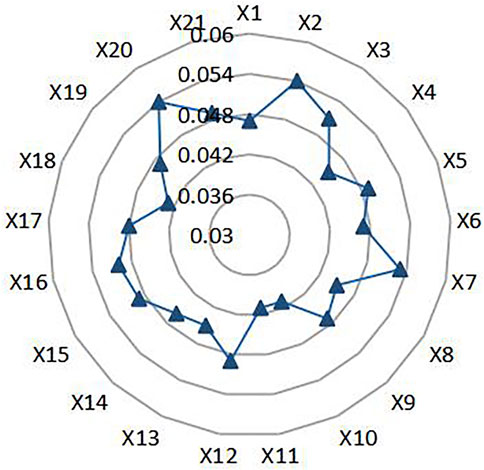
FIGURE 4. The result of index weight evaluation based on the entropy weight method.
By using the entropy weight method, the value of water resources of six regions in the core water source area of the Middle Route of the SNWDP from 2000 to 2019 is evaluated (Figures 5–7). As shown in Figures 5–7, the blue dotted line represents the trend line of water resources value from 2010 to 2019, the value of water resources of the six core regions in the water source area has shown an overall upward trend from 2000 to 2019. The value of water resources in northern regions (e.g., Sanmenxia, Nanyang, and Shangluo) was higher than that in the southern regions (e.g., Shiyan, Ankang, and Hanzhong) in terms of spatial distribution. The increasing rate of water resources value in different regions varied significantly in terms of time distribution. The value of water resources of Shiyan showed an obvious upward trend, while that of Hanzhong and Ankang had a gentle upward trend.
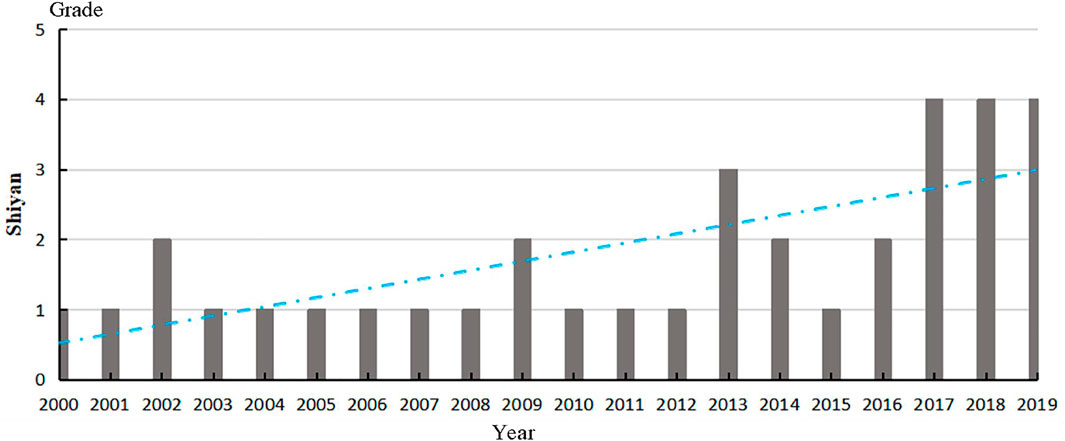
FIGURE 5. Evaluation results of water resources value in Shiyan city, Hubei province.
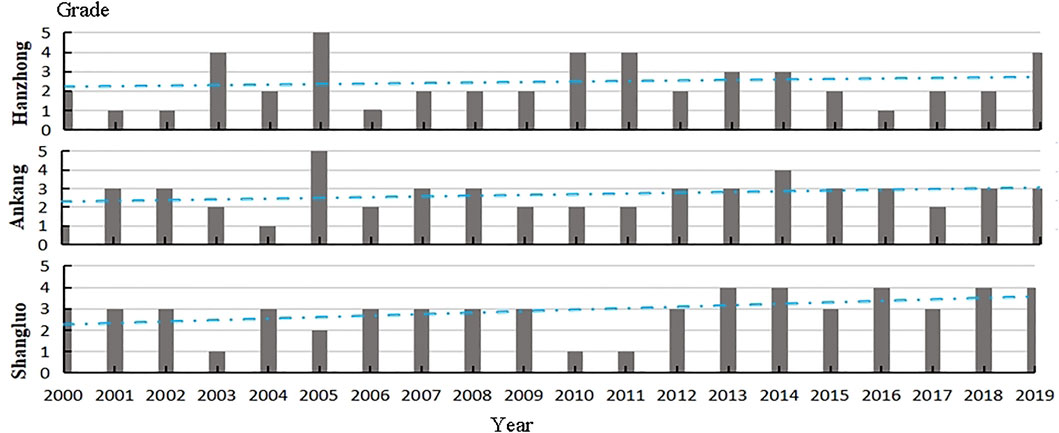
FIGURE 6. Evaluation results of water resources value in three regions of Shaanxi province.
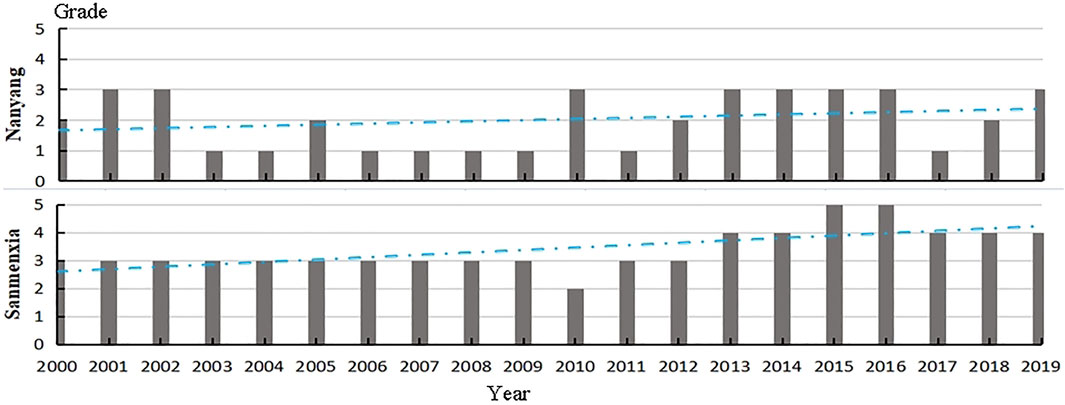
FIGURE 7. Evaluation results of water resources value in Henan province.
Specifically, as can be seen from Figure 5, the value of water resources in Shiyan has shown an obvious upward trend since 2013. The value of water resources of Shiyan was basically stable at V1 level from 2000 to 2012, and only increased to V2 level in 2002 and 2009. After 2013, it basically stayed above V2 level, then rose and stayed at V4 level for a long time from 2017 to 2019. There was little difference between the three regions in southern Shanxi in terms of water resources value, among which, Shangluo had the highest value of water resources, Ankang took the second place, and Shangluo had the lowest value, as shown in Figure 6. The value of water resources in Hanzhong was generally stable. The value of water resources in Ankang was at V2 level before 2012. Thereafter, it increased to V3 level. The value of water resources in Shangluo increased the most, which stabilized at V3 level before 2013, and rose to V4 level after 2013. The value of water resources in Sanmenxia was obviously higher than that in Nanyang (Figure 7). The value of water resources of Nanyang was mostly at or below V3 level, while that of Sanmenxia reached at or above V3 level.
3.2 Value of Water Resources Forecast in Water Source Area of the Middle Route of SNWTP
The prediction results of the water resources value in the water source area of the Middle Route of the SNWTP from 2020 to 2022 are shown in Table 3.
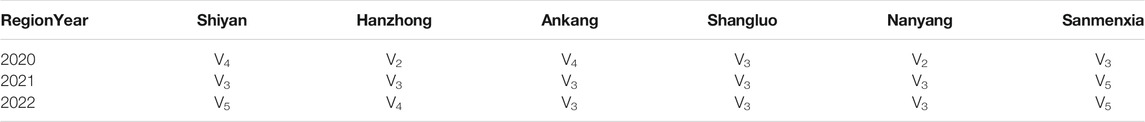
TABLE 3. Water resources value of regions in water source area in 2020–2022.
The overall level of water resources value in each region will experience an upward trend in varying degrees in the future. However, the value of water resources in Hanzhong in 2022 may be lower than that in 2021, which is due to the fact that natural precipitation is the main source of water resources in Hanzhong, and its annual precipitation has an oscillation cycle of 13∼14 years. After 2020, when the next rainy period is entered, the amount of water resources will increase. It should be noted that the value assessment of water resources is a high-dimensional and complex research subject, which is affected by many factors such as water quantity and quality, ecological environment, economic development, continuous investment cost of water transfer project, etc. Any change in the above factors may lead to changes in the overall valuation of water resources value.
Overall, the prediction results could basically reflect the actual situation of water resources value of core regions in the water source area from 2020 to 2022. However, with the increase in domestic and industrial water consumption, the value of water resources will be further improved in the water source area.
3.3 Accounting for Ecological Compensation in the Water Source Area of the Middle Route of SNWTP
3.3.1 Ecological Compensation Price Accounting
In terms of water supply cost and normal profit, the total cost of water supply of the Middle Route project is 3.142 billion yuan, and the average unilateral comprehensive water supply cost is 0.305 yuan/m3 (Tan and Zhu, 1998). The Middle Route Project spans several watersheds, and the management costs vary between different provinces and regions. Generally speaking, the water resources fee of the whole project is roughly stable between 0.02 and 0.2 yuan/m3 (Zhang et al., 2006). Combined with the experts’ suggestions and the general situation of the water source area, the water resources fee is calculated at 0.2 yuan/m3 in this paper. As for sewage treatment fee, the average treatment costs of sewage plants in Hanzhong, Ankang, and Shangluo are 0.97 yuan/m3, 1.74 yuan/m3, and 1.05 yuan/m3, respectively, whereas the average collection of sewage treatment fee in these three regions is only 0.47 yuan/m3 (Ma, 2014). Considering the situation of other regions in the water source area, 0.5 yuan/m3 is taken as the sewage treatment fee in this paper.
The ecological compensation prices of Shiyan, Sanmenxia, Nanyang, Shangluo, Ankang, and Hanzhong are calculated based on the predicted value of water resources grade results from 2020 to 2022 (Table 3). Taking the data of Shiyan in 2020 as an example, the annual disposable income of residents is 21,435 yuan, and the total water consumption of the city is 9.09 yuan × 108 m3, the total population is about 3.5 million. Therefore, the upper limit of compensation price in Shiyan in 2020 can be calculated as follows:
The LSTM model is adopted to predict that the value of water resources of Shiyan in 2020 is at V4 level, and the compensation price of Shiyan in 2020 is calculated as follows:
The calculation results of ecological compensation prices of regions in the core water source area of the Middle Route in 2020–2022 are shown in Table 4.
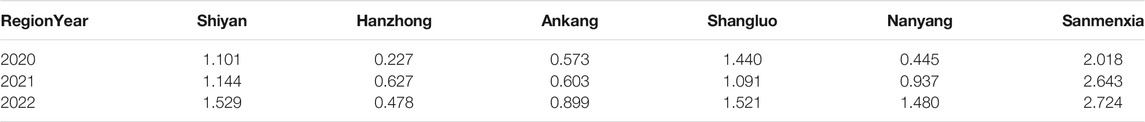
TABLE 4. Ecological compensation prices of regions in water source areas in 2020–2022. Unit: yuan.
As can be seen from Table 4, the compensation prices of regions in the water source area show an overall upward trend from 2020 to 2022. There would be obvious fluctuations in compensation prices in some regions. For instance, the compensation prices in Shangluo will drop in 2021. The regions with the highest and lowest compensation prices will be Sanmenxia and Hanzhong, respectively. From the perspective of time, the compensation prices in the water source area from 2020 to 2022 will have the largest change range in Nanyang, and the smallest change range in Shangluo. The compensation prices of six regions in the water source area in 2020–2022 will be mostly in the range of 0.5–1.5 yuan/m3. Taking 1 yuan/m3 and 2 yuan/m3 as different compensation gradient boundaries, the compensation prices in Hanzhong and Ankang will be lower than 1 yuan/m3 from 2020 to 2022. The compensation prices in Nanyang will be less than 1 yuan/m3 in 2020 and 2021, and then show an upward trend in 2022. The compensation prices in Shiyan and Shangluo will be between 1 and 2 yuan/m3 in the next few years. Sanmenxia will have the highest compensation prices, which are predicted basically to be above 2 yuan/m3 from 2020 to 2022.
3.3.2 Ecological Compensation Accounting
As for the water quality adjustment coefficient C, the principle of “high quality, high price” shall be followed, and the adjustment coefficient is determined according to the water quality situation. Table 5 shows the rule of water quality adjustment coefficient value.
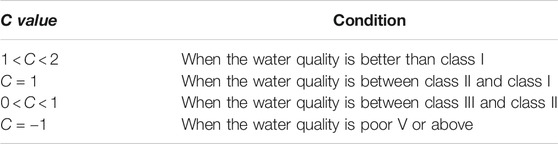
TABLE 5. The rule of water quality adjustment coefficient value.
According to the monitoring of relevant departments in China, the water quality in Danjiangkou reservoir area has been stable above the national class II standard for many years. Therefore, the C value is taken as 1.
Based on the compensation prices of water resources per cubic meter in the six regions in the water source area from 2020 to 2022, the ecological compensation amount is calculated in combination with the annual average water transfer and water quality of each city (Table 6). For instance, Shiyan is rich in water resources, and the average annual water inflow into Danjiangkou Reservoir is 3.62 × 10⁹ m3. The annual water diversion from Danjiangkou reservoir accounts for about 26% of the total water inflow. Therefore, the annual water diversion from Shiyan is about 9.41 × 10⁸ m3. Based on Eq. 16, it can be calculated that the ecological compensation amount of Shiyan in 2020 is 1.036 billion yuan.
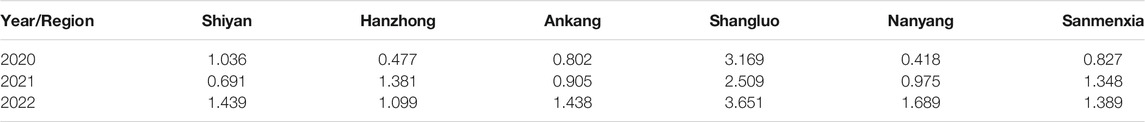
TABLE 6. Amount of ecological compensation for regions in water source areas in 2020–2022. Unit: 109 yuan.
As can be seen from Table 6, the accounting results of ecological compensation amount of regions in the water source area show an upward trend from 2020 to 2022, and the overall change trend is the same as that of ecological compensation prices of regions. As the calculation of ecological compensation amount needs to comprehensively consider the compensation price, water quality, and quantity, the compensation prices and amount in some regions do not match very well. For instance, the compensation prices of water resources in Sanmenxia are predicted high with a relatively low compensation amount. And the compensation prices of water resources in Shangluo are in the opposite situation that the compensation prices of water resources are predicted low with a relatively high compensation amount.
The annual compensation amount in the water source area from 2020 to 2022 will be the highest in Shangluo and the lowest in Hanzhong. According to the prediction results, the ecological compensation amount from 2020 to 2022 is divided into three gradients. The first gradient will include Ankang and Nanyang, with the compensation almost in the range of 0.5–1 billion yuan. The second gradient will include Shiyan, Hanzhong, and Sanmenxia, whose compensation is in the range of 1–2 billion yuan. The third gradient will include Shangluo, with the compensation in the range of 2–4 billion yuan. In 2021, the epidemic has affected the production and life of residents, resulting in reduced water demand. Therefore, the growth trend of ecological compensation amount in some regions slowed down or even fell back, which was also reflected in the prediction results.
4 Discussion
4.1 Trend Analysis of Water Resources Value
By comparing the historical data and the calculation results of water resources value of core regions in the water source area, it can be seen that the change of water resources value in the water source area had experienced three stages.
4.1.1 Initial Rising Stage of Water Resources Value
The first stage is from 2000 to 2005, during which the reservoir area had suitable climate, abundant water resources, and suitable ecological environment. The value of water resources was relatively stable and low, basically at V1 or V2 levels. The Middle Route project started in 2005. To make the water quality reach the high level, polluting enterprises have been rectified or even shut down. The value of water resources was coming into focus and increased obviously since that year.
4.1.2 Unstable Change Stage of Water Resources Value
The second stage is from 2006 to 2013. At the end of 2008, the Danjiangkou Reservoir area immigration pilot was officially launched. As of September 2010, there were 65,000 immigrants and the poor population increased. The Middle Route of the SNWDP was completed in 2013 and was put into operation by the end of 2014. Although experiencing the dual pressure of natural environment and social-economic development, the value of water resources in the water source area generally showed a trend of declining first and then rising with the emergence of importance of the Middle Route project to the allocation of national water resources.
4.1.3 Steady Rising Stage of Water Resources Value
The third stage is from 2014 to 2019, during which the value of water resources in the water source area was basically at V3 or V4 levels, and the value of water resources kept rising gently. To protect the water quality of the water source area, the State Council has successively approved a number of plans related to water pollution prevention, and soil and water conservation in Danjiangkou reservoir area, so as to ensure that the water environment of the core water source area can be at high level.
4.2 Analysis on Price Difference of Water Resources Ecological Compensation for SNWDP
The compensation prices in regions have produced obvious differences (Table 7). The average compensation prices of regions in the water source area could be obviously different due to the diversity of natural environment, social and economic development. Among regions with the average compensation prices less than 1 yuan/m3, we take Hanzhong as an example for analysis. Hanzhong is located in the basin with abundant rainfall. It is the water conservation area of the water diversion project and the birthplace of the Han River. Covering an area of 27,247 square kilometers, Hanzhong is the largest city in the water source area of the Middle Route project, with a permanent population of 3.437 million in 2019. Per capita water consumption in Hanzhong reaches 450 m3, ranking first among regions in the water source area. The industrial pillars of Hanzhong are equipment manufacturing, modern materials, and green food and medicine. Among the three regions in southern Shanxi, Hanzhong is least affected by the water transfer project. Therefore, the compensation price of Hanzhong is low. Among regions with average compensation prices between 1 and 2 yuan/m3, Shangluo is taken as an example for analysis. As a northern city in the water source area, Shangluo covers an area of 19,851 square kilometers and has a permanent population of 2.38 million in 2019. The annual water transfer of Shangluo accounts for more than 20% of the total planned water transfer of the SNWDP, slightly lower than that of Ankang. In recent years, the ecological environment quality has been improved significantly, and the registered urban unemployment rate of Shangluo has stabilized at around 3%. The relocation of migrants and re-employment problems has been properly dealt with as well. Owing to the abundant rainfall and the increase of total water resources in Shangluo, the value of water resources will not be very high in the next few years. Among regions with average compensation prices higher than 2 yuan/m3, we take Sanmenxia as an example for analysis. Sanmenxia belongs to the eastern extension of loess Plateau, and the problem of soil erosion is serious. With an area of 10,309 square kilometers, Sanmenxia is the smallest city in the water source area of the middle Line project, with a resident population of 2.28 million. The rainfall is at low level in the regions of the water source area, and the amount of water resources is less than other regions. The construction of water diversion project and water environment improvement have led to the closure of a large number of seriously polluting enterprises, increasing the poor population and the unemployment rate. The economic development is seriously affected by the water transfer project. Therefore, the compensation price is relatively high.
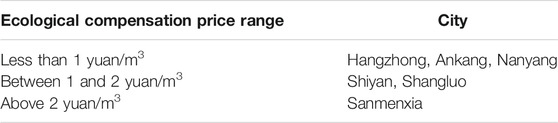
TABLE 7. Average ecological compensation price of core cities in water source area in 2020∼2022.
4.3 Measures to Improve the Accounting System of Ecological Compensation in Water Source Area
To establish a market ecological compensation accounting system in line with the water source area of the Middle Route, the following countermeasures and suggestions are put forward. First, establish and improve the legislation of ecological compensation in water source area, and define the subject and scope of accounting according to law. Ecological compensation in water source area is a long-term and arduous task. The object, scope, method, and standard of compensation should be established in legal form, which can lay a legal foundation for the appropriate and sustainable development and utilization of the water resources and environment. The second is to establish the ecological compensation distribution accounting system in water source area. On the basis of establishing the standard of water price and water resources fee which is in line with the common interests of water source area and water receiving area, the differences of natural environment, productivity level, technological level, capacity, and scale of ecological protection input should be comprehensively considered to determine the allocation amount of ecological compensation. Taking the problem of soil erosion in southern Shanxi as an example, the rate is 44.6% in Hanzhong, 53% in Ankang, and 66% in Shangluo. The control expense of soil erosion in Shangluo is obviously higher than that in the other two regions. If such factors are not fully considered in the allocation of compensation, the enthusiasm of ecological protection in Shangluo would be reduced and the effect of compensation incentive cannot be achieved. The third is to introduce market mechanism and fully consider the specific situation of resource taxes and fees in water source area when calculating the compensation amount. In 2016, Beijing, Tianjin, Henan, and other regions became the pilots of water resources tax reform in China, with the water resources tax rate ranging from 0.4 yuan/m3 to 1.8 yuan/m3. When forecasting the amount of ecological compensation, the water-receiving area should make market compensation for the water source area according to the water resources tax rate of the water source area as reference.
5 Conclusion
Based on the relevant data of regions in the core water source area of the Middle Route of SNWDP from 2000 to 2019, this paper uses value of water resources accounting as the entry point of compensation accounting to predict the ecological compensation amount of the Middle Route water source area from 2020 to 2022. The main conclusions are summarized as follows:
1) Based on entropy weight method and K-means clustering, the value of water resources assessment model is constructed to calculate the value of water resources from 2000 to 2019 in the water source area. The results reveal that the value of water resources of the six core regions in the water source area has an overall upward trend, and the value growth curve of regions is slightly different. 2) Based on the value of water resources and its dynamic changes, the ecological compensation payment standard is established, and the value of water resources in the water source area from 2020 to 2022 is predicted by using the LSTM neural network model. It is found that the value of water resources in the water source area will increase in the future, and the number of the high value regions will increase. 3) The ecological compensation amount from 2020 to 2022 in the water source area is predicted. For example, in 2020, among the six regions in the water source area, the highest and lowest ecological compensation amounts are expected to reach 3.651 billion yuan in Shangluo and 0.418 billion yuan in Nanyang. To maintain the sustainability of the water transfer project, it is necessary to establish the ecological compensation accounting system in line with water source area of the Middle Route.
Water source area is a concept of geographical region. This paper takes the main regions in the water source area as the research scope, including Ankang, Hanzhong, and Shangluo in Shanxi Province, Shiyan in Hubei Province, Nanyang and Sanmenxia in Henan Province. Some regions (e.g., Baoji) are not included in the analysis. After consulting information from various sources, it is found that there are differences between administrative region and geographical region. However, the statistical data adopted in this paper are mostly divided by administrative regions, and less by geographical regions. Therefore, it is impossible to accurately calculate the value of water resources and ecological compensation amount within geographical regions. The calculation of the relevant data within the geographical regions shall be analyzed after the water source area is divided into independent administrative units.
Data Availability Statement
Publicly available datasets were analyzed in this study. This data can be found here: http://www.stats.gov.cn/tjsj/ndsj/; http://slt.henan.gov.cn/bmzl/szygl/szygb/; http://slt.hubei.gov.cn/sjfb/; http://slt.shaanxi.gov.cn/site/sxsslt/search.html?keyWord=%E6%B0%B4%E8%B5%84%E6%BA%90%E5%85%AC%E6%8A%A5.
Author Contributions
JC: Conceptualization, Methodology, Formal analysis, Investigation, Validation, Writing-original draft, Writing-review and editing. QW: Conceptualization, Super-vision, Writing-original draft, Writing-review and editing. QL: Resources, Data curation, Software, Visualization.
Funding
This research was funded by the National Key R&D Program of China (Grant No. 2019YFC0409000), the National Natural Science Foundation of China (Grant Nos. 42071278, 42001250), the Fundamental Research Funds for the Central Universities (Grant No. B210207036).
Conflict of Interest
The authors declare that the research was conducted in the absence of any commercial or financial relationships that could be construed as a potential conflict of interest.
Publisher’s Note
All claims expressed in this article are solely those of the authors and do not necessarily represent those of their affiliated organizations, or those of the publisher, the editors, and the reviewers. Any product that may be evaluated in this article, or claim that may be made by its manufacturer, is not guaranteed or endorsed by the publisher.
References
Costanza, R. (2012). Ecosystem Health and Ecological Engineering. Ecol. Eng. 45 (8), 24–29. doi:10.1016/j.ecoleng.2012.03.023
Cui, H. Y., Pan, M. Q., and Zhang, C. (2020). An Analysis on the Development Environment of Science and Technology Innovation Talents in Shenzhen Based on Principal Component Analysis. Sci. Tech. Prog. Pol. 37 (7), 35–42. doi:10.6049/kjjbydc.2019080296
Du, R. F. (2015). Preliminary Discussion on Water Pricing Mechanism of Middle Route Project of South to North Water Diversion. Yangtze River 46 (6), 7–9. doi:10.16232/j.cnki.1001-4179.2015.06.003
Fu, Q. F. (2008). The Application of Fussy Comprehensive Evaluation to Water Resources Value. J. Northwest Univ. (Natural Sci. Edition) 38 (2), 187–191.
Gakidou, E., Afshin, A., Abajobir, A. A., Abate, K. H., Abbafati, C., Abbas, K. M., et al. (2017). Global, Regional, and National Comparative Risk Assessment of 84 Behavioural, Environmental and Occupational, and Metabolic Risks or Clusters of Risks, 1990-2016: A Systematic Analysis for the Global burden of Disease Study 2016. Lancet 390 (10100), 1345–1422. doi:10.1016/S0140-6736(17)32366-8
Gers, F. A., Schmidhuber, J., and Cummins, F. (2000). Learning to Forget: Continual Prediction with LSTM. Neural Comput. 12 (10), 2451–2471. doi:10.1162/089976600300015015
Gómez-Baggethun, E., De Groot, R., Lomas, P. L., and Montes, C. (2010). The History of Ecosystem Services in Economic Theory and Practice: From Early Notions to Markets and Payment Schemes. Ecol. Econ. 69 (6), 1209–1218. doi:10.1016/j.ecolecon.2009.11.007
Hajkowicz, S., and Higgins, A. (2008). A Comparison of Multiple Criteria Analysis Techniques for Water Resource Management. Eur. J. Oper. Res. 184 (1), 255–265. doi:10.1016/j.ecolecon.2009.11.00710.1016/j.ejor.2006.10.045
Hou, Y., Ding, Z., and He, P. L. (2005). Self-organizing Isometric Embedding. J. Comp. Res. Dev. 42 (2), 188–195. doi:10.1360/crad20050202
Hu, Q. (2015). Ecological Compensation Mechanism of Agricultural Water Resources: An Empirical Study in Zhejiang, China. Ajfst 8 (7), 525–530. doi:10.19026/ajfst.8.1559
Hu, Y. Y. (2016). Eco-compensation Model, Accounting, Standard and Allocation Pattern: A Case Study of Hanjiang Watershed. Beijing: People's Publishing House, 234–282.
Jia, Y. Z., Shen, J. Q., Wang, H., Jia, Y. B., and Sun, F. H. (2018). Research on Fuzzy Evaluation of Water Resources Value in Lanzhou City. Yellow River 40 (9), 68–73.
Li, H. E., Pang, M., Xiao, Y., and Shi, S. J. (2010). A Study on Ecological Compensation Quantity Based of Water Resource Value in Shaanxi Water Source Area. J. Northwest Univ. (Natural Sci. Edition) 40 (1), 149–154. doi:10.16152/j.cnki.xdxbzr.2010.01.030
Li, P. A., Jiang, Y. T., Qi, P. C., and Wang, L. M. (2021). Research on the Time-Spatial Evolution Characteristics of Vegetation in the Water Source Area of the Middle Route Project of S-N Water Diversion. Journal of Yangtze River Scientific Research Institute.
Liu, C., Nagler, O., Tremmel, F., Unterreitmeier, M., Frick, J. J., Patil, R. P., et al. (2022). Cluster-based Acoustic Emission Signal Processing and Loading Rate Effects Study of Nanoindentation on Thin Film Stack Structures. Mech. Syst. Signal PROCESSING 165, 108301. doi:10.1016/j.ymssp.2021.108301
Lyman, R. A. (1992). Peak and Off-Peak Residential Water Demand. Water Resour. Res. 28 (9), 2159–2167. doi:10.1029/92wr01082
Ma, S. J., and Wang, R. S. (1984). The Social-Economic-Natural Complex Ecosystem. Acta Ecologica Sinica 4 (1), 1–9.
Ma, Y. (2014). Analysis on Current Situation and Existing Problems of Sewage Treatment Market in Water Source Area of Middle Route of South-To-north Water Transfer in Shaanxi Province. Water Conservancy Sci. Tech. Economy 20 (9), 108–112.
Martínez-Paz, J. M., Perni, A., and Martínez-Carrasco, F. (2013). Assessment of the Programme of Measures for Coastal Lagoon Environmental Restoration Using Cost-Benefit Analysis. Eur. Plann. Stud. 21 (2), 131–148. doi:10.1080/09654313.2012.722923
Omlin, C. W., and Giles, C. L. (1996). Rule Revision with Recurrent Neural Networks. IEEE Trans. Knowl. Data Eng. 8 (1), 183–188. doi:10.1109/69.485647
Ouyang, Z. Y., Zhu, C. Q., Yang, G. B., Xu, W. H., Zheng, H., Zhang, Y., et al. (2013). Gross Ecosystem Product : concept, Accounting Framework and Case Study. Acta Eco Sin 33 (21), 6747–6761. doi:10.5846/stxb201310092428
Ouyang, Z. Y., and Wang, R. S. (2000a). Ecosystem Services and Their Economic Valuation. World Sci-tech R. D 22 (5), 45–50.
Ouyang, Z. Y., Wang, X. K., and Miao, H. (2000b). China's Eco-Environmental Sensitivity and its Spatial Heterogeneity. Acta Ecologica Sinica 20 (1), 9–12.
Pimentel, D., Harvey, C., Resosudarmo, P., Sinclair, K., Kurz, D., McNair, M., et al. (1995). Environmental and Economic Costs of Soil Erosion and Conservation Benefits. Science 267 (5201), 1117–1123. doi:10.1126/science.267.5201.1117
Piper, S. (2003). Impact of Water Quality on Municipal Water price and Residential Water Demand and Implications for Water Supply Benefits. Water Resour. Res. 39 (5), 135–155. doi:10.1029/2002WR001592
Qiu, L., and Zhai, H. J. (2014). An Ecological Compensation Mechanism of Chishui River Water Resources protection and Research. Amm 685, 463–467. doi:10.4028/www.scientific.net/AMM.685.463
Rawlins, J. M., De Lange, W. J., and Fraser, G. C. G. (2018). An Ecosystem Service Value Chain Analysis Framework: A Conceptual Paper. Ecol. Econ. 147, 84–95. doi:10.1016/j.ecolecon.2017.12.023
Shen, D. J. (2006). Theory, Method and Practice of Water price Formulation. Beijing: Water Resources and Hydropower Press.
Shen, D. J., Liang, R. J., Wang, H., and Jiang, Y. Z. (1998). The Water Resources Value. J. Hydraulic Eng. 5, 54–59.
Tan, C. L., and Zhu, Q. (1998). Analysis of Water Supply Cost and Water price in the Middle Route of South-To-North Water Transfer Project. Ewrhi 19 (9), 19–22.
Wang, H., Luan, B. Q., and Shen, D. J. (2003). Theory and Practice of Water price for Sustainable Development. Beijing: Science Press.
Wang, J. F., and Hou, C. B. (2013). Study on Implementation Framework and Compensation Pattern of basin Ecological Compensation Mechanism in china: From the Perspective of Compensation Funds Source. China Popul. Resour. Environ. 23 (2), 23–29.
Wang, S. M., and Qu, F. T. (2001). Water Resource Accounting and Adjustment of GDP: A Case Study of the Developed Areas in the Eastern Part of China. J. Nanjing Agric. Univ. 24 (2), 115–118.
Wang, X., Wu, J., Liu, C., Yang, H. Y., Du, Y. L., and Niu, W. S. (2018). Exploring LSTM Based Recurrent Neural Network for Failure Time Series Prediction. J. Beijing Univ. Aeronautics Astronautics 44 (4), 772–784. doi:10.13700/j.bh.1001-5965.2017.0285
Wei, L. L., Fu, Q., and Chen, L. Y. (2008). Elastic Analysis on the Water Demand of Urban Residential of Harbin. J. Northeast Agric. Univ. 39 (7), 34–37.
Wu, H. F. (2009). Construction of Ecological Megalopolis and Coordinated Development of Regions. Beijing: Social Science Academic Press.
Xepapadeas, A. (2011). The Economics of Ecosystems and Biodiversity: Ecological and Economic Foundations, Edited by Pushpam Kumar, 2010, London and Washington: Earthscan, ISBN 978-1-84971-212-5 (HB) Price £49.99 [Earthscan Have Offered a 20% Discount off the Book for EDE Readers. To Receive the Discount Enter 'EDETEEB' into the Voucher Code Box at the Checkout on the Earthscan Website at http://www.earthscan.co.uk/?tabid=102480]. Envir. Dev. Econ. 16, 239–242. doi:10.1017/S1355770X11000088
Xie, G. D. (2012). Realization Mechanism of Ecosystem Service Value. Environ. Prot. 17, 16–18. doi:10.14026/j.cnki.0253-9705.2012.17.010
Xu, D. W., Zheng, H. X., and Liu, M. Q. (2008). Measuring Method of River basin Ecological Compensation Based on River Water Quality and its Water Quantity about across Administration Area. China Popul. Resour. Environ. 18 (4), 189–194.
Xu, J., Xiao, Y., Xie, G., and Jiang, Y. (2019). Ecosystem Service Flow Insights into Horizontal Ecological Compensation Standards for Water Resource: A Case Study in Dongjiang Lake Basin, China. Chin. Geogr. Sci. 29 (2), 214–230. doi:10.1007/s11769-019-1025-3
Xu, J., Xiao, Y., Xie, G., Liu, J., Qin, K., Wang, Y., et al. (2021). How to Coordinate Cross-Regional Water Resource Relationship by Integrating Water Supply Services Flow and Interregional Ecological Compensation. Ecol. Indicators 126, 107595. doi:10.1016/j.ecolind.2021.107595
Yang, M.-j., Yang, K., Li, G., and Niu, X.-d. (2019). The Cooperation Mechanism of Water Resources protection in Trans-boundary River Based on Game Theory: A Case Study of the Taipu River in the Taihu Lake Basin. J. Nat. Resour. 34 (6), 1232–1244. doi:10.31497/zrzyxb.20190609
Yang, X., Zhang, H., Yang, J., Li, H., and Zhu, X. (2020). Research on Ecological Compensation of Water Resources in the Yellow River basin. Fresenius Environ. Bull. 29 (6), 4426–4429.
Yu, T. S., Zheng, S. N., Zhu, J. Y., Tang, M. F., Dong, R. C., and Wang, Y. (2021). Evaluation on the Ecological Security Status in Nanyang City, the Water Source Region of the Middle Route of South-To-North Water Diversion Project in China. Acta Ecoligica Sinica 41 (18), 7292–7300. doi:10.5846/stxb202003260701
Yu, X., and Li, M. Q. (2009). Collaborative Filtering Recommendation Model Based on Effective Dimension Reduction and K-Means Clustering. Appl. Res. Comput. 26 (10), 3718–3720.
Zhang, Y. M., Xiong, Y. Q., and Zhang, N. (2006). Analysis of Water Resource Fee Collection in the Middle Route of South-To-North Water Transfer Project. Water Resour. Dev. Res. (6), 30–32. doi:10.13928/j.cnki.wrdr.2006.06.008
Zhang, Z. Q., Xu, Z. M., Cheng, G. D., and Su, Z. Y. (2002). Contingent Valuation of the Economic Benefits of Restoring Ecosystem Services of Zhangye Prefecture of Heihe River basin. Acta Ecologica Sinica 22 (6), 885–893.
Zhang, Z. Q., Xu, Z. M., and Cheng, G. D. (2001). Valuation of Ecosystem Services and Natural Capital. Acta Ecologica Sinica 21 (11), 1918–1926.
Zhao, W. H., Gao, Y., and Dai, T. S. (2007). An Optimization Model of Initial Emission Permits Distribution. Syst. Eng. 25 (6), 57–61.
Zhao, Z., Huang, Q. Q., and Tong, N. N. (2021). Evaluating SMEssupporting Policies during COVID-19 Pandemic with K-Means Clustering. Data Anal. Knowledge Discov. 5 (12), 148–157. doi:10.11925/infotech.2096-3467.2020.0320
Zhu, J. L., Wang, J., Tao, X. Y., and Wang, S. J. (2017). The Allocation of Ecological Compensation Funds in the Water Source Area of the Middle Route Scheme of South-north Water Diversion Project Based on Ecosystem Services Value. Ecol. Economy 33 (6), 127–132, 139.
Zi, T. (2010). Assessment on Ecosystem Service Value of the Water Tourism Resources in Heilongjiang Province, Northeast China. Adv. Mater. Res. 113-116, 132–136. doi:10.4028/www.scientific.net/AMR.113-116.132
Keywords: water resources value, ecological compensation accounting, the middle route of water transfer, machine learning, China
Citation: Chen J, Wang Q and Li Q (2022) A Quantitative Assessment on Ecological Compensation Based on Water Resources Value Accounting: A Case Study of Water Source Area of the Middle Route of South-To-North Water Transfer Project in China. Front. Environ. Sci. 10:854150. doi: 10.3389/fenvs.2022.854150
Received: 13 January 2022; Accepted: 21 February 2022;
Published: 15 March 2022.
Edited by:
Yiliao Song, University of Technology Sydney, AustraliaReviewed by:
Grigorios L. Kyriakopoulos, National Technical University of Athens, GreeceHaseeb Hassan, Shenzhen University, China
Copyright © 2022 Chen, Wang and Li. This is an open-access article distributed under the terms of the Creative Commons Attribution License (CC BY). The use, distribution or reproduction in other forums is permitted, provided the original author(s) and the copyright owner(s) are credited and that the original publication in this journal is cited, in accordance with accepted academic practice. No use, distribution or reproduction is permitted which does not comply with these terms.
*Correspondence: Junfei Chen, chenjunfei@hhu.edu.cn