Identification of Seasonal and Annual Groundwater Level Trends in Temperate Climatic Conditions
 Ionuț Minea
 Daniel Boicu
 Vlad Amihăiesei
 Marina Iosub
- 1Department of Geography, Faculty of Geography and Geology, “Alexandru Ioan Cuza” University of Iași, Iași, Romania
- 2Meteo Romania, National Meteorological Administration, Bucharest, Romania
- 3Institute of Interdisciplinary Research–ICI-UAIC, Integrated Center of Environmental Science Studies, North Eastern Region–CERNESIM, Iaşi, Romania
The management of groundwater resources must take into account their variation trends. In this sense, 3 statistical methods were used to identify seasonal and annual groundwater level trends: Mann-Kendall test (MK), Innovative Analysis Method (ITA) and Spearman’s Rho test (SR). Each method was applied for 5 time series (one annual and four seasonal) from 148 hydrological wells from Eastern Romania. The wells were classified in 8 cluster groups based on water depth, using the cluster analysis, covering the full range of depths from under 1.4 to over 15.5 m. Coupling statistical methods (MK and SR test) with one based on graphical analysis (ITA method) offers the possibility of obtaining statistically significant results (between 53% and 69% for spring season, 68% and 96% for autumn season and 68% and 81% from annual values). The decreasing trend of water depth is more obvious for summer and autumn season, for 72%–74% from analyzed wells (based on SR and ITA method) and 68% for annual series (based on MK test). The spatial distribution of seasonal and annual trends highlights that in the northern and central parts of the region, the groundwater depth suffers depletion induced by the effects of prolonged meteorological and hydrological drought manifested in this area in the last decades.
Introduction
Estimating trends for hydroclimatic parameters is an important step in the evaluation of the behavior of these parameters in different scenarios of climate evolution. Regional and global-scale effects of climate change on temperature and precipitation can trigger significant changes in river runoff and groundwater level, which are later reflected in the evolution of water resources and social development at a regional level (de Moura et al., 2020; Xiao et al., 2021). In such circumstances, it is important to identify methods for analyzing the trends of the hydro-climatic and hydrogeological parameters that are relevant for medium and long term, due to the lack of adequate monitoring in some parts of the world (Koster et al., 2017). In the last decades, the scientific research on the impact of climate change on the various hydro-climatic parameters has been multiplied, most of the analysis focusing on the identification of trends in the extreme seasonal and annual values of precipitation, temperature, or rivers’ flow (Taye et al., 2015; Croitoru et al., 2018). Two main directions were differentiated in the analysis of trends. The first is based on the Mann-Kendall test (MK) and estimating trends by the Sen method (Bürger, 2017). The results obtained by applying it to different climatic or hydrological parameters, highlighted statistically significant trends of increasing average or maximum annual temperatures (Shrestha et al., 2017; Khan et al., 2019), precipitation (Djebou and Singh, 2016; Zelenekova et al., 2017) or river runoff (Yang et al., 2017; Asraf et al., 2020). To verify the obtained results, the method was compared with Spearman’s RHO trend statistic test (Hamed, 2016) and the Monte Carlo simulations method (Wang et al., 2020). The conclusions of this comparation, indicate that in addition to the significance level and the data series length, the MK test’s power, has a close relationship with the sample variance and the magnitude of the trend. The second direction proposed to highlight trends through graphical methods using the Innovative Analysis Method (ITA) (Șen, 2012). This method has also been widely used for hydro-climatic (maximum river runoff, maximum temperatures or maximum precipitation) (Tabari et al., 2017; Caloiero et al., 2018) and even for hydrogeological parameters (monthly and annual groundwater level) (Minea et al., 2020a). The application of this method is relieved by the fact that the comparative analysis of data series can be done without statistical assumptions (Sonali and Nagesh Kumar, 2013; Kisi and Ay, 2017). For the eastern part of Romania, previous research based on MK and ITA have estimated significant changes in climatic (Croitoru et al., 2016), hydrological (Croitoru and Minea, 2015; Dumitriu, 2020) and hydrogeological parameters (Minea and Croitoru, 2017) as a result of regional climate changes. Due to a background of more and more accentuated climate change, with evolution scenarios adapted on short, medium and long term, the trend evaluation of the groundwater level becomes obligatory in the water resources management projects. The main objective of our research is to analyze seasonal and annual groundwater level trends based on a correlative approach of the three methods. This objective is important in the context of the constant pressure of the increasing impact of climate change and population in a region with high dependency on groundwater resources availability (Minea, 2020). Studies applying groundwater resources trends analysis, using cluster method classification on these three statistical methods (MK test, SR test, and ITA method) were implemented on groundwater level trends for hydrogeological wells. This approach is new in this particular area of expertise, especially for Europe (including eastern part of Roamnia, an area very little analyzed from this point of view and with special socio-economic problems taking into account the fact that over 50% of the population is directly dependent on resources of groundwater).
Study Area and Data Base
The analyzed region overlaps the eastern part of Romania, with altitudes ranging between 15 and 500 m. From a geological point of view, Quaternary deposits with a thickness of 12–25 m overlap Sarmatian-Pontian deposits (with a mixture of clay, marl and sand), and this is where water is retained in groundwater bodies at the depth between 2 and 15 m (Boicu et al., 2019). All groundwater bodies belong to the porous type and have a free groundwater level. Largely exposed to eastern continental dry air masses, the region is one of the driest in the country, with annual precipitation between 450 mm in the south and 650 mm in the north (Sandu et al., 2008), and is frequently affected by periods of drought (Minea et al., 2020b). To identify changes in groundwater level, this paper uses seasonal and annual values from 148 hydrogeological wells from eastern Romania (Figure 1). The analysis was performed based on four seasonal and one annual data set for groundwater level (with no gaps in the data series) over a timeframe between 1983 and 2020. All the hydrogeological data sets were derived from monthly values. The data were provided by the Prut-Barlad Basins Branch of the Romanian Waters Administration. The temporal scale of data availability is between 1983 (when the national system of the monitoring groundwater resources were completed by establishing hydrogeological observation points) and 2020. This period was chosen for the data series to be long enough for the results to have statistical significance.
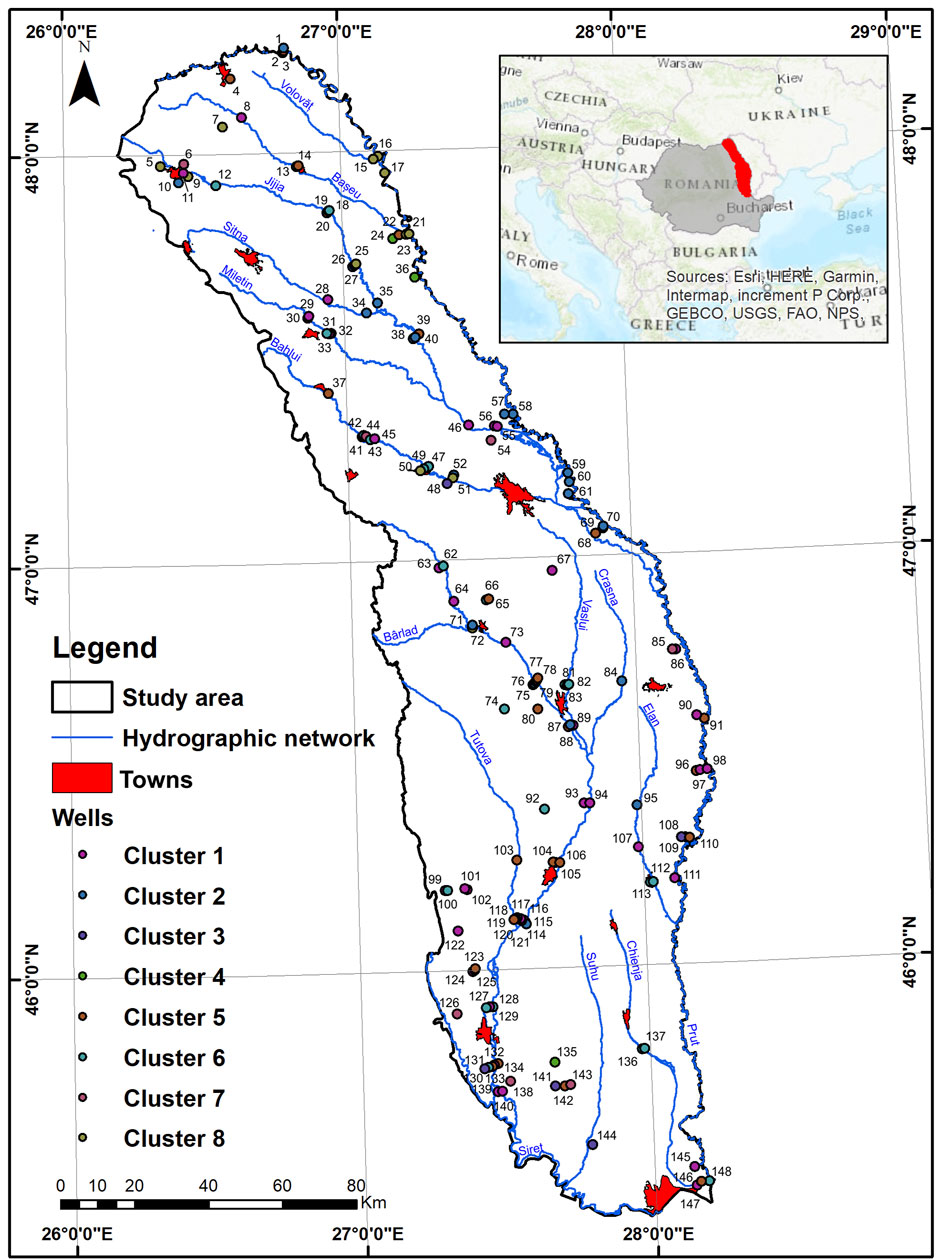
FIGURE 1. The geographical position of hydrogeological wells analyzed from Eastern Romania.
Methodology
Three statistical methods were used to identify trends in the piezometric level in Eastern Romania: Non-parametric Mann-Kendall test (MK), Innovative Trend Analysis Method (ITA), Spearman’s Rho Test (SR). MK test and Spearman’s Rho Test (SR) was chosen due to the fact that it is widely used to identify trends in hydro-meteorological parameters in different climatic conditions even if the data does not conform to a normal distribution (Meals et al., 2011) and and are less sensitive to outliers (Hamed, 2007). ITA method was used was used to see the correlation between classical and innovative statistical methods that are not affected by sample size, serial correlation and type of distribution (Șen, 2014). The steps of organizing the performed statistical analysis is represented in Figure 2.
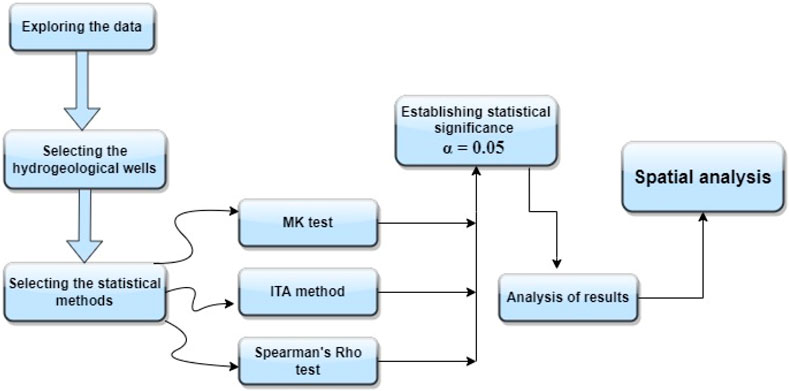
FIGURE 2. Flow chart of statistical analysis performed.
Non-Parametric Mann-Kendall Test
This method has the advantage of being insensitive to outliers that can bring some deviation in statistical analysis and also of being suitable for application to data sets that do not fit into a statistical distribution (Moberg et al., 2006; Tabari et al., 2011). Accordingly, this method was largely used to detect trends in climate and hydrological data series, such as temperature, precipitation, snow cover, fog, rivers’ discharge etc. (El Kenawy et al., 2011; Birsan et al., 2014; Asfaw et al., 2018).
The MK method can be applied in the scenarios where the values of the xi temporal data series can be assumed with following model (Salmi et al., 2002):
where: f(t) is a continuous monotonic increasing or decreasing function of time and εi is residuals which are assumed to be from the same distribution with a zero mean. Therefore, it is expected that the distribution’s variance should be constant in time. The aim of the MK method is to test the null hypothesis (H0) of no trend, i.e., the data xi is randomly ordered in time, versus the alternative hypothesis (H1) where an upward or downward monotonic trend exists (Sen, 1968). Depending on the length of the data series, two statistic might be computed, S for data series with less than 10 values, and Z statistics for the time series having 10 or more data points (n) (Kiși et al., 2018). The Mann-Kendall test statistic S can be calculated using the equation:
where: xj and xk are the consecutive data values of time series over time k and j, j > k, respectively, n represent the number of data points and sgn (xj-xk) symbolizes the function that takes the values of 1, 0 and -1 and can be estimated as follows:
If S has positive values, this designates an increasing trend and if S has negative values, this indicates a decreasing trend in the time series. For time series with n > 10, the test is followed by a normal statistic distribution (σ2 = 1) and mean (μ = 0) with an estimated probability of E (Hamed, 2009):
and variance (Var) as shown
where: q is the number of tied groups; tp is the number of data values in the pth group and the symbol (Σ) characterizes the summation of all the tied groups. If there are no tied groups in the data series, this summary sequence can be ignored.
Because the number of values in the groundwater level data series is greater than 10, the values of S and VAR(S) are used to compute the test statistic Z as it follows:
The ZMK values will follow a normal distribution with variance “1” and mean “0” and it can be used to compute the magnitude of variation. If ZMK is larger than Zα/2 then the data series exhibits significant trends. Testing the trends is performed at the specific α significance level. To avoid the auto-correlation between data series of groundwater level, the trends test used α = 0.05 (Wang et al., 2020). At the 5% significance level, the null hypothesis of no trend is rejected if ZMK >1.96.
Innovative Trend Analysis Method
This method, developed by Șen (2012), was applied to different hydro-climatic parameters because is facilitated by the fact that the comparative analysis of data series can be made without statistical assumptions (Dabanli et al., 2016). The method involves the separation of the data set into two equal subseries, in ascending order. The series are plotted into a two-dimensional Cartesian coordinate system and compared against the median line (1:1). The points that are located above the median line represent an increasing trend, while those located below represent decreasing trends. If the points are concentrated along the median line, they do not indicate any trend. To estimate the trend, the following equating can be used (Șen, 2017):
where: SITA is the slope of the trend based on ITA,
The null hypothesis (H0) of no significant trend cannot be rejected if the calculated slope value, s, is below a critical value, scrit. At the same time, the alternative hypothesis (Ha) of the presence of a significant trend in time series is applicable if s is over a critical value (Malik et al., 2019). To apply this method, the confidence limit (CL) of the trend slope at α level of significance must be followed, using the equation:
where: CL are the upper and lower confidence limits at α level of significance, scrit are the standard deviation values and σs is the standard deviation of the sampling slope. The significance level for α was selected to 0.05. Thus, in a two-sided condition, the H0 and H1 are tested at α = 0.05 with Z = ±1.96. If ± s>±CL1 − α, then H0 is rejected and H1 accepted. The magnitude of the data series trend using ITA method can be calculated with the equation (Wu and Qian, 2017):
where: D refers to trend intensity,
Spearman’s Rho Test
The SR test is another non-parametric rank-based method used to analyze the variations of hydroclimatic parameters in order to compare the results with other statistical methods (like MK or ITA). This test assumes that the data series are independent, and the null hypothesis (Ho) indicates a no-trend and the alternative hypothesis (H1) shows that the data series have increasing or decreasing trends (Onyutha, 2020). To test the significance of trends by comparing the ranks of the values of series X with their time order SR, the statistics ρSR is calculated (Hamed, 2016):
where: Di is the rank difference of ith data series value, n is the total data values in the time series, i is the chronological order number and ρSR is the student’s t distribution with (n–2) degree of freedom.
In the case of the independent data and when no trend exists in the data series, ρSR is symmetrical around zero, with a variance equal to 1/(n—1) (Kendall and Gibbons, 1990). If ρSR has positive values, this indicate an increasing trend in the time series and if ρSR has negative values, thisshows a decreasing trend. To estimate the statistical consistence, the ZSR of the trends is estimated:
If ZSR > t (n-2, 1-α/2), the null hypothesis (H0) is excluded and the time series show a significant trend (positive or negative).
Measurements on the groundwater level are related to the land surface. In this case, the interpretation of the results regarding the values of trends obtained by different statistical methods must take into account this reporting system which will be inversely interpreted compared to the analysis system for climatic and hydrological parameters at the land surface (Figure 3).
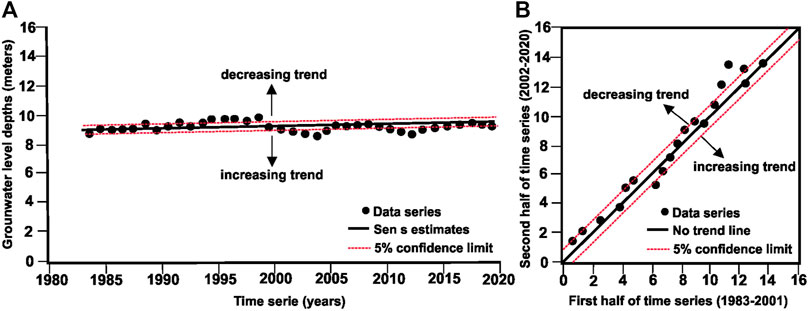
FIGURE 3. Graphical interpretation for groundwater level trends using MK test (A) and ITA method (B).
Cluster Analysis
In order to identify the best classification of the hydrogeological wellfor this region, according to the water depth, the cluster analysis was used. In Figure 4 depicts the configuration of the clusters for all the hydrogeological wells, analyzed according to the water depth and the optimal number of clusters obtained by the Silhoutte method (Goyal and Gupta, 2014). This method shows how close or how far each point in a cluster is from points in neighboring clusters. The scale of proximity/distance of the analyzed points has a range between −1 and 1. Values of the Silhoutte coefficient near +1 indicate that the sample points are not in the proximity of the neighboring cluster, and a Silhoutte coefficient near −1 indicates that the sample points have been assigned to the different cluster. Values around 0 of the Silhoutte coefficient show that the sample points are very close to the boundary limit between two neighboring clusters. The optimal value of the number of clusters for entire data base of hydrogeological wells from Eastern Romania is 8. The minimum water depth values for the 8 cluster groups are under 1.4 m and the maximum are over 15.5 m, covering the full range of depths.
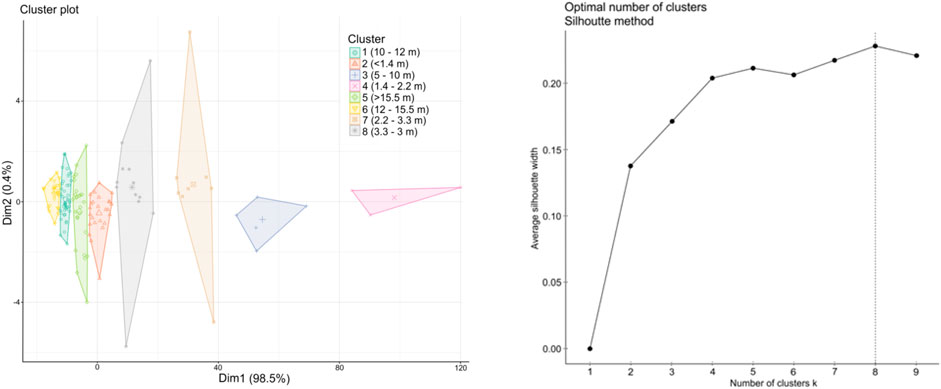
FIGURE 4. Cluster plot and optimal number of clusters identified for hydrogeological wells in Eastern Romania.
Results
Seasonal Trends of Groundwater Level
The hydrogeological regime of the groundwater level in Eastern Romania has maximum values in October and November, and minimum values in March and April. This regime is connected to the variations in rainfall and water intake from the river system, and has a delay depending on the local geological conditions and the groundwater level depth. Seasonal trends of the groundwater level from Eastern Romania were investigated using three trend detection methods, i.e., MK, SR and ITA. The results are presented in Supplementary Table S1 and Figure 5. The statistical results obtained show that for the MK test, between 53% (for the spring season) and 68% (for the autumn season) of the values of the obtained trends are statistically significant. For the SR and the ITA methods, the statistical significance of the values of trends varies between 65% and 69% (for the spring season) and 94% and 96% (for the autumn season), respectively. For the entire database, between 61% (for the ITA method) and 65% (for the MK test) exhibit a decreasing trend of the groundwater level from hydrogeological wells. The decreasing trend of the water depth is more obvious for the summer and autumn seasons, for 72%–74% of the analyzed wells (based on the SR and the ITA methods). This decresing trends can be correlated with the decreasing trends observed for the entire region for the precipitation (Dumitrescu et al., 2015), river flow (Minea et al., 2020c) and for the last decades to the increasing periods of meteorological and hydrological droughts (Ioniță et al., 2016). The important decreasing trends were observed for the hydrogeological wells included in Clusters 1, 2, and 6 (for all seasons, from the northern part of the region) and Cluster 5 (for all seasons, in southern part of the region). The tendency of a decreasing water depth and can be associated with the influence of the climate conditions across the entire region. In the last 2 decades, Eastern Romania has experienced frequent periods of meteorological and hydrological droughts, which determined the appearance of an accentuated hydrogeological drought, especially in the northern and central parts of the region (Minea et al., 2021). The effects of this prolonged period of drought are felt immediately in the case of the hydrogeological wells with water levels close to the land surface (Cluster 1) and in extended time in the hydrogeological wells with water levels located at great depths (Cluster 5, 6, 7, and 8). The maximum values for the decreasing trends (based on the MK and the SR methods) were observed for Nicoresti F1 (from Cluster 7) and Podu Iloaiei F5 (based on the ITA method, from Cluster 8). The local geological conditions generated by the presence of sandy deposit determine accentuated dynamics for the groundwater (Iversen et al., 2008), highlighting even more the effects of the prolonged hydrogeological drought that is manifested in this area. Only for 5 hydrogeological wells (1 for the spring season, 1 for the autumn season and 3 for the winter season) no trends were identified using the MK method.
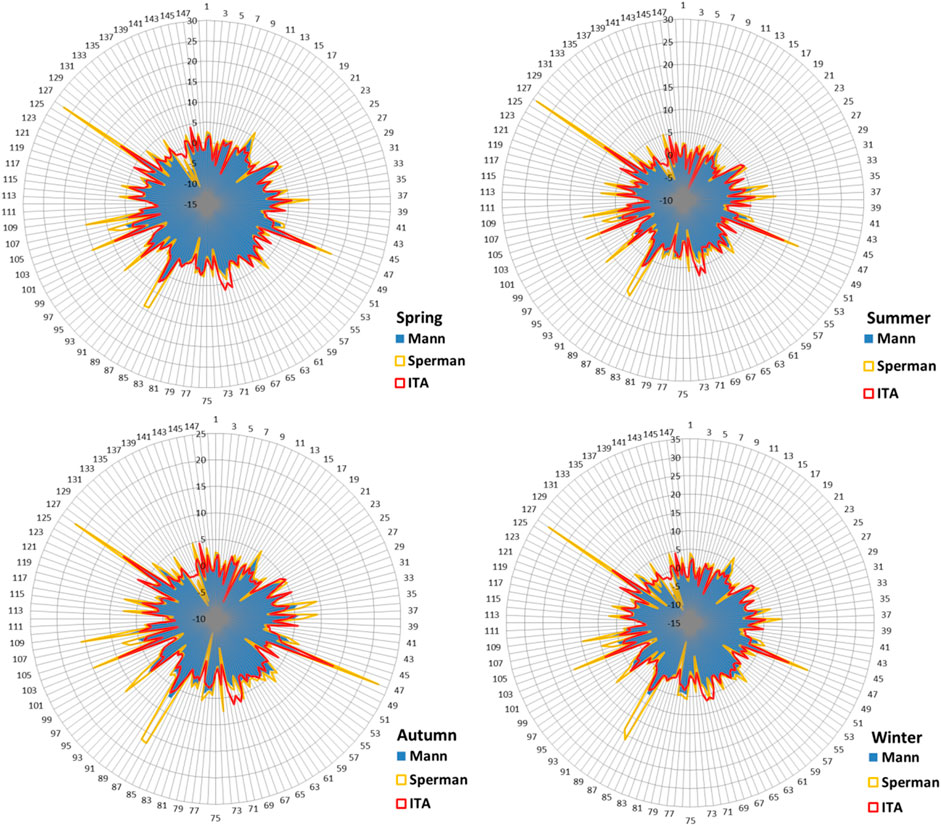
FIGURE 5. Comparison between seasonal trends values obtained by MK, SR and ITA method.
Annual Trends of Groundwater Level
As is the case with the seasonal time series, the variation of the hydrostatic level was examined using the same three statistical methods. The results are presented in Figures 6–8. In general, the same tendencies of decreasing or increasing groundwater levels were observed, for all wells as analyzed in the different seasons. The statistical results obtained show that for the MK test, 68% of the annual values of trends are statistically significant. For the SR and the ITA methods, the statistical significance of the values of trends varies between 73% and 81%, respectively. At cluster level, 67% of the trends calculated for wells included in Cluster 1 are statistically significant, based on the MK test. Statistical significance increases in the case of the SR and ITA methods, for this very cluster, to 70% and 75%, respectively. For wells included in Cluster 2, the statistical significance of annual trends based on the MK test, is over 84%, growing up to 92% for the SR test and 96% for the ITA method. Close values for statistical significance are calculated for wells included in Cluster 3 (80% for the MK test, 90% for the SR test and 94% for the ITA method). The lowest values of statistical significance were calculated for wells included in Cluster 4, which was just one of the three analyzed wells having a statistically accepted trend. For Cluster 5, 73% of the annul trends obtained, are statistically significant based on the MK test. 50% of the annual trends based on the MK test are statistically significant, for Clusters 6 and 7 and just 75% for Cluster 8. Compared to the seasonal trends, the annual ones do not undergo significant changes. At 7% of the analyzed wells included in Cluster 6 and 5% from Cluster 1, there are changes in the annual trends reported in the spring season, based on the MK test. The comparison matrix for the annual and seasonal trends, for different clusters, highlights much larger differences in the case of the ITA method (between 33% for Cluster 1 and 15% for Cluster 5). For the SR test, the differences between annual and seasonal trends are minimal (2 cases for Cluster 1, 5, and 6). The maximum annual values of trends were observed for Nicoresti F1 (from Cluster 7) and Podu Iloaiei F5 (from Cluster 8), based on the SR test as observed in the case of seasonal trends (Figure 9). For 5 wells, no trends were identified when using the ITA method. The spatial distribution trends have the same pattern like the spatial distribution trends for seasons, with small differences depending on the local hydrogeological conditions. For wells included in Clusters 1 to 4 and in Cluster 6, and some from Cluster 5 and 8, located in the northern part of the region, the annual trends highlighted by all 3 methods are of a decreasing hydrogeological level. For wells from the southern part of the region, included in Cluster 1, 6, and 7 (and some from Cluster 5 and 7 from the northern part of the region), annual trends are growing in relation with some positive trends in precipitation and river flows identified in the region (Croitoru and Minea, 2015; Minea and Chelariu, 2021).
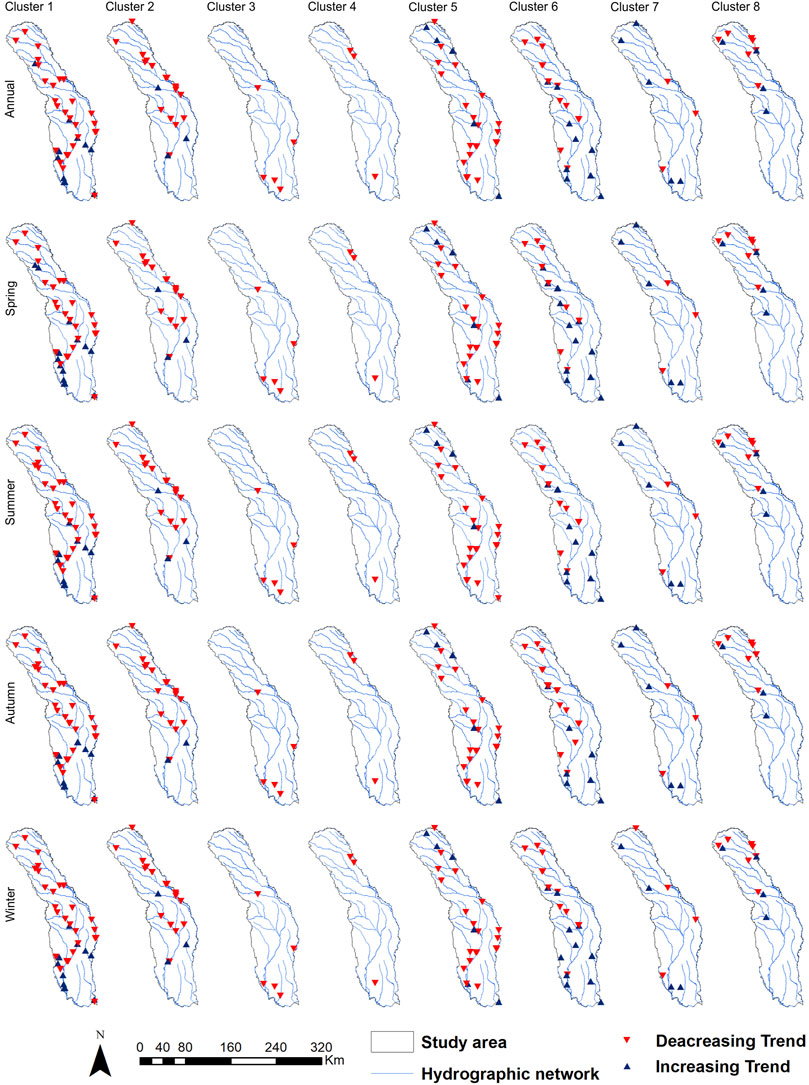
FIGURE 6. Spatial distributions of the seasonal and annual trends at the cluster level using MK test.
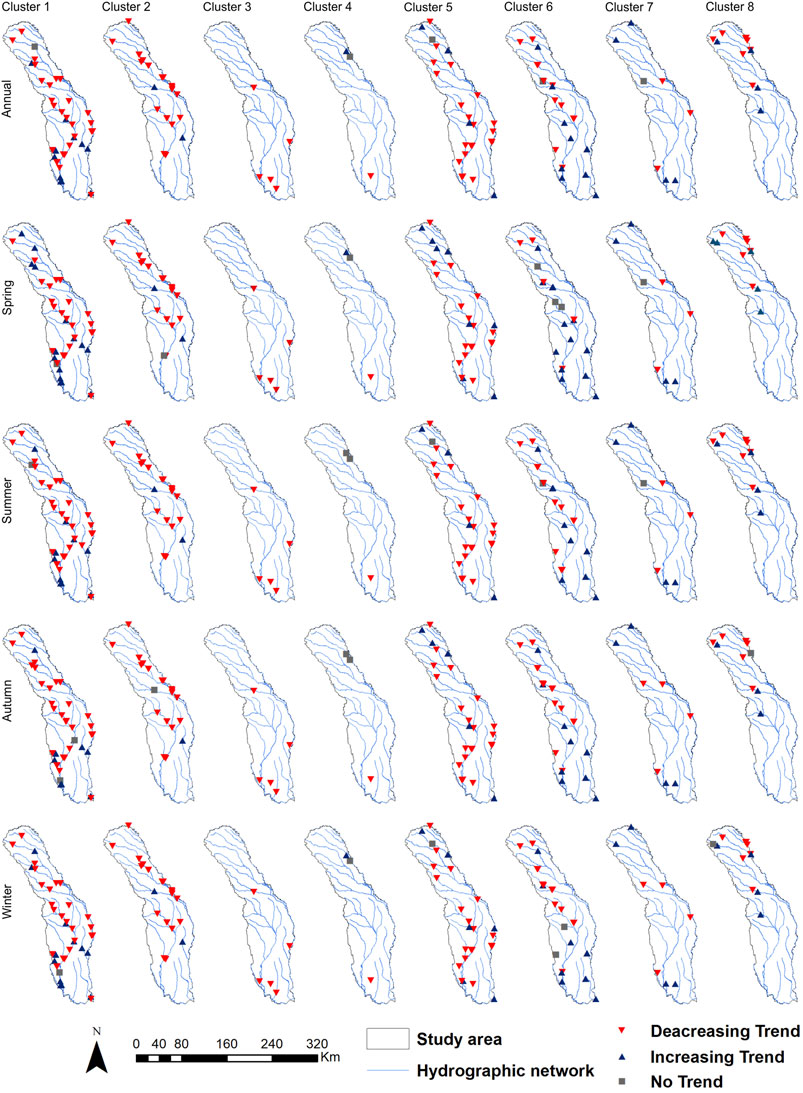
FIGURE 7. Spatial distributions of the seasonal and annual trends at the cluster level using ITA method.
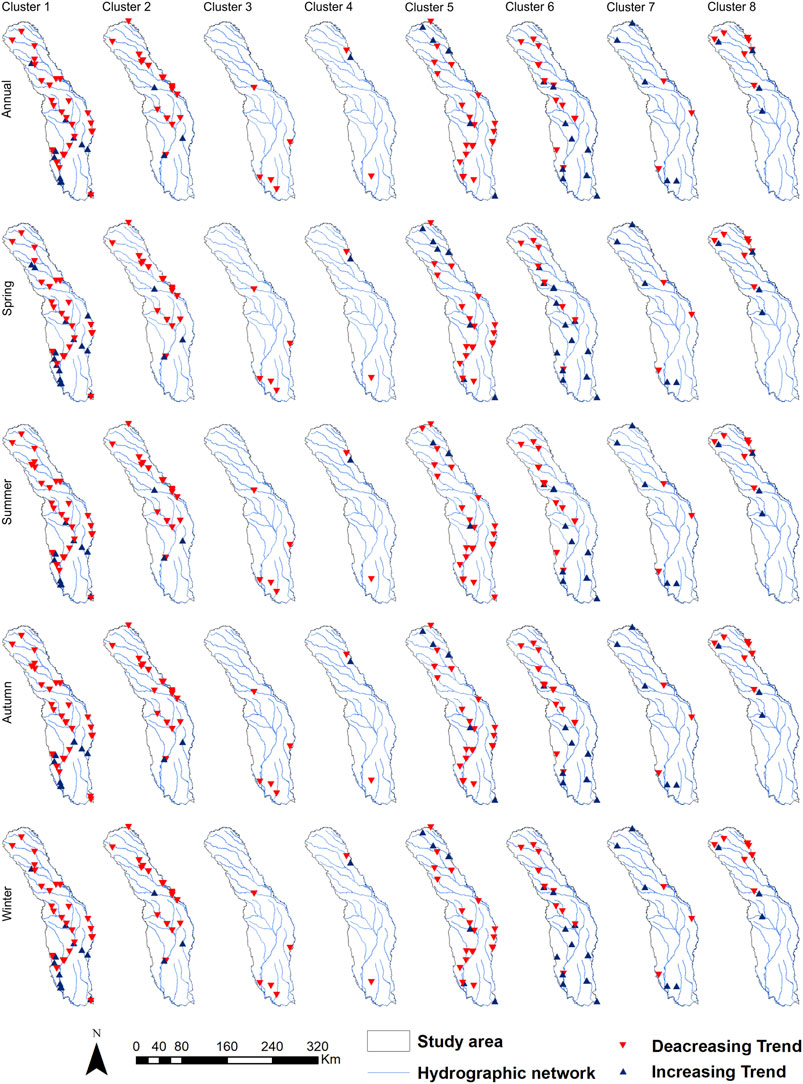
FIGURE 8. Spatial distributions of the seasonal and annual trends at the cluster level using SR test.
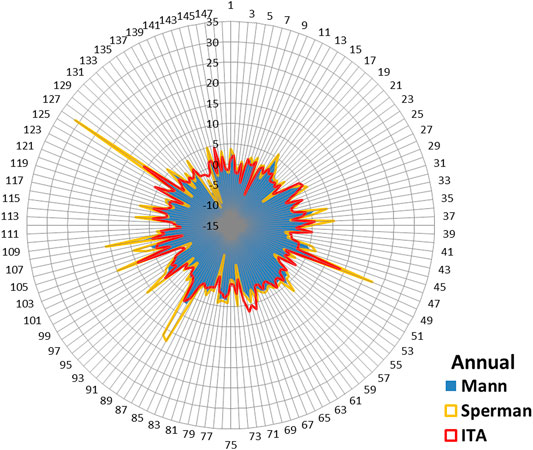
FIGURE 9. Comparison between annual trends values obtained by MK, SR and ITA method.
Discussions
The eastern part of Romania is subject to frequent climate and hydrological risk phenomena. These materialize either in the form of large amounts of precipitation with the effects of extreme hydrological phenomena such as flash floods and floods (Iosub et al., 2020) or the occurrence of long periods of drought, which manifests across all natural components (Minea et al., 2021). Many of the climate scenarios designated for the Eastern part of Europe, suggest an increasing warming of the entire region, with effects that translate in increased aridity and reduced agricultural productivity (Angearu et al., 2020). These effects are already seen through the appearance of accentuated periods of drought (Ioniță et al., 2015) and increases in evapotranspiration (Prăvălie et al., 2018), with impact on surface and groundwater resources. In this context, the analysis of the seasonal and annual trends of the groundwater level, completes the studies carried out in the field and comes as support for identifying sustainable solutions in the medium and long term in a context in which more than 50% of the population from this region does not have access to a public water supply network (Minea, 2020). The obtained results that highlight an increase of the depth of the piezometric level, especially in the summer and autumn seasons (at over 70% of the analyzed hydrogeological wells) will further accentuate the vulnerability of local communities to groundwater resources. The high dependence on groundwater resources means that communities and natural ecosystems are vulnerable to climate change (Minea and Croitoru, 2017). This is also reflected in the perception of natural hazards at local and regional stakeholders’ level (Margarint et al., 2021) where climate change’s impact is accounts for 40% of the population, at a high level of threats. Application of various methods in the analysis of groundwater level trends requires obtaining statistically significant results that can constitute the basis for viable water management systems. Coupling of well-known statistical methods (like the MK and the SR tests) with one based on graphical analysis (the ITA method) can complete the analysis on the tendencies of various hydro-climatic parameters. These were made in order to identify trends for different climatic (Wu et al., 2018) or hydrological parameters (Ali et al., 2019) and in addition, for groundwater level (Halder et al., 2020). Using cluster analysis to identify the best classification of the hydrogeological wells, based on water depth, integrates the results obtained on groundwater level trends in regional studies. The method was also used to classify air temperature (Firat et al., 2012) and watersheds (Rao and Srinivas, 2006) for identifying climate and hydrological homogenous regions. It was also extended, in order to identify the homogeneous hydrogeological regions based on groundwater depth and variation (Pathak and Dodamani, 2019; Sahoo et al., 2021).
The limitation on this research resides in the fact that: 1) most of the analyzed hydrogeological wells are located along the hydrographic network (only 10% are in interfluvial zones, but they also have very deep water depth); 2) part of the area is not covered with hydrological wells (especially in the western part, near the Siret river); 3) for the same hydrogeological station, there may be multiple boreholes with different trends, due to the geological structure and the proximity to the hydrographic network.
The application of the three statistical methods (the MK test, SR test and the ITA method) to identify groundwater level trends for hydrogeological wells, classified based on cluster analysis is a new analysis model for identifying the evolution of the groundwater resources. This analysis can complete the studies that were already conducted on groundwater level trends in Europe, which did not analyzethe eastern area (Fan et al., 2013; Tegel et al., 2020; Nygren et al., 2021) and be coupled with the climate change scenarios and increasingly negative anthropic impact in the region (Cheval et al., 2017).
Conclusion
A total of 740 time series (of which 148 for annual time series and 592 for seasonal time series) from 1983 to 2020, were analyzed in order to identify groundwater level trends for the Eastern part of Romania. In order to achieve statistical significance, two classical statistical methods (the MK and SR tests) and a graphical one (the ITA method), were applied to 148 hydrological wells. For the Cluster analysis of the water depth, these were grouped in 8 clusters. For 68% of the annual time series (based on the MK test) and between 72% and 74% in the summer and autumn seasons (based on the SR and ITA method), a tendency of a statistically significant decrease in the groundwater level was observed. Most of this trends appeared in wells with water depths near the surface, in the northern and central parts, were the influence of prolonged meteorological and hydrological drought manifested in this area in the last decades is obvious. Given the high degree of dependence of the local population on groundwater resources (which is the main source of water supply) and the increasing effects of climate change in the region (manifested through rising air temperatures and reduced water supply from precipitation and the hydrographic network) it is important to identify sustainable solution for medium and long time, in order to reduce the impact of such tendencies.
Data Availability Statement
The original contributions presented in the study are included in the article/Supplementary Material, further inquiries can be directed to the corresponding author.
Author Contributions
IM contributed to the conceptualization, ideas, methodology, validation, original paper draft, visualization and contributed to financial support. DB supervised the project, helped results analysis, and software programming. VA and MI contributed to study area definition, methods selection and results discussion. All authors contributed to manuscript revision, read, and approved the submitted version.
Funding
This work was supported by a grant of the Romanian Ministry of Education and Research CNCS-UEFISCDI, project number PN-III-P1-1.1-TE-2019-0286, within PNCDI III.
Conflict of Interest
The authors declare that the research was conducted in the absence of any commercial or financial relationships that could be construed as a potential conflict of interest.
Publisher’s Note
All claims expressed in this article are solely those of the authors and do not necessarily represent those of their affiliated organizations, or those of the publisher, the editors and the reviewers. Any product that may be evaluated in this article, or claim that may be made by its manufacturer, is not guaranteed or endorsed by the publisher.
Acknowledgments
The authors thank for the hydrological and hydrogeological data provided by the Prut Barlad Basin Branch of the Romanian National Water Administration. The data analysis was performed with the help of the infrastructure provided by the Physical-geographical Research and Environmental Quality Monitoring Station Mădârjac, fell under the administration of “Alexandru Ioan Cuza” University of Iași, Romania.
Supplementary Material
The Supplementary Material for this article can be found online at: https://www.frontiersin.org/articles/10.3389/fenvs.2022.852695/full#supplementary-material
References
Ali, R., Kuriqi, A., Abubaker, S., and Kisi, O. (2019). Long-Term Trends and Seasonality Detection of the Observed Flow in Yangtze River Using Mann-Kendall and Sen's Innovative Trend Method. Water 11, 1855. doi:10.3390/w11091855
Angearu, C.-V., Ontel, I., Boldeanu, G., Mihailescu, D., Nertan, A., Craciunescu, V., et al. (2020). Multi-Temporal Analysis and Trends of the Drought Based on MODIS Data in Agricultural Areas, Romania. Remote Sens. 12 (23), 3940. doi:10.3390/rs12233940
Asfaw, A., Simane, B., Hassen, A., and Bantider, A. (2018). Variability and Time Series Trend Analysis of Rainfall and Temperature in Northcentral Ethiopia: a Case Study in Woleka Sub-basin. Weather Clim. Extrem. 19, 29–41. doi:10.1016/j.wace.2017.12.002
Ashraf, M. S., Ahmad, I., Khan, N. M., Zhang, F., Bilal, A., and Guo, J. (2020). Streamflow Variations in Monthly, Seasonal, Annual and Extreme Values Using Mann-Kendall, Spearmen's Rho and Innovative Trend Analysis. Water Resour. Manage 35, 243–261. doi:10.1007/s11269-020-02723-0
Bîrsan, M. V., Zaharia, L., Chendes, V., and Branescu, E. (2014). Seasonal Trends in Romanian Streamflow. Hydro Proc. 28, 4496–4505.
Boicu, D., Minea, I., Chelariu, O. E., and Iosub, M. (2019). “Evaluation on Groundwater Recharges Capacity Using AHP Method. Case Study: The Moldavian Plain,” in 2019 ”Air and Water – Components of the Environment” Conference Proceedings, Cluj-Napoca, Romania, 2019, 181–188.
Caloiero, T., Coscarelli, R., and Ferrari, E. (2018). Application of the Innovative Trend Analysis Method for the Trend Analysis of Rainfall Anomalies in Southern Italy. Water Resour. Manage 32, 4971–4983. doi:10.1007/s11269-018-2117-z
Cheval, S., Dumitrescu, A., and Birsan, M.-V. (2017). Variability of the Aridity in the South-Eastern Europe over 1961-2050. Catena 151, 74–86. doi:10.1016/j.catena.2016.11.029
Croitoru, A.-E., Piticar, A., and Burada, D. C. (2016). Changes in Precipitation Extremes in Romania. Quat. Int. 415, 325–335. doi:10.1016/j.quaint.2015.07.028
Croitoru, A. E., and Minea, I. (2015). The Impact of Climate Changes on Rivers Discharge in Eastern Romania. Theor. Appl. Climatol. 3-4, 1434–4483. doi:10.1007/s00704-014-1194-z2012
Croitoru, A. E., Piticar, A., Sfica, L., Harpa, G. V., Rosca, C. F., Tudose, T., et al. (2018). Extreme Temperature and Precipitation Events in Romania. Bucharest: Romanian Academy Press.
Dabanli, I., Şen, Z., Yelegen, M. Ö., Sisman, E., Selek, B., and Guclu, Y. S. (2016). Trend Assessment by the Innovative-Şen Method. Water Resour. Manage 30, 5193–5203. doi:10.1007/s11269-016-1478-4
de Moura, C. N., Neto, S. L. R., Campos, C. G. C., and Sá, E. A. S. (2020). Hydrological Impacts of Climate Change in a Well-Preserved Upland Watershed. Water Resour. Manage 34, 2255–2267. doi:10.1007/s11269-019-02450-1
Dumitrescu, A., Bojariu, R., Birsan, M.-V., Marin, L., and Manea, A. (2015). Recent Climatic Changes in Romania from Observational Data (1961-2013). Theor. Appl. Climatol. 122, 111–119. doi:10.1007/s00704-014-1290-0
Dumitriu, D. (2020). Streamflow and Suspended Sediment Load Trends in Trotuș Drainage Basin: Geomorphic Implications. Present Environ. Sustain. Dev. 14 (2), 67–87. doi:10.15551/pesd2020142005
El Kenawy, A., López-Moreno, J. I., and Vicente-Serrano, S. M. (2011). Recent Trends in Daily Temperature Extremes over Northeastern Spain (1960-2006). Nat. Hazards Earth Syst. Sci. 11, 2583–2603. doi:10.5194/nhess-11-2583-2011
Fan, Y., Li, H., and Miguez-Macho, G. (2013). Global Patterns of Groundwater Table Depth. Science 339 (6122), 940–943. doi:10.1126/science.1229881
Firat, M., Dikbas, F., Koc, A. C., and Gungor, M. (2012). Analysis of Temperature Series: Estimation of Missing Data and Homogeneity Test. Mater. Apps 19 (4), 397–406. doi:10.1002/met.271
Goyal, M. K., and Gupta, V. (2014). Identification of Homogeneous Rainfall Regimes in Northeast Region of India Using Fuzzy Cluster Analysis. Water Resour. Manage 28, 4491–4511. doi:10.1007/s11269-014-0699-7
Halder, S., Roy, M. B., and Roy, P. K. (2020). Analysis of Groundwater Level Trend and Groundwater Drought Using Standard Groundwater Level Index: a Case Study of an Eastern River Basin of West Bengal, India. SN Appl. Sci. 2, 507. doi:10.1007/s42452-020-2302-6
Hamed, K. H. (2009). Exact Distribution of the Mann-Kendall Trend Test Statistic for Persistent Data. J. Hydrology 365, 86–94. doi:10.1016/j.jhydrol.2008.11.024
Hamed, K. H. (2007). Improved Finite-Sample Hurst Exponent Estimates Using Rescaled Range Analysis. Water Resour. Res. 43, 797–809. doi:10.1029/2006WR005111
Hamed, K. H. (2016). The Distribution of Spearman's Rho Trend Statistic for Persistent Hydrologic Data. Hydrological Sci. J. 61 (1), 214–223. doi:10.1080/02626667.2014.968573
Ionita, M., Scholz, P., and Chelcea, S. (2016). Assessment of Droughts in Romania Using the Standardized Precipitation Index. Nat. Hazards 81, 1483–1498. doi:10.1007/s11069-015-2141-8
Ionita, M., Scholz, P., and Chelcea, S. (2015). Spatio-temporal Variability of Dryness/wetness in the Danube River Basin. Hydrol. Process. 29, 4483–4497. doi:10.1002/hyp.10514
Iosub, M., Minea, I., Chelariu, O. E., and Ursu, A. (2020). Assessment of Flash Flood Susceptibility Potential in Moldavian Plain (Romania). J. Flood Risk Manag. 13, e12588. doi:10.1111/jfr3.12588
Iversen, B. V., van der Keur, P., and Vosgerau, H. (2008). Hydrogeological Relationships of Sandy Deposits: Modeling of Two-Dimensional Unsaturated Water and Pesticide Transport. J. Environ. Qual. 37, 1909–1917. doi:10.2134/jeq2006.0200
Khan, N., Shahid, S., Ismail, T. b., and Wang, X.-J. (2019). Spatial Distribution of Unidirectional Trends in Temperature and Temperature Extremes in Pakistan. Theor. Appl. Climatol. 136, 899–913. doi:10.1007/s00704-018-2520-7
Kisi, O., and Ay, M. (2016). Reply to the Comments on "Comparison of Mann-Kendall and Innovative Trend Method for Water Quality Parameters of the Kizilirmak River, Turkey" by Kisi, O. And Ay, M. [J. Hydrol. 513 (2014) 362-375] and "An Innovative Method for Trend Analysis of Monthly pan Evaporations" by Kisi, O. [J. Hydrol. 527 (2015) 1123-1129]. J. Hydrology 538, 883–884. doi:10.1016/j.jhydrol.2016.04.065
Kişi, Ö., Santos, C. A. G., da Silva, R. M., and Zounemat-Kermani, M. (2018). Trend Analysis of Monthly Streamflows Using Şen's Innovative Trend Method. Geofizika 35 (1), 53–68. doi:10.15233/gfz.2018.35.3
Koster, R. D., Betts, A. K., Dirmeyer, P. A., Bierkens, M., Bennett, K. E., Déry, S. J., et al. (2017). Hydroclimatic Variability and Predictability: A Survey of Recent Research. Hydrol. Earth Syst. Sci. 21 (7), 3777–3798. doi:10.5194/hess-21-3777-2017
Malik, A., Kumar, A., Guhathakurta, P., and Kisi, O. (2019). Spatial-temporal Trend Analysis of Seasonal and Annual Rainfall (1966-2015) Using Innovative Trend Analysis Method with Significance Test. Arab. J. Geosci. 12 (328), 2–23. doi:10.1007/s12517-019-4454-5
Mărgărint, M. C., Niculiță, M., Roder, G., and Tarolli, P. (20212021). Risk Perception of Local Stakeholders on Natural Hazards: Implications for Theory and Practice. Nat. Hazards Earth Syst. Sci. 21, 3251–3283. doi:10.5194/nhess-21-3251-2021
Meals, D. W., Spooner, J., Dressing, S. A., and Harcum, J. B. (2011). Statistical Analysis for Monotonic Trends, Tech Notes 6,November 2011. Fairfax, VA: Developed for U.S. Environmental Protection Agency by Tetra Tech, Inc., 23.
Minea, I., Boicu, D., Iosub, M., Chelariu, O. E., and Enea, A. (2020b). Groundwater Drought Evolution in North-Eastern Part of Romania. Geobalcanica 6, 55–60. doi:10.18509/GBP.2020.06
Minea, I., Boicu, D., and Chelariu, O.-E. (2020a). Detection of Groundwater Levels Trends Using Innovative Trend Analysis Method in Temperate Climatic Conditions. Water 12 (8), 2129. doi:10.3390/w12082129
Minea, I., Boicu, D., Iosub, M., Chelariu, O. E., and Solomon, B. (2020c). Long-term Trends in River Flow from North-eastern Part of Romania, International Multidisciplinary Scientific GeoConference on Water Resources, Forest, Marine and Ocean Ecosystems, Conference Proceedings, SGEM 2020. Conf. Proc. 20, 225–231. doi:10.5593/sgem2020/3.1/s.12.030
Minea, I., and Chelariu, O. E. (2021). Anomalies and Trends of High River Flow under Temperate Climatic Conditions in North-Eastern Romania. J. Water Clim. Change 122, 552–565. doi:10.2166/wcc.2020.124
Minea, I., and Croitoru, A.-E. (2017). Groundwater Response to Changes in Precipitations in North-Eastern Romania. Environ. Eng. Manag. J. 16 (3), 643–651. doi:10.30638/eemj.2017.066
Minea, I., Iosub, M., and Boicu, D. (20212021). Multi-scale Approach for Different Type of Drought in Temperate Climatic Conditions. Nat. Hazards 110, 1153–1177. doi:10.1007/s11069-021-04985-2
Minea, I. (2020). “The Vulnerability of Water Resources from Eastern Romania to Anthropic Impact and Climate Change,” in Water Resources Management in Romania. Editors A. Negm, G. Romanescu, and M. Zeleňáková (Cham: Springer Water. Springer), 229–250. doi:10.1007/978-3-030-22320-5_7
Moberg, A., Jones, P. D., Lister, D., Walther, A., Brunet, M., Jacobeit, J., et al. (2006). Indices for Daily Temperature and Precipitation Extremes in Europe Analyzed for the Period 1901-2000. J. Geophys. Res. 111, D22106. doi:10.1029/2006jd007103
Nygren, M., Giese, M., and Barthel, R. (2021). Recent Trends in Hydroclimate and Groundwater Levels in a Region with Seasonal Frost Cover. J. Hydrology 602, 126732. doi:10.1016/j.jhydrol.2021.126732
Onyutha, C. (2020). Graphical-statistical Method to Explore Variability of Hydrological Time Series. Hydrology Res. 52 (1), 266–283. doi:10.2166/nh.2020.111
Pathak, A. A., and Dodamani, B. M. (2019). Trend Analysis of Groundwater Levels and Assessment of Regional Groundwater Drought: Ghataprabha River Basin, India. Nat. Resour. Res. 28, 631–643. doi:10.1007/s11053-018-9417-0
Prăvălie, R., Piticar, A., Roșca, B., Sfîcă, L., Bandoc, G., Tiscovschi, A., et al. (2019). Spatio-temporal Changes of the Climatic Water Balance in Romania as a Response to Precipitation and Reference Evapotranspiration Trends during 1961-2013. Catena 172, 295–312. doi:10.1016/j.catena.2018.08.028
Rao, A. R., and Srinivas, V. V. (2006). Regionalization of Watersheds by Fuzzy Cluster Analysis. J. Hydrology 318 (1–4), 57–79. doi:10.1016/j.jhydrol.2005.06.004
Sahoo, S., Swain, S., Goswami, A., Sharma, R., and Pateriya, B. (2021). Assessment of Trends and Multi-Decadal Changes in Groundwater Level in Parts of the Malwa Region, Punjab, IndiaGroundwater for Sustainable Development. Groundw. Sustain. Dev. 14, 100644. doi:10.1016/j.gsd.2021.100644
Salmi, T., Määttä, A., Anttila, P., Ruoho-Airola, T., and Amnell, T. (2002). Detecting Trends of Annual Values of Atmospheric Pollutants by the Mann-Kendall Test and Sen's Slope Estimates - the Excel Template Application MAKESENS. Helsinki, Finland: Finnish Meteorological Institute.
Sandu, I., Pescaru, V. I., Poiana, I., Geicu, A., Cândea, I., and Ţâştea, D. (2008). Clime of Romania. Bucharest: Romanian Academy Press. (in Romanian).
Sen, P. K. (1968). Estimates of the Regression Coefficient Based on Kendall's Tau. J. Am. Stat. Assoc. 63, 1379–1389. doi:10.1080/01621459.1968.10480934
Şen, Z. (2014). Trend Identification Simulation and Application. J. Hydrol. Eng. 19 (3), 635–642. doi:10.1061/(ASCE)HE.1943-5584.0000811
Șen, Z. (2012). Innovative Trend Analysis Methodology. J. Hydrol. Eng. 17, 1042–1046. doi:10.1061/(ASCE)HE.1943-5584.0000556
Şen, Z. (2017). Innovative Trend Significance Test and Applications. Theor. Appl. Climatol. 127, 939–947. doi:10.1007/s00704-015-1681-x
Shrestha, A. B., Bajracharya, S. R., Sharma, A. R., Duo, C., and Kulkarni, A. (2017). Observed Trends and Changes in Daily Temperature and Precipitation Extremes over the Koshi River Basin 1975-2010. Int. J. Climatol. 37, 1066–1083. doi:10.1002/joc.4761
Sohoulande Djebou, D. C., and Singh, V. P. (2016). Impact of Climate Change on Precipitation Patterns: a Comparative Approach. Int. J. Climatol. 36, 3588–3606. doi:10.1002/joc.4578
Sonali, P., and Nagesh Kumar, D. (2013). Review of Trend Detection Methods and Their Application to Detect Temperature Changes in India. J. Hydrology 476, 212–227. doi:10.1016/j.jhydrol.2012.10.034
Tabari, H., Marofi, S., Aeini, A., Talaee, P. H., and Mohammadi, K. (2011). Trend Analysis of Reference Evapotranspiration in the Western Half of Iran. Agric. For. Meteorology 151, 128–136. doi:10.1016/j.agrformet.2010.09.009
Tabari, H., Taye, M. T., Onyutha, C., and Willems, P. (2017). Decadal Analysis of River Flow Extremes Using Quantile-Based Approaches. Water Resour. Manage 31, 3371–3387. doi:10.1007/s11269-017-1673-y
Taye, M. T., Willems, P., and Block, P. (2015). Implications of Climate Change on Hydrological Extremes in the Blue Nile Basin: a Review. J. Hydrology Regional Stud. 4, 280–293. doi:10.1016/j.ejrh.2015.07.001
Tegel, W., Seim, A., Skiadaresis, G., Ljungqvist, F. C., Kahle, H.-P., Land, A., et al. (2020). Higher Groundwater Levels in Western Europe Characterize Warm Periods in the Common Era. Sci. Rep. 10, 16284. doi:10.1038/s41598-020-73383-8
Wang, F., Shao, W., Yu, H., Kan, G., He, X., Zhang, D., et al. (2020). Re-evaluation of the Power of the Mann-Kendall Test for Detecting Monotonic Trends in Hydrometeorological Time Series. Front. Earth Sci. 8, 14. doi:10.3389/feart.2020.00014
Wu, H., Li, X., and Qian, H. (2018). Detection of Anomalies and Changes of Rainfall in the Yellow River Basin, China, through Two Graphical Methods. Water 10, 19.
Wu, H., and Qian, H. (2017). Innovative Trend Analysis of Annual and Seasonal Rainfall and Extreme Values in Shaanxi, China, since the 1950s. Int. J. Climatol. 37, 2582–2592. doi:10.1002/joc.4866
Xiao, Y., Xiao, D., Hao, Q., Liu, K., Wang, R., Huang, X., et al. (2021). Accessible Phreatic Groundwater Resources in the Central Shijiazhuang of North China Plain: Perspective from the Hydrogeochemical Constraints. Front. Environ. Sci. 9, 747097. doi:10.3389/fenvs.2021.747097
Yang, J., Chang, J., Yao, J., Wang, Y., Huang, Q., and Xu, G. (2017). Impact of Natural Climate Variability on Runoff Based on Monte Carlo Method. J. Water Clim. Change 10, 344–359. doi:10.2166/wcc.2017.177
Keywords: groundwater level, trends, MK test, SR test, ITA method
Citation: Minea I, Boicu D, Amihăiesei V and Iosub M (2022) Identification of Seasonal and Annual Groundwater Level Trends in Temperate Climatic Conditions. Front. Environ. Sci. 10:852695. doi: 10.3389/fenvs.2022.852695
Received: 11 January 2022; Accepted: 18 April 2022;
Published: 11 May 2022.
Edited by:
Xander Wang, University of Prince Edward Island, CanadaReviewed by:
Khalil Ur. Rahman, Tsinghua University, ChinaAbu Reza Md. Towfiqul Islam, Begum Rokeya University, Bangladesh
Hao Wu, East China University of Technology, China
Copyright © 2022 Minea, Boicu, Amihăiesei and Iosub. This is an open-access article distributed under the terms of the Creative Commons Attribution License (CC BY). The use, distribution or reproduction in other forums is permitted, provided the original author(s) and the copyright owner(s) are credited and that the original publication in this journal is cited, in accordance with accepted academic practice. No use, distribution or reproduction is permitted which does not comply with these terms.
*Correspondence: Daniel Boicu, daniel.boicu@uaic.ro