The Recent Relationships Between Andean Ice-Core Dust Record and Madeira River Suspended Sediments on the Wet Season
 Rafael S. dos Reis1*
  Rafael da Rocha Ribeiro1
  Barbara Delmonte2
  Edson Ramirez3 Norberto Dani1 Paul A. Mayewski4
  Jefferson C. Simões1,4*
- 1Centro Polar e Climático, Universidade Federal Do Rio Grande do Sul, Porto Alegre, Brazil
- 2Environmental and Earth Sciences Department, University Milano-Bicocca, Milan, Italy
- 3Instituto de Hidráulica e Hidrología, Universidad Mayor de San Andrés, La Paz, Bolivia
- 4Climate Change Institute, University of Maine, Orono, ME, United States
Dust particle studies in ice cores from the tropical Andes provide important information about climate dynamics. We investigated dust concentrations from a 22.7 m ice-core recovered from the Quelccaya Ice Cap (QIC) in 2018, representing 14 years of snow accumulation. The dust seasonality signal was still preserved with homogenization of the record due to surface melting and percolation. Using a microparticle counter, we measured the dust concentration from 2 to 60 µm and divided the annual dust concentration into three distinct groups: fine particle percentage (FPP, 2–10 µm), coarse particle percentage (CPP, 10–20 μm), and giant particle percentage (GPP, 20–60 μm). Increased dust was associated with the warm stage of the Pacific Decadal Oscillation index (PDO) after 2013 with significant increases in FPP and a relative decrease in CPP and GPP. There was a positive correlation between PDO and FPP (r = 0.70, p-value < 0.005). CPP and GPP were dominant during the mainly PDO cold phase (2003–2012). The FPP increase record occurs during the positive phase of PDO and snow accumulation decrease. We also revealed a potential link between QIC record and Madeira River during the wet season through two relationships: between QIC snow accumulation and runoff during transitional season, QIC dust, and suspended sediments during high-water discharge. The snow accumulation (during September-November) and runoff (during November-January) relationship present similar variability using a time-lag (60 days) while total dust and FPP group are associated with average suspended sediments concentration during February-April. Assessing dust record variability by distinct size groups can help to improve our knowledge of how the Pacific ocean influence dust record in the QIC. In addition, the association of snow accumulation and dust variability with dynamic changes in suspended sediments load and runoff in the Madeira River system demonstrates the potential for future investigation of linkages between QIC record and Amazon basin rivers.
Introduction
Dust particles, the most abundant aerosol type in the atmosphere, significantly influence climate. This can occur both directly, through scattering and absorption of solar radiation (Kok et al., 2017; Di Biagio et al., 2020), and indirectly, as cloud condensation nuclei and ice nuclei along with biogeochemical cycling of nutrients to marine phytoplankton (Ansmann, 2005; Jickells, 2005; Stevens and Feingold, 2009; Carslaw et al., 2010).
Particles archived in Peruvian ice cores preserve the region’s climate history, but insufficient knowledge of their size distribution hinders a better understanding of climate dynamics, which can be retrieved by measuring the absolute levels (i.e., total number), size distribution, and composition. Variability in the particle concentration and size distributions is usually directly correlated with changes in climate dynamics along the ice-core record (Delmonte et al., 2002; Ruth, 2002; Wegner et al., 2015; Delmonte et al., 2017; Li et al., 2019). While absolute concentration depends on many factors (e.g., snow accumulation rate, dust source, and transport processes), the size distribution and relative proportion of particles within a given grain size depends primarily on transport conditions (Delmonte et al., 2004; Delmonte et al., 2017). Atmospheric dust transport occurs through advection, convection, and turbulent diffusion, while removal occurs through dry and wet deposition (Tegen and Fung, 1994; Li et al., 2008).
South American mountain glaciers function as a buffer for freshwater resources, especially during low-precipitation seasons in countries such as Bolivia and Peru (Vuille et al., 2008). The Andes host >99% of all tropical glaciers on Earth (Kaser, 1999), providing dust archives that reveal seasonality, allow dry/wet season differentiation, and enable annual layer counting (Ramirez et al., 2003; Kutuzov et al., 2019). South America encompasses many temperature and precipitation zones, with the central Andes being affected by both Atlantic and Pacific atmospheric circulation patterns in the north and south, respectively (Sagredo and Lowell, 2012).
Over the last 50 years, the tropical glacier retreat is slightly faster than the global scale (Rabatel et al., 2013). Model projections of future climate change in the tropical Andes indicate a continued warming of the tropical troposphere throughout the 21st century, with a temperature increase that is enhanced at higher elevations. As consequence, the tropical Andes may experience a massive warming scenario on the order of 4.5–5°C by the end of the 21st century (Vuille et al., 2008). Recent warming in the latter half of the 20th century has impacted the preservation of δ18O-derived seasonality data in Quelccaya Ice Cap (QIC, 13º56′ S, 70º50’ W, 5,670 m above sea level) ice cores, while dust records remain well preserved (Vuille et al., 2015; Yarleque et al., 2018) and offer more reliable data on climate dynamics.
Recent changes have also been observed over the Madeira River basin in the Amazon-Andean region (Espinoza Villar et al., 2009; Molina-Carpio et al., 2017), which is the largest contributor of suspended sediments to the Amazon River (Vauchel et al., 2017; Ayes Rivera et al., 2019). Erosion of the Andean Cordillera (Ayes Rivera et al., 2019) means that suspended sediment transport from the Amazon basin to the Atlantic Ocean is mainly driven by rivers (Filizola and Guyot, 2011). The junction of the Beni and Mamoré rivers forms the Madeira River (Figure 1) and connects it to the main suspended sediment source in the Andes (Vauchel et al., 2017). As the Madeira River has a significant impact on Amazonian suspended sediment balance (Ayes Rivera et al., 2019), understanding potential connections between QIC variability and Amazon rivers could help improve our understanding of this complex climate region.
FIGURE 1. Ice-core sites and main rivers from Upper Madeira Basin in the western Amazon region; map layers were extracted from www.naturalearthdata.com and http://terrabrasilis.dpi.inpe.br.
In this study, we present total dust and density data derived from recent expedition QIC and use this to investigate 1) the large-scale influence of Pacific Decadal Oscillation (PDO) and Niño 3.4 index in the QIC dust groupings, and 2) the dynamic relationship between QIC dust, snow accumulation and the Amazon region using suspended sediment and precipitation data from the Madeira River at the Porto Velho gauge station, which has a complete data series during 2003–2017 period. Considering the importance of both dynamic for the Amazon system, the relationships between the QIC and Madeira river can improve the contemporaneous knowledge about the dynamic involving the Andean ice cores and Amazon rivers.
The Study Area
Tropical Andean glaciers belong to two distinct continental climate zones (Kaser, 2001) with clear differences in temperature, precipitation, and humidity (Sagredo and Lowell, 2012; Veettil et al., 2016; Kozhikkodan Veettil and de Souza, 2017). The outer tropics (Peru, Bolivia, and northern Chile) are characterized by a tropical climate during the austral summer (high precipitation) and subtropical conditions during the austral winter (little to no precipitation).
The QIC is located at the northern edge of the Altiplano in the Cordillera Vilcanota (CV) of southern Peru (Figure 1). This is the world’s largest tropical ice cap (median area of 50.2 km2 (Hanshaw and Bookhagen, 2014), from which a previous deep core campaign recovered 1800 years of climate information (Thompson et al., 2013). Located between the Pacific Ocean and the Amazon Basin, during the wet season (austral summer) it is influenced by the South American summer monsoon (SASM), when most precipitation occurs (Garreaud, 2009). The Bolivian High and the northward extension of the low-level jet are associated with precipitation over the Andes between 20° S and 8° S from December-March. Extreme wet monthly events on interannual time scales are related to convection over the western Amazon during this period (Segura et al., 2019). Extratropical cold air incursions influence the wet season initiation (Li and Fu, 2006) which are responsible for trigger the most snowfall at QIC (Hurley et al., 2015). Observations using micro rain radar characterize the afternoon precipitation maxima as primarily convective, whereas the nighttime precipitation was largely stratiform at Cordillera Vilcanota (Perry et al., 2017). In the dry season (austral winter), westerly flow predominates (Vuille et al., 2000; Garreaud and Aceituno, 2001) and higher dust concentrations are attributed to dominant higher wind speeds from the west and northwest, which facilitate entrainment and transport of dust from the high, dry Altiplano. Still, during this season intense radiation receipt accompanied by little accumulation (with minor sublimation), which leaves the insoluble particles concentrated at the surface (Thompson et al., 1986). Dust peaks events (920 and 600 CE) analyzed by microscopy indicate as source particles derived by wind-blown dust with minor amounts of diatoms and volcanic particles. Between these peaks was observed bimodal volume with fine fraction dominant (0.63–1.6 μm) suggesting a lake sediment source, while coarser particles (8–16 μm) fraction is dominant during other sections (Thompson et al., 1988). The diatoms species indicates origin from dilute freshwater lake or wetland with excellent valve preservation suggesting a local source rather than long-transport distance of dust, such Altiplano (Fritz et al., 2015). At Illimani (Bolivia), giant dust particles (∅>20 µm) increase was associated with oscillations of stable isotope records. In addition, the geochemical and mineralogy study indicates dust attributed to the regional sources (Lindau et al., 2021).
The net annual increase during a hydrologic year is about 1.8 m on average (∼0.85 m water equivalent per year 2003–2014) is positively correlated with snow accumulation season (wet season). Recently, during the 2013–2014 hydrologic year the snow increased by more than 2.6 m (Hurley et al., 2015). The backward air trajectories for precipitation events in Quelccaya suggest that Amazon air parcels originating to the northwest and north of the Cordillera Vilcanota is associated with the majority of the precipitation events during the 2014–2015 wet season, nonetheless, the trajectories ending at 6,000 m and 8,000 m (at the Cusco precipitation) were more varied, with several originating over the Pacific Ocean (Perry et al., 2017). For the QIC, the most important terms able to significantly influence the surface energy balance of a tropical glacier are: net solar radiation and net longwave radiation. On tropical high-elevation glaciers, there are different factors that can modify albedo, including changes in precipitation in relation with air temperature (rain or snow) and factors like debris cover, dust, and soot (Salzmann et al., 2013).
The PDO, a pattern of climatic variability over the North Pacific, has warm and cold phases. During the former, the eastern Pacific exhibits above average temperatures that coincide with wet periods in south-central South America. Two types of pressure anomalies occur during this phase: low pressure over the North Pacific causes wind to flow counterclockwise, and high pressure in the northern subtropical Pacific causes winds to flow clockwise (Mantua and Hare, 2002; Guevara-Guillén et al., 2015).
Atmospheric circulation over the Amazon basin is influenced by the tropical Atlantic Ocean and is the main source of precipitation (snow) for tropical Andean glaciers. Tropical North Atlantic (TNA) is an indicator of surface temperatures in the eastern tropical North Atlantic Ocean (Enfield et al., 1999). Rainfall increases in the Amazon basin are related to increased water vapor transport from the Atlantic. In addition, droughts in this basin are associated with El Niño or northern tropical Atlantic warming (da Rocha Ribeiro et al., 2018). Severe droughts in 2005 and 2010 over the Amazon basin were associated with warmer TNA conditions, under which an anomalously northward displacement of the Intertropical Convergence Zone leads to weaker northeasterly Atlantic trade winds and rainfall reduction over the Amazon basin (Marengo and Espinoza, 2016).
The El Niño Southern Oscillation (ENSO) has environmental and economic impacts on a global scale (McPhaden et al., 2006). Very strong El Niño events (Oceanic Niño Index > +2.0) occurred in 1982–1983, 1997–1998, and 2015–2016, during which QIC margin retreat was greatly enhanced (Thompson et al., 2017). Nonetheless, there is no clear relation to ENSO events visible for the glacier ice reduction in the CV area. But, an increase of specific humidity for the area of CV is very likely, which may explain part of the observed substantial ice loss. In addition, with the increased humidity the longwave energy loss would generally be small (Salzmann et al., 2013). The QIC experiences an increase in westerly wind strength under El Niño conditions and easterly enhancement during La-Niña (Vuille et al., 2000; Garreaud and Aceituno, 2001). Tropical Pacific sea-surface temperatures and the associated ENSO provide a strong influence on the interannual variability of precipitation in the outer tropical Andes (Perry et al., 2017). In general, tropical Andes experiences below-normal precipitation and higher temperatures during El-Niño (Vuille et al., 2003). During this phase, there is a less snow accumulation at QIC and austral summer precipitation has an earlier onset than it does during La Niña with less middle to late summer snowfall. Also, the warmer sea surface temperature in the eastern tropical Pacific correspond with higher δ18O ratios at QIC, while anomalous convective activity over the Amazon Basin corresponds with lower δ18O ratios (Hurley et al., 2019).
The PDO and TNA influence precipitation in the Amazon region and the accumulation rate of tropical Andean glaciers during warm and cold phases (da Rocha Ribeiro et al., 2018). In Peru, ENSO and PDO influence precipitation. The country has at least three climatic regions: the west coast, the Andes Cordillera, and the east, with the Cordillera acting as a natural barrier that greatly affects precipitation patterns (Tapley and Waylen, 1990; Mohammadi et al., 2020). When ENSO occurs in phase with PDO, the influence on glacial snowline is stronger and more visible than ENSO events during neutral periods or opposite PDO phases. Due to geography, the Pacific influence primarily determines most of the climate in the Cordillera Blanca (western Peru), which influences the surface energy balance and surface mass balance. However, during El Niño, these events do not significantly affect air temperature trends in the eastern cordilleras, which include glaciers in the Cordillera Vilcanota (Salzmann et al., 2013; Veettil et al., 2016).
In the second half of the 20th century, annual QIC dust grew during the warm PDO phases (Figure 2), but did not change significantly otherwise. The warm and cold TNA phases did not appear to have a significant effect on overall dust concentration. During 1950-2000 period PDO and annual QIC dust presents a moderate correlation (r = 0.42, p-value < 0.01). High total dust concentration level was observed during period El-Niño event (1997/1998),
FIGURE 2. Dust record and Pacific Multidecadal Oscillations since 1950. Annual dust concentration profile of QIC (1950–2000 period) derived from past study (Thompson et al., 2013) for particles between 0.63 and 20 µm. The data were extracted from https://www.ncdc.noaa.gov/. Annual PDO index (solid line) extracted from https://psl.noaa.gov/. C marks periods dominantly cold observed between 1950 and 2003, whereas W marks the warm periods. The dust concentrations values are normalized.
The Madeira River is the second-largest tributary of the Amazon Basin, with a mean annual discharge at the Porto Velho station of 18,500 m3/s from 1967 to 2013 (Molina-Carpio et al., 2017). The Upper Madeira River drainage basin extends over three countries, with 11% in Peru, 73% in Bolivia, and 16% in Brazil (Molina-Carpio et al., 2017). The Madeira River basin at Porto Velho station consists of four main tributaries: Madre de Dios arriving from the Peruvian Andes, Beni and Mamoré from the central Bolivian Andes, and the Guaporé River from the southeastern part of the basin (Brazilian Shield). In the upper Madeira Basins, the wet season coincides with the mature phase of the SASM from December to March (Vera et al., 2006; Marengo et al., 2012) with mean rainfall values higher than 6 mm/day over the 1982–2017 period (Espinoza et al., 2019a). ∼50% of its annual precipitation occurs during the wet season from December to February (DJF) (Espinoza Villar et al., 2009). Over the upper part of the Madre de Dios, Beni and Mamoré basins, during January and February occurs the maximum daily rainfall (more than 16 mm/day) characterized by the presence of rainfall “hotspot” regions. In absence of the SASM, a marked dry season predominates during the austral winter from June until August (Espinoza et al., 2019b).
At annual scale, the rainfall over the middle Madre de Dios, Beni and Mamoré basins (northern part) has stronger influence on runoff variability at annual scale and is mostly related to the wet season pattern, while rainfall over the southern part of the basin (south of 14o) shows low or no significant correlation with runoff at Porto Velho and more influent to runoff variability during low-water discharge (dry season) (Espinoza Villar et al., 2009; Molina-Carpio et al., 2017; Espinoza et al., 2019b). In overall scenario, the runoff decrease in recent decades is associated with an increase in the frequency of dry days and decreased rainfall south of 14° S, compared to a rainfall increase north of 14° S (Espinoza et al., 2019b).
Materials and Methods
In September 2018, an expedition led by researchers from the Climate and Polar Center at the Federal University of Rio Grande do Sul (CPC-UFRGS) and the Climate Change Institute at the University of Maine (CCI-Maine) recovered a 22.7 m ice-core from the QIC (Figure 1) using an electro-mechanical Stampfli drill. Frozen ice-core sections were transported to CCI for ICP-MS and ion chromatographic analysis as well as to the Eurocold laboratory (Milan, Italy) for dust concentration analysis.
We selected 183 samples, representing 13.96 m water equivalent, for dust particle analysis. Measurements were performed in random order using a microparticle counter (Coulter Counter Multisizer IV, 400-channels) set up in a class 100 clean room at the Eurocold laboratory (Milan, Italy). The instrument was calibrated with 2.07 μm latex and set to detect particles with equivalent spherical diameters from 2 to 60 μm. Each concentration and size distribution value represented the average of at least three independent measurements in the same sample. The total mass of insoluble dust was calculated from the volume size distribution, assuming an average density of 2.5 g/cm3. A standard was set using ultrapure water and checked after five sample analyses with an average value of ∼1 ppb.
Annual dating was defined from the start of the dry season until the end of the wet season for each year (Figure 3A) and seasons were calibrated using QAnalysis software based on snow accumulation data during period. We smoothed the dust concentration profile with a moving average calculated using three samples for the total dust concentration to characterize seasonality. For statistical correlations, we used the mean dust concentration for each year. All correlations given here were significant at the 95% level. We defined three groups with distinct ranges: fine particle percentage (FPP, 2–10 μm), coarse particle percentage (CPP, 10–20 μm), and giant particle percentage (GPP, 20–60 μm). We defined a year as the period from June to the following May for PDO and ENSO indexes oscillations, following the recent studies observations from Hurley et al., 2019.
FIGURE 3. 22.7 m ice-core profile recovered in September 2018 from the Quelccaya Ice Cap, Peru. (A) 13.96 m ice-core dust profile (in water equivalent); grey and white shading marking wet and dry seasonality, respectively. The calibration was based on snow accumulation data available from Hurley et al., 2019. (B) 2018 density profile compared with 1983 and 2003 ice cores (Thompson et al., 2017); red shading marks the first 10 m with observable density alterations between the three cores.
The study of hydrosedimentological processes involves the determination of suspended load (Qss), bed load and total solid discharge, which depends on many variables. In general, suspended sediment represents, for most cases, most of total sediment discharge (Carvalho et al., 2000). Among the several methods and approaches for this specific theme, we selected Eq. 1 that synthetizes the suspended solid discharges calculation due to variables available at station. The Qss values (tons/months) in the Madeira River are based on the simplified method presented by (Carvalho et al., 2000), which represent the suspended solid discharge measured. We considered the month water discharge (Q, m3/s) and suspended sediment concentration (C, mg/L) data, which were extract of Porto Velho station from website (hybam.obs-mip.fr).
We applied the average for the February, March and April month’s data during each hydrological year. The runoff during November, December and January months (NDJ) values were extracted from Espinoza et al., 2019b during 2003–2016 hydrological year. The precipitation during December, January and February were extracted from recent study from Ayes Rivera et al., 2021 using the Porto Velho station values.
Results
We assessed 14 years of dust accumulation concentrations in the QIC. The profile clearly delineated dry and wet seasons, represented by high and low concentrations, respectively (Figure 3A). The dust concentration measured in the samples ranged from 617 to 23,176 ppb/ml. The mean seasonal value of dust concentrations during dry and wet seasons was 6,807 (±1786) ppb/ml and 2,181 (±456) ppb/ml, respectively. From 2015 to 2016, there was a 55% increase above average during the wet season. The short snow accumulation during 2015–2016 years occurs due to very strong El-Niño when a snow accumulation decrease was observed. The thinner annual layer, as reported during 2015–2016 El-Niño year, might be a product of enhanced ablation resulting from increased insolation and higher temperatures (Perry et al., 2014). The high accumulation during 2013–2014 is compatible with above average snow-height at QIC during this wet season year observed by Hurley et al., 2015.
Recent atmospheric warming in the QIC has resulted in changing depth of the firn/ice transition (Thompson et al., 2017). Comparing with two previous ice cores recovered from QIC, we observed a density alteration in the first 10 m between ice cores over time (Figure 3B). For the 1983 and 2003 cores, the firn/ice transition occurred at ∼21–22 and ∼18–19 m depth, respectively, compared with our core at ∼17–18 m.
In ice core recovered in 2018, the annual total dust concentration increase coincided with the recent inversion from the PDO cold phase (2005–2013) to the PDO warm phase (2014–2017). Different group dominates the highest concentrations over the years (Figure 4). CPP and GPP dominated from 2003 to 2012 (PDO cold phase dominant) with a significant increase in FPP starting in 2013, concomitantly with the PDO warm phase began (Jan-2014). Up to 2012, the annual mean dust of the FPP group was 952 (±171) ppb/ml, while CPP and GPP had average concentrations of 1,231 ± 301 and 1,436 ± 266 ppb/ml, respectively. From 2013, FPP became the dominant group with a concentration increase of 54.7%, while CPP and GPP showed decreases of 5.62 and 21.8%, respectively. The dominance inversion occurs during the highest snow accumulation year, already observed in the profile.
FIGURE 4. Annual mean concentration of ice-core dust-size groups from 2003 to 2017 period for FPP (fine, 2–10 µm), CPP (coarse, 10–20 µm), and GPP (giant, 20–60 µm).
The direct relationship between fine particles and PDO index is supported by a positive correlation, at the 95% level, between the annual mean dust concentration of FPP and this annual index (r = 0.70, p < 0.005) in 2018. Exploring the relationship between FPP dust and snow accumulation (Figure 5) we observed inverse relationship between them. During the high accumulation period we observed lower concentration and negative PDO values, whereas during lower snow accumulation was noted high FPP concentration and positive values for PDO. This hypothesis needs to be explored during a long-record using this specific dust group. For the QIC, El Niño often results in arid conditions and low accumulation on the ice cap, as recorded in the ice stratigraphy (Thompson et al., 1985; Thompson, 2000; Thompson et al., 2013). However, there is no correlation significance between FPP and Niño 3.4, but is observed high FPP concentrations during El-Niño events (2009–2010 and 2015–2016, red arrows). Also, in opposite, is noted lower FPP concentration during La-Niña events (2007–2008 and 2010–2011, blue arrows). The relative CPP group and GPP group, apparently, did not show direct relationship during ENSO oscillations. However, it is observed a relative content increase (Figure 4) during El-Niño event (2009–2010).
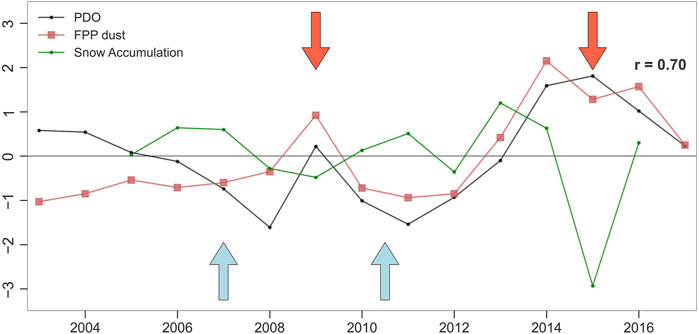
FIGURE 5. The annual PDO index (June-May) and QIC FPP dust during 2003–2017 period. Annual snow accumulation data from AWS station (Hurley et al., 2019). Index is derived from https://psl.noaa.gov/data/climateindices. Correlation in the figure is related to PDO and FPP dust concentration. PDO index, FPP dust and Snow accumulation values are normalized. The arrows represent moderate or strong ENSO events (red = El-Niño, blue = La-Niña).
TNA did not show significant phase alterations, remaining largely in the positive phase from 2003 to 2017. Potentially, drought conditions are associated to the TNA warm phase (Marengo and Espinoza, 2016) and may have led to dry deposition of large dust groups (i.e., by gravitational settling (Tegen and Fung, 1994)) from the source area during PDO cold phase dominant.
We investigated the relationship of QIC data and Madeira river during the period observed. Assessing the snow accumulation data and dust grouping content we compared with Madeira river dynamic using the precipitation, runoff and suspended sediments data. The connection between snow accumulation and precipitation during wet seasons is more evidential during January month (Figure 6A). In addition, the dynamic relationship is observed during the transitional period by snow accumulation during September–November months (SON) at QIC and runoff at Porto Velho station with 60 days time-lag (Figure 6B). Furthermore, the link between them is noted for the dust content and suspended sediments using the similar delay mentioned. The higher correlation observed between dust groupings and riverine suspended sediments occur with FPP group (Figure 6C).
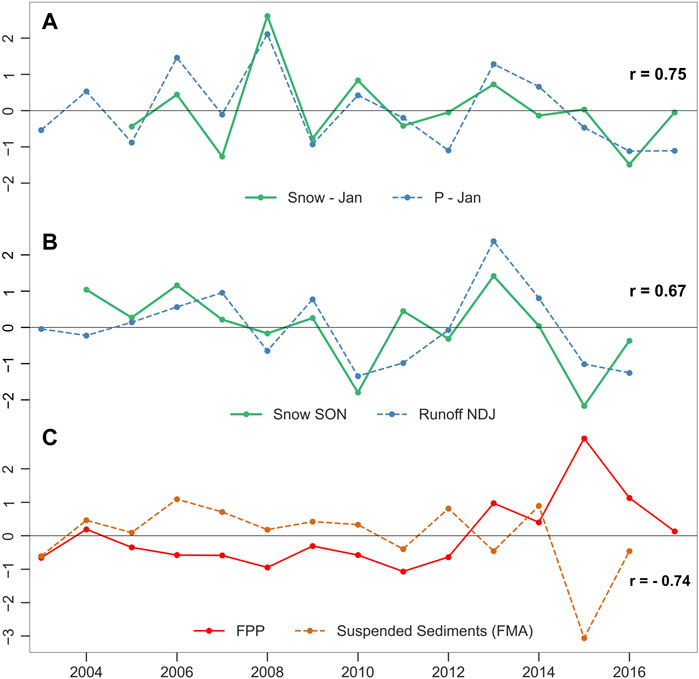
FIGURE 6. Comparison of wet season records from the Madeira River data at the Porto Velho station (hybam.obs-mip.fr) and recent QIC data during 2003–2016 wet seasons period. All values are normalized. (A) Rainfall precipitation (Ayes Rivera et al., 2021) and snow accumulation (AWS station at QIC) during January. (B) Snow accumulation during Setember-November from AWS station (Hurley et al., 2019) and Runoff (NDJ) values (Espinoza et al., 2019b) from 2003 to 2016; (C) The FPP group concentration during 2003–2017 wet seasons and average suspended sediments load (tons/month) during high water discharge months (FMA) during the wet season hydrological period.
Discussion
Large-Scale Atmospheric Circulation Patterns Over the Central Andes
During recent decades, the snowline altitude of Bolivian glaciers has fluctuated between the warm and cold PDO phases when combined with the ENSO warm and cold phases, respectively (Veettil et al., 2016). In Ecuador, the strong connection between PDO and ENSO is evident mainly in the warm phase, when rainfall is above average. This influence is also observable during drought periods, with ∼70% of droughts developing in the negative PDO phase (Oñate-Valdivieso et al., 2020). The similar influence of PDO also occurs for the Niño 1 + 2 index. When Warm PDO and index are in phase, high rainfall is produced in the coast of Ecuador, meanwhile drought are expected during opposite conditions (Campozano et al., 2020).
The QIC’s moisture source is mainly the tropical Atlantic via the Amazon basin (Thompson et al., 2013), but during the positive PDO phase, westerly flow is enhanced (Vuille et al., 2003) over central South America. As dry seasons, this westerly flow can facilitate dust transport from the Altiplano to the QIC region, promoting an increase in the amount of dust recorded during warm PDO periods. In addition, recent studies have documented abnormal precipitation over Peruvian regions caused by Pacific Ocean oscillations when PDO and ENSO are in their positive phases (Kayano and Andreoli, 2007; Rodríguez-Morata et al., 2019; Mohammadi et al., 2020; Vaheddoost, 2020) which could favor increases in FPP relative to other groups due to turbulent mixing or wet deposition. This direct association of the PDO index (Figure 5) with dust concentration was corroborated by significant correlations at the 95% level, such as %FPP (r = 0.66, p-value < 0.01) and %CPP (r = −0.57, p-value < 0.05) from 2003 to 2017. The relative higher FPP concentration observed during moderate El-Niño in 2009 (Figure 5) is not representative for an effective increase of fine particles in size distribution as observed (Figure 4). In addition, it is not observed an importance decrease in FPP during La-Niña during the period. This implies that FPP increase or decrease is more related to the PDO influence than ENSO occurrences for the period studied but such influence is not discard in long record for this group.
Madeira River Dynamic and Connections to QIC
The precipitation (snow) occurrences in the Andes primarily originate over the Atlantic Ocean and undergoes recycling due to convective precipitation and evapotranspiration over the Amazon (Grootes et al., 1989). Previous study showed that coherent isotopic profiles from four Andean glaciers (including Quelccaya) appear to relate to precipitation variability over the Amazon basin (Hoffmann et al., 2003). Exploring the relationships during the wet season, we clearly notes a highly connection during mainly January month (Figure 6A). The high correlation between precipitation and snow accumulation at QIC during January (r = 0.75, p-value < 0.01) depicts a potential link of the hotspots occurrences in the Upper part of tributaries rivers (Espinoza et al., 2019b) and snow. However, a low correlation occurs during February months over the period analyzed.
Glaciers in the tropical Andes are the headwaters for the Amazon rivers and examinate changes in their record can be helpful to understand environmental process changes in the Amazon context. In order to explore the connection between Madeira basin and QIC, we investigated the relationship snow accumulation during transition season September-November (SON) at QIC and runoff at Porto Velho station during November-January (NDJ, Figure 6B) over 2003-2016 period. A time-lag of 60 days between precipitation and runoff is estimed as more appropriate to general dynamic in this part of the Amazon context by (Espinoza et al., 2019b). The results indicate that the runoff dynamic coincides with the high and low snow accumulation values at QIC (r = 0.67, p-value < 0.05), when the precipitation (northern part) majority contributes to water discharge dynamic at Porto Velho station. These results provide information about similar dynamic variability of snow accumulation and runoff during the transitional period. Also indicates that the similar time-lag estimated between the precipitation of northern part basin and runoff during initial wet season is also validated for this relationship.
The average sediment production of the Andean stretch of the Upper Madeira was estimated at 640 Mtyear−1 (2002–2011 (Vauchel et al., 2017)). In the Amazon context, the recent observations point out that temporal rainfall variability is well related to the fine suspended sediment (Armijos et al., 2020). The Beni River provides nearly 80% of suspended sediment at Porto Velho, primarily originated from the Beni River itself (47%), secondly from its main tributary (32%) the Madre de Dios River (Vauchel et al., 2017). In the Upper Madeira Basin, the suspended sediment concentration in recent years revealed a concentration decrease attributed to the depletion of suspended sediments from the Beni River (Ayes Rivera et al., 2019). The sediment yield in Bolivia (the main source of Beni and Madeira river suspended sediments) is directly controlled by climate variability with precipitation seasonality (present in the outer tropics) as the principal factor in high denudation rates (Pepin et al., 2013). In addition, suspended sediments depletions during December wet season recently was attributed to the reduction of rainfall in the Madre de Dios sub-basin since October, whereas during subsequent months were associated to a rainfall magnitude increase in the Andean region after 2008. These results indicates the importance of the processes upstream in the Andean part of the basin (Ayes Rivera et al., 2021).
We investigated the relationship during 2003–2016 between FPP dust concentration during wet seasons period and the suspended sediments concentrations (Figure 6C). Our findings present that the dust at QIC and Madeira river suspended sediments load is well related during the high-water discharge months (February-April, FMA) when northern part is more influent in the Madeira River than low-water discharge (dry and transitional seasons). In spite of the inverse tendency, our results show that the relationship dust wet seasons and suspended sediments load (tons/months) present similarity in dynamic variability during the wet season. Due to direct association of suspended sediments and precipitation (Armijos et al., 2020), clearly, the suspended sediment concentration decreases over the years is influenced by the precipitation decrease in the southern part of Madeira basin. The fine dust and suspended sediments present strong correlation (r = −0.74, p-value < 0.005), while total dust and CPP dust group present a moderate correlation (r = −0.60, p-value < 0.05) and (r = −0.70, p-value < 0.01), respectively. The GPP group did not show relations with suspended sediment concentrations during November-January, December-February and February-April periods. Although dry-days increases (in the south 14°) can affect directly the runoff and suspended sediments concentration, the influence of hotspot rainfalls in the northern part also contributes to record at Porto Velho station, which shows the complexity of record variability and link of the Andes-Amazon connection.
Our findings presents that dust concentration (fine group mainly) present sensible differences during PDO phase alteration, which involves drier conditions during positive phase. The PDO/ENSO controls the atmospheric pressure over the Andes-Amazon, which tends to block the precipitation from east over the eastern Andes during warm periods (Hoffmann et al., 2003; Hurley et al., 2015). During this phase, our hypothesis suggests that westerly wind intensifies the regional transport of dust based on fine particles content increase, since drier conditions over the Altiplano leads to higher dust availability (Lindau et al., 2021). Indirectly, the Amazon precipitation and riverine suspended sediments load are under control by these atmospheric oscillations.
We developed a model of these connections (Figure 7) indicating three phases relationships. First, the PDO/ENSO controls the atmospheric conditions over Andes–Amazon region. This controls the precipitation (snow) influencing the snow accumulation and dust content over the Andes. In addition, the precipitation variability influences indirectly the suspended sediment load and discharge over the river. Second, the tropical glacier accumulation (ice-core) where is the headwater for the tributaries rivers. Three, the gauge station where it is possible evaluate the discharge and suspended sediment concentrations. From the second to the third phase, a time-lag considered is the suggested for the Amazon context (Espinoza et al., 2019b). The physical mechanism that controls the variability of precipitation presented in the model depends on the atmospheric pressure conditions over the Andes- Amazon region.
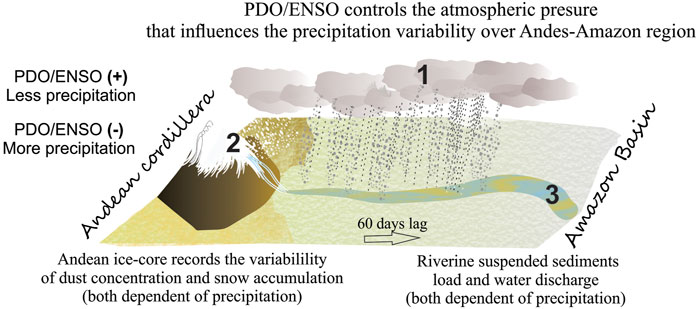
FIGURE 7. A representative model showing the relationships in the three stages between QIC and Madeira river. The stage one indicates precipitation (rainfall/snow), the stage two the ice core record, stage three the gauge station. The 60 days time-lag represents the delay between QIC record and Madeira River suspended sediments load.
We suggest that fine particles is more reliable group to represent the dynamic variability related to suspended sediment riverine due to dynamic observed with snow accumulation in recent record at QIC. Still, further investigations using a long-period record are necessary to improve knowledge about these relationships between snow accumulation and runoff during high-water discharge and QIC dust grouping and suspended sediments load over the year.
Conclusion
We investigated a shallow ice-core (22.7 m) recovered from the QIC in 2018 and found that seasonal signals were preserved even after seasonal surface melting. There was an increase in total dust content during the 21st century, coinciding with a warm PDO phase and the dominance of FPP from 2013 to 2017. The PDO index is well related with FPP (r = 0.70, p < 0.005) at the 95% level from 2003 to 2017. The dominance inversion occurs during the highest snow accumulation year and during the subsequent years of positive phase of Pacific index. In the positive phase, previous studies indicate that PDO and eastern pacific index induces strong westerly winds, inhibiting easterly air flow and facilitating dust transport from the high Altiplano. This condition could facilitate the fine dust content increase during less accumulation year. The CPP and GPP dust groups were dominant during the mainly cold PDO phase (2003–2012) and TNA warm phase. Potentially, under these two phases (TNA-positive and PDO-negative), the dominant groups are dust particles >10 μm. These observations need to be explored using a dust grouping record in long period.
This study provides a potential link between dynamic of QIC records via snow accumulation and dust content with the Madeira River via precipitation, suspended sediment concentration and runoff data. The precipitation in the Madeira basin and snow accumulation at QIC relationship, we verify a highly connection during January month (wet season). The snow accumulation and runoff we note a better relationship considering 60 days time–lag (similar to northern part of upper Madeira basin). Our findings observed that the snow accumulation during SON season presents similar dynamic with runoff NDJ at Porto Velho station during the transitional season. The similar behavior implies SON snow accumulation is indicative of tributaries discharge variability for the Madeira basin during this period of year. This relationship is helpful to examinate about dynamic of melt water variability and effects in the drainage in the headwater basin during the rest of year.
We observed inverse tendency of the dust content during wet season at QIC and decreasing suspended sediment concentration at the Porto Velho station during high-water discharge (February-April). Our findings present the negative correlation between FPP and suspended sediment (r = −0.74, p-value <0.005) at the 95% level from 2003 to 2016. We understand that this group is more reliable for this connection due to wetter condition mechanism for the record along suspended sediments load and precipitation association in the Amazon context.
In conclusion, examining distinct particle-size groups in the QIC dust record can improve our understanding of how the Pacific ocean influence dust particle variability in this region. We determined the dynamic similarities between dust content variability, snow accumulation, suspended sediment concentration, precipitation and runoff for the Madeira River, demonstrating the potential for future investigations of the relationship between QIC dust content and Amazon Basin Rivers in a long period record.
Data Availability Statement
The original contributions presented in the study are included in the article/Supplementary Material, further inquiries can be directed to the corresponding author.
Author Contributions
RR, RdaR, ND and JS wrote the original manuscript. RR, RdaR, JS and BD designed the research. JS and PM designed and led the drilling campaign. RR and BD conducted dust analyses. ER, PM, and BD advice on data collection and interpretation and provided comments to the original manuscript.
Funding
The 2018 international fieldwork in the Quellcaya Ice Cap was a joint operation organized by the Centro Polar e Climático (UFRGS/Brazil) and Climate Change Institute (UMaine/ME, United States), supported by the US National Science Foundation P2C2 1600018 and Appalachian State University (Boone, NC, United States) in collaboration with the Instituto Nacional de Investigación en Glaciares y Ecosistemas de Montaña (INAIGEM, Peru), and the Universidad Nacional de San Antonio Abad del Cusco (Peru). This research was supported by the Brazilian National Council for Scientific and Technological Development—CNPq (Process 465680/2014-3—INCT da Criosfera).
Conflict of Interest
The authors declare that the research was conducted in the absence of any commercial or financial relationships that could be construed as a potential conflict of interest.
Publisher’s Note
All claims expressed in this article are solely those of the authors and do not necessarily represent those of their affiliated organizations, or those of the publisher, the editors and the reviewers. Any product that may be evaluated in this article, or claim that may be made by its manufacturer, is not guaranteed or endorsed by the publisher.
Acknowledgments
RR thanks CNPq for his scholarship (Process 141081/2018-0).
Supplementary Material
The Supplementary Material for this article can be found online at: https://www.frontiersin.org/articles/10.3389/fenvs.2022.840884/full#supplementary-material
References
Ansmann, A. (2005). Ice Formation in Saharan Dust over central Europe Observed with Temperature/humidity/aerosol Raman Lidar. J. Geophys. Res. 110, D18S12. doi:10.1029/2004JD005000
Armijos, E., Crave, A., Espinoza, J. C., Filizola, N., Espinoza-Villar, R., Ayes, I., et al. (2020). Rainfall Control on Amazon Sediment Flux: Synthesis from 20 Years of Monitoring. Environ. Res. Commun. 2, 051008. doi:10.1088/2515-7620/ab9003
Ayes Rivera, I., Armijos Cardenas, E., Espinoza-Villar, R., Espinoza, J., Molina-Carpio, J., Ayala, J., et al. (2019). Decline of Fine Suspended Sediments in the Madeira River Basin (2003-2017). Water 11, 514. doi:10.3390/w11030514
Ayes Rivera, I. E., Molina-Carpio, J., Espinoza, J. C., Gutierrez-Cori, O., Cerón, W. L., Frappart, F., et al. (2021). The Role of the Rainfall Variability in the Decline of the Surface Suspended Sediment in the Upper Madeira Basin (2003-2017). Front. Water, 116. doi:10.3389/frwa.2021.738527
Campozano, L., Robaina, L., and Samaniego, E. (2020). The Pacific Decadal Oscillation Modulates the Relation of ENSO with the Rainfall Variability in Coast of Ecuador. Int. J. Climatol. 40, 5801–5812. doi:10.1002/joc.6525
Carslaw, K. S., Boucher, O., Spracklen, D. V., Mann, G. W., Rae, J. G. L., Woodward, S., et al. (2010). A Review of Natural Aerosol Interactions and Feedbacks within the Earth System. Atmos. Chem. Phys. 10, 1701–1737. doi:10.5194/acp-10-1701-2010
Carvalho, N. de. O., Filizola, N., Santos, P. M. C., and Lima, J. (2000). Sedimentometric Pratices Guide. Brasilia, Brazil.
da Rocha Ribeiro, R., Simões, J. C., Ramirez, E., Taupin, J.-D., Assayag, E., and Dani, N. (2018). Accumulation Rate in a Tropical Andean Glacier as a Proxy for Northern Amazon Precipitation. Theor. Appl. Climatol. 132, 569–578. doi:10.1007/s00704-017-2108-7
Delmonte, B., Paleari, C. I., Andò, S., Garzanti, E., Andersson, P. S., Petit, J. R., et al. (2017). Causes of Dust Size Variability in central East Antarctica (Dome B): Atmospheric Transport from Expanded South American Sources during Marine Isotope Stage 2. Quat. Sci. Rev. 168, 55–68. doi:10.1016/j.quascirev.2017.05.009
Delmonte, B., Petit, J. R., Andersen, K. K., Basile-Doelsch, I., Maggi, V., and Ya Lipenkov, V. (2004). Dust Size Evidence for Opposite Regional Atmospheric Circulation Changes over East Antarctica during the Last Climatic Transition. Clim. Dyn. 23, 427–438. doi:10.1007/s00382-004-0450-9
Delmonte, B., Petit, J. R., and Maggi, V. (2002). LGM-holocene Changes and Holocene Millennial-Scale Oscillations of Dust Particles in the EPICA Dome C Ice Core, East Antarctica. Ann. Glaciol. 35, 306–312. doi:10.3189/172756402781816843
Di Biagio, C., Balkanski, Y., Albani, S., Boucher, O., and Formenti, P. (2020). Direct Radiative Effect by Mineral Dust Aerosols Constrained by New Microphysical and Spectral Optical Data. Geophys. Res. Lett. 47, 1–12. doi:10.1029/2019GL086186
Enfield, D. B., Mestas-Nuñez, A. M., Mayer, D. A., and Cid-Serrano, L. (1999). How Ubiquitous Is the Dipole Relationship in Tropical Atlantic Sea Surface Temperatures? J. Geophys. Res. 104, 7841–7848. doi:10.1029/1998JC900109
Espinoza, J. C., Ronchail, J., Marengo, J. A., and Segura, H. (2019a). Contrasting North-South Changes in Amazon Wet-Day and Dry-Day Frequency and Related Atmospheric Features (1981-2017). Clim. Dyn. 52, 5413–5430. doi:10.1007/s00382-018-4462-2
Espinoza, J. C., Sörensson, A. A., Ronchail, J., Molina-Carpio, J., Segura, H., Gutierrez-Cori, O., et al. (2019b). Regional Hydro-Climatic Changes in the Southern Amazon Basin (Upper Madeira Basin) during the 1982-2017 Period. J. Hydrol. Reg. Stud. 26, 100637. doi:10.1016/j.ejrh.2019.100637
Espinoza Villar, J. C., Ronchail, J., Guyot, J. L., Cochonneau, G., Naziano, F., Lavado, W., et al. (2009). Spatio-temporal Rainfall Variability in the Amazon basin Countries (Brazil, Peru, Bolivia, Colombia, and Ecuador). Int. J. Climatol. 29, 1574–1594. doi:10.1002/joc.1791
Filizola, N., and Guyot, J. L. (2011). Fluxo de sedimentos em suspensão nos rios da Amazônia. Rbg 41, 566–576. doi:10.25249/0375-7536.2011414566576
Fritz, S. C., Brinson, B. E., Billups, W. E., and Thompson, L. G. (2015). Diatoms at >5000 Meters in the Quelccaya Summit Dome Glacier, Peru. Arctic, Antarctic, Alpine Res. 47, 369–374. doi:10.1657/AAAR0014-075
Garreaud, R., and Aceituno, P. (2001). Interannual Rainfall Variability over the South American Altiplano. J. Clim. 14, 2779–2789. doi:10.1175/1520-0442(2001)014<2779:irvots>2.0.co;2
Garreaud, R. D. (2009). The Andes Climate and Weather. Adv. Geosci. 22, 3–11. doi:10.5194/adgeo-22-3-2009
Grootes, P. M., Stuiver, M., Thompson, L. G., and Mosley-Thompson, E. (1989). Oxygen Isotope Changes in Tropical Ice, Quelccaya, Peru. J. Geophys. Res. 94, 1187. doi:10.1029/JD094iD01p01187
Guevara-Guillén, C., Shirasago-Germán, B., and Pérez-Lezama, E. L. (2015). The Influence of Large-Scale Phenomena on La Paz Bay Hydrographic Variability. Ojms 05, 146–157. doi:10.4236/ojms.2015.51012
Hanshaw, M. N., and Bookhagen, B. (2014). Glacial Areas, lake Areas, and Snow Lines from 1975 to 2012: Status of the Cordillera Vilcanota, Including the Quelccaya Ice Cap, Northern central Andes, Peru. The Cryosphere 8, 359–376. doi:10.5194/tc-8-359-2014
Hoffmann, G., Ramirez, E., Taupin, J. D., Francou, B., Ribstein, P., Delmas, R., et al. (2003). Coherent Isotope History of Andean Ice Cores over the Last century. Geophys. Res. Lett. 30, 1–4. doi:10.1029/2002GL014870
Hurley, J. V., Vuille, M., Hardy, D. R., Burns, S. J., and Thompson, L. G. (2015). Cold Air Incursions, δ 18 O Variability, and Monsoon Dynamics Associated with Snow Days at Quelccaya Ice Cap, Peru. J. Geophys. Res. Atmos. 120, 7467–7487. doi:10.1002/2015JD023323
Hurley, J. V., Vuille, M., and Hardy, D. R. (2019). On the Interpretation of the ENSO Signal Embedded in the Stable Isotopic Composition of Quelccaya Ice Cap, Peru. J. Geophys. Res. Atmos. 124, 131–145. doi:10.1029/2018JD029064
Jickells, T. D., An, Z. S., Andersen, K. K., Baker, A. R., Bergametti, G., Brooks, N., et al. (2005). Global Iron Connections between Desert Dust, Ocean Biogeochemistry, and Climate. Science 308, 67–71. doi:10.1126/science.1105959
Kaser, G. (1999). A Review of the Modern Fluctuations of Tropical Glaciers. Glob. Planet. Change 22, 93–103. doi:10.1016/S0921-8181(99)00028-4
Kaser, G. (2001). Glacier-climate Interaction at Low Latitudes. J. Glaciol. 47, 195–204. doi:10.3189/172756501781832296
Kayano, M. T., and Andreoli, R. V. (2007). Relations of South American Summer Rainfall Interannual Variations with the Pacific Decadal Oscillation. Int. J. Climatol. 27, 531–540. doi:10.1002/joc.1417
Kok, J. F., Ridley, D. A., Zhou, Q., Miller, R. L., Zhao, C., Heald, C. L., et al. (2017). Smaller Desert Dust Cooling Effect Estimated from Analysis of Dust Size and Abundance. Nat. Geosci 10, 274–278. doi:10.1038/ngeo2912
Kozhikkodan Veettil, B., and de Souza, S. F. (2017). Study of 40-year Glacier Retreat in the Northern Region of the Cordillera Vilcanota, Peru, Using Satellite Images: Preliminary Results. Remote Sensing Lett. 8, 78–85. doi:10.1080/2150704X.2016.1235811
Kutuzov, S., Legrand, M., Preunkert, S., Ginot, P., Mikhalenko, V., Shukurov, K., et al. (2019). The Elbrus (Caucasus, Russia) Ice Core Record - Part 2: History of Desert Dust Deposition. Atmos. Chem. Phys. 19, 14133–14148. doi:10.5194/acp-19-14133-2019
Li, F., Ginoux, P., and Ramaswamy, V. (2008). Distribution, Transport, and Deposition of mineral Dust in the Southern Ocean and Antarctica: Contribution of Major Sources. J. Geophys. Res. 113, 1–15. doi:10.1029/2007JD009190
Li, P., Wu, G., Zhang, X., Yan, N., and Zhang, X. (2019). Variation in Atmospheric Dust since 1950 from an Ice Core in the Central Tibetan Plateau and its Relationship to Atmospheric Circulation. Atmos. Res. 220, 10–19. doi:10.1016/j.atmosres.2018.12.030
Li, W., and Fu, R. (2006). Influence of Cold Air Intrusions on the Wet Season Onset over Amazonia. J. Clim. 19, 257–275. doi:10.1175/JCLI3614.1
Lindau, F. G. L., Simões, J. C., Delmonte, B., Ginot, P., Baccolo, G., Paleari, C. I., et al. (2021). Giant Dust Particles at Nevado Illimani: a Proxy of Summertime Deep Convection over the Bolivian Altiplano. The Cryosphere 15, 1383–1397. doi:10.5194/tc-15-1383-2021
Mantua, N. J., and Hare, S. R. (2002). The Pacific Decadal Oscillation. J. Oceanogr. 58, 35–44. doi:10.1023/A:1015820616384
Marengo, J. A., and Espinoza, J. C. (2016). Extreme Seasonal Droughts and Floods in Amazonia: Causes, Trends and Impacts. Int. J. Climatol. 36, 1033–1050. doi:10.1002/joc.4420
Marengo, J. A., Liebmann, B., Grimm, A. M., Misra, V., Silva Dias, P. L., Cavalcanti, I. F. A., et al. (2012). Recent Developments on the South American Monsoon System. Int. J. Climatol. 32, 1–21. doi:10.1002/joc.2254
McPhaden, M. J., Zebiak, S. E., and Glantz, M. H. (2006). ENSO as an Integrating Concept in Earth Science. Science 314, 1740–1745. doi:10.1126/science.1132588
Mohammadi, B., Vaheddoost, B., and Danandeh Mehr, A. (2020). A Spatiotemporal Teleconnection Study between Peruvian Precipitation and Oceanic Oscillations. Quat. Int. 565, 1–11. doi:10.1016/j.quaint.2020.09.042
Molina-Carpio, J., Espinoza, J. C., Vauchel, P., Ronchail, J., Gutierrez Caloir, B., Guyot, J.-L., et al. (2017). Hydroclimatology of the Upper Madeira River basin: Spatio-Temporal Variability and Trends. Hydrological Sci. J. 62, 911–927. doi:10.1080/02626667.2016.1267861
Oñate-Valdivieso, F., Uchuari, V., and Oñate-Paladines, A. (2020). Large-Scale Climate Variability Patterns and Drought: A Case of Study in South - America. Water Resour. Manage. 34, 2061–2079. doi:10.1007/s11269-020-02549-w
Pepin, E., Guyot, J. L., Armijos, E., Bazan, H., Fraizy, P., Moquet, J. S., et al. (2013). Climatic Control on Eastern Andean Denudation Rates (Central Cordillera from Ecuador to Bolivia). J. South Am. Earth Sci. 44, 85–93. doi:10.1016/j.jsames.2012.12.010
Perry, L. B., Seimon, A., Andrade-Flores, M. F., Endries, J. L., Yuter, S. E., Velarde, F., et al. (2017). Characteristics of Precipitating Storms in Glacierized Tropical Andean Cordilleras of Peru and Bolivia. Ann. Am. Assoc. Geogr. 107, 309–322. doi:10.1080/24694452.2016.1260439
Perry, L. B., Seimon, A., and Kelly, G. M. (2014). Precipitation Delivery in the Tropical High Andes of Southern Peru: New Findings and Paleoclimatic Implications. Int. J. Climatol. 34, 197–215. doi:10.1002/joc.3679
Rabatel, A., Francou, B., Soruco, A., Gomez, J., Cáceres, B., Ceballos, J. L., et al. (2013). Current State of Glaciers in the Tropical Andes: A Multi-century Perspective on Glacier Evolution and Climate Change. The Cryosphere 7, 81–102. doi:10.5194/tc-7-81-2013
Ramirez, E., Hoffmann, G., Taupin, J. D., Francou, B., Ribstein, P., Caillon, N., et al. (2003). A New Andean Deep Ice Core from Nevado Illimani (6350 M), Bolivia. Earth Planet. Sci. Lett. 212, 337–350. doi:10.1016/S0012-821X(03)00240-1
Rodríguez-Morata, C., Díaz, H. F., Ballesteros-Canovas, J. A., Rohrer, M., and Stoffel, M. (2019). The Anomalous 2017 Coastal El Niño Event in Peru. Clim. Dyn. 52, 5605–5622. doi:10.1007/s00382-018-4466-y
Ruth, U. (2002). Concentration and Size Distribution of Microparticles in the NGRIP Ice Core (Central Greenland) during the Last Glacial Period. Reports; Berichte zur Polar-und Meeresforsch. Available at: http://epic.awi.de/26607/1/BerPolarforsch2002428.pdf (Accessed June, 2021).
Sagredo, E. A., and Lowell, T. V. (2012). Climatology of Andean Glaciers: A Framework to Understand Glacier Response to Climate Change. Glob. Planet. Change 86-87, 101–109. doi:10.1016/j.gloplacha.2012.02.010
Salzmann, N., Huggel, C., Rohrer, M., Silverio, W., Mark, B. G., Burns, P., et al. (2013). Glacier Changes and Climate Trends Derived from Multiple Sources in the Data Scarce Cordillera Vilcanota Region, Southern Peruvian Andes. The Cryosphere 7, 103–118. doi:10.5194/tc-7-103-2013
Segura, H., Junquas, C., Espinoza, J. C., Vuille, M., Jauregui, Y. R., Rabatel, A., et al. (2019). New Insights into the Rainfall Variability in the Tropical Andes on Seasonal and Interannual Time Scales. Clim. Dyn. 53, 405–426. doi:10.1007/s00382-018-4590-8
Stevens, B., and Feingold, G. (2009). Untangling Aerosol Effects on Clouds and Precipitation in a Buffered System. Nature 461, 607–613. doi:10.1038/nature08281
Tapley, T. D., and Waylen, P. R. (1990). Spatial Variability of Annual Precipitation and ENSO Events in Western Peru. Hydrological Sci. J. 35, 429–446. doi:10.1080/02626669009492444
Tegen, I., and Fung, I. (1994). Modeling of mineral Dust in the Atmosphere: Sources, Transport, and Optical Thickness. J. Geophys. Res. 99, 22897. doi:10.1029/94jd01928
Thompson, L. G., Davis, M. E., Mosley‐Thompson, E., Beaudon, E., Porter, S. E., Kutuzov, S., et al. (2017). Impacts of Recent Warming and the 2015/2016 El Niño on Tropical Peruvian Ice Fields. J. Geophys. Res. Atmos. 122 (12), 688. doi:10.1002/2017JD026592
Thompson, L. G., Davis, M. E., Mosley-Thompson, E., and Liu, K.-b. (1988). Pre-Incan Agricultural Activity Recorded in Dust Layers in Two Tropical Ice Cores. Nature 336, 763–765. doi:10.1038/336763a0
Thompson, L. G. (2000). Ice Core Evidence for Climate Change in the Tropics: Implications for Our Future. Quat. Sci. Rev. 19, 19–35. doi:10.1016/S0277-3791(99)00052-9
Thompson, L. G., Mosley-Thompson, E., Bolzan, J. F., and Koci, B. R. (1985). A 1500-Year Record of Tropical Precipitation in Ice Cores from the Quelccaya Ice Cap, Peru. Science 229, 971–973. doi:10.1126/science.229.4717.971
Thompson, L. G., Mosley-Thompson, E., Dansgaard, W., and Grootes, P. M. (1986). The Little Ice Age as Recorded in the Stratigraphy of the Tropical Quelccaya Ice Cap. Science 234, 361–364. doi:10.1126/science.234.4774.361
Thompson, L. G., Mosley-Thompson, E., Davis, M. E., Zagorodnov, V. S., Howat, I. M., Mikhalenko, V. N., et al. (2013). Annually Resolved Ice Core Records of Tropical Climate Variability over the Past ∼1800 Years. Science 340, 945–950. doi:10.1126/science.1234210
Vaheddoost, B. (2020). A Spatiotemporal Classification of the Peruvian Precipitations between 1990 and 2015. Pure Appl. Geophys. 177, 4509–4520. doi:10.1007/s00024-020-02454-8
Vauchel, P., Santini, W., Guyot, J. L., Moquet, J. S., Martinez, J. M., Espinoza, J. C., et al. (2017). A Reassessment of the Suspended Sediment Load in the Madeira River basin from the Andes of Peru and Bolivia to the Amazon River in Brazil, Based on 10 Years of Data from the HYBAM Monitoring Programme. J. Hydrol. 553, 35–48. doi:10.1016/j.jhydrol.2017.07.018
Veettil, B. K., Bremer, U. F., de Souza, S. F., Maier, É. L. B., and Simões, J. C. (2016). Influence of ENSO and PDO on Mountain Glaciers in the Outer Tropics: Case Studies in Bolivia. Theor. Appl. Climatol. 125, 757–768. doi:10.1007/s00704-015-1545-4
Vera, C., Higgins, W., Amador, J., Ambrizzi, T., Garreaud, R., Gochis, D., et al. (2006). Toward a Unified View of the American Monsoon Systems. J. Clim. 19, 4977–5000. doi:10.1175/JCLI3896.1
Vuille, M., Bradley, R. S., Werner, M., Healy, R., and Keimig, F. (2003). Modeling δ18O in Precipitation Over the Tropical Americas: 1. Interannual Variability and Climatic Controls. J. Geophys. Res. 108 (D6). doi:10.1029/2001jd002039
Vuille, M., Bradley, R. S., and Keimig, F. (2000). Climate Variability in the Andes of Ecuador and its Relation to Tropical Pacific and Atlantic Sea Surface Temperature Anomalies. J. Clim. 13, 2520–2535. doi:10.1175/1520-0442(2000)013<2520:cvitao>2.0.co;2
Vuille, M., Francou, B., Wagnon, P., Juen, I., Kaser, G., Mark, B. G., et al. (2008). Climate Change and Tropical Andean Glaciers: Past, Present and Future. Earth-Science Rev. 89, 79–96. doi:10.1016/j.earscirev.2008.04.002
Vuille, M., Franquist, E., Garreaud, R., Lavado Casimiro, W. S., and Cáceres, B. (2015). Impact of the Global Warming Hiatus on Andean Temperature. J. Geophys. Res. Atmos. 120, 3745–3757. doi:10.1002/2015JD023126
Wegner, A., Fischer, H., Delmonte, B., Petit, J. R., Erhardt, T., Ruth, U., et al. (2015). The Role of Seasonality of mineral Dust Concentration and Size on Glacial/interglacial Dust Changes in the EPICA Dronning Maud Land Ice Core. J. Geophys. Res. Atmos. 120, 9916–9931. doi:10.1002/2015JD023608
Keywords: ice-core, quelccaya, dust, andes, Amazon
Citation: Reis RS, da Rocha Ribeiro R, Delmonte B, Ramirez E, Dani N, Mayewski PA and Simões JC (2022) The Recent Relationships Between Andean Ice-Core Dust Record and Madeira River Suspended Sediments on the Wet Season. Front. Environ. Sci. 10:840884. doi: 10.3389/fenvs.2022.840884
Received: 21 December 2021; Accepted: 16 March 2022;
Published: 05 April 2022.
Edited by:
Juan-Luis García, Pontificia Universidad Católica de Chile, ChileReviewed by:
Ana María Durán-Quesada, University of Costa Rica, Costa RicaJan Kavan, Masaryk University, Czechia
Copyright © 2022 Reis, da Rocha Ribeiro, Delmonte, Ramirez, Dani, Mayewski and Simões. This is an open-access article distributed under the terms of the Creative Commons Attribution License (CC BY). The use, distribution or reproduction in other forums is permitted, provided the original author(s) and the copyright owner(s) are credited and that the original publication in this journal is cited, in accordance with accepted academic practice. No use, distribution or reproduction is permitted which does not comply with these terms.
*Correspondence: Rafael S. dos Reis, sdosreis.rafael@gmail.com; Jefferson C. Simões, jefferson.simoes@ufrgs.br