Soil Use Legacy as Driving Factor for Soil Erosion under Conservation Agriculture
 Kathrin Grahmann
 Valentina Rubio3,4
  Mario Perez-Bidegain
- 1Leibniz Centre for Agricultural Landscape Research (ZALF), Resource-Efficient Cropping Systems, Research Area 2 “Land Use and Governance”, Müncheberg, Germany
- 2Leibniz Centre for Agricultural Landscape Research (ZALF), Data Dimensionality, Research Platform “Data Analysis & Simulation”, Müncheberg, Germany
- 3Instituto Nacional de Investigación Agropecuaria (INIA), Programa de Producción y Sustentabilidad Ambiental, Estación Experimental INIA La Estanzuela, Colonia, Uruguay
- 4Instituto Nacional de Investigación Agropecuaria (INIA), Programa de Cultivos de Secano, Estación Experimental INIA La Estanzuela, Colonia, Uruguay
- 5Universidad de la República, Facultad de Agronomía, Departamento de Suelos y Aguas, Montevideo, Uruguay
Water erosion can cause irreversible depletions in soil quality and crop productivity. The susceptibility of the soil to erosion is affected by current and historical management practices. Historical soil management practices like ploughing or subsoil loosening may lead to irreversible degradations of soils, which in turn increases soil erosion risk. Six “Wischmeier” plots under conservation agriculture, but with different historic treatments regarding soil use and management, were evaluated. These plots were installed in 1984 in Colonia del Sacramento, Uruguay on a Vertic Argiudoll. The objective of this study was to quantify how changes in soil quality, generated by different historical soil use and management over the last 35 years, contribute to current runoff and soil erosion in a cropping system under soil conservation practices using no-till, residue retention and cover crops. Considering differences in soil legacy effects of previous land use, plots were grouped in three treatments with contrasting historic index of agricultural intensification (IAI). The IAI was developed combining the duration of land use under agricultural production and the number and intensity of tillage activity resulting in the treatments: tillage with crop-pasture rotation (TIL_CP), no-tillage under several rotations (NT_Mix) and tillage with continuous cropping (TIL_CROP) with an increasing IAI of 3.5, 7.1 and 11.8, respectively. Rainfall events, runoff water and total, fixed and volatile solids were studied from 2017 to 2019. Soil physical (bulk density, penetration resistance, infiltration rate, aggregate stability), chemical (soil organic carbon (SOC), pH, phosphorous (P-Bray)) and biological properties (particulate organic matter (POM), potentially mineralizable nitrogen (PMN)) were assessed in 2019. Yearly average runoff amounted 209, 579 and 320 mm in 2017, 2018 and 2019, respectively. Yearly average soil losses were 233, 805 and 139 kg/ha with significant differences among years. The lowest soil losses were observed in TIL_CP (231, 615 and 146 kg/ha in 2017, 2018 and 2019, respectively) with lowest IAI of 3.5. Infiltration rate was the lowest in plots with highest IAI. Soil bulk density was highest (1.3 g/cm3) in plots with high IAI. SOC and PMN were lowest in TIL_CROP (3.0% SOC and 34 mg/kg PMN), holding the highest IAI of 11.8. Conservation agriculture minimized soil erosion losses in all plots and years, and erosion was much lower than the maximum tolerable threshold of 7,000 kg/ha for this particular soil. However, in historically intensively tilled and cropped soils, soil quality showed long-term adverse effects pointing towards a reduced resilience of the agricultural system.
Introduction
Soil erosion remains a major challenge worldwide, being the greatest threat for sustainable soil management and subsequent food production (Rickson et al., 2015). Soil erosion, its control and remediation practices are related to nine out of 15 sustainable development goals defined by the United Nations (FAO, 2019). This highlights the worldwide preoccupation about soil loss and its immediate and indirect consequences fueling the sustainability discussion. Changes in land use and cover generated by the disturbance of natural grasses are the main factor leading to accelerated soil erosion (Borrelli et al., 2017). In Uruguay, land use changes occurred since the early 2000s in form of agricultural intensification shifting towards continuous, annual cropping systems and simplified rotations which led to fresh water pollution and soil quality deterioration (Carrasco-Letelier and Beretta-Blanco, 2017; Ernst et al., 2018). Furthermore, Uruguay is affected by climate change, mainly shown by increasing precipitation rates and extreme weather events that directly alter water erosion risks (Munka et al., 2007; PNUD (Programa de las Naciones Unidas para el Desarrollo) Uruguay, 2007). The combination of deteriorated soils with more intense rainfall events increases the risk of soil erosion compromising soil and water quality.
Soil organic carbon (SOC) losses have been reported as a result of agricultural intensification increase in Uruguay (Beretta-Blanco et al., 2019; Grahmann et al., 2020) which could be related to incessant soil losses by erosion although soil conservation practices were implemented by law. SOC is the main determinant of aggregate stability of Mollisols (Novelli et al., 2013; Rubio et al., 2019), the most important agricultural soil type in Uruguay. Added to this, water erosion preferentially removes the light organic fraction of low density and therefore contributes to SOC pool depletion (Lal, 2003) and atmospheric CO2 emissions (Lal, 2019). Soil erosion is strongly coupled with other nutrients’ runoff like nitrogen (N) which has consequences for freshwater and marine ecosystems leading to contamination, algae growth and overall biodiversity decline (De Vries et al., 2013). The particulate organic matter (POM) and potentially mineralizable N (PMN) were found to be sensitive indicators to detect the vulnerability for water erosion and overall soil degradation (Wander et al., 1998; Fabrizzi et al., 2003). Other parameters to monitor soil quality decrease and nutrient losses via erosion are total, fixed and volatile suspended solids and the carbon (C) and N enrichment ratios of the transported sediments (Palis et al., 1990; Holz and Augustin, 2021).
Conservation agriculture with its three principles of minimum soil tillage, crop rotation and residue retention is an often reported management system to effectively reduce soil erosion (Ernst and Siri-Prieto, 2009; Willett et al., 2019). To minimize soil erosion, soil cover must be coupled with a stable soil structure. As the basic unit of soil structure, stable aggregates are key for soil quality, soil fertility, and resistance to degradation (Le Bissonnais, 1996). A stable soil structure is crucial for maintaining soil porosity, gas exchange, water infiltration, erosion resistance, and SOC sequestration (Six et al., 2004; Morris et al., 2019). A reduction in tillage intensity increases soil structural stability, improves aggregate distribution and enhances soil porosity and therefore infiltration, thus decreasing soil erodibility, improving soil fertility and improving overall agronomic productivity (Azooz and Arshad, 2011; Verhulst et al., 2011; Palm et al., 2014). Straw residues on the soil surface act like barriers that prevent the soil from receiving directly the high kinetic energy of raindrops during heavy rainfalls (Turtola et al., 2007), hence reducing surface soil dispersion and crust formation. In addition to this direct effect of residue retention on soil infiltration, conservation agricultural practices also contribute indirectly through improved structural stability, bulk density and pore structure (Kumar and Goh, 1999; Zhang et al., 2007; Ranaivoson et al., 2017).
Long-term experiments are important to understand how conservation agriculture modifies the dynamics in biochemical and geophysical processes over decades, which in consequence affect soil erodibility (Richter et al., 2007; Johnston and Poulton, 2018; Grahmann et al., 2020). As for surface runoff and erosion determination, surface runoff plots that count with a predefined, surrounded area and water collection tanks, so called “Wischmeier” plots are required (Kinnell, 2016). Experimental facilities of long-term surface runoff plots are used to document the effects of conservation agriculture on soil erosion providing a valuable, but seldom available experimental data set.
Since 2013, it is mandatory for Uruguayan farms larger than 50 ha to present a land use and management plan that ensures an estimated average soil erosion rate smaller than a previously defined soil-specific tolerance threshold (MGAP, 2013). The application of this law, which was updated lastly in 2018, aims to promote conservation agriculture practices reducing the risk of soil erosion in cropping systems based on the Revised Universal Soil Loss Equation (RUSLE) (Pérez-Bidegain et al., 2018; Zurbriggen et al., 2020). The RUSLE model was calibrated and validated for Uruguay and available in an adapted software tool (EROSION 6.0) (Renard et al., 1997; García Prechac et al., 2017; Pérez-Bidegain et al., 2017). Hereof, it is important to emphasize that the current K factors of the Uruguayan RUSLE, which indicates how susceptible a soil is to water detachment, was calculated by Puentes (1981) based on soil characteristics determined in a soil sampling campaign conducted in 1976 (MGAP-DSA, 1976).
While the use of simulation models to predict soil erosion has been widely applied in the country, the actual state of soil quality was not considered yet. As the supposedly stable K factor was defined in the 1980s and was calculated considering soil texture, total soil carbon content and two classification factors associated to soil structure and permeability, this might lead to an underestimation of erosion in today´s degraded soils and does not consider the dynamics of soil aggregate stability, the history of land use and the subsequent SOC losses at the regional scale (Alewell et al., 2019). The deterioration of soil properties caused by their past use and management, and particularly tillage, can have a great impact on erosion (Beniston et al., 2015) and has rarely been studied in a remediation context. Soil management practices, like deep ploughing or subsoil loosening lead to irreversible soil structure changes, which in turn affect soil quality over many decades (Schneider et al., 2017) and cause persistent soil legacy effects of previous land use. This may also account for the cover management factor (C factor), which is directly influenced by the vegetation type, growth stage of the vegetation and root mass, not only from a yearly perspective, but over a longer period of time (Gyssels et al., 2005; Panagos et al., 2015a). In the current study, the history of soil use and crop management intensity for each experimental unit was transformed to a newly developed index of agricultural intensification (IAI) combining the number of years under tillage activities and crop production with the length of agricultural production periods (intensification sequence index, Caviglia and Andrade, 2010; Martinez et al., 2020).
The objectives of this study were 1) to quantify surface runoff, soil and nutrient losses in a continuous cropping system under conservation agriculture implemented in long-term surface runoff plots and 2) to determine the variability in physical, chemical and hydraulic soil properties due to soil use and management history. We hypothesized that current conservation practices reduce soil losses to a minimum and assumed that differences in physical and chemical soil parameters between plots were existent and generated by differences in historical land use management which in turn explains the variability of soil losses between the plots nowadays. Furthermore, this paper provides starting points to discuss an update of the erodability factor K that might be affected by previous tillage and crop management through effects on SOC and soil structure.
Materials and Methods
Experimental Site
The study was conducted at INIA La Estanzuela, Uruguay (lat. 34°20′S, long 57°41′W, 66 m a.s.l.), in a soil classified as Vertic Argiudoll (USDA Soil Taxonomy; Soil Survey Staff, 2014). The site has a warm temperate climate with annual rainfall of 1,125 mm and an annual reference evapotranspiration of about 1,180 (± 143) mm over 55 years (Grahmann et al., 2020). Maximum monthly mean temperature ranges from 15°C in the winter to 28°C in the summer, and the minimum monthly mean temperature varies from 6°C in the winter to 17°C in the summer (Baethgen et al., 2021). Available water holding capacity was 92.7 mm in 0–56 cm depth for undisturbed soil (Hill et al., 2008). In 0–15 cm soil depth, the particle size fraction contains 178 g/kg sand, 450 g/kg silt, and 372 g/kg clay and soil organic carbon (SOC) averaged 2.93% (± 0.09) in 0–7.5 cm soil depth for the experimental site in 2019.
Long-Term Wischmeier Plots
The long-term experiment was installed in 1984 when six Wischmeier runoff plots were built with a size of 22.1 m length and 3.5 m width along an agricultural field´s slope side. The difference in height between top and bottom end of each plot was measured by means of an automatic level and level staff in 2020, and the resulting slope ranged between 4.3 and 4.7%. Each plot was completely surrounded by a metal border of 10 cm height of which 5 cm were inserted into the soil. The lower side ended up in a funnel system which transported the runoff water to a first cement tank of 750 L capacity embedded in the soil. During extreme rainfall events, the overflow system led through a fractionator, with one seventh (1/7) of water passing to a second tank of 1000 L capacity. The total runoff water storage capacity captured up to 100 mm runoff events in each plot.
A schematic overview of the historical treatments and land use changes for each experimental period and plot can be found in Figure 1. Since the beginning of the experiment, four experimental periods were distinguished. In the first experimental period (1984–1997), half of the plots were managed with conventional tillage using a chisel plough to 10–15 cm soil depth. Additionally, two different crop rotations were investigated: continuous cropping and crop-pasture rotations. The treatments were randomly distributed. The data of this experimental period were used to validate the USLE model for contrasting soil use systems (García-Préchac, 1992). Between 1998 and 2008, the experiment was discontinued due to financial constraints, leaving the plots without any use under perennial grass cover. Since 2008, the second experimental period, four of the plots were recovered to test a soybean (Glycine max)-fallow rotation under no-till management focusing on the assessment of the environmental impact of agrochemicals. In the third experimental period, cover crops rotating with soybean were incorporated in half of the plots from 2012 to 2014 and the research focus was set on phosphorus runoff (Lizarralde et al., 2015). In the fourth experimental period which started in 2015, two more plots were taken into operation with continuous crop rotation of soybean – cover crop (Black oats (Avena strigosa))—soybean – cover crop (Ryegrass (Lolium multiflorum))—soybean – fallow – maize (Zea mays)—wheat (Triticum aestivum L.)—soybean – cover crop (Rye (Secale cereale) and vetch (Vicia villosa))—soybean. Since 2015, all six plots were used and managed uniformly (“uniformity trial”) with best soil conservation practices using no-till, residue retention and cover crops.
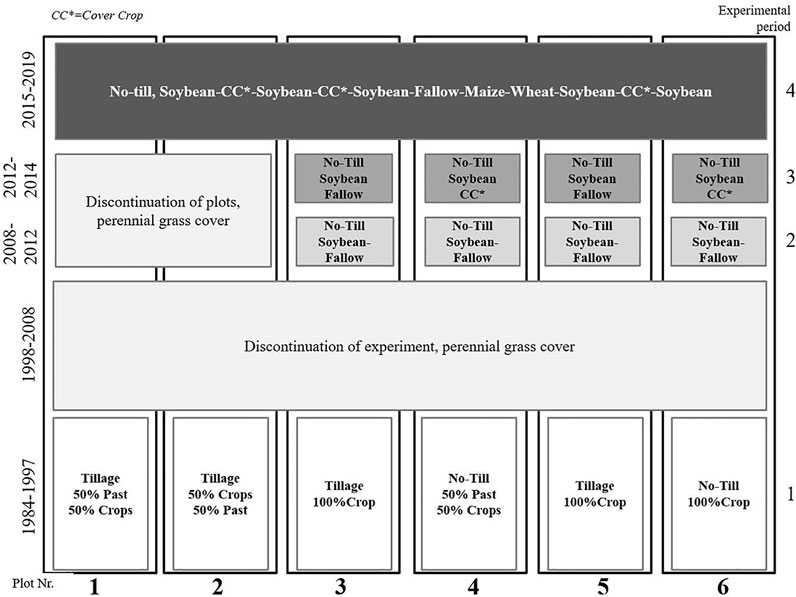
FIGURE 1. Experimental design of the Wischmeier plots and their history of soil use and management since the experimental onset in 1984.
Sowing and harvest operations were conducted with experimental agricultural machinery, pesticide applications were conducted manually according to best management practice. The cover crop mix of rye and hairy vetch was sown in May 2019 and roller-crimped in November 2019, while the previous cover crops were terminated with glyphosate. Fertilizer application in form of solid urea and diammonium phosphate during the last six study years was identical in each of the plots and was applied according to previous soil tests (Table 1).
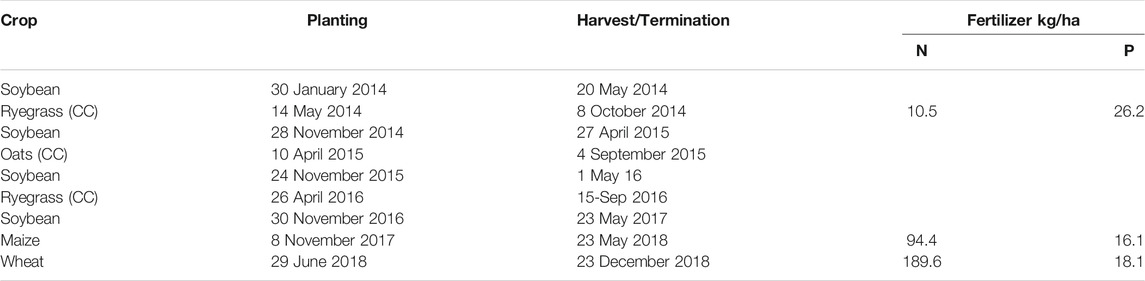
TABLE 1. Planting and harvest dates and average fertilizer rates per year and crop since uniform management started in 2014 (CC: cover crop).
Index of Agricultural Intensification
Information regarding crop rotation and tillage intensity for each plot since 1984 were used to estimate an index of agricultural intensification (IAI), a way of classified scoring for historical soil use intensity. The IAI is estimated as the product of two indices, one accounting for cropping sequence intensification (ISI) and the second one for tillage intensification (ITI). Land use intensity is estimated using the index of sequence intensification (ISI) and is calculated on a yearly basis to account for the number of crops with active plant growth during the study period (Caviglia and Andrade, 2010; Novelli et al., 2013). The index enlarges with an increasing number of crops planted per year. To account for the reported beneficial effects on soil quality and structure through pasture incorporation into crop rotation (Studdert et al., 1997; Ernst et al., 2018), a coefficient of 0.5 was applied during the first experimental phase to the cropping sequence length when pastures were included (Wischmeier and Smith, 1978).
Tillage intensity was evaluated using a specifically developed index of tillage intensification (ITI). This index evaluates the total number of tillage events and weights them based on the C tillage factors provided by Panagos et al. (2015b). A weighting factor of 1 was applied to conventional tillage (conform to the C factor for tilled bare soil in the RUSLE, Renard et al., 1997); 0.25 for no-till and 0.01 for broadcast sowing of cover crops by hand causing minimal soil disturbance.
The IAI was calculated for each of the four experimental periods and accounted for fallow time when certain plots were discontinued (Table 2). The discontinuation period of all plots between 1998 and 2008 was not included in the IAI determination. The second and fourth experimental phases have identical IAI for all plots as they were managed uniformly over the respective periods. Table 2 demonstrates that the ISI had a higher weight than the ITI due to intensive cropping with up to two crops per year. To strengthen index interactions and its hazard effects on soil quality, ISI and ITI were multiplied (IAI, Table 2) as undertaken in the Soil Quality Rating (SQR) procedures presented by Mueller et al. (2007). Otherwise using sums, NT_Mix and TIL_CROP would have led to a similar IAI, although their soil use history was disparate. Especially during the first experimental period between 1984 and 1997, IAI differed between plots with lowest IAI in plot 4 and 6 and highest in plot 3 and 5.
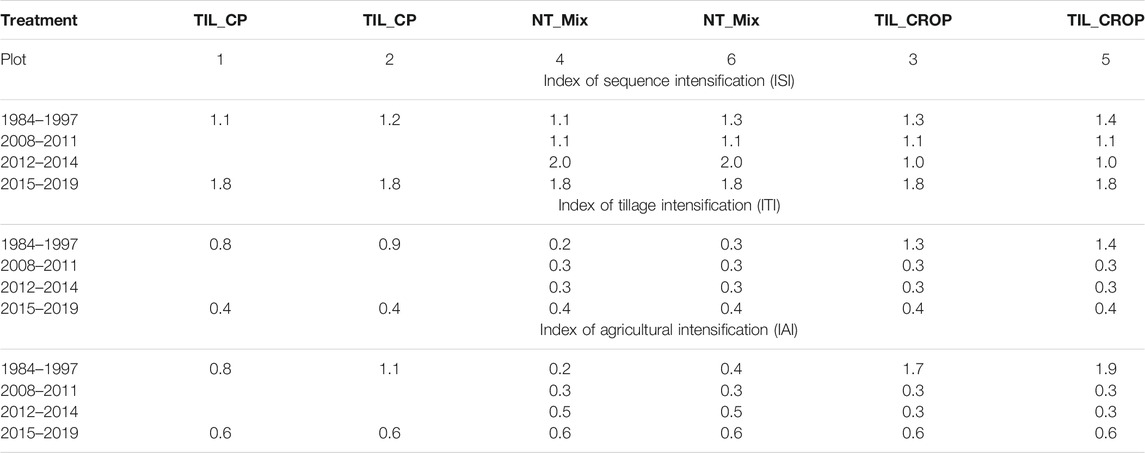
TABLE 2. Land use history expressed as index of agricultural intensification per plot and experimental period (ISI: index of sequence intensification, ITI: index of tillage intensification, IAI: index of agricultural intensification).
Due to the limited number of long-term Wischmeier plots, two plots with similar land use history and IAI were grouped into three treatment groups (Table 3). The no-till treatment group NT_Mix had differences in historical cropping intensity with crop-pasture rotation in plot 4 and continuous cropping in plot 6.
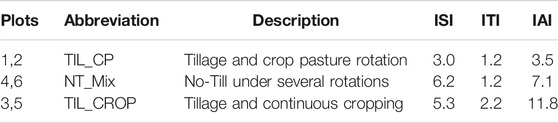
TABLE 3. Treatment groups according to their multiplier IAI criteria based on the summed experimental period averages of the index of sequence intensification (ISI) and the index of tillage intensification (ITI).
Continuous Measurements
Daily and 10 min record precipitation data were provided by the Research Unit of Climate and Geographic Systems, GRAS, INIA, Uruguay to calculate rainfall intensity parameters during 2017–2019 (available at http://www.inia.uy/gras). Meteorological data were obtained from an automated weather station (Campbell Scientific, Inc, Logan, UT, United States) equipped with pluviograph and pluviometer located approximately 700 m from the experimental site. According to Sasal et al. (2010), daily rainfall events were classified into three groups: small (< 40 mm), intermediate (41–69 mm) and large (>70 mm). After each rainfall event, the amount of precipitation and the volume of runoff water per plot were recorded. The water height in the tank was recorded and the volume of runoff water was calculated using previously calibrated conversion factors for each tank and plot. The calibration was carried out yearly, filling the tanks with a rising, precise amount of water and simultaneously recording the water table height in each of the six tanks. The runoff coefficient was determined for each rainfall event as the ratio of runoff per rainfall.
Historical data on water runoff, sediment losses, and SOC were continuously measured since the installation in 1984 and available for the present study. Between 2017 and 2019, water samples were taken after each runoff event to evaluate the amount of fixed (mineral material), volatile (organic material) and total suspended solids with the gravimetric method Nr. 2540 of the American Public Health Association (APHA et al., 2012). For this, the runoff water was homogenized in the tank and a maximum 1,000 ml water sample was taken; for small rainfall events, a smaller sample proportion was available. In the laboratory, 100 ml sample were added to previously washed and dried glass microfiber filters <0,2 µm (934-AH Whatman™; Little Chalfont, United Kingdom) using a Büchner funnel and a vacuum pump with an adjusted pressure between 10 and 20 mbar. Total solids were determined by drying the filter at 105°C for 4 h and weighed afterwards with an analytical precision balance. In a subsequent step, the same filter was incinerated at 550°C for 2 h, and after cooling to room temperature, weighed a second time to determine fixed suspended solids. Volatile suspended solids were calculated as the difference between total and fixed solids. Method quality of each batch was controlled by using a total of three control samples of a 25 and 100 mg/L kaolin solution and distilled water blanks.
For the soil loss (ERO) calculations on a hectare basis per runoff event, the following equation was used.
where TSS is the amount of total suspended solids in mg per liter, RUN is the total amount of water in the tank in liter and A is the Wischmeier plot area in m2.
In four occasions of high runoff water collection during spring 2019 (9th of September, 2nd of October, 11th of October, 13th of October), sediments were collected through 10 L runoff samples and water evaporated gently over 48 h at 50°C. Sediment samples were subsequently analyzed for total carbon (C) and Ntot by LECO. Data were used to calculate the sediment nutrient enrichment for C and N as the ratio of nutrient concentration in eroded sediment to that of soil samples taken in October 2019 in 0–7.5 cm soil depth (Palis et al., 1990).
Crop yield was determined manually for two subsamples per plot, cutting two crop rows per 4 linear meters.
Soil Measurements
Field Sampling
Historical sampling campaigns for SOC were carried out with a soil auger taking one composite sample per plot in 0–20 cm soil depth in the years 1984, 1986, 1987, 1989–1996, and in 0–15 cm soil depth in the years 2011, 2014–2016.
On 27th of December 2018, all plots were sampled for one composite soil sample at three depths (0–7.5, 7.5–15, 15–30 cm) and on 25th of October 2019, all plots were sampled for two composite samples at five depths (0–7.5, 7.5–15, 15–30, 30–45, 45–60 cm).
Soil Chemical Analysis
SOC and total N (Ntot) were analyzed by dry combustion at 900°C followed by infrared detection (LECO Truespec; Wright and Bailey (2001). Before 2011, SOC samples were analyzed with the Tinsley method (heated dichromate/titration), therefore SOC values obtained since 2011 were converted using a previous determined factor of 0.81 (Grahmann et al., Forthcoming 2022; in press).
Soil pH was determined potentiometrically (1:2.5 soil/distilled water suspension; Beretta-Blanco et al., 2014). Phosphorus was measured colorimetrically by the Bray-1 method using a 1:10 (w/v) soil/solution ratio and an extraction time of 5 min (Bray and Kurzt, 1945). Cation exchange capacity was analyzed by extracting the exchangeable cations Ca, Na, Mg and K with 1 M ammonium acetate (NH4OAc) at pH 7, and reading the extract by atomic emission (K and Na) according to Jackson (1964) and atomic absorption (Ca and Mg) or by atomic emission with ICP-OES equipment.
Soil Physical Properties
Undisturbed soil samples were taken for the determination of bulk density in December 2018 and December 2019 for two depth increments (0–7.5, 7.5–15 cm). Three sites located at the upper, middle and lower part of each plot were selected. Samples were taken using a soil probe with a cylinder volume of 98.2 cm³ and samples dried for 48 h at 105°C. Penetration resistance was measured from 0 to 80 cm soil depth with a hand held Penetrologger (Eijelkamp, Giesbeek, Netherlands, cone base area 1 cm2) at 4 days (13th of September, 19th of September, 30th of October and 23rd of December) in 2019. Resistance measurements were executed according to the manufacturer’s instructions by applying the electronic penetrometer together with a datalogger, allowing for immediate storage and processing of the data in the datalogger. In parallel, soil moisture was measured volumetrically in 6 cm soil depth.
Three soil blocks were sampled in April 2019 in the upper, middle and lower part of each plot (15 cm × 15 cm × 20 cm). From those samples, a visual evaluation of soil structure (VESS) was conducted in the field as described by Guimarães et al. (2011). The samples were then air dried for the determination of four indicators of aggregate stability in the laboratory. The stability of aggregates to quantify the main processes of aggregate breakdown associated with water stress were assessed as proposed by Le Bissonnais (1996). This methodology evaluates three mechanisms of aggregate breakdown: 1) Aggregate slaking due to fast wetting (Treatment 1); 2) Differential swelling (Treatment 2) and 3) Mechanic breakdown (Treatment 3). Three 5 g samples of 3–5 mm aggregates were taken for the determination of aggregate stability for each of the treatments. For treatment 1, the aggregates were immersed in 250 ml of distilled water for 10 min. For treatment 2, the aggregates were capillary rewetted on a tension table at 3 cm tension for 30 min before their immersion in water. For treatment 3, the aggregates were rewetterd in ethanol, then immersed in water (to avoid fast wettering) and mechanically agitated 10 times using a Feodoroff agitator. Each one of these treatment samples was gently transferred to a 50 μm sieve, previously immersed in ethanol. Fragments greater than 50 μm were oven-dried at 40°C and dry-sieved through seven different sieve sizes (3,000, 2000, 1,000, 500, 250, 100, and 50 μm). The aggregate stability for each treatment was expressed as the normalized mean weight diameter for each individual treatment, and the mean aggregate diameter of all treatments (MWDLeBissoinnais ) is evaluated.
The fourth evaluated indicator corresponds to the USDA wet aggregate stability (AggregatesUSDA; method 1B1b2a1 in USDA-NRCS, 2004), that follows a disruption of an initially 3 g air dried sample of 1–2 mm soil aggregates by submerging and wet sieving in distilled water through a 0.5 mm sieve. A following dispersion in sodium hexametaphosphate solution (Calgon) is performed for determining >0.5 mm sand mass. Sand mass is subtracted from both the initial mass (i.e., 3 g) and the mass retained after sieving in water. Aggregate stability is computed as the ratio between the latter and former dry sand-free soil masses.
Soil Hydrological Measurements
Infiltration rates were determined by double-ring infiltrometers (Eijelkamp, Giesbeek, Netherlands) in May 2019 in five selected sites per plot according to the Eijkelkamp user manual (Eijelkamp, 2018). Two rings were installed in non-disturbed rows and three rings in the planting rows. Philip’s infiltration equation was applied for steady state infiltration rates (Philip, 1957). Surface saturated hydraulic conductivity (Ks) was estimated through the measurement of steady-state infiltration, solving Wooding equation (Wooding, 1968), using the White and Sully method (White and Sully, 1987; Logsdon and Jaynes, 1993; Angulo-Jaramillo et al., 2000).
Soil Biological Properties
Particulate organic matter (POM) fractions of 212 μm, 53 µm and <53 µm (mineral-associated organic matter, MAOM) were separated by an adapted method of Cambardella and Elliott (1992) using 6.66 g of dry, 2 mm sieved soil and 20 ml of calgon (5% sodium hexametaphosphate). After drying, each fraction was analyzed for SOC.
Potentially mineralizable nitrogen (PMN) was measured in three occasions in 2019 by anaerobic incubation of fresh soil samples over 7 days and subsequent determination of the produced ammonium (NH4) by colorimetry (Waring and Bremner, 1964; Bundy and Meisinger, 1994). Analyzed samples were from identical origin as samples used to determine aggregate stability (see above). Details for POM and PMN analysis are reported in (Fabrizzi et al., 2003).
Soil Erosion Modeling and Statistical Analysis
The Revised Universal Soil Loss Equation (RUSLE) is the mostly used, widespread model to predict average annual soil losses resulting from rainfall erosion of cropland (Renard et al., 1997; Tang et al., 2015). The estimation of soil erosion with this model is defined by six factors: R is a runoff-rainfall erosivity factor; K is a soil erodibility factor; LS is a topographic factor combining slope length (L) and slope steepness (S); C is a cover-management factor and P is a supporting practices factor. RUSLE was used to model the corresponding annual long-term erosion losses for the three treatment groups. The RUSLE factors R (rainfall erosivity), L (slope length factor) and S (slope steepness factor) did not change within the experimental site. The same applied for the P factor (support practice factor) as all plots were managed identically. The 30-years R factor for this region was 4248 MJ mm/ha/h/yr (Pérez-Bidegain et al., 2017) and the K factor was 0.023 t ha h/MJ/ha/mm (Puentes, 1981). The three treatment groups differed in the C factor (cover-management factor), which ranged between 0.06 and 0.3 (Clerici and García Préchac, 2001; Hill et al., 2008).
A widespread weakness of long-term runoff plots is their unreplicated nature (Packer et al., 1992; Williams et al., 2009; Ramos-Scharrón and Figueroa-Sánchez, 2017) which can result in an unbalanced experimental design during their long-term history which is why in this study, plots were grouped as pairs per treatment. However, repeated measures over time for continuous variables and pseudo-replicated point measurements within each plot did not allow an analysis of variance. Therefore, with acknowledgement of pseudoreplication (Davies and Gray, 2015), data were analyzed using descriptive statistics, paired “t” tests (Microsoft Office Excel 2010), a general linear model (SAS Version 9.4; PROC GLM) (SAS Institute, Cary, United States, NC) and correlation analysis to evaluate this comprehensive data set.
Results
Evolution of Soil Organic Carbon
SOC decreased continuously in the first experimental period until 1996 and tended to slightly increase in the study years. In June 2015, SOC reached a high level in all treatment groups after soybean harvest. In April 2015, Black oats were sown broadcast and high root biomass was present during sampling. A sharp decrease in all treatments was recorded in December 2018 when maize and wheat were cropped within the same calendar year. TIL_CROP had lowest SOC content in most of the measured years and showed a sharp SOC depletion during the first experimental period. TIL_CP was 6 years longer under fallow and had the lowest IAI, showing higher SOC in most sampling events after conservation agriculture was applied in all plots (Figure 2).
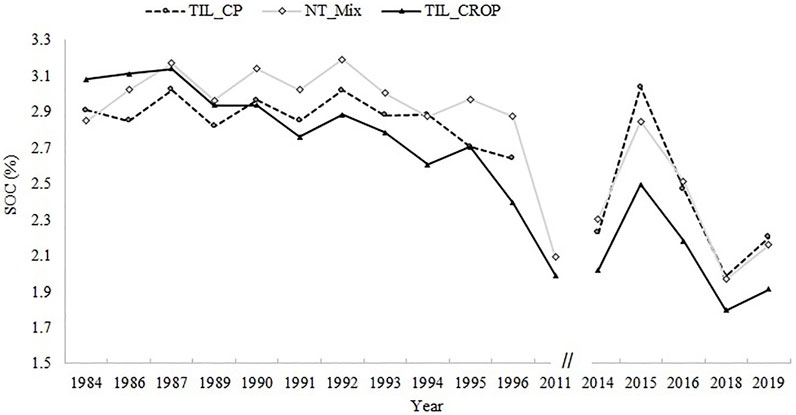
FIGURE 2. Topsoil carbon content (SOC in %) for each treatment group (fallow period between 1997 and 2010 was excluded) since the onset of the experiment in 1984 until 2019.
Soybean yields ranged from 1,322 kg/ha in 2014–5,472 kg/ha in 2017. NT_Mix and TIL_CROP were most intensively cropped, having three times more grain extracted compared with TIL_CP over the last 10 years (Supplementary Table S1). In the last experimental period between 2015 and 2019, lowest crop yields were obtained in plot 3 (TIL_CROP), and for soybean also in plot 1 (TIL_CP) and highest yields were observed in plot 2 (TIL_CP) and plot 6 (NT_Mix).
Soil Chemical and Biological Properties
SOC was the lowest in both years and most depths in TIL_CROP and increased for all treatments in the second year (Supplementary Table S2). The opposite happened for Ntot which was lower in 2019, having lowest content for both years in TIL_CROP in the first 30 cm soil depth. Soil pH was slightly acidic in the top soil for all treatments and increased with decreasing soil depth, in many occasions pH was lowest in NT_Mix. Particulate organic matter (POM) averaged 0.08 g/100 g soil for coarse POM (>212 µm) and 0.09 g/100 g soil for fine POM (53–212 µm), while mineral-associated organic matter (MAOM, <53 µm) averaged 2.49 g/100 g soil. Significantly highest POM was measured in the TIL_CP with lowest IAI and 6 years longer fallow period. Potentially mineralizable nitrogen (PMN) averaged 47, 37 and 42 mg/kg in 0–7.5 cm and 3, 10 and 16 mg/kg in 7.5–15 cm soil depth for the sampling dates 25th October, 11th November and 29th November 2019, respectively. Lowest PMN was measured on two occasions in TIL_CROP (data not shown).
Soil Physical and Hydrological Properties
The average infiltration rate for all treatments was 27.5 mm/h. Infiltration rate was highest with NT_Mix and lowest in TIL_CROP, the same was true for saturated hydraulic conductivity (Ks) which averaged 22.4 mm/h. Both parameters were significantly lowest in plot 3 and highest in plot 6 (p = 0.0011 and 0.0018, respectively; Table 4). Bulk density averaged 1.35 g/cm³ in both depths (0–7.5, 7.5–15 cm) in 2018 and 1.22 g/cm³ in 7.5 and 1.26 g/cm³ in 15 cm soil depth in 2019 and was lowest in both years in plots with lowest IAI in TIL_CP and increased with higher IAI due to historical tillage intervention and longer continuous cropping. Penetration resistance in 0–15 cm soil depth was 1,482, 1,382 and 1,646 kPa for TIL-CP, NT_Mix and TIL_CROP, respectively averaged over four measurement days. It was significantly highest in three out of four measurement days in TIL_CROP (p = 0.0059).
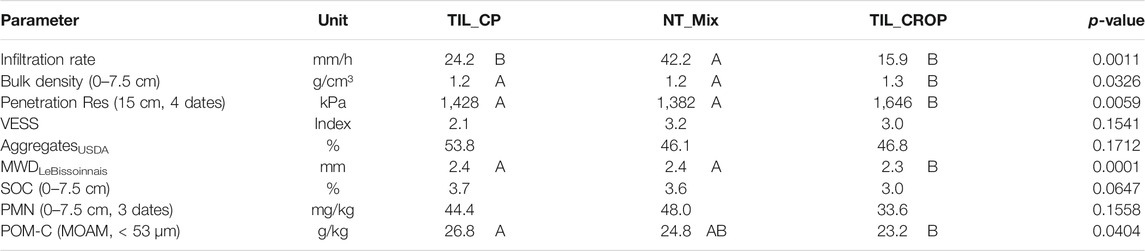
TABLE 4. Treatment averages for physical and chemical soil properties measured in 2019 (GLM-SAS: capital letters indicate evidence of significant different treatment groups (p < 0.05); MWD-mean weight diameter, SOC-soil organic carbon, PMN-potentially mineralizable nitrogen, POM-C-particulate organic matter carbon).
Treatments had no statistically significant effect on AggregatesUSDA and the VESS index. Nevertheless, TIL_CP had higher AggregatesUSDA and an “intact” soil structure score (VESS index 2 with high aggregate porosity) whereas NT_Mix and TIL_CROP obtained VESS scores of three and more (firm structure with low aggregate porosity). For measured aggregate stability according to USDA and Le Bissoinais, mean weight diameter of soil aggregates was lowest in TIL_CROP, having the highest IAI (Table 4).
Most pronounced differences in soil quality parameters caused by different soil use and management history were found for infiltration rate (Infil_mm/h), saturated hydraulic conductivity (Ks_mm/h) and PMN in 7.5 cm soil depth (Figure 3). Although not statistically substantiated, relative differences in VESS and SOC in 7.5 cm soil depth between treatments groups were recognized.
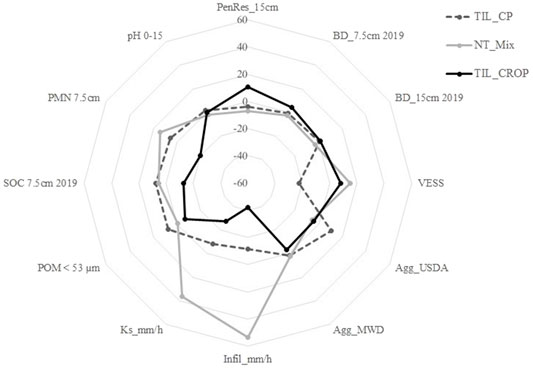
FIGURE 3. Spider diagram of relative deviations (in %) from the population mean for soil parameters assessed in 2019.
Soil Erosion, Runoff and Nutrient Losses
Yearly average runoff was 2.7 times greater in 2018 than 2017 while the runoff coefficient was 2.5 times greater in 2018 (Table 5).
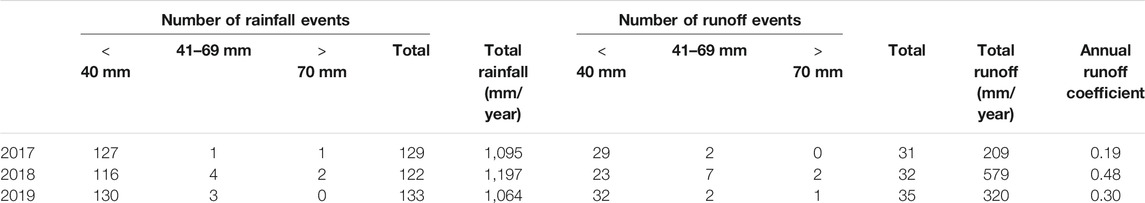
TABLE 5. Rainfall classification and average annual runoff information for the study period.
Yearly average soil losses amounted 233, 805 and 139 kg/ha for the three respective study years with highest erosion rates in 2018 in all treatment groups. Yearly differences can mostly be explained by climatic variability. The higher erosion was due to more intense rainfall events and about 100 mm more rainfall in 2018 compared with the other two studied years. Also, the number of high, intensive rainfall events above 40 mm was the highest in 2018 (6), but only 2 and 3 events were recorded in 2017 and 2019, respectively (Table 5). Overall, rainfall occurred in about a third of each calendar year. A power regression and moderate correlation was found between rainfall and surface runoff for 98 events during 2017 and 2019 (R2 = 0.53; y = 0.0013x2.1045). Few rainfall events above the 1:1 line caused higher runoff than the actual amount of rainfall of the corresponding event and was influenced by the actual state of soil moisture saturation and hence, previous rainfall events (data not shown). We found overall higher erosion rates in the NT_Mix and lowest in the TIL_CP to sustain our hypothesis that a smaller IAI score is condensed in soil erosion rates due to historical intensive cropping and tillage (Figure 4). As soil and crop management was similar in the last five study years, measured differences in runoff and erosion between plots were elicited by soil management legacy or due to natural spatial variability between plots. The coefficient of variation (CV) among Wischmeier plots was high and between 52% (8th October) and 120% (3rd September) in 2017 for soil erosion events of more than 5 kg/ha. In 2018, CV increased between 23% (16th December) to 145% (29th May) and in 2019, CV between plots was between 45% (26th July) and 74% (30th January) for soil erosion events with more than 5 kg/ha average soil loss.
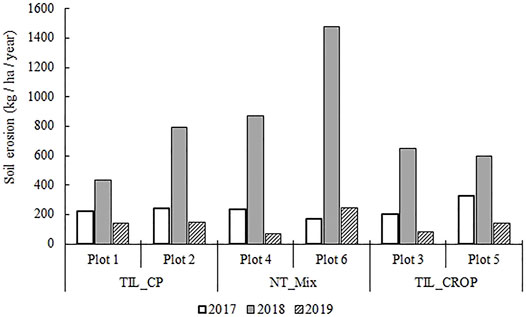
FIGURE 4. Accumulated soil loss per plot and year (kg/ha).
The estimated long-term soil erosion rate with RUSLE was 1,000 kg/ha, 1,600 kg/ha, and 2,100 kg/ha for NT_Mix, TIL_CP, and TIL_CROP, respectively.
In 2019, volatile solids corresponded to one third of total soil losses, representing mainly the removal of straw residues and decomposing material on the soil surface (Table 6). The share of fixed material increased with increasing total soil loss. Moderate to high correlations were found between the amount of lost volatile solids and maximum rainfall intensity (R2 = 0.64 for NT-Mix; R2 = 0.70 for TIL_CP; R2 = 0.45 for TIL_CROP) and between the fixed and volatile solid ratio and the respective runoff for each treatment group (R2 = 0.70 for NT_Mix; R2 = 0.60 for TIL_CP; R2 = 0.45 for TIL_CROP).
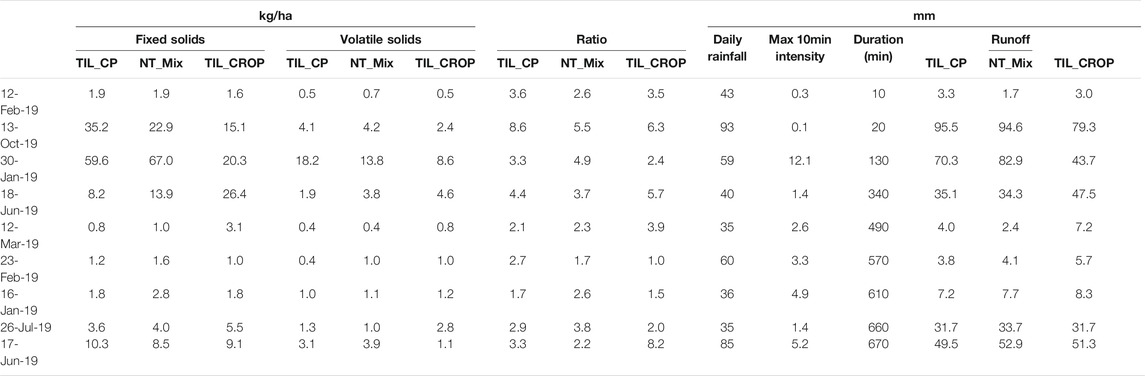
TABLE 6. Fixed and volatile solids in kg/ha/day for selected soil erosion events in 2019, sorted from shortest to longest rainfall duration per rainfall event.
Peaks of intense runoff events mostly coincided with high rainfall, however not all recorded rainfall events over 70 mm resulted in erosion (eg., May 2019, Figure 5). The plots were permanently covered and cropped during the monitoring period. Not for all reordered erosion events, rainfall intensity was the relevant factor. There was only one exceptional erosion event during the study period in NT_Mix in July 2018, leading to more than 350 kg/ha soil loss within 1 month. On 30th of June, wheat was planted and hence soil was disturbed by the planter disks. Due to heavy rainfall the days before and after planting, wheat emergence was reduced and crop establishment was poor and soil was not covered properly. Although it was an exceptional erosion event in NT_Mix, the overall magnitude of erosion was much lower than the tolerable threshold.
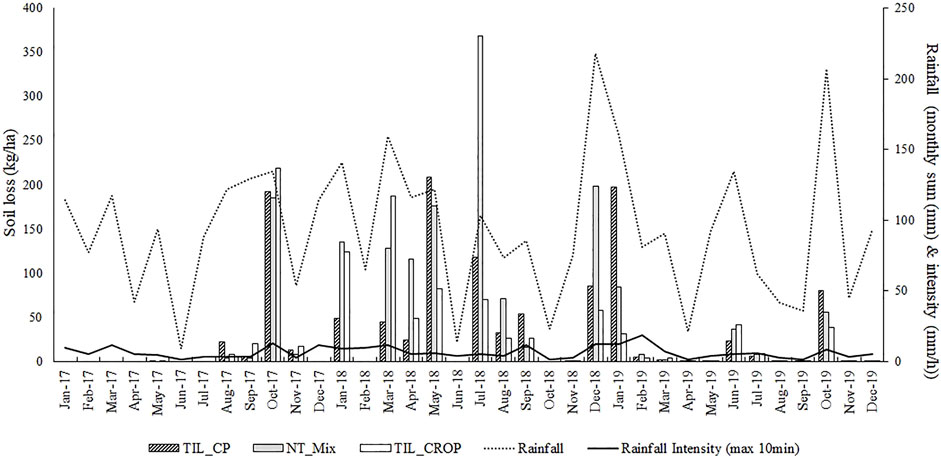
FIGURE 5. Monthly pattern of soil erosion for the respective treatment groups in relation to climatic variables of monthly rainfall and highest monthly 10-min rainfall intensity.
The enrichment ratio showed that SOC was 6.8 times higher in the sediment eroded in TIL_CROP than contained in the topsoil, this carbon enrichment ratio was even higher in NT_Mix and lowest with the lowest IAI in TIL_CP (Table 7). The nutrient loss through runoff was slowed down with lowest IAI which in turn is related to the higher SOC in the topsoil observed in the latest study years (Figure 2). Highest sediment enrichment for C and N in NT_Mix did not lead to lowest SOC content in the top soil and is explained by the overall management effect of straw retention and no-tillage over several decades in this treatment group.

TABLE 7. Sediment enrichment ratio for carbon (SOC) and nitrogen (Ntot) in surface runoff samples (n = 4, SD = standard deviation).
Discussion
Historical Land Use and Current Soil Quality
During the first experimental period (1984–1997), which represented 55% of the total running time since the installation of the evaluated experiment, a generalized depletion of SOC was observed in all evaluated plots (Figure 2). This depletion was greater in TIL_CROP systems where SOC in 1996 represented 81% of the initial SOC content whereas in TIL_CP and NT_Mix, the average losses were 10 and 3%. When compared to no-till systems, intensive tillage can promote C mineralization by breaking soil aggregates and therefore increasing the access of soil microorganisms to previously protected C pools (Six et al., 1999, 2000). Additionally, tillage can promote soil erosion losses (Verhulst et al., 2010). Despite that, after 1997 all plots received the same tillage management until 2019, but SOC levels in TIL_CROP treatments remained below the C levels observed for the other two treatments during the evaluated period. The observed differences in near-surface SOC levels generated in early stages of the experiment can be related to the positive effects of historical no-tillage in NT_Mix on soil physical indicators, like penetration resistance, aggregate stability, bulk density, and available water capacity (Blanco-Canqui and Ruis, 2018), that were not eliminated with later changes in tillage (Table 4; Figure 3). Similar reverse effects on the decline in soil fertility and soil aggregation were found in a 20 year old grass pasture site with a prior history of cropping activity (Jones et al., 2016). There, the loss of SOC under pasture increased with greater years under cropping and soil aggregation and mineralizable N did not improve with perennial pastures. The same was true for TIL_CROP with highest cropping activity where most of the measured soil quality parameters did not recover at the same level as for TIL_CP or NT_Mix. The TIL_CP treatment which incorporated pastures in the rotation and had a longer discontinuation period, counted with only three soybean harvests and extracted 10 Mg of grain/ha. However, in the NT-Mix and TIL_CROP treatments 33 Mg of grain/ha were harvested over ten harvest years (Supplementary Table S1). As expected, the combination of lower C and nutrient extraction with the lower tillage intensities in TIL_CP maintain an overall higher soil quality when compared to more extractive and tillage intensive systems (Amsili et al., 2021). The observed soil degradation in TIL_CROP is consistent with that reported for continuous annual cropping systems in the Pampas region where a continuous nutrient extraction combined with relatively low mineral fertilizer inputs (Table 1) might explain the historical decline of SOC (Figure 2). The observed depletions in SOC can significantly deplete obtainable yields (Ernst et al., 2020; Rubio et al., 2021a). When short-term management strategies such as increasing crop fertilization and mechanical soil decompaction have been proven insufficient to remediate yield depletion (Ernst et al., 2020; Rubio et al., 2021b), our results indicate that 5 years of conservation agriculture do not compensate for the degradation of soils generated by previous land use history. Significant differences in several soil properties confirm our hypothesis that the soil management legacy still lingers on the current state of soil (Table 4). Further studies are needed to determine the amount of time needed to recover soil health and yield in degraded areas. The intensification of agricultural production, in the form of historical cropping sequence and tillage activity, was represented by the study´s treatment groups. However, it should be avoided to generalize that higher cropping intensity automatically leads to worse soil conditions and hence to higher erosion rates. This depends on the management practice at the cropping system level and on multiple options and combinations cropping intensification is realized (Mouratiadou et al., 2021). Permanent cover, growing roots and continuous N and C input may also lead to beneficial effects on soil quality which highly depends on the management (crop rotation, tillage, cover crops, etc) (Xiong et al., 2019; Cassman and Grassini, 2020). However, sustainable intensification as a condition to avoid soil deterioration was not given in the current study with simplified and soybean focused crop rotation in the second and third experimental period.
Historical Land use and Current Soil Erosion
The distinction between volatile and fixed suspended solids in water samples is done to determine total mineral soil loss and additional removal of organic material, most present as SOC, by water erosion. According to Lal (2019), there is a big lack of research in this area showing that particulate organic carbon or POM are related to losses of volatile solids. In 2019, higher POM was found in treatments with higher volatile solid losses. The annual losses of volatile solids in 2019 increased with decreasing IAI averaging 84 kg/ha in TIL_CP, 58 kg/ ha in NT-Mix and only 40 kg/ha in TIL_CROP showing the opposite pattern of POM (TIL_CROP < NT_Mix < TIL_CP). Highest losses of volatile solids in TIL_CP were also measured in 2017 (148 kg/ha in TIL_CP, 106 kg/ ha in TIL_CROP and 74 kg/ ha in NT_Mix), however no POM was assessed for the other 2 years.
Several studies reported that the soil removed by erosion is 1.3–5 times richer in organic matter than the remaining soil (Bagarello and Ferro, 2017) which was even higher in NT-Mix and TIL_CROP (Table 7). In line with our results, Bertol et al. (2007) analyzed organic carbon in runoff sediments under soybean cropping and found higher losses in no-till compared with conventional tillage, but overall C enrichment ratio was much smaller (between 1.00 and 1.17) than in the current study. Sediment ratios did not follow a certain treatment tendency for the selected rainfall events (Table 6). But higher SOC combined with improved soil structure indices in TIL_CP may lead to the assumption that SOC was tighter bound to MAOM and hence less prone to get lost as fixed solids (attached to sediments, Holz and Augustin, 2021).
As discussed in the previous section, historical land use had a legacy effect on soil quality parameters, several of which reportedly may control soil erodibility (Victoria et al., 2001; Taleshian Jeloudar et al., 2018; Alaboz et al., 2021). However, the soil loss data of the present study do not support a corresponding effect of historical land use on soil erosion. An explanation to the relatively low erosion rates measured across the 3 years of study (Figure 4) is found in the no-tillage practices that were implemented in 2009, 12 years after the end of the initial experimental period (Figure 1). Cover crops were later consistently incorporated in all plots and possibly further improving soil conservation. Soil quality parameters might be responding to this management, although noticeable effects are largely limited to the surface soil layers (Liebig et al., 2004) and only gradually reach deeper soil. Another finding that supports this explanation is small differing ratio of fixed:volatile sediments across historic use treatments for several sampling days in 2019 (Table 6). Consequently, in spite of the latest conservation practices, soil quality parameters are still exhibiting the legacy effects, while erosion losses can be mitigated substantially through enhanced soil cover. As proposed recently by (Willett et al., 2019), no-tillage with residue cover is a functioning soil conservation practice to prevent nutrient losses as shown in the current study by reduced soil erosion and subsequent minimal C and N loss during the experimental period.
Infiltration rate, saturated hydraulic conductivity and PMN were the soil quality parameters more affected by the soil use history (Figure 3). Infiltration rate and saturated hydraulic conductivity are key soil hydrologic properties that affect soil water dynamics, hence soil water erosion (Toy et al., 2002). RUSLE allows for estimating long-term soil erosion average rates, hence its results cannot be compared with yearly measurements of sediment losses over the three study years. Nevertheless, RUSLE can be used as an indicator of sustainability. Erosion estimations were based on the nationally calibrated RUSLE/USLE model and assumed a scenario of continuing soil use and management in each of the treatment groups. This resulted in relatively high soil loss rates (i.e. between 1,000 and 2,100 kg/ha/yr), but still well below the tolerable soil loss threshold of 7,000 kg/ha/yr. The lowest modelled erosion was obtained for NT_Mix, as a consequence of using a lower C-factor to account for improved soil cover from remaining crop or pasture residues. Although it was not the purpose of this paper to validate the RUSLE model, the modelled erosion rate of 1,000 kg/ha/yr in NT_Mix performed averagely in the range between 71 and 1,478 kg/ha/yr for the measured yearly rates (Figure 4), but the model obtained much higher rates for the remaining treatments TIL_CP and TIL_CROP. However, Knapen et al. (2008) and Blanco-Canqui et al. (2009) showed that conservation tillage practices may also contribute to reduced erosion through a smaller erodibility factor K. Therefore, if the erodibility factor is modified in response to soil use (or soil quality parameters), modelled and observed erosion rates could perform better. We therefore propose that these measured soil legacy effects in soil properties should be reflected in changes of the RUSLE soil K factor, which cannot be static but dynamic due to ongoing, permanent processes that affect soil quality (Alewell et al., 2019). The runoff plots have existed since 1984, which implied considerably changes in treatments and different land use management over time. Overall, TIL_CROP showed a noticeable degradation pattern compared with the other two treatment groups which should be translated into a higher erodibility. Although Sasal et al. (2010) reported a linear regression between ISI and cumulative runoff, this was not confirmed with the applied IAI in the current study. Runoff was lowest in all 3 years in TIL_CP, but highest in NT_Mix whereas the treatment with the highest IAI, TIL_CROP, had medium runoff rates for all 3 years. Hence, increasing historical soil use and management intensity does not automatically lead to higher runoff rates, but rather depends on a complex combination of cropping and tillage management factors and subsequent soil process effects.
Conclusion
Over the study period, conservation agriculture controlled soil erosion and soil loss was minimal and far below the national threshold of 7,000 kg/ha. Historical soil use and management caused significant long-term effects on soil properties leading to adverse effects in soil quality in historically intensively tilled and cropped soils. We found significant differences, especially for soil physical parameters between the soil legacy treatments which were mainly due to the historical management conducted during the first experimental period from 1984 to 1997. Five years of conservation agriculture with year-around soil cover did not remediate soil degradation caused by continuous cropping and ploughing. The agricultural intensification index was sensible to detect cumulative treatment differences due to previous soil and land use. The legacy of soil use and management affected the resilience of current sustainable cropping systems. This study found evidence that soil erodibility is affected by cropping management changes over time, and requires an adjustment of the K factor when crop and tillage activity had historical modifications. However, it seems that surface cover during the study period offsets the importance of soil quality status regarding the proneness to soil loss. Conservation agriculture compensated for reduced soil quality in the short-term and protected TIL_CROP in order to avoid soil erosion.
Data Availability Statement
The raw data supporting the conclusion of this article will be made available by the authors on request, without undue reservation.
Author Contributions
KG and VR conducted the samplings and measurements, KG was responsible for evaluation and analysis of the data. KG did the writing of the original draft and the visualization, MP-B assisted with the RUSLE modelling and added to the discussion. JQ added to the discussion. KG and VR had the project idea, supervised and added to the discussion.
Funding
This study has been financially supported by the National Institute of Agricultural Research (INIA), Uruguay (Grant number N-23622).
Conflict of Interest
The authors declare that the research was conducted in the absence of any commercial or financial relationships that could be construed as a potential conflict of interest.
Publisher’s Note
All claims expressed in this article are solely those of the authors and do not necessarily represent those of their affiliated organizations, or those of the publisher, the editors, and the reviewers. Any product that may be evaluated in this article, or claim that may be made by its manufacturer, is not guaranteed or endorsed by the publisher.
Acknowledgments
We thank Jorge Sawchik for the re-installation of this experiment. We thank Wilfredo Mesa, Emiliano Barolín, Héctor Vergara, Gualberto Soulier, Leonardo Silva, Nicolás Leiva and Marcelo Schusselin for trial maintenance; Carolina Lizarralde for previous trial analysis and Henning Schwalm for the analysis of suspended solids in the laboratory.
Supplementary Material
The Supplementary Material for this article can be found online at: https://www.frontiersin.org/articles/10.3389/fenvs.2022.822967/full#supplementary-material
References
Alaboz, P., Dengiz, O., Demir, S., and Şenol, H. (2021). Digital Mapping of Soil Erodibility Factors Based on Decision Tree Using Geostatistical Approaches in Terrestrial Ecosystem. Catena 207, 105634. doi:10.1016/j.catena.2021.105634
Alewell, C., Borrelli, P., Meusburger, K., and Panagos, P. (2019). Using the USLE: Chances, Challenges and Limitations of Soil Erosion Modelling. Int. Soil Water Conservation Res. 7, 203–225. doi:10.1016/j.iswcr.2019.05.004
Amsili, J. P., van Es, H. M., and Schindelbeck, R. R. (2021). Cropping System and Soil Texture Shape Soil Health Outcomes and Scoring Functions. Soil Security 4, 100012. doi:10.1016/j.soisec.2021.100012
Angulo-Jaramillo, R., Vandervaere, J.-P., Roulier, S., Thony, J.-L., Gaudet, J.-P., and Vauclin, M. (2000). Field Measurement of Soil Surface Hydraulic Properties by Disc and Ring Infiltrometers. A Review and Recent Developments. Soil Tillage Res. 55, 1–29. doi:10.1016/S0167-1987(00)00098-2
APHAAWWAWPCF (2012). Standard Methods for the Examination of Water and Wastewater. Washington: American Public Health Association.
Azooz, R. H., and Arshad, M. A. (2011). Soil Infiltration and Hydraulic Conductivity under Long-Term No-Tillage and Conventional Tillage Systems. Can. J. Soil Sci. 76, 143–152. doi:10.4141/cjss96-021
Baethgen, W. E., Parton, W. J., Rubio, V., Kelly, R. H., and Lutz, S. S. M. (2021). Ecosystem Dynamics of Crop-Pasture Rotations in a Fifty‐Year Field experiment in Southern South America: Century Model and Field Results. Soil Sci. Soc. Am. J. 85, 423–437. doi:10.1002/saj2.20204
Bagarello, V., and Ferro, V. (2017). “Measuring Soil Loss and Subsequent Nutrient and Organic Matter Loss on Farmland,” in Oxford Research Encyclopedias. Oxford University Press. doi:10.1093/acrefore/9780199389414.013.189
Beniston, J. W., Shipitalo, M. J., Lal, R., Dayton, E. A., Hopkins, D. W., Jones, F., et al. (2015). Carbon and Macronutrient Losses during Accelerated Erosion under Different Tillage and Residue Management. Eur. J. Soil Sci. 66, 218–225. doi:10.1111/ejss.12205
Beretta-Blanco, A., Bassahum, D., Musselli, R., Beretta-Blanco, A., Bassahum, D., Musselli, R., et al. (2014). Medir el pH del suelo en la mezcla suelo: agua en reposo o agitando? Agrociencia Uruguay 18, 90–94. doi:10.2477/vol18iss2pp90-94
Beretta-Blanco, A., Pérez, O., and Carrasco-Letelier, L. (2019). Soil Quality Decrease over 13 Years of Agricultural Production. Nutr. Cycl Agroecosyst 114, 45–55. doi:10.1007/s10705-019-09990-3
Bertol, I., Engel, F. L., Mafra, A. L., Bertol, O. J., and Ritter, S. R. (2007). Phosphorus, Potassium and Organic Carbon Concentrations in Runoff Water and Sediments under Different Soil Tillage Systems during Soybean Growth. Soil Tillage Res. 94, 142–150. doi:10.1016/j.still.2006.07.008
Blanco-Canqui, H., Mikha, M. M., Benjamin, J. G., Stone, L. R., Schlegel, A. J., Lyon, D. J., et al. (2009). Regional Study of No-Till Impacts on Near-Surface Aggregate Properties that Influence Soil Erodibility. Soil Sci. Soc. Am. J. 73, 1361–1368. doi:10.2136/sssaj2008.0401
Blanco-Canqui, H., and Ruis, S. J. (2018). No-Tillage and Soil Physical Environment. Geoderma 326, 164–200. doi:10.1016/j.geoderma.2018.03.011
Borrelli, P., Robinson, D. A., Fleischer, L. R., Lugato, E., Ballabio, C., Alewell, C., et al. (2017). An Assessment of the Global Impact of 21st Century Land Use Change on Soil Erosion. Nat. Commun. 8, 2013. doi:10.1038/s41467-017-02142-7
Bray, R. H., and Kurtz, L. T. (1945). Determination of Total, Organic, and Available Forms of Phosphorus in Soils. Soil Sci. 59, 39–46. doi:10.1097/00010694-194501000-00006
Bundy, L. G., and Meisinger, J. J. (1994). “Nitrogen Availability Indices,” in Methods of Soil Analysis, Part 2. Microbiological and Biochemical Properties (London: Macmillan Education UK), 951–984. doi:10.2136/sssabookser5.2.c41
Cambardella, C. A., and Elliott, E. T. (1992). Particulate Soil Organic‐Matter Changes across a Grassland Cultivation Sequence. Soil Sci. Soc. Am. J. 56, 777–783. doi:10.2136/sssaj1992.03615995005600030017x
Carrasco-Letelie, L., and Beretta-Blanco, A. (2017). Erosión hídrica del suelo estimada para 99 cuencas uruguayas. Ciencia e investigación agraria 44, 184–194. doi:10.7764/rcia.v44i2.1717
Cassman, K. G., and Grassini, P. (2020). A Global Perspective on Sustainable Intensification Research. Nat. Sustain. 3, 262–268. doi:10.1038/s41893-020-0507-8
Caviglia, O., and Andrade, F. (2010). Sustainable Intensification of Agriculture in the Argentinean Pampas: Capture and Use Efficiency of Environmental Resources. Am. J. Plant Sci. Biotechnol. 3, 1–8. doi:10.1016/j.fcr.2003.10.002
Clerici, C., and García Préchac, F. (2001). Miscelanea Aplicaciones Del Modelo USLE/RUSLE para estimar las pérdidas de erosión en Uruguay y la región del sur de la cuenca del Río de la Plata. Agrociencia 1, 92–103.
Davies, G. M., and Gray, A. (2015). Don't Let Spurious Accusations of Pseudoreplication Limit Our Ability to Learn from Natural Experiments (And Other Messy Kinds of Ecological Monitoring). Ecol. Evol. 5, 5295–5304. doi:10.1002/ece3.1782
De Vries, W., Kros, J., Kroeze, C., and Seitzinger, S. P. (2013). Assessing Planetary and Regional Nitrogen Boundaries Related to Food Security and Adverse Environmental Impacts. Curr. Opin. Environ. Sustainability 5, 392–402. doi:10.1016/j.cosust.2013.07.004
Eijelkamp (2018). Manual Double Ring Infiltrometer. M-0904E. Netherlands: Eijkelkamp Soil & Water, Giesbeek.
Ernst, O. R., Dogliotti, S., Cadenazzi, M., and Kemanian, A. R. (2018). Shifting Crop-Pasture Rotations to No-Till Annual Cropping Reduces Soil Quality and Wheat Yield. Field Crops Res. 217, 180–187. doi:10.1016/j.fcr.2017.11.014
Ernst, O. R., Kemanian, A. R., Mazzilli, S., Siri-Prieto, G., and Dogliotti, S. (2020). The Dos and Don'ts of No-Till Continuous Cropping: Evidence from Wheat Yield and Nitrogen Use Efficiency. Field Crops Res. 257, 107934. doi:10.1016/j.fcr.2020.107934
Ernst, O., and Siri-Prieto, G. (2009). Impact of Perennial Pasture and Tillage Systems on Carbon Input and Soil Quality Indicators. Soil Tillage Res. 105, 260–268. doi:10.1016/j.still.2009.08.001
Fabrizzi, K. P., Morón, A., and García, F. O. (2003). Soil Carbon and Nitrogen Organic Fractions in Degraded vs. Non-Degraded Mollisols in Argentina. Soil Sci. Soc. Am. J. 67, 1831–1841. doi:10.2136/sssaj2003.1831
FAO (2019). Global Symposium on Soil Erosion. Outcome Doc. Available at: http://www.fao.org/3/ca5697en/ca5697en.pdf (Accessed February 9, 2022).
García Prechac, F., Terra, J., Sawchik, J., and Pérez Bidegain, M. (2017). Mejora de las estimaciones con USLE/ RUSLE empleando resultados de parcelas de escurrimiento para considerar el efecto del agua del suelo. Agrociencia Uruguay 21 (2), 100–104. doi:10.2477/vol21iss2pp100-104
García-Préchac, F. (1992). Propiedades físicas y erosión en rotaciones de cultivos y pasturas. Rev. Inia-uruguay Inv. Agr. 1, 127–140.
Grahmann, K., Rubio Dellepiane, V., Terra, J. A., and Quincke, J. A. (2020). Long-Term Observations in Contrasting Crop-Pasture Rotations over Half a century: Statistical Analysis of Chemical Soil Properties and Implications for Soil Sampling Frequency. Agric. Ecosyst. Environ. 287, 106710. doi:10.1016/j.agee.2019.106710
Grahmann, K., Terra, J. A., Ellerbrock, R., Rubio, V., Barro, R., Caamaño, A., et al. (Forthcoming 2022). Data Accuracy and Method Validation of Chemical Soil Properties in Long-Term Experiments: Standard Operating Procedures for a Non-Certified Soil Laboratory in Latin America. Geoderma Regional, e00487. doi:10.1016/j.geodrs.2022.e00487
Guimarães, R. M. L., Ball, B. C., and Tormena, C. A. (2011). Improvements in the Visual Evaluation of Soil Structure. Soil Use Manag. 27, 395–403. doi:10.1111/j.1475-2743.2011.00354.x
Gyssels, G., Poesen, J., Bochet, E., and Li, Y. (2005). Impact of Plant Roots on the Resistance of Soils to Erosion by Water: A Review. Prog. Phys. Geogr. Earth Environ. 29, 189–217. doi:10.1191/0309133305pp443ra
Hill, M., García Préchac, F., Terra, J. A., and Sawchik, J. (2008). Incorporación del efecto del contenido de agua en el suelo en el modelo USLE/ RUSLE para estimar erosión en Uruguay [Soil water content effect in the USLE/ RUSLE model to estimate erosion in Uruguay]. Agrociencia Uruguay 19 (1), 94–101. doi:10.2477/vol19iss1pp94-101
Holz, M., and Augustin, J. (2021). Erosion Effects on Soil Carbon and Nitrogen Dynamics on Cultivated Slopes: A Meta-Analysis. Geoderma 397, 115045. doi:10.1016/j.geoderma.2021.115045
Johnston, A. E., and Poulton, P. R. (2018). The Importance of Long‐term Experiments in Agriculture: Their Management to Ensure Continued Crop Production and Soil Fertility; the Rothamsted Experience. Eur. J. Soil Sci. 69, 113–125. doi:10.1111/ejss.12521
Jones, A. R., Orton, T. G., and Dalal, R. C. (2016). The Legacy of Cropping History Reduces the Recovery of Soil Carbon and Nitrogen after Conversion from Continuous Cropping to Permanent Pasture. Agric. Ecosyst. Environ. 216, 166–176. doi:10.1016/j.agee.2015.09.029
Kinnell, P. I. A. (2016). A Review of the Design and Operation of Runoff and Soil Loss Plots. Catena 145, 257–265. doi:10.1016/j.catena.2016.06.013
Knapen, A., Poesen, J., Govers, G., and De Baets, S. (2008). The Effect of Conservation Tillage on Runoff Erosivity and Soil Erodibility during Concentrated Flow. Hydrol. Process. 22, 1497–1508. doi:10.1002/hyp.6702
Kumar, K., and Goh, K. M. (1999). Crop Residues and Management Practices: Effects on Soil Quality, Soil Nitrogen Dynamics, Crop Yield, and Nitrogen Recovery. Adv. Agron. 68, 197–319. doi:10.1016/S0065-2113(08)60846-9
Lal, R. (2019). Accelerated Soil Erosion as a Source of Atmospheric CO2. Soil Tillage Res. 188, 35–40. doi:10.1016/j.still.2018.02.001
Lal, R. (2003). Soil Erosion and the Global Carbon Budget. Environ. Int. 29, 437–450. doi:10.1016/S0160-4120(02)00192-7
Le Bissonnais, Y. (1996). Aggregate Stability and Assessment of Soil Crustability and Erodibility: I. Theory and Methodology. Eur. J. Soil Sci. 47, 425–437. doi:10.1111/j.1365-2389.1996.tb01843.x
Liebig, M. A., Tanaka, D. L., and Wienhold, B. J. (2004). Tillage and Cropping Effects on Soil Quality Indicators in the Northern Great Plains. Soil Tillage Res. 78, 131–141. doi:10.1016/j.still.2004.02.002
Lizarralde, C., Baethgen, W., Cadenazz, M., Capurro, C., and Sawchik, J. (2015). “Phosphorus Runoff in a Non-Fertilized Soybean Production System of SW Uruguay,” in ABSTRACT – Conference on Land and Water Challenges “Tools for deveolpment”, 24. doi:10.2477/VOL19ISS3PP24
Logsdon, S. D., and Jaynes, D. B. (1993). Methodology for Determining Hydraulic Conductivity with Tension Infiltrometers. Soil Sci. Soc. America J. 57, 1426–1431. doi:10.2136/sssaj1993.03615995005700060005x
Martinez, J. P., Crespo, C., Sainz Rozas, H., Echeverría, H., Studdert, G., Martinez, F., et al. (2020). Soil Organic Carbon in Cropping Sequences with Predominance of Soya Bean in the Argentinean Humid Pampas. Soil Use Manage 36, 173–183. doi:10.1111/sum.12547
MGAP (2013). Ministerio de Ganadería, Agricultura y Pesca Resolución N° 74/013 de DGRN - 18/01/2013 - Resolució n Ministerial - Planes de Uso. Obligatoriedad de la presentació n de planes de uso, manual de medidas exigibles para todos los cultivos. Available at: https://www.gub.uy/ministerio-ganaderia-agricultura-pesca/institucional/normativa/resolucion-n-74013-dgrn-18012013-resolucion-ministerial-planes-uso.
MGAP-DSA (1976). Descripció n de las unidades de suelos, Min. de Agric. Y Pesca / Direcció n de Suelos y Fertilizante. Montevideo, Uruguay.
Morris, E. K., Morris, D. J. P., Vogt, S., Gleber, S.-C., Bigalke, M., Wilcke, W., et al. (2019). Visualizing the Dynamics of Soil Aggregation as Affected by Arbuscular Mycorrhizal Fungi. ISME J. 13, 1639–1646. doi:10.1038/s41396-019-0369-0
Mouratiadou, I., Latka, C., van der Hilst, F., Müller, C., Berges, R., Bodirsky, B. L., et al. (2021). Quantifying Sustainable Intensification of Agriculture: The Contribution of Metrics and Modelling. Ecol. Indicators 129, 107870. doi:10.1016/j.ecolind.2021.107870
Mueller, L., Schindler, U., Behrendt, A., and Eulenstein, F. (2007). The Muencheberg Soil Quality Rating (SQR): Field Manual for Detecting and Assessing Properties and Limitations of Soils for Cropping and Grazing. Muencheberg, Germany. Available at: https://www.zalf.de/de/forschung_lehre/publikationen/Documents/Publikation_Mueller_L/field_mueller.pdf (Accessed February 9, 2022).
Munka, C., Cruz, G., and Caffera, R. M. (2007). Long Term Variation in Rainfall Erosivity in Uruguay: A Preliminary Fournier Approach. GeoJournal 70, 257–262. doi:10.1007/s10708-008-9139-7
Novelli, L. E., Caviglia, O. P., Wilson, M. G., and Sasal, M. C. (2013). Land Use Intensity and Cropping Sequence Effects on Aggregate Stability and C Storage in a Vertisol and a Mollisol. Geoderma 195-196, 260–267. doi:10.1016/j.geoderma.2012.12.013
Packer, I., Hamilton, G., and Koen, T. (1992). Runoff, Soil Loss and Soil Physical Property Changes of Light Textured Surface Soils from Long Term Tillage Treatments. Soil Res. 30, 789–806. doi:10.1071/SR9920789
Palis, R., Okwach, G., Rose, C., and Saffigna, P. (1990). Soil Erosion Processes and Nutrient Loss. 1. The Interpretation of Enrichment Ratio and Nitrogen Loss in Runoff Sediment. Soil Res. 28, 623–639. doi:10.1071/SR9900623
Palm, C., Blanco-Canqui, H., DeClerck, F., Gatere, L., and Grace, P. (2014). Conservation Agriculture and Ecosystem Services: An Overview. Agric. Ecosyst. Environ. 187, 87–105. doi:10.1016/j.agee.2013.10.010
Panagos, P., Borrelli, P., Meusburger, K., Alewell, C., Lugato, E., and Montanarella, L. (2015a). Estimating the Soil Erosion Cover-Management Factor at the European Scale. Land use policy 48, 38–50. doi:10.1016/j.landusepol.2015.05.021
Panagos, P., Policy, E. S., Environ, B., Policy, S., Panagos, P., Borrelli, P., et al. (2015b). The New Assessment of Soil Loss by Water Erosion in Europe. Environ. Sci. Pol. 54, 438–447. doi:10.1016/j.envsci.2015.08.012
Pérez-Bidegain, M., Hill, M., Clerici, C., Terra, J. A., Sawchik, J., and García-Préchac, F. (2018). “Regulatory Utilization of USLE/RUSLE Erosion Rate Estimates in Uruguay: a Policy Coincident with the UN Sustainable Development Goals,” in Soil and Sustainable Development GoalsChapter. Editors R. Lal, R. Horn, and T. Kosaki (Stuttgart: Catena Soil Sciences - Schweizerbart.), 82–91.
Pérez-Bidegain, M., Piaggio, J. M., Baethgen, W. E., and García Prechac, F. (2017). Rainfall Erosivity Factor Update in Uruguay. Agrociencia 21 (3), 91–99. doi:10.31285/AGRO.21.2.11
Philip, J. R. (1957). The Theory of Infiltration: 4. Sorptivity and Algebraic Infiltration Equations. Soil Sci. 84, 257–264. doi:10.1097/00010694-195709000-00010
PNUD (Programa de las Naciones Unidas para el Desarrollo) Uruguay (2007). Uruguay: El Cambio Climático Aquí Y Ahora. Material complementario del Informe Mundial Sobre Desarrollo Humano 2007-2008, 39.
Puentes, R. (1981). A Framework for the Use of the Universal Soil Loss Equation in Uruguay. M.Sci. Thesis. Texas, United States: Texas A&M University.
Ramos-Scharrón, C. E., and Figueroa-Sánchez, Y. (2017). Plot-, Farm-, and Watershed-Scale Effects of Coffee Cultivation in Runoff and Sediment Production in Western Puerto Rico. J. Environ. Manage. 202, 126–136. doi:10.1016/j.jenvman.2017.07.020
Ranaivoson, L., Naudin, K., Ripoche, A., Affholder, F., Rabeharisoa, L., and Corbeels, M. (2017). Agro-Ecological Functions of Crop Residues under Conservation Agriculture. A Review. Agron. Sustain. Dev. 37, 26. doi:10.1007/s13593-017-0432-z
Renard, K., Foster, G., Weesies, G., McCool, D., and Yoder, D. (1997). Predicting Soil Erosion by Water: A Guide to Conservation Planning with the Revised Universal Soil Loss Equation (RUSLE). Available at: http://www.ars.usda.gov/SP2UserFiles/Place/64080530/RUSLE/AH_703.pdf (Accessed February 9, 2022).
Richter, D. d., Hofmockel, M., Callaham, M. A., Powlson, D. S., and Smith, P. (2007). Long-Term Soil Experiments: Keys to Managing Earth's Rapidly Changing Ecosystems. Soil Sci. Soc. Am. J. 71, 266–279. doi:10.2136/sssaj2006.0181
Rickson, R. J., Deeks, L. K., Graves, A., Harris, J. A. H., Kibblewhite, M. G., and Sakrabani, R. (2015). Input Constraints to Food Production: The Impact of Soil Degradation. Food Sec. 7, 351–364. doi:10.1007/s12571-015-0437-x
Rubio, V., Diaz-Rossello, R., Quincke, J. A., and van Es, H. M. (2021a). Quantifying Soil Organic Carbon's Critical Role in Cereal Productivity Losses under Annualized Crop Rotations. Agric. Ecosyst. Environ. 321, 107607. doi:10.1016/j.agee.2021.107607
Rubio, V., Pérez-Bidegain, M., Beretta, A., Barolin, E., and Quincke, A. (2019). Impacto de propiedades físico-químicas en la estabilidad estructural de Molisoles. Cienc. Del. Suelo 37, 367–371.
Rubio, V., Quincke, A., and Ernst, O. (2021b). Deep Tillage and Nitrogen Do Not Remediate Cumulative Soil Deterioration Effects of Continuous Cropping. Agron J 113, 5584–5596. doi:10.1002/agj2.20927
Sasal, M. C., Castiglioni, M. G., and Wilson, M. G. (2010). Effect of Crop Sequences on Soil Properties and Runoff on Natural-Rainfall Erosion Plots under No Tillage. Soil Tillage Res. 108, 24–29. doi:10.1016/j.still.2010.03.010
Schneider, F., Don, A., Hennings, I., Schmittmann, O., and Seidel, S. J. (2017). The Effect of Deep Tillage on Crop Yield - What Do We Really Know? Soil Tillage Res. 174, 193–204. doi:10.1016/j.still.2017.07.005
Six, J., Elliott, E. T., and Paustian, K. (1999). Aggregate and Soil Organic Matter Dynamics under Conventional and No‐Tillage Systems. Soil Sci. Soc. Am. J. 63, 1350–1358. doi:10.2136/sssaj1999.6351350x
Six, J., Ogle, S. M., Breidt, F. J., Conant, R. T., Mosier, A. R., and Paustian, K. (2004). The Potential to Mitigate Global Warming with No-Tillage Management Is Only Realized when Practised in the Long Term. Glob. Chang. Biol. 10, 155–160. doi:10.1111/j.1529-8817.2003.00730.x
Six, J., Paustian, K., Elliott, E. T., and Combrink, C. (2000). Soil Structure and Organic Matter I. Distribution of Aggregate‐Size Classes and Aggregate‐Associated Carbon. Soil Sci. Soc. Am. J. 64, 681–689. doi:10.2136/sssaj2000.642681x
Soil Survey Staff (2014). Keys to Soil Taxonomy. Available at: http://www.nrcs.usda.gov/Internet/FSE_DOCUMENTS/nrcs142p2_051546.pdf (Accessed February 9, 2022).
Studdert, G. A., Echeverría, H. E., and Casanovas, E. M. (1997). Crop-Pasture Rotation for Sustaining the Quality and Productivity of a Typic Argiudoll. Soil Sci. Soc. America J. 61, 1466–1472. doi:10.2136/sssaj1997.03615995006100050026x
Taleshian Jeloudar, F., Ghajar Sepanlou, M., and Emadi, S. M. (2018). Impact of Land Use Change on Soil Erodibility. Glob. J. Environ. Sci. Manag. 4, 59–70. doi:10.22034/gjesm.2018.04.01.006
Tang, Q., Xu, Y., Bennett, S. J., and Li, Y. (2015). Assessment of Soil Erosion Using RUSLE and GIS: A Case Study of the Yangou Watershed in the Loess Plateau, China. Environ. Earth Sci. 73, 1715–1724. doi:10.1007/s12665-014-3523-z
Toy, T. J., Foster, G. R., and Renard, K. G. (2002). Soil Erosion : Processes, Prediction, Measurement, and Control. New York, United States: John Wiley & Sons, 338, 352.
Turtola, E., Alakukku, L., Uusitalo, R., and Kaseva, A. (2007). Surface Runoff, Subsurface Drainflow and Soil Erosion as Affected by Tillage in a Clayey Finnish Soil. Agric. Food Sci. 16, 332–351. doi:10.2137/145960607784125429
USDA-NRCS (2004). Soil Survey Laboratory Methods Manual. Soil Survey Investigations Report No. 42, Version 4.0. Available at: https://www.nrcs.usda.gov/wps/portal/nrcs/detail/soils/ref/?cid=nrcs142p2_054247
Verhulst, N., Govaerts, B., Verachtert, E., Castellanos-Navarrete, A., Mezzalama, M., Wall, P. C., et al. (2010). “Conservation Agriculture, Improving Soil Quality for Sustainable Production Systems,” in Advances in Soil Science: Food Security and Soil Quality. Editors R. Lal, and B. A. Stewart (Boca Raton, FL, USA: CRC Press), 137–208. doi:10.1201/ebk1439800577-7
Verhulst, N., Kienle, F., Sayre, K. D., Deckers, J., Raes, D., Limon-Ortega, A., et al. (2011). Soil Quality as Affected by Tillage-Residue Management in a Wheat-maize Irrigated Bed Planting System. Plant Soil 340, 453–466. doi:10.1007/s11104-010-0618-5
Victoria, C., Kacevas, A., and Fiori, H. (2001). “Assessment of Erodibility, Runoff and Infiltration in a Uruguayan Vertisol,” in Sustain. Glob. Farm. Sel. Pap. from 10th Int. Soils Conserv. Organ. Meet., 807–811.
Wander, M. M., Bidart, M. G., and Aref, S. (1998). Tillage Impacts on Depth Distribution of Total and Particulate Organic Matter in Three Illinois Soils. Soil Sci. Soc. America J. 62, 1704–1711. doi:10.2136/sssaj1998.03615995006200060031x
Waring, S. A., and Bremner, J. M. (1964). Ammonium Production in Soil under Waterlogged Conditions as index of Nitrogen Availability. Nature 201, 464–466. Available at: https://www.nature.com/articles/201464a0.pdf. doi:10.1038/201951a0
White, I., and Sully, M. J. (1987). Macroscopic and Microscopic Capillary Length and Time Scales from Field Infiltration. Water Resour. Res. 23, 1514–1522. doi:10.1029/WR023i008p01514
Willett, W., Rockström, J., Loken, B., Springmann, M., Lang, T., Vermeulen, S., et al. (2019). Food in the Anthropocene: the EAT-Lancet Commission on Healthy Diets from Sustainable Food Systems. Lancet 393, 447–492. doi:10.1016/S0140-6736(18)31788-4
Williams, J. D., Gollany, H. T., Siemens, M. C., Wuest, S. B., and Long, D. S. (2009). Comparison of Runoff, Soil Erosion, and winter Wheat Yields from No-Till and Inversion Tillage Production Systems in Northeastern Oregon. J. Soil Water Conservation 64, 43–52. doi:10.2489/jswc.64.1.43
Wischmeier, W. H., and Smith, D. D. (1978). Predicting Rainfall Erosion Losses: A Guide to Conservation Planning. Agricultural Handbook No. 537. Washington, DC, United States: U.S. Department of Agriculture, Science and Education Administration. doi:10.1128/AAC.03728-14
Wooding, R. A. (1968). Steady Infiltration from a Shallow Circular Pond. Water Resour. Res. 4, 1259–1273. doi:10.1029/WR004i006p01259
Wright, A. F., and Bailey, J. S. (2001). Organic Carbon, Total Carbon, and Total Nitrogen Determinations in Soils of Variable Calcium Carbonate Contents Using a Leco CN-2000 Dry Combustion Analyzer. Commun. Soil Sci. Plant Anal. 32, 3243–3258. doi:10.1081/CSS-120001118
Xiong, M., Sun, R., and Chen, L. (2019). A Global Comparison of Soil Erosion Associated with Land Use and Climate Type. Geoderma 343, 31–39. doi:10.1016/j.geoderma.2019.02.013
Zhang, G., Chan, K., Oates, A., Heenan, D., and Huang, G. (2007). Relationship between Soil Structure and Runoff/soil Loss after 24 Years of Conservation Tillage. Soil Tillage Res. 92, 122–128. doi:10.1016/j.still.2006.01.006
Keywords: RUSLE, Uruguay, long-term experiment, soil degradation, intensification index, sediments, runoff
Citation: Grahmann K, Rubio V, Perez-Bidegain M and Quincke JA (2022) Soil Use Legacy as Driving Factor for Soil Erosion under Conservation Agriculture. Front. Environ. Sci. 10:822967. doi: 10.3389/fenvs.2022.822967
Received: 26 November 2021; Accepted: 28 January 2022;
Published: 28 February 2022.
Edited by:
Miriam Muñoz-Rojas, University of New South Wales, AustraliaReviewed by:
Ademir De Oliveira Ferreira, Federal Rural University of Pernambuco, BrazilJiban Shrestha, Nepal Agricultural Research Council, Nepal
Ruixing Hou, Institute of Geographic Sciences and Natural Resources Research (CAS), China
Copyright © 2022 Grahmann, Rubio, Perez-Bidegain and Quincke. This is an open-access article distributed under the terms of the Creative Commons Attribution License (CC BY). The use, distribution or reproduction in other forums is permitted, provided the original author(s) and the copyright owner(s) are credited and that the original publication in this journal is cited, in accordance with accepted academic practice. No use, distribution or reproduction is permitted which does not comply with these terms.
*Correspondence: Kathrin Grahmann, Kathrin.Grahmann@zalf.de