Evaluation of Crop Water Status and Vegetation Dynamics For Alternate Partial Root-Zone Drip Irrigation of Alfalfa: Observation With an UAV Thermal Infrared Imagery
 Saihong Lu
 Tong Zhang1,2,3
  Fei Tian
- 1Center for Agricultural Water Research in China, China Agricultural University, Beijing, China
- 2Wuwei Experimental Station for Efficient Water Use in Agriculture, Ministry of Agriculture and Rural Affairs, Wuwei, China
- 3China National Field Scientific Observation and Research Station on Efficient Water Use of Oasis Agriculture in Wuwei of Gansu Province, Wuwei, China
Characterization of the spatiotemporal patterns of crop water status and vegetation dynamics are a prerequisite to overcome water scarcity and obtain precise agricultural water management. Based on high-resolution aerial thermal imagery, we estimated crop water stress index (CWSI), transpiration rate (T), and crop growth status. The research was conducted with conventional subsurface drip irrigation (abbreviated as R) and alternate partial root-zone drip irrigation (abbreviated as P) under four different irrigation quotas: 0 mm, 10 mm, 20 mm, and 30 mm, which are denoted as CK, R10 (P10), R20 (P20), and R30 (P30), respectively. Results indicate that the CWSI is a suitable tool to define alfalfa water status under different irrigation regimes. The CWSI values reflect CK > R10 > R20 > P10 > P20 > R30 > P30, with values of 0.57, 0.41, 0.26, 0.24, 0.18, 0.17, and 0.13, respectively. The T values show that CK < R10 < P10 < R20 < P20 < R30 < P30, with values of 0.46 mm/h, 0.61 mm/h, 0.70 mm/h, 0.71 mm/h, 0.76 mm/h, 0.77 mm/h, and 0.78 mm/h, respectively. In addition, under the same irrigation quotas, the CWSI presented as P10, P20, and P30 was lower than R10, R20, and R30, respectively, while the T was the opposite. Taking the improved transpiration rate as the amount of water saving, it was demonstrated that the alternate partial root-zone drip irrigation was a water-saving method, and each increase of 10 mm in alternating irrigation quotas could save 67.2, 18.4, and 4.6% of water, respectively. This evaluation contributes to a better understanding of the spatiotemporal variations of water and growth status and provides references and theories for the development of modern precise agriculture.
1 Introduction
Alfalfa (Medicago sativa L.) is widely used in feed for herbivorous animals such as cows and swine (Abdelaziz et al., 2013) and has become one of the preferred fodder targets in global animal husbandry (Saloua et al., 2018). China’s cultivated area of alfalfa had been promoted 4 million ha, with a yield of 2.5 million tons. However, the yield still could not meet the need of demand. Consequently, China imports more than 1.3 million tons of alfalfa hay per year (Li et al., 2020) with an average price that exceeded 350 dollars/ton in 2021 (http://www.customs.gov.cn/), which was 37% higher than the domestic cost. Attention must paid to this large supply gap in the alfalfa industry.
Drought and other challenges resulting from climate change are concerning factors that affect the sustainability and high yield of crops (Huang and Shan, 1998). Every kilogram of alfalfa hay consumes 800 kg of fresh water (Xie, 2017), and water demand is concentrated in the growth period (Liu et al., 2019). Northwest China is the main alfalfa cultivation region, with the planting area accounting for 60.6% of the total alfalfa cultivation area according to the National Alfalfa Industry Development Plan (2016–2020) (http://www.moa.gov.cn/). However, this area experiences strong evaporation but rare rainfall. Gansu Province is the region with the greatest number of counties producing high-quality alfalfa in China; nevertheless, the environment there is under severe water stress most years (Deng et al., 2008; Wen et al., 2017), and water resources use rate for irrigation purposes is as high as 178% (Zhao et al., 2016). Because of the agricultural water deficit, it is necessary to deepen the research on water-saving agricultural measures, especially the effective use of irrigation water. Thus, we need to closely monitor the moisture and growth status of alfalfa to formulate irrigation scheduling and optimize the allocation of limited water resources, further realizing the development of precision agriculture with water saving and high yield.
Due to the increasing attention to effective use of irrigation water, many field managements have been taken in the northwest region, with alternate partial root-zone irrigation being one of them (Kang et al., 1997). This method can stimulate the growth of a crop’s root zone and increase the absorption of water and nutrients after rewatering to improve crop water productivity and crop quality (Cheng et al., 2021). However, alternate partial root-zone irrigation results in major changes to farmland soil moisture and heat, and excessive water stress will restrain a crop’s physiological and nutritional development (Shu et al., 2020). In order to avoid a serious water deficit that reduces crop yield, to decrease evaporation, and to achieve the goal of water saving and high yield, monitoring water status and crop water requirements across an entire growth period is of great significance.
Starting from the principle of heat and water vapor flux in the soil-plant-atmosphere continuum (Zhao et al., 2012), when the soil water supply cannot meet the requirements of plant transpiration (T), the transpiration rate decreases, and the latent heat of transpiration consumption decreases. However, the sensible heat level increases accordingly, leading to the rise of crop canopy temperature (Tc) and vice versa. Therefore, in the early literature, Tanner (1963) proposed using the Tc to diagnose crop water deficit. Then taking ambient meteorological conditions into consideration, Idso (1982) innovatively created the crop water stress index (CWSI) model, which defines its upper and lower limits as the canopy-air temperature difference (Tc-Ta) under the condition of no transpiration and potential evaporation. Various CWSI models have since been developed, and it was commonly used as a tool to quantify the effect of water stress (Susan et al., 2012; Devin et al., 2016; Santesteban et al., 2017; García-Tejero et al., 2018). Meanwhile, research has made great progress from observational methods to modeling methods (Sun and Liu, 2003). In particular, with the development of ground-based and unmanned aerial vehicle (UAV) based monitoring at the meter level and sub-meter level (Gerhards et al., 2019), it is possible to obtain nondestructive, spatial continuous, and automatic infrared thermal (e.g., the Tc) at the plant canopy scale (Ray et al., 1988) and thus accurately perceive crop water status and growth status near real-time. In this context, high-resolution UAV-based thermal imaging has been successfully applied in previous studies of almond trees (García-Tejero et al., 2018), corn (Devin et al., 2016), a vineyard (Santesteban et al., 2017), and citrus (Gonzalez-Dugo et al., 2014) that have proved the effectiveness of infrared thermometers (TIRs) to monitor crop water status.
The CWSI can clearly show when and where to irrigate, but it is still hard for planters to determine how much to irrigate (Adnan and Attila, 2019). In arid and semiarid inland areas, more than 90% of precipitation returns to the atmosphere in the form of evapotranspiration (Rosenberg et al., 1983), so accurate estimation of crop water consumption (i.e., the T) is another key consideration when adjusting irrigation scheduling (Zhou et al., 2021). Compared with satellite, UAV-based remote sensing is more suitable for field scale monitoring. Using UAV equipped with high-resolution TIR cameras, Ahongshangbam et al. (2020) detected spatial variability of tropical rainforest transpiration, Hou et al. (2021) estimated the soybean transpiration under different water conditions and verified with hydrogen-oxygen stable isotopes measurements, and Ortega-Farias et al. (2021) evaluated the water flux of vineyard and verified with an eddy covariance system. These studies have confirmed the accuracy and applicability of UAV-based TIRs in transpiration estimation.
Crop transpiration is closely related with its water status. Many researchers have explored the relationship between the CWSI and T. Sepaskhah and Ilampour (1996) detected a linear relation of the CWSI and T in cowpea on traditional point-scale observation. Using infrared thermography data have also been collected on field scale for cotton (Jiang et al., 2019) and almond orchards (Gonzalez-Dugo et al., 2019). Overall, this linear relationship appears to be more discrete in common bean (Durigon and van Lier, 2013). Moreover, Xu et al. (2016) argued that the relationship is a downward curve since the water absorbed by plants from the soil cannot meet the needs of plant transpiration when there is a high CWSI. Furthermore, a water deficit leads to partial closure of stomata and inhibits transpiration. Overall, the relationship between the CWSI and T response to water stress is inconsistent for each crop, and this response is expected to vary with the environment. In previous studies, T has been measured at fixed points to achieve precise irrigation management. However, a method of detection to identify the point-by-point relationship in alfalfa at the plant canopy scale is urgently needed and remains poorly investigated.
We pursue the following objectives in this study: 1) quantify the spatiotemporal patterns of alfalfa water status under different irrigation regimes using high-resolution UAV-based thermal images, 2) determine and evaluate the influences of alternate partial root-zone irrigation on the water and growth status of alfalfa, and 3) investigate the response of the CWSI to T and discuss the coupled relationship of water status and water demand at the canopy scale. This research may contribute theories for the development of reasonable irrigation systems and the continued development of modern agriculture.
2 Materials and Methods
2.1 Study Site and Experimental Design
The study was carried out from July 11 to August 22, 2018, at the Wuwei Experimental Station for Efficient Water Use in Agriculture (37°52'20″N, 102°50'50″E, Elev. 1,581 m) located in Liangzhou District, Wuwei City, Gansu Province, Northwest China (Figure 1A). This region typically has a temperate, arid climate and is one of the most prominent arid areas with a mismatch between water supply and demand (Li et al., 2015). There is a large temperature difference between day and night, and the mean annual temperature is around 8°C. Perennially having rare rainfall but intensive evaporation, the average annual precipitation and the annual average surface evaporation are approximately 164 mm and 2,000 mm, respectively. Sunshine in the area is sufficient, with more than 3,000 h of annual sunshine duration, and the annual frost-free period is more than 150 days (Wu and Du, 2020). The soil in the experimental field was light gray calcareous sand loam with a mean dry bulk density of 1.53 g·cm−3, the permanent wilting point and field capacity (volume) were 9 and 32% for the 0–160 cm layer, respectively; the magnetism of soil organic matter, the nitrate nitrogen content, the ammonium nitrogen content, and the available phosphorus content were 4–8 × 10³, 52.13, 6.70, and 5–8 mg·kg−1, respectively, (Zhang, 2017). The natural condition of this station is typical and representative of the Chinese northwest inland arid region.
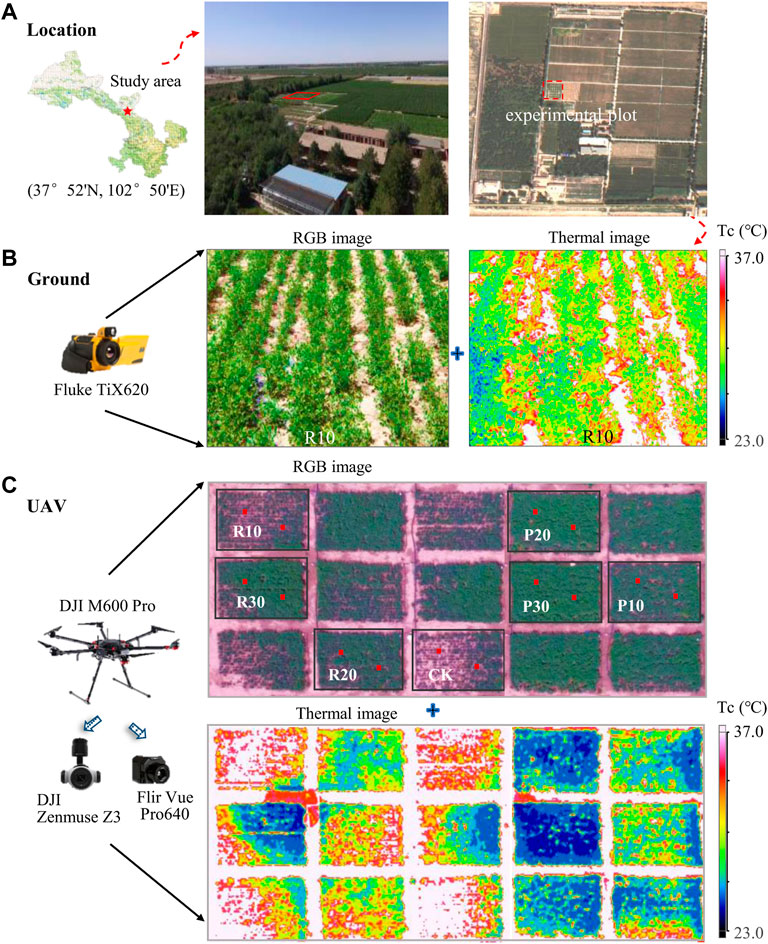
FIGURE 1. (A) Geographic location of the study area and details of the experimental plot layout for the alfalfa irrigation treatments at (B) proximal and (C) UAV scales. For example, R10 represents the irrigation quota at 10 mm using traditional drip irrigation. A detailed description of all the treatments is presented in Table 1. The red dots in UAV-based RGB image were the locations of soli moisture measuring tubes. The images were collected at 13:00 on July 26, 2018.
Before sowing, drip irrigation pipes (DAYU Water-saving Group Corp. LTD., Gansu, China) with a drip head flow rate of 3 L h−1 were installed at 0.3 m intervals and buried at a depth of 0.2 m. A flow meter (Green-GutenTop water meter, Taizhou Green Valves Corp., Ltd., China) was installed on the plots to measure the flow under different irrigation regimes. Two forms of drip irrigation were considered: conventional subsurface drip irrigation (R) and alternate partial root-zone drip irrigation (P). The experimental plot was cultivated with Emperor alfalfa and each planting plot was 4 × 6 m2, as shown by the marked black rectangle in Figure 1C. Based on previous studies at this station (Kou, 2014), these methods included four levels of irrigation quotas: 0 mm, 10 mm, 20 mm, and 30 mm per time. The irrigation was performed every 5–10 days according to the environmental conditions, specifically, when the soil moisture content of any subplot falls close to permanent wilting point, an irrigation will be applied. Three irrigation events were completed on July 16, July 21, and July 29, 2018, during the experiment period. Otherwise, fertilization measures and other environmental conditions were the same in each plot. Thus, seven irrigation strategies were applied to study the effects on the growth and water statuses of alfalfa as explicitly abbreviated in Table 1. For example, R10 refers to the situation where the alfalfa was irrigated 10 mm at a time using conventional drip irrigation for the entire growth stage. Meanwhile, CK stands for a situation with no irrigation.
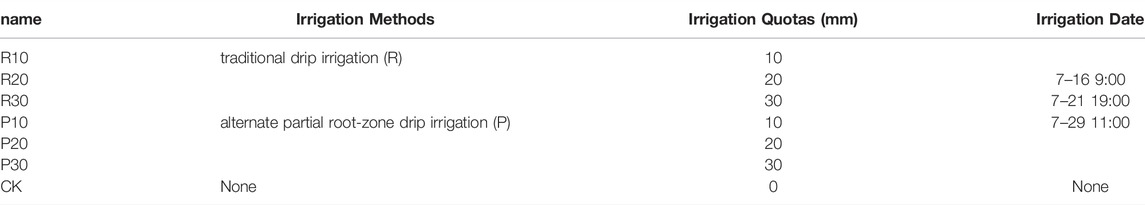
TABLE 1. The irrigation strategies of alfalfa during the study period.
2.2 Data Acquisition
2.2.1 Spatiotemporal Data
The spatiotemporal data in our experiment were acquired from two perspectives: the proximal and aerial scale.
We used a visible-light and high-resolution thermal infrared camera (Fluke IR Flex Cam TiX620, Fluke Corp., United states) to capture both high-resolution thermal infrared and RGB images at 1.5 m above ground level for proximal remote sensing observation. It was possible to precisely identify the soil, crops, and other elements (mainly drip irrigation pipes) in the infrared images, and as demonstrated in Figure 1B, only crops were analyzed in this study. The thermal image sensor resolution was 640 × 480 pixels, with an accuracy of ±2°C and a sensitivity of 0.05°C. The instantaneous field of view was 0.85 mrad, and the measuring wave-length response was in the range of 7.5–14 µm. Meanwhile, the emissivity of alfalfa leaves and canopies was set to 0.95 (Tian et al., 2014); the visible light digital camera had a resolution of 8 megapixels and up to 32 times digital zoom.
We used a UAV platform to collect the RGB and thermal infrared images of alfalfa (Figure 1C) during the remote sensing observation, the RGB and thermal infrared images were used to extracted the alfalfa canopy covers and water status, respectively. The platform comprised a combination of the DJI UAV (DJI M600 Pro), a cloud-borne camera (DJI Zenmuse Z3), and a thermal infrared camera (FLIR Vue Pro 640). The M600 Pro 6-axis aerial vehicle had a hovering vertical and horizontal accuracy of ±0.5 and ±1.5 m, respectively, a maximum support wind speed of 8 m·s−1; and a flight time of near 30 min while loading the camera. All of these factors indicate that it was well equipped to maintain a stable flight attitude over a long period. The DJI Zenmuse Z3 pan-head camera could rotate 360° with a high level of accuracy of ±0.03° and effective pixels numbering 12 million. The FLIR Vue Pro 640 thermal infrared camera had a wide field angle and a measurement wavelength range of 32°H × 26°V and 7.5–13.5 μm, respectively, with a sensitivity of 0.05°C, a camera resolution of 640 × 512 pixels, and a lens focal length of 19 mm. In order to obtain thermal infrared images with high resolution and large coverage, the UAV was made to hover at a height of 80 m for oblique photography. Furthermore, the thermal infrared images collected by the UAV were input into the FLIR Tools image processing software, and the emissivity was set at 0.97 so that these data could be calibrated against the proximal data. The UAV thermal imageries were processed applying geometric and radiometric corrections.
Both perspectives yielded RGB and thermal images of alfalfa, as shown in Figures 1B,C, but the two types of images had different spatial resolutions. The UAV observation was carried out every 2 hours when the weather was clear and cloudless from 9:00 to 19:00 beginning on July 11 and ending on August 22 (local time). The proximal observation schedule was the same as the UAV monitoring, but synchronous observations was only done on July 26 and 29. The observations were repeated three times. Finally, we selected the highest-quality images for deeper analysis.
2.2.2 Other Field Measurement Data
Meteorological data, such as air temperature (Ta), relative humidity (RH), and precipitation were continuously measured from a standard automatic weather station (HOBO H21001, Onset Computer Corp., Cape Cod, MA, United states), as shown in Figure 2A. In the experimental plot, the data collection frequency was 15 min. Moreover, radiation data was collected using the CNR4 four-component radiometer (Kipp & Zonen CNR4, Delft, the Netherlands) and the Bowen ratio system at a frequency of 5 min. Longwave and shortwave radiation were measured to calculate the net surface radiation flux (Rn).
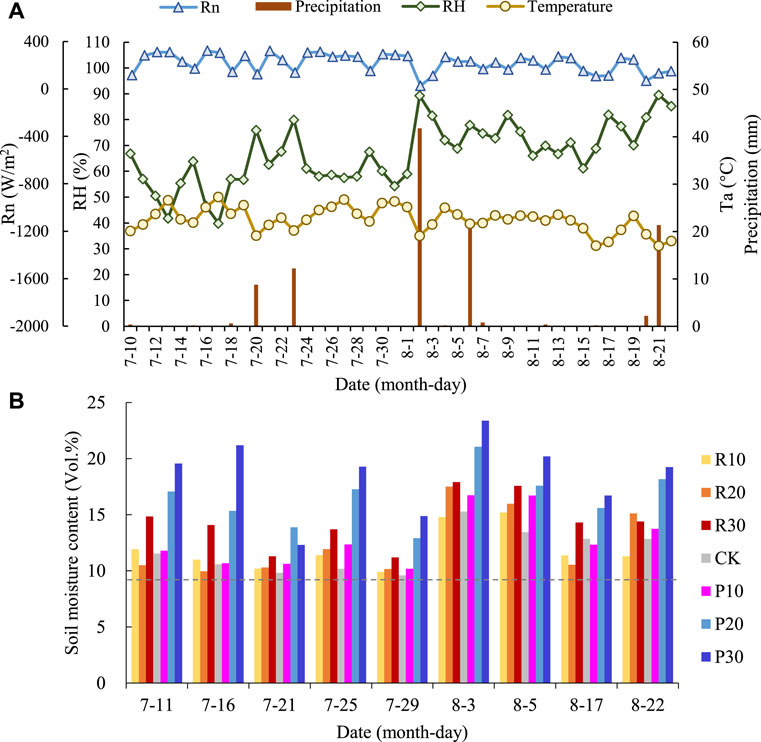
FIGURE 2. The (A) meteorological data in the experiment. and (B) soil moisture content of alfalfa under different irrigation events during the date of observation. Data are presented in approximately five-day intervals, and the gray dot line indicates the permanent wilting point.
Finally, the soil volumetric water content was measured using a portable soil water profiler (Diviner 2000; Australia). Every plot was laid out with two measuring tubes, and those were shown as red dots in Figure 1C. The profiler could obtain the volumetric soil water content at 0–100 cm depth, and the average soil volumetric water content at the two measuring points was calculated as the value of each plot (Figure 2B).
2.3 Methods
2.3.1 Theory and Equations of the CWSI
We used a modified calculation model of the crop water stress index in our study that had simple input parameters combined with UAV thermal infrared imaging technology. The equation was as follows (Jones, 1999; Jones et al., 2002):
Where the Tc, Tw, and Td are defined as the temperatures of the alfalfa canopy, the upper boundary, and the lower boundary (°C), respectively. The Tc was obtained from the thermal UAV image. And for an estimation of the Tw and Td, they were extracted as the highest and lowest canopy temperatures of all treatments in our case, respectively, (Jones et al., 2002; Meron et al., 2010). Therefore, the CWSI pixel values were obtained, and the average CWSI of all crop pixels in each subplot was calculated to discuss the water status under different irrigation events.
2.3.2 Transpiration of Alfalfa
The three-temperature model is a two-source evapotranspiration model based on the idea of land-surface energy balance, which has been extensively applied in arid areas with an evaluation error of 0.08 mm/d (Tian et al., 2014). Since the principle of this model has been explained in detail by many previous studies (Qiu et al., 1998; Xiong et al., 2015), we only briefly explain the transpiration calculation model of vegetation used here. When vegetation covers the ground, the energy balance equation based on vegetation canopy can be expressed as seen in Eqn. 2:
Where the LT is the latent heat flux consumed by the alfalfa’s transpiration (W∙m−2) and L is the latent heat of vaporization with a value of 2.45 × 10⁶ W∙m−2∙mm−1. Furthermore, Rn is the net surface radiation flux (W∙m−2), and Hc is the sensible heat flux of alfalfa and can be calculated as follows (Qiu et al., 1999; Tian et al., 2014):
Where the
By combining Eqs. 2, 3, the T was computed using the following equation:
2.3.3 Calculation of the Canopy Coverage
Canopy coverage (f) is the ratio of the vertical projection of alfalfa canopy onto the land surface to the total area, the higher the canopy coverage, the stronger ability of crops to intercept light. The RGB images are combined with classification software ENVI to extract canopy pixels, so as to obtain the f. The calculation formula is:
3 Results
3.1 The Spatial Assessment of Alfalfa Water Status
The canopy temperature measurements obtained with the thermal images were used to derive the dynamic CWSI under different irrigation treatments. The spatial distribution of the Tc, Tc-Ta, and CWSI for seven sampled alfalfa plots across three measurement dates at 13:00 are shown in Figure 3. It is remarkable that dramatic spatial heterogeneity was very obvious in each planting plot for the above three parameters, with an example being the plot marked R10 in Figure 3(a-1). This plot shows a changing color, which suggests that the high-resolution UAV-based thermal images captured the influence of the cropland microclimate.
FIGURE 3. The (1) canopy temperature, (2) difference between the canopy temperature and air temperature, and (3) crop water stress index of alfalfa based on UAV monitoring both for the (A) nutritional growth stage, (B) transitory stage, and (C) reproductive growth stage. The images were collected at 13:00 on July 21, July 30, and August 19, 2018. The brown pixels are soil which was not considered in the study.
It should be noted that significant differences existed between different planting plots and that the thermal parameters were obviously influenced by the irrigation regimes. The same irrigation methods had similar patterns for the Tc, Tc-Ta, and CWSI, while the value decreased with increasing irrigation quotas. For example, the CWSIs of the planting plots labeled R10, R20, and R30 were mainly within the ranges of 0.4–0.6, 0.2–0.4, and 0.0–0.2, respectively, (Figure 3(a-3)). Surveying different irrigation methods, especially the differences between traditional drip irrigation (R) and alternate partial root-zone drip irrigation (P) as represented by the canopy temperature distribution of alfalfa during its nutritional growth stage in Figure 3(a-1), it can be seen that the Tc with R irrigation was mainly in the range of 28–37°C, while the lower temperature was rare on the right side with a value concentrated in the range of 25–32°C. Similar results were found for the Tc-Ta as well as the CWSI. To be more specific, compared with R irrigation, the values of the Tc, Tc-Ta, and CWSI were lower with P irrigation, indicating that traditional drip irrigation may was subjected to stronger water stress.
Finally, difference between the three growth stages was apparent. The value of the Tc was lower during the prolonged growth period, with the major ranges of 28–37°C and 23–28°C during nutritional and reproductive growth stages (i.e., July 21 and August 19), respectively, combined with the Ta, this condition changed a bit for the canopy-air temperature difference. Meanwhile, the CWSI was more complicated than the Tc or Tc-Ta. No generalized conclusion could be reached, and all three varied from 0 to 0.6. In other words, more temporal evolutions are needed to interpret the findings, which suggests that it is necessary to establish long-term monitoring of alfalfa water status.
3.2 The Temporal Assessment of Alfalfa Water Status
The temporal variability of alfalfa measured by the Tc, Tc-Ta, and CWSI under different irrigation treatments is presented in Figure 4. The results demonstrate that the water status of alfalfa varied substantially during the observation period and that fluctuations could not be ignored under different irrigation regimes.
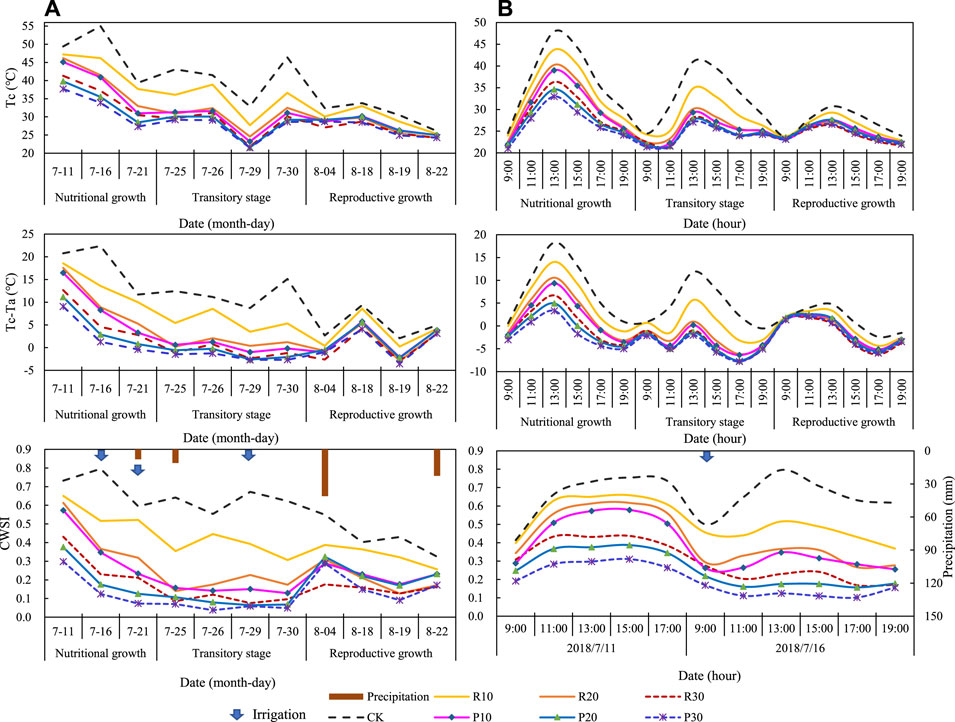
FIGURE 4. The (A) daily variations and (B) diurnal variations in (1) the canopy temperature, (2) the difference between canopy temperature and air temperature, and (3) the crop water stress index of alfalfa under different irrigation methods based on UAV monitoring. The daily variations reflect the mean values of the entire plot for each treatment, and the readings taken at 13:00. Precipitation data were for the first 2 days of the observation period.
Throughout the irrigation season, the Tc values ranged in the interval of 20–55°C, with a mean value of 33.83 ± 5.31°C. Analysis of the Tc under different water treatments shows a relatively consistent trend of fluctuation with different values. In particular, the no-irrigation alfalfa had the highest canopy temperature, followed by the R10, R20, P10, R30, P20, and P30, with mean values of 39.14, 35.23, 31.79, 31.31, 29.74, 29.56, and 28.52°C, respectively, (Table 2). It should also be noted that the Tc decreased when the irrigation quotas increased, this result is consistent with Figure 3(1). In addition, the mean value of R10 was higher than that of P10, with similar results found in R20 and R30 (R20 > P20, R30 > P30), indicating that alternate irrigation has a lower Tc under the same irrigation quota. These results were in accord with the average diurnal trend of the different growth stages [Figure 4(b-1)], especially concerning analyses of the peak values in each stage.
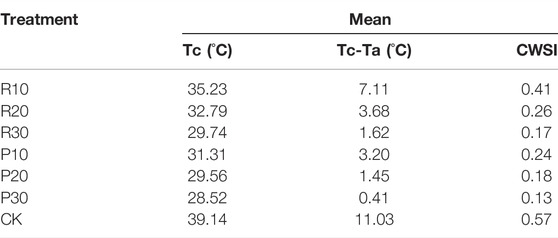
TABLE 2. Analysis of the mean of the canopy temperature, the difference between canopy temperature and air temperature, and the crop water stress index of alfalfa under different irrigation methods in the study period.
Taking air temperature into consideration, there were some changes from the Tc to the Tc-Ta. For example, the lowest Tc value during the study period was on July 29, except for CK (August 19). Another big discrepancy was the fact that the Tc-Ta in the transitory stage was smoother and steadier than the Tc, while its value in the reproductive growth stage fluctuated more than that of the Tc. Thus, the diurnal variation curve of the Tc-Ta in the transitory stage was lower than that of the same curve for the reproductive growth stage, except for CK [Figure 4(b-2)].
The estimated CWSI during the study period and its temporal patterns are exhibited in Figure 4(3). Based on analysis of the observed dates in July and August, the water status of alfalfa was changing continuously with its growth, confirming the necessity of real-time water status monitoring. Generally, the CWSI fluctuated widely in the range of 0–0.8 and showed a downward trend in July, even approaching zero at the end of this month under some irrigation treatments, which indicates a robust water status trend. It jumped in early August and then slowly declined, except for the CK situation without irrigation interference. This variation highlights the role of climate conditions and irrigation. As charted in Figure 4(a-3), precipitation and irrigation could result in the CWSI decreasing, as seen with the irrigation on July 16 and heavy rainfall on August 4. To clarify our understanding, we presented the diurnal pattern of the CWSI at the first irrigation [Figure 4(b-3)]: R10 (P10), R20 (P20), and R30 (P30) were irrigated 10 mm, 20 mm, and 30 mm, respectively, at 9:00 on July 16, while CK was not irrigated. Obviously, there was imparity for the CWSI between the CK and irrigated alfalfa after irrigation (e.g., R10). The diurnal curve of the CWSI of the irrigated alfalfa was shorter and flatter than before, while the CK was higher and thinner. These results indicate that irrigation significantly alleviated alfalfa water stress.
In order to identify the effect of irrigation on alfalfa water status under different irrigation events, an analysis of the mean of the Tc, Tc-Ta, and the CWSI of alfalfa throughout the irrigation season was conducted (Table 2). It can be observed that there were significant distinctions in the CWSI under different irrigation amounts and methods. Under the same irrigation method, the CWSI for different irrigation quotas was significantly different, that was the increasing irrigation quotas resulted in decreasing CWSIs, and it could be ordered as R10 > R20 > R30 and P10 > P20 > P30, with averages of 0.41, 0.26, and 0.17 and 0.24, 0.18, and 0.13, respectively. All the values were smaller than that of the CK (0.57). Under the same irrigation amount, the CWSI of alfalfa under R was higher than that of alfalfa under P, and this difference was particularly significant in scenarios with a low irrigation amount. To be specific, the CWSI under P was reduced by 41.5, 30.9, and 23.5% for 10 mm, 20 mm, and 30 mm irrigation treatments, respectively, compared with the R scenarios. Moreover, every 10 mm increase in the alternate irrigation quotas resulted in the CWSI decreasing to 0.33, 0.06, and 0.05. Thus, the alternate irrigation regime was more significant for a nonnegligible amount of water savings, suggesting that a balance needs to be found between the lower irrigation quotas and better water status.
3.3 Estimation of Alfalfa Transpiration
Figure 5 shows the spatial transpiration rates of alfalfa based on TIR monitoring at the same time for the same canopy areas during three growth stages. When we focus on the heterogeneity in each stage, it can be seen that the variations were basically identical, with alternate irrigation having a higher transpiration rate than traditional irrigation and the increasing irrigation quotas having a positive effect on the transpiration rate. Furthermore, the concentrated value range for the T changed as the observation went on, with T values in the early, middle, and late periods concentrated in the intervals of 0.8–1.3 mm/h, 1.3–1.4 mm/h, and 1.3–1.6 mm/h, respectively.
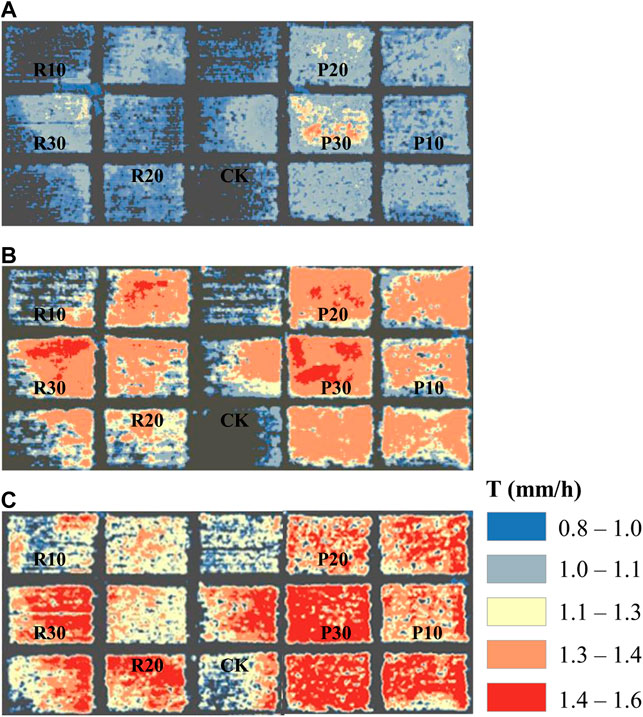
FIGURE 5. The transpiration rates of alfalfa based on UAV monitoring for the (A) nutritional growth stage, (B) transitory stage, and (C) reproductive growth stage. The images were collected at 13:00 on July 21, July 30, and August 19, 2018. The brown pixels in each figure are soil which was not considered in this study.
The alfalfa transpiration rates under different water supplies were estimated (Figure 6). According to the results, the transpiration rate increased from 9:00, reached its peak between 13:00 and 15:00, and approached zero at 19:00. The peak type and peak value varied with time, the irrigation amount, and the irrigation method. Most days, the transpiration rate denoted a single peak curve that first increased and then decreased. Occasionally, the alfalfa would follow the “noon break” phenomenon, with a smaller or closing stomata opening at midday due to strong light intensity and low air humidity (e.g., July 26). This situation can reduce excessive water loss since the transpiration is lower, and this means that the leaf cell water content can recover in the afternoon, resulting in the T recovering too. Hence, the diurnal pattern presented a bimodal type at this time. Analyzing the peak T value, it can be seen that the T was closely associated with the irrigation regime, ranging from 0.63 mm/h (CK in July 11) to 1.63 mm/h (P30 in July 25). No matter the irrigation method, the temporal dynamics suggest that improving irrigation quotas will stimulate the transpiration rate of alfalfa, with relationships being CK < R10 < R20 < R30 under R and CK < P10 < P20 < P30 under P. This finding further supports the previous point that increasing irrigation amount can promote alfalfa transpiration. Moreover, the effect of increasing irrigation quotas to the peak values becomes less noticeable. For instance, under the P irrigation method, the peak value increased by 33.2, 16.3, and 6.0% with every irrigation increase of 10 mm.
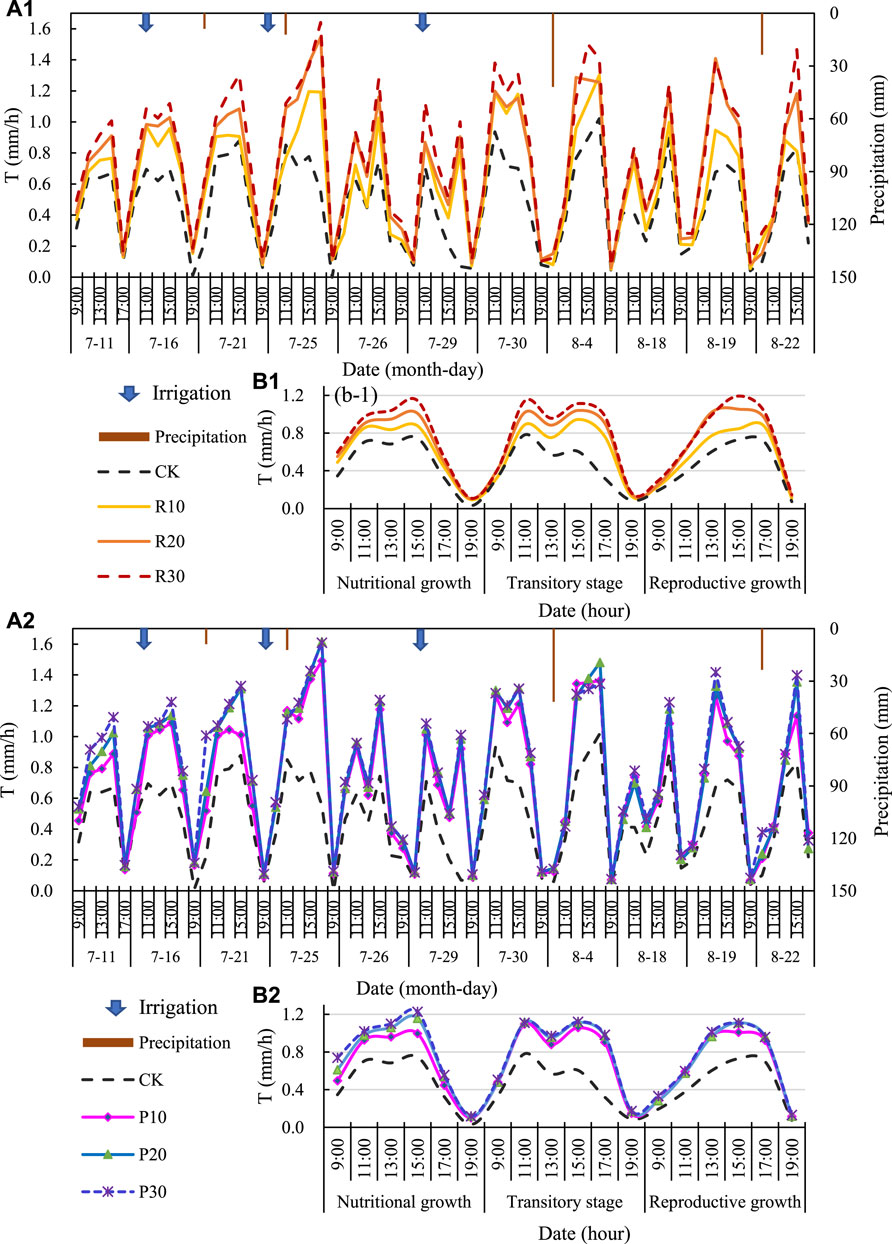
FIGURE 6. Diurnal variations of the alfalfa transpiration rates under (1) traditional drip irrigation and (2) alternate drip irrigation with different irrigation quotas in (A) irrigation season and (B) growth stages based on UAV monitoring. The values of the three growth stages are multi-day averages, and precipitation data are for the first 2 days of the observation period.
When we compared the two irrigation methods, we discovered that the transpiration rates between R and P irrigation methods were in disagreement. Computing the averages of all the transpiration rates during the observation time, the mean Ts of R10, R20, and R30 were 0.61 mm/h, 0.71 mm/h, and 0.77 mm/h, respectively, while for P10, P20, and P30, the mean Ts were 0.70 mm/h, 0.76 mm/h, and 0.78 mm/h, respectively. Alternate drip irrigation saved 67.2, 18.4, and 4.6% of water under the irrigation quotas of 10 mm, 20 mm, and 30 mm, respectively.
3.4 Relationship Between Alfalfa Water Status and Transpiration
Previously, we concluded that the changing of alfalfa water status and the responsiveness of transpiration to different irrigation regimes indicates when and how much to irrigate. Thus, it is necessary to discuss how the water level and transpiration of alfalfa can be used to adjust irrigation scheduling. First of all, in order to find the most representative indexes of alfalfa water status and further explore its effect on transpiration, the different relationships between the T and the Tc, Tc-Ta, CWSI of CK were defined for each monitoring time during the study period (Table 3), which eliminates any disturbance from irrigation. Statistically, the results indicate that the most significant connections were for the readings taken at 11:00 and 17:00 and that the best relationship was fixed between the CWSI and T at 11:00, with a negative correlation coefficient of 0.58 (p < 0.01), followed by 0.50 (p < 0.01) occurring at 17:00. Meanwhile, the relationships for the Tc-Ta and Tc were weaker. Interestingly, at 13:00 and 15:00, the Tc-Ta and CWSI showed weak, negative relationships. This is a finding that can be explained by the “noon break” phenomenon of the T. As a consequence, the CWSI at 11:00 is used for subsequent analysis and discussion.
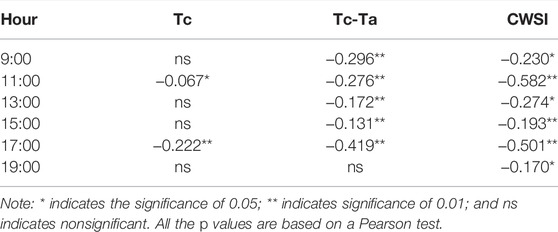
TABLE 3. Pearson’s correlation coefficients between thermal parameters and the transpiration. All values come from readings of the CK treatment.
Correlating the responsiveness of alfalfa transpiration to the water status, we successfully acquired the frequency distribution diagrams of the CWSI and T under CK, R10 (P10), R20 (P20), and R30 (P30) treatments, and the results are shown in Figure 7. Most of the frequency curves are stacked like a downward-opening parabola; that is, with the increased value of the CWSI or the T, the number of spatial grids of corresponding values are displayed as first increasing and then decreasing. In addition, it is critical that the triangular tops between the CWSI and T are in opposite positions for each treatment. For example, the overwhelming majority of pixels in space are concentrated in the range of high values (on the right side of Figure 7(a-1), while the corresponding scale grids for the T are concentrated in the low-value range on the left side of Figure 7(a-2), implying that there was an apparent relationship between the CWSI and T.
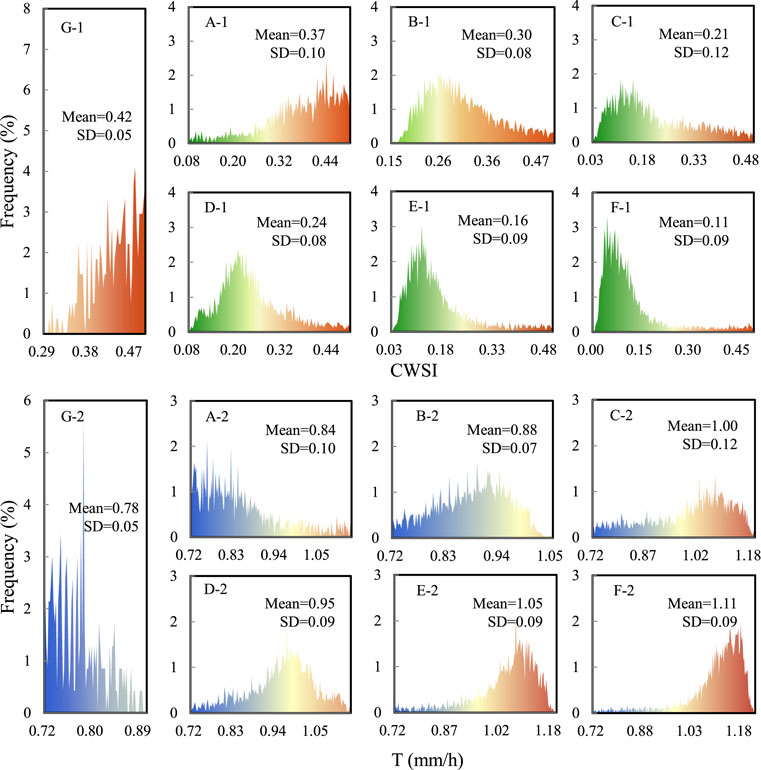
FIGURE 7. Frequency distribution diagram for the (1) crop water stress index and (2) transpiration of alfalfa under different irrigation methods: (A) R10, (B) R20, (C) R30, (D) P10, (E) P20, (F) P30, and (G) CK.
To quantify the influence of alfalfa water status on transpiration, we explored the correlation between the daily CWSI against the T during the nutritional growth stage and the reproductive growth stage, respectively (Figure 8). A significantly negative slope of the CWSI with T was found on a daily basis (p < 0.001), suggesting that severe alfalfa water status decreases transpiration rate. In addition, the slopes of the CWSI and T in the nutritional growth and reproductive growth stages were –1.02 mm/h and –1.43 mm/h, respectively, and corresponding intercepts were 1.31 mm/h and 1.45 mm/h, respectively, although there was some slight scattering (R12 = 0.83 and R22 = 0.45; RMSE1 = 0.064 and RMSE2 = 0.151). Therefore, with steeper slopes and higher intercepts, the alfalfa entering the reproductive growth stage was less exposed to more adverse water conditions. This result could mean that this stage with more vigorous alfalfa transpiration, implying that water consumption may be more effective for the crop growth trend.
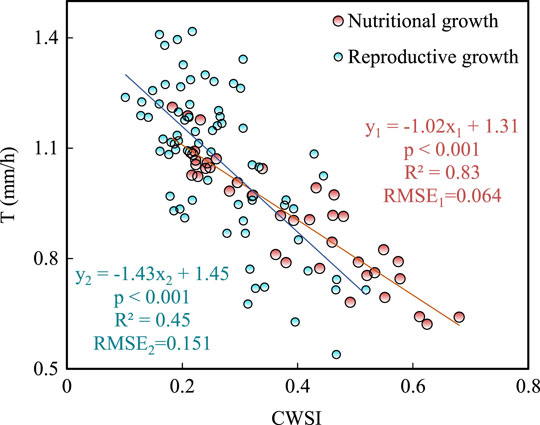
FIGURE 8. Correlation between the T and CWSI of alfalfa in the nutritional growth stage and reproductive growth stage. All the p values represent the significance levels of the overall regression based on a Pearson test.
3.5 Relationship Between Alfalfa Water Status and Growth Status
With the prolonged growth period, vegetation covers significantly increased as shown in Figure 9. This result is also reflected in the spatial distributions (Figures 3, 5). Compared with the images in the third period, vegetation cover was significantly lower in the first two images. Meanwhile, it can be concluded that the canopy cover of P20 completed first on July 22 (99.4%), followed by P30, P10, R30, and R20, suggesting that increased irrigation quotas or alternate irrigation will close the alfalfa canopy sooner. The alfalfa canopies, except for those under the CK and R10 conditions, were near closure once they entered August, and the canopy cover only reached 75% if there was no irrigation, implying the significance of irrigation for alfalfa.
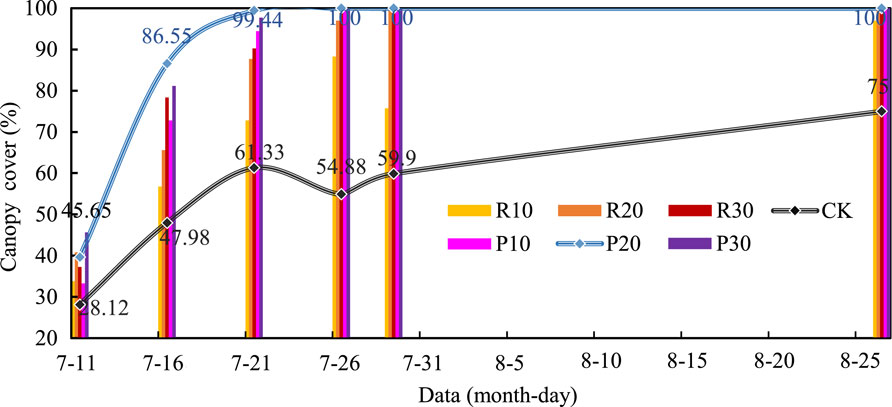
FIGURE 9. Variations of the alfalfa canopy cover under different irrigation treatments during the study period based on RGB images.
4 Discussion
4.1 Verification of the UAV Observational Data
Given that we performed data processing and numerical analysis on high-resolution UAV-based data covering thermal images, it was essential to verify the data itself. As revealed in Figure 10, the time-synchronized points were distributed near the 1:1 line and fit the linear regression. The proximal and aerial monitoring data were in good agreement (R2 = 0.81) and reached an absolutely significant level (p < 0.001), supporting the reliability of the UAV monitoring data. It should be noted that most of the Tc proximal data yielded slightly lower values than the UAV-based data, with a slope equal to 0.61. This finding can be summed up in two points. One reason for this difference is that the UAV with its coarser resolution likely obtained more mixed pixels than in the proximal observations, so the soil temperature will improve the value in these pixels. Meanwhile, the fact that canopy cover of some subplots were not completely probably increased mixed grids, further enlarging this gap, indicating that only pure vegetation pixel for analysis is necessary. The second reason is the scale effect, which must be taken into account (Ricardo et al., 2019). Nevertheless, the level of agreement was acceptable, with an average difference of only 0.28°C, and agreement was best at 15:00. Consequently, the Tc-UAV data was reasonable and robust enough.
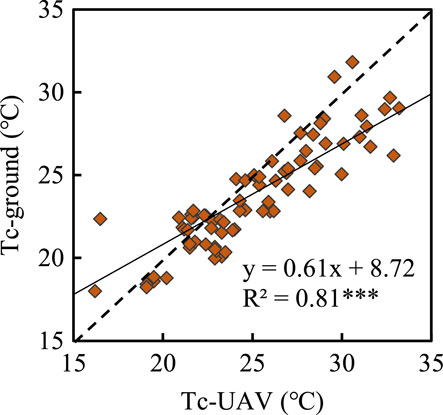
FIGURE 10. Linear regressions obtained between proximal monitoring and aerial imagery monitoring of the alfalfa canopy temperature. The dotted line has an intercept fixed to 0. Each point represents the value of one observation time (and the data comes from July 26–29). *** represents a significance level of 0.001.
4.2 Water Status and Vegetation Dynamics of Alfalfa
Water is a strategic resource nowadays, and there is urgent demand for theoretical research to overcome water scarcity and optimize agricultural irrigation water use (Huang and Shan, 1998). With the support of the thermal sensors on board a UAV platform to obtain high-resolution images, this study was devoted to demonstrating that the technology is valuable in monitoring water status as well as the transpiration rate of alfalfa. Similar to previous studies (Susan et al., 2012; Devin et al., 2016; Santesteban et al., 2017; García-Tejero et al., 2018; Adnan and Attila, 2019), we confirmed that the CWSI is a useful tool to monitor and quantify water stress. Previous studies have concluded that thermal readings at midday were more robust (Gonzalez-Dugo et al., 2014; García-Tejero et al., 2018) and suggested that assessments could be conducted at noon (Xu et al., 2016). With this information in mind, we assessed the spatiotemporal variability of alfalfa under different irrigation regimes. Spatially, there was obvious heterogeneity in the CWSI, which ranged from 0 to 0.6. This finding matched the results reported by Park et al. (2017), suggesting the significance of monitoring water status. Temporally, with the extension of the growth period, the canopy cover gradually arrived 100%, and the alfalfa water condition fluctuated with the water supply and the change in meteorological conditions, which has similarly reported (Romero et al., 2018). The diurnal variation pattern of the alfalfa’s CWSI was described as a single-peak curve that reached its peak around 13:00, which shows that alfalfa is more likely to suffer severe water stress at midday. This finding has also been seen in pepper (Li et al., 2014) and rice (Xu et al., 2016), indicating the commonness of crop water status.
However, too much emphasis was placed on the impact of a water deficit on the crop water status. In contrast to existing studies (Gonzalez-Dugo et al., 2014; Xu et al., 2016; Park et al., 2017; Xie, 2017; García-Tejero et al., 2018; Adnan and Attila, 2019), our study highlights how irrigation alleviates water stress, finding that water status was markedly better after irrigation [Figure 4(b-3)], especially at noon. Meanwhile, we captured the alfalfa response to different irrigation levels, and it appears that an increasing irrigation quota resulted in decreasing CWSI. Our work also quantifies the CWSI in the order of CK > R10 > R20 > R30 and CK > P10 > P20 > P30 during the growing season, while the T follow the orders of CK < R10 < R20 < R30 and CK < P10 < P20 < P30. Hou et al. (2021) also found that soybean transpiration rate was higher under high irrigation quota based on UAV-based TIR. This can be attributed to the increase of soil moisture content (SMC) caused by irrigation (García-Tejero et al., 2018), and a significantly negative correlation between the CWSI and SMC was reported by Xu et al. (2016). In this study, irrigation was carried out on July 29, except in the CK scenario. The irrigation increased SMC by 12.5–63.2% on August 3 compared with the situations beforehand (Figure 1B). Subsequently, the capillary conduction velocity of the soil and the water absorption rate of the plant roots gradually increased, too (Luo and Cheng, 2011), which leads to the increase of leaf water content and leaf water potential, further affecting the water absorption and swelling of leaf protective cells to alleviate water stress. Moreover, with the increase of stomatal conductance (Park et al., 2017) and the enhancement of transpiration (Zhao et al., 2012), the alfalfa canopy closes in advance as a consequence.
Furthermore, alternate partial root-zone irrigation has been proposed as a significant water-saving technology (Kang et al., 1997). Our study verified this by exploring the spatiotemporal characteristics of water status against the transpiration rate. Under the same levels of irrigation, the Tc, Tc-Ta, and CWSI of alfalfa under P were all lower than the values under R. Compared with R, every increasing 10 mm of irrigation resulted in the CWSI under P was reduced by 0.17, 0.08, and 0.04 (Table 2). Existing studies have already demonstrated that alternate partial root-zone irrigation can reduce deep soil water leakage significantly (Kang et al., 1997; Michael et al., 2018). This makes irrigation more uniform in soil and stimulates the growth of root hair and lateral roots, which enables alfalfa to absorb water more effectively and further results in lowering the Tc, lowering the CWSI, and stronger transpiration. Our study confirms that the mean transpiration rates of the P irrigation regime were higher than those of the R, with values of 0.09 mm/h, 0.05 mm/h, and 0.01 mm/h for P10, P20, and P30, respectively, compared to R10, R20, and R30 (Figure 6).
In addition, many field experiments have been carried out to determine the effects of alternate partial root-zone drip irrigation, and findings have shown that P can save 30–50% of irrigation water (Cheng et al., 2021), thus alleviating water stress and reducing the CWSI. Our study backs up this conclusion using UAV-based infrared thermal images. By exploring the improvement of transpiration rate as the amount of water saving, it was calculated that P saved 67.2, 18.4, and 4.6% of water under the irrigation quotas of 10 mm, 20 mm, and 30 mm, respectively. Transpiration for crops is regarded as beneficial water consumption in terms of irrigation water use (Zhou et al., 2021), and a higher transpiration rate has been directly connected with higher yield (Lopez-Lopez et al., 2018). Since the increment of the irrigation quota played a slightly positive role on the water-saving effect, we recommend the alternative root-zone irrigation method with a 20 mm irrigation quota for alfalfa.
More importantly, the significantly negative relationships between water status at 11:00 and the transpiration rate of alfalfa (p < 0.01) were noticeable, and our study further investigated this connection during the growth stages. The results presented a strong linear correlation (p < 0.001), and the fitting curve equations were expressed as T = –1.02*CWSI + 1.31 (R2 = 0.83) and T = –1.43*CWSI + 1.45 (R2 = 0.45) for the nutritional growth and reproductive growth stages, respectively. Regarding formulas quantified by other scholars based on field experiments, Xu et al. (2016) identified this connection with rice as T = –30.42*CWSI2 + 19.41*CWSI + 3.16 (R2 = 0.70) and Gonzalez-Dugo et al. (2019) calculated T = –4.58*CWSI + 5.36 (R2 = 0.97) for almond. These differences may be due to the variety of crops and regression methods.
Physiological processes such as the transpiration of crops are mainly carried out in leaf cells, affecting the growth, dry matter accumulation, and final yield of crops by producing various organic nutrients needed for plant growth and development, cooling crops, and providing transpiration pull for the root system to absorb water and nutrients (Xie, 2017). The applications of the relationship between the CWSI and T that we presented may range from precision crop irrigation management to prediction yield and even more ecologically based studies. Lopez-Lopez et al. (2018) presented a water production function for transpiration to estimate the yield of hard-shelled almonds, and later, Gonzalez-Dugo et al. (2019) combined their findings with this function to explore the possibility of estimating the yield of almond orchards, describing the predicted yield to the whole almond canopy scale through interpolation. In the context of precision agriculture, our findings suggest the promising ability to achieve accurate estimation of alfalfa yield on a large scale.
5 Conclusion
This paper demonstrates that the CWSI is a suitable indicator of alfalfa water status based on canopy temperature monitoring using UAV-based infrared thermal images. Our results can be summarized as follows:
1) The variability of the CWSI and T for alfalfa was different under various irrigation quotas. Compared with CK, for each increment of gradient (10 mm), the reduction of the CWSI was equivalent to 28.1% (57.9%), 54.4% (68.4%), and 70.2% (77.2%) under the R (P) irrigation scheduling. Meanwhile, T increased by 27.3% (51.6%), 53.6% (60.2%), and 60.9% (66.0%) under R (P) irrigation scheduling.
2) Alternate partial root-zone drip irrigation was confirmed as a water-saving method and ultimately saved 67.2, 18.4, and 4.6% of water under the irrigation quotas of 10 mm, 20 mm, and 30 mm, respectively. Ultimately, the P irrigation method was recommended to meet plant water requirements for alfalfa in arid and semiarid areas.
3) The CWSI was negatively correlated with the SWC and T. The fitting curve equations of the CWSI and T under the nutritional growth and reproductive growth stages were expressed as T = –1.02*CWSI + 1.31 (R2 = 0.83) and T = –1.43*CWSI + 1.45 (R2 = 0.45), respectively. The applications of this relationship may range from precision irrigation to yield prediction, and future study should interpret the feedback on alfalfa yield.
Data Availability Statement
The original contributions presented in the study are included in the article/Supplementary Material, further inquiries can be directed to the corresponding author.
Author Contributions
SL: Data curation, Formal analysis, Investigation, Methodology, Writing—original draft, Writing—review and editing. FT: Conceptualization, Funding acquisition, Methodology, Project administration, Resources, Supervision, Writing—original draft, Writing—review and editing. TZ: Validation, Data curation, Formal analysis, Investigation.
Conflict of Interest
The authors declare that the research was conducted in the absence of any commercial or financial relationships that could be construed as a potential conflict of interest.
Publisher’s Note
All claims expressed in this article are solely those of the authors and do not necessarily represent those of their affiliated organizations, or those of the publisher, the editors and the reviewers. Any product that may be evaluated in this article, or claim that may be made by its manufacturer, is not guaranteed or endorsed by the publisher.
Acknowledgments
We would like to acknowledgement for the data support from the International and regional cooperation and exchange projects of the National Natural Science Foundation of China (51961125205) and the National Natural Science Foundation of China (52179049).
References
Abdelaziz, B., Mohamed, F., Cherki, G., Rajae, K., Mustapha, F., Mustapha, B., et al. (2013). Assessment of Summer Drought Tolerance Variability in Mediterranean Alfalfa (Medicago Sativa L.) Cultivars under Moroccan Fields Conditions. Archives Agron. Soil Sci. 59, 147–160. doi:10.1080/03650340.2011.606216
Adnan, A., and Attila, Y. (2019). Evaluation of Crop Water Stress Index and Leaf Water Potential for Deficit Irrigation Management of Sprinkler-Irrigated Wheat. Irrig. Sci. 37, 61–77. doi:10.1007/s00271-018-0603-y
Ahongshangbam, J., Röll, A., Ellsäßer, F., Hendrayanto, , and Hölscher, D. (2020). Airborne Tree Crown Detection for Predicting Spatial Heterogeneity of Canopy Transpiration in a Tropical Rainforest. Remote Sens. 12 (4), 651. doi:10.3390/rs12040651
Cheng, M., Wang, H., Fan, J., Zhang, S., Liao, Z., Zhang, F., et al. (2021). A Global Meta-Analysis of Yield and Water Use Efficiency of Crops, Vegetables and Fruits under Full, Deficit and Alternate Partial Root-Zone Irrigation. Agric. Water Manag. 248, 106771. doi:10.1016/j.agwat.2021.106771
Deng, Z., Zhang, Q., Xu, J., Huang, L., Wen, X., Yu, R., et al. (2008). Research Progress of the Impact of Global Climate Warming on Crops in Gansu Province. Adv. Earth Sci. 23, 1070–1078.
Devin, L. M., Ajay, S., and Naiqian, Z. (2016). Development and Evaluation of Thermal Infrared Imaging System for High Spatial and Temporal Resolution Crop Water Stress Monitoring of Corn within a Greenhouse. Comput. Electron. Agric. 121, 149–159. doi:10.1016/j.compag.2015.12.007
Durigon, A., and de Jong van Lier, Q. (2013). Canopy Temperature versus Soil Water Pressure Head for the Prediction of Crop Water Stress. Agric. Water Manag. 127, 1–6. doi:10.1016/j.agwat.2013.05.014
García-Tejero, I. F., Rubio, A. E., Viñuela, I., Hernández, A., Gutiérrez-Gordillo, S., Rodríguez-Pleguezuelo, C. R., et al. (2018). Thermal Imaging at Plant Level to Assess the Crop-Water Status in Almond Trees (Cv. Guara) under Deficit Irrigation Strategies. Agric. Water Manag. 208, 176–186. doi:10.1016/j.agwat.2018.06.002
Gerhards, M., Schlerf, M., Mallick, K., and Udelhoven, T. (2019). Challenges and Future Perspectives of Multi-/Hyperspectral Thermal Infrared Remote Sensing for Crop Water-Stress Detection: A Review. Remote Sens. 11, 1240. doi:10.3390/rs11101240
Gonzalez-Dugo, V., Lopez-Lopez, M., Espadafor, M., Orgaz, F., Testi, L., Zarco-Tejada, P., et al. (2019). Transpiration from Canopy Temperature: Implications for the Assessment of Crop Yield in Almond Orchards. Eur. J. Agron. 105, 78–85. doi:10.1016/j.eja.2019.01.010
Gonzalez-Dugo, V., Zarco-Tejada, P. J., and Fereres, E. (2014). Applicability and Limitations of Using the Crop Water Stress Index as an Indicator of Water Deficits in Citrus Orchards. Agric. For. Meteorology 198-199, 94–104. doi:10.1016/j.agrformet.2014.08.003
Hou, M., Tian, F., Ortega-Farias, S., Riveros-Burgos, C., Zhang, T., and Lin., A. (2021). Estimation of Crop Transpiration and its Scale Effect Based on Ground and UAV Thermal Infrared Remote Sensing Images. Eur. J. Agron. 131, 126389. doi:10.1016/j.eja.2021.126389
Huang, Z., and Shan, L. (1998). Research Progression on Water Use Efficiency and its Physio-Ecological Mechanism. Eco-agriculture Res. 6, 21–25.
Idso, S. B. (1982). Non-water-stressed Baselines: A Key to Measuring and Interpreting Plant Water Stress. Agric. Meteorol. 27, 59–70. doi:10.1016/0002-1571(82)90020-6
Jiang, B., Zhitao, Z., Junying, C., Haiying, C., Chenfeng, C., Xianwen, L., et al. (2019). Simplified Evaluation of Cotton Water Stress Using High Resolution Unmanned Aerial Vehicle Thermal Imagery. Remote Sens. 11, 267. doi:10.3390/rs11030267
Jones, H. G., Manfred, S., Tiago, S., Claudia, D. S., Chaves, M. M., and Olga, M. G. (2002). Use of Infrared Thermography for Monitoring Stomatal Closure in the Field: Application to Grapevine. J. Exp. Bot. 53, 2249–2260. doi:10.1093/jxb/erf083
Jones, H. G. (1999). Use of Infrared Thermometry for Estimation of Stomatal Conductance as a Possible Aid to Irrigation Scheduling. Agric. For. Meteorology 95, 139–149. doi:10.1016/S0168-1923(99)00030-1
Kang, S., Zhang, J., Liang, Z., Hu, X., and Cai, H. (1997). Controlled Alternative Irrigation A New Approach for Water Saving Regulation in Farmland. Agric. Res. Arid Areas 55, 4–9.
Kou, D. (2014). Effects of Regulated Deficit and Subsurface Drip Irrigation on Alfalfa (Medicago Sativa L.) Yield, Quality and Water Consumption in Arid Area of Northwest China. Beijing, China: Beijing Forestry University. Thesis
Li, A., Liu, A., Du, X., Chen, J., Yin, M., Hu, H., et al. (2020). A Chromosome-Scale Genome Assembly of a Diploid Alfalfa, the Progenitor of Autotetraploid Alfalfa. Hortic. Res. 7, 194. doi:10.1038/s41438-020-00417-7
Li, B., Wang, T., and Sun, J. (2014). Crop Water Stress Index for Off-Season Greenhouse Green Peppers in Liaoning, China. Int. J. Agr. Biol. Eng. 7, 28–35. doi:10.3965/j.ijabe.20140703.004
Li, S., Kang, S., Zhang, L., Du, T., Tong, L., Risheng, D., et al. (2015). Ecosystem Water Use Efficiency for a Sparse Vineyard in Arid Northwest China. Agric. Water Manag. 148, 24–33. doi:10.1016/j.agwat.2014.08.011
Liu, J., Qi, G., Kang, Y., Ma, Y., and Li, Z. (2019). Effect of Water Stress in Bud Period on Photosynthetic Characteristics of Alfalfa. Ecol. Sci. 38, 195–200. doi:10.1016/j.agwat.2015.12.026
López-López, M., Espadafor, M., Testi, L., Lorite, I. J., Orgaz, F., and Fereres, E. (2018). Yield Response of Almond Trees to Transpiration Deficits. Irrig. Sci. 36, 111–120. doi:10.1007/s00271-018-0568-x
Luo, Y., and Cheng, Z. (2011). Impact of Water Stress on Leaf Water Potential, Transpiration Rate (Tr) and Stomatal Conductance (Gs) of Alfalfa. Acta Agrectir Sin. 19, 215–221. doi:10.11733/j.issn.1007-0435.2011.02.006
Meron, M., Tsipris, J., Orlov, V., Alchanatis, V., and Cohen, Y. (2010). Crop Water Stress Mapping for Site-specific Irrigation by Thermal Imagery and Artificial Reference Surfaces. Precis. Agric. 11, 148–162. doi:10.1007/s11119-009-9153-x
Michael, O. A., David, O. Y., Frederick, A. A., Paul, A. A., and Kwame, A. F. (2018). Meta-analysis of Crop Yields of Full, Deficit, and Partial Root-Zone Drying Irrigation. Agric. Water Manag. 197, 79–90. doi:10.1016/j.agwat.2017.11.019
Ortega-Farias, S., Esteban-Condori, W., Riveros-Burgos, C., Fuentes-Peñailillo, F., and Bardeen, M. (2021). Evaluation of a Two-Source Patch Model to Estimate Vineyard Energy Balance Using High-Resolution Thermal Images Acquired by an Unmanned Aerial Vehicle (UAV). Agric. For. Meteorology, 304–305, 108433. doi:10.1016/j.agrformet.2021.108433
Park, S., Dongryeol, R., Sigfredo, F., Hoam, C., Esther, H., and Mark, O. C. (2017). Adaptive Estimation of Crop Water Stress in Nectarine and Peach Orchards Using High-Resolution Imagery from an Unmanned Aerial Vehicle (UAV). Remote Sens. 9, 828. doi:10.3390/rs9080828
Qiu, G. Y., Yano, T., and Momii, K. (1998). An Improved Methodology to Measure Evaporation from Bare Soil Based on Comparison of Surface Temperature with a Dry Soil Surface. J. Hydrology 210, 93–105. doi:10.1016/s0022-1694(98)00174-7
Ray, D. J., William, P. K., and Bhaskar, J. C. (1988). A Reexamination of the Crop Water Stress Index. Irrig. Sci. 9, 309–317. doi:10.1007/BF00296705
Ricardo, D., Gábor, Ó., György, K., and Miklós, K. (2019). Enhancement of Ecological Field Experimental Research by Means of UAV Multispectral Sensing. Drones 3, 7. doi:10.3390/drones3010007
Romero, M., Luo, Y., Su, B., and Fuentes, S. (2018). Vineyard Water Status Estimation Using Multispectral Imagery from an Uav Platform and Machine Learning Algorithms for Irrigation Scheduling Management. Comput. Electron. Agric. 147, 109–117. doi:10.1016/j.compag.2018.02.013
Rosenberg, N. J., Blad, B. L., and Verma, S. B. (1983). Microclimate: The Biological Environment of Plants. New York: John Wiley & Sons.
Saloua, E., Naaila, O., and Laila, M. (2018). Soil Properties and Agro-Physiological Responses of Alfalfa (Medicago Sativa L.) Irrigated by Treated Domestic Wastewater. Agric. Water Manag. 202, 231–240. doi:10.1016/j.agwat.2018.02.003
Santesteban, L. G., Gennaro, S., Herrero-Langreo, A., Miranda, C., and Matesse, A. (2017). High-resolution UAV-Based Thermal Imaging to Estimate the Instantaneous and Seasonal Variability of Plant Water Status within a Vineyard. Agric. Water Manag. 183, 49–59. doi:10.1016/j.agwat.2016.08.026
Sepaskhah, A. R., and Ilampour, S. (1996). Relationships between Yield, Crop Water Stress Index (CWSI) and Transpiration of Cowpea (Vigna Sinensis L). Agronomie 16, 269–279. doi:10.1051/agro:19960501
Shu, L., Liu, R., Min, W., Wang, Y., Yu, H., Zhu, P., et al. (2020). Regulation of Soil Water Threshold on Tomato Plant Growth and Fruit Quality under Alternate Partial Root-Zone Drip Irrigation. Agric. Water Manag. 238, 106200. doi:10.1016/j.agwat.2020.106200
Sun, R., and Liu, C. (2003). A Review on Research of Land Surface Water and Heat Fluxes. Ying Yong Sheng Tai Xue Bao 14, 434–438. doi:10.13287/j.1001-9332.2003.0096
Susan, A. O., Steven, R. E., Paul, D. C., and Terry, A. H. (2012). A Crop Water Stress Index and Time Threshold for Automatic Irrigation Scheduling of Grain Sorghum. Agric. Water Manag. 107, 122–132. doi:10.1016/j.agwat.2012.01.018
Tanner, C. B. (1963). Plant Temperatures 1. Agron. J. 55, 210–211. doi:10.2134/agronj1963.00021962005500020043x
Tian, F., Qiu, G., Lü, Y., Yang, Y., and Xiong, Y. (2014). Use of High-Resolution Thermal Infrared Remote Sensing and "Three-Temperature Model" for Transpiration Monitoring in Arid Inland River Catchment. J. Hydrology 515, 307–315. doi:10.1016/j.jhydrol.2014.04.056
Wen, X., Wu, X., and Gao, M. (2017). Spatiotemporal Variability of Temperature and Precipitation in Gansu Province (Northwest China) during 1951-2015. Atmos. Res. 197, 132–149. doi:10.1016/j.atmosres.2017.07.001
Wu, Y., and Du, T. (2020). Estimating and Partitioning Evapotranspiration of Maize Farmland Based on Stable Oxygen Isotope. Trans. Chin. Soc. Agric. Eng. 36, 127–134. doi:10.1016/j.agrformet.2015.12.003
Xie, Q. (2017). The Effect of Irrigation on Alfalfa--Take Wuwei City for Example. Gansu: Lanzhou University, 46.
Xiong, Y., Zhao, S., Tian, F., and Qiu, G. (2015). An Evapotranspiration Product for Arid Regions Based on the Three-Temperature Model and Thermal Remote Sensing. J. Hydrol. 530, 392–404. doi:10.1016/j.jhydrol.2015.09.050
Xu, J., Lv, Y., Liu, X., Dalson, T., Yang, S., and Wu, J. (2016). Diagnosing Crop Water Stress of Rice Using Infra-red Thermal Imager under Water Deficit Condition. Ijab 18, 565–572. doi:10.17957/ijab/15.0125
Yu Qiu, G., Momii, K., Yano, T., and Lascano, R. J. (1999). Experimental Verification of a Mechanistic Model to Partition Evapotranspiration into Soil Water and Plant Evaporation. Agric. For. Meteorology 93, 79–93. doi:10.1016/s0168-1923(98)00115-4
Zhang, Y. (2017). Effects of Water Regulation in Growth Season on Growth and Water-Nitrogen Utilization of Spring Wheat in the Hexi Region. Beijing, China: Northwest Agriculture and Forestry University, 8–9.
Zhao, H. S., Liu, Y. S., Zhang, X. T., Guo, W., and Chen, J. (2012). Research on Early Fault Prediction of Wind Turbine Gearbox. Amr 608-609, 522–528. doi:10.4028/www.scientific.net/amr.608-609.522
Zhao, S., Yonghui, Y., Guoyu, Q., Qiming, Q., Yunjun, Y., Yujiu, X., et al. (2010). Remote Detection of Bare Soil Moisture Using a Surface-Temperature-Based Soil Evaporation Transfer Coefficient. Int. J. Appl. Earth Observation Geoinformation 12, 351–358. doi:10.1016/j.jag.2010.04.007
Zhao, X., Liu, C., Wang, X., and Xue, B. (2016). Assessment of the Vulnerability of Farmers' Livelihoods to Ecological Degradation in Arid Regions of a Continental River Basin: a Case Study of the Middle-Lower Reaches of the Shiyang River in China. Acta Ecol. Sin. 36, 4141–4151. doi:10.5846/stxb201506201250
Keywords: vegetation dynamics, alfalfa, alternate partial root-zone irrigation, UAV, water status
Citation: Lu S, Zhang T and Tian F (2022) Evaluation of Crop Water Status and Vegetation Dynamics For Alternate Partial Root-Zone Drip Irrigation of Alfalfa: Observation With an UAV Thermal Infrared Imagery. Front. Environ. Sci. 10:791982. doi: 10.3389/fenvs.2022.791982
Received: 09 October 2021; Accepted: 24 May 2022;
Published: 14 June 2022.
Edited by:
Christos H. Halios, Public Health England, United KingdomReviewed by:
Xiaodong Gao, Northwest A&F University, ChinaYaosheng Wang, Chinese Academy of Agricultural Sciences (CAAS), China
Paul Celicourt, Laval University, Canada
Copyright © 2022 Lu, Zhang and Tian. This is an open-access article distributed under the terms of the Creative Commons Attribution License (CC BY). The use, distribution or reproduction in other forums is permitted, provided the original author(s) and the copyright owner(s) are credited and that the original publication in this journal is cited, in accordance with accepted academic practice. No use, distribution or reproduction is permitted which does not comply with these terms.
*Correspondence: Fei Tian, tfxuan@126.com