Representation of Drought Events in the United Kingdom: Contrasting 200 years of News Texts and Rainfall Records
 Carmen Dayrell1*
  Cecilia Svensson2
  Jamie Hannaford2,3
  Tony McEnery1,4
  Lucy J. Barker2
  Helen Baker1
  Maliko Tanguy2
- 1ESRC Centre for Corpus Approaches to Social Science (CASS), Lancaster University, Lancaster, United Kingdom
- 2UK Centre for Ecology & Hydrology (UKCEH), Wallingford, United Kingdom
- 3Irish Climate Analysis and Research UnitS (ICARUS), Maynooth University, Maynooth, Ireland
- 4Changjiang chair at Xi’an Jiaotong University, Xi’an, China
This paper combines evidence from the analyses of large sets of newspaper material and long-term rainfall records to gain insights into representations of drought events in the United Kingdom, between 1800 and 2014. More specifically, we bring together two different, though complementary, approaches to trace longitudinal patterns in the ways drought events have been measured and perceived, focusing specifically on the duration, spatial extent, and intensity of each event. The power of the combined approach is demonstrated through three case studies (1911–1913, 1940–1945, and 1947–1949), in which we explore the available evidence in more detail and explore the impacts of the droughts upon the British population. Using corpus linguistics methods, we examined four sets of newspaper material: 1) the British Library 19th century newspaper corpus, 2) The Times 20th century corpus (both i and ii with over five billion words), 3) 4,986 texts from British broadsheet papers (3.8 million words) and 4) 2,384 texts from tabloids (1.1 million words). An independent analysis of meteorological drought was undertaken using three sources: 1) the England and Wales Precipitation (EWP) series (back to 1800), 2) a statistically reconstructed version of the EWP which is more reliable in the early record (pre-1870), and 3) a high resolution gridded dataset (back to 1862) which is aggregated to NUTS1 regional scales. Meteorological droughts were assessed using the Standardised Precipitation Index, which allowed us to appraise drought intensity, severity and duration. We found an overwhelming agreement between the corpus data and meteorological records. For the very few cases of disparity between the corpus and rainfall data, there were in most cases plausible explanations. All in all, the present study demonstrates the power of the combined approach, presenting evidence on a scale that would not otherwise be possible, thus contributing to a better understanding of how drought is perceived, in addition to how it is traditionally “measured”.
1 Introduction
Historical meteorological and hydrological records are the foundation of drought and water resources management. In the United Kingdom (UK), as elsewhere, water utilities and regulators have for a long time used the worst observed ‘drought of record’ to stress test drought plans and water supply systems (Environment Agency, 2015). Given concerns over climate change impacts on water availability, the “duty of resilience” (Water Act, 2014) now requires water utilities to test their resilience to events more extreme than those observed in past records (such as 1 in 200 or 1 in 500 years drought; Water Act, 2014). Risk estimation for such rare drought events, outside the envelope of past variability, requires simulation methods (typically stochastic simulations based on Weather Generators, e.g., Serinaldi and Kilsby, 2012)—but ultimately the credibility of these methods rests on a proper understanding of historical drought occurrence. Historical records are also an essential baseline of past hydroclimatic variability, against which changes due to anthropogenic warming can be identified and projected into the future.
The United Kingdom has a relative abundance of long-term meteorological records, and these have been used in drought assessments for many decades, as far back as Wright and Jones (1982). The seminal study of Marsh et al. (2007) identified major droughts in England and Wales back to the late 18th century, using selected rainfall records and other hydrometric datasets. These authors identified many 18th and 19th century droughts that were more severe than recent droughts. Jones and Lister (1998); Jones et al (2006) used long rainfall series to reconstruct streamflows back to the 1850s in 15 catchments in England and Wales and found broadly similar patterns. Barker et al. (2019) identified similar droughts with a comprehensive dataset of over 107 streamflow reconstructions across the United Kingdom. Other authors have adopted a more regional focus, often focusing on individual rain gauges but going back over very long periods. For example: Todd et al. (2013) for southeast England back to 1,697; Spraggs et al. (2015) for East Anglia back to 1798; Lennard et al. (2016) back to the 1880s in the Midlands; Harvey-Fishenden et al. (2019) for Chatsworth in the Peak District back to 1760.
One of the most important long-term rainfall records in the United Kingdom is the England & Wales precipitation (EWP) series (Wigley et al., 1984), which was used by many of the long-term drought assessments listed above. More recently, Murphy et al. (2020a) challenged the earlier parts of these records using an independent reconstructed approach and developed a reconstructed series for England and Wales, Scotland and Ireland, which were also used to identify “forgotten droughts” such as 1765–1768 and 1834–1836 (Murphy et al., 2020b).
While the United Kingdom has a good coverage of long rainfall records compared to many countries, there is still a relative sparsity of gauges in the 19th century and earlier. One of the issues with such long rainfall records is this sparseness coupled with likely biases in the earlier records (as exposed by Murphy et al., 2020a). There is therefore a significant benefit of evaluating drought histories from these records alongside independent sources of evidence.
Prior to the 20th century it is very difficult to corroborate rainfall or other hydroclimatic series as alternative sources become much more uncertain further back in time. Given the lack of readily available datasets, significant research effort is required to generate appropriate primary sources for comparison. Dendrochronology is beginning to provide a credible alternative (e.g., Loader et al., 2020) but has serious limitations (notably it is necessarily only available for the summer half year). For the most part, documentary sources provide one of the best approaches to examine historical droughts and compare them with rainfall datasets. Typically, such approaches have used a selective approach to find appropriate sources from archives, diaries, the news media and so on (e.g., Noone et al., 2017; Harvey-Fishenden et al., 2019; Murphy et al., 2020b).
The present study innovates by bringing together two fundamentally different, but complementary, approaches to trace past occurrences of drought events in the United Kingdom. We combined the analysis of long-term meteorological records with a corpus analysis of newspaper material, spanning from 1800 to 2014.
Past studies have typically identified precipitation droughts and then sought documentary evidence to confirm them. While useful, the approach opens up the possibility of confirmation bias. The corpus approach, in which large volumes of textual data (corpora, sg. corpus) is searched and processed to investigate a research question (McEnery and Hardie, 2012), provides a crucial advantage over previous studies. We analyse all the available data by means of corpus linguistics methods, rather than simply seeking corroboration, or otherwise, for one suspected drought. The method allows for large-scale observation, objectivity, consistency of analysis and the possibility to transform the frequency data gained from the corpus using statistical analyses to provide inference about issues such as representation. Importantly for this paper, the availability of substantial corpora covering long periods of time is greatly increasing, with organizations such as the British Library providing access to machine readable text of newspapers from the past.1
The present analysis builds on corpus analyses of the representation of drought in 19th century British newspapers in McEnery et al. (2019, 2021), which contrasted evidence gathered from corpus material against the hydrological evidence provided by Cole and Marsh (2006) and Marsh et al. (2007). McEnery et al. (2019, 2021) demonstrate the effectiveness of the corpus linguistic method to identify drought events in the United Kingdom during the 19th century, when rainfall records were sparse and fragmentary. While allowing us access to crucial information about past droughts, these analyses also identified droughts that had not been captured by hydrological approaches. In the present paper, we also take advantage of improved meteorological datasets and more robust statistical assessments of past drought severity than Cole and Marsh (2006) and Marsh et al. (2007). We use the Standardised Precipitation Index applied to annual (SPI-12) and seasonal (SPI-3) time scales, which roughly captures hydrological/groundwater droughts and agricultural droughts, respectively.
This paper innovates by presenting evidence of the representation of drought in UK newspapers with unprecedented scale and depth. By combining the evidence gathered from the newly-available corpus material with robust drought assessment from long-term meteorological records, we add both further insight and, at times, confidence to previous work on past occurrence of droughts in the United Kingdom, thus contributing to a better understanding of how drought is perceived, in addition to how it is traditionally “measured”. To demonstrate the power of the combined approach, we selected three points in time as case studies (1911–1913, 1940–1945, 1947–1949) and explored the available evidence in more detail, focusing on the duration, spatial extent, intensity, and impacts of each event (see Section 7 for details).
This paper is organised as follows. The first two sections detail the data and methods of analysis used for this study. We then provide an overview of results yielded by each approach (Section 4 and Section 5). Section 6 combines the results and is followed by a discussion of three case studies (Section 7). The paper concludes with a discussion on the strengths and contributions of the combined approach.
2 Data
2.1 Newspapers
We used four independent corpora to examine the discourse around drought in the UK press. In part this is to allow us access to a dataset with both range (covering a variety of newspapers where possible) and scale. However, our data represents a patchwork quilt. We are limited by the range of available data. To use corpus techniques, we need machine readable versions of the newspapers we wish to study. Digital newspapers are a late 20th century phenomenon—analysis of newspapers prior to that depends on the efforts of others who have undertaken digitization of printed materials by running optical character recognition (OCR) software across newspapers. Digitization efforts now mean that we are able to cover, with a varying range, the period from 1800 to the present.
For the 19th century, we used the British Library 19th Century newspaper collection. With over five billion words of data, the 19th Century Corpus contains a range of national and regional newspaper titles published from 1800 to 1899, although with some gaps in the data. These were caused by 1) not all titles being published throughout the century or 2) poor quality ink or paper rendering reasonably reliable OCR impossible. For most of the 20th century the range is narrower, as we have access only to one newspaper—The Times. The 20th Century Corpus therefore contains articles published by The Times between 1900 and 1999, which total over five billion words in 30,757 texts. From 1990 onwards, digital newspapers are the norm, so we were able to achieve a greater range. We used 4,986 articles (3.8 million words) published by major broadsheet newspapers (The Broadsheet Corpus) and 2,384 articles (1.1 million words) published by contemporary tabloids (The Tabloid Corpus).
Readers interested in a fuller description of the composition of each set and the methods and procedures required in the preparation of the texts should refer to: Baker et al. (2020a) and McEnery et al. (2019, 2021) for the 19th Century Corpus, Baker et al. (2020b) for the 20th Century Corpus, and (Dayrell et al., 2020a, 2020b) for the Broadsheet and Tabloid Corpora. The 19th and the 20th Century Corpora were processed using CQPweb, Lancaster University’s software platform for large-corpus analysis (Hardie, 2012). For the Broadsheet and Tabloid Corpora, we used the software package LancsBox (Brezina et al., 2015).
2.2 Rainfall Records
Several sources of precipitation data were used in this study. To provide a complete long record view of the whole 1800–2014 period, the monthly England & Wales Precipitation series (hereafter: EWP; Wigley et al., 1984)2 was used. In addition, for 1800–2000 we used a statistically reconstructed version of the EWP developed by (Murphy et al., 2020a; hereafter: M2020-EWP) which has been advanced as an alternative that is more reliable in the early record (pre-1870) due to significant underestimation of the EWP in this period (see Introduction). To provide a more detailed spatial picture, albeit for a shorter period 1862–2014, the gridded Historic Droughts (hereafter: HD) Standardised Precipitation Index dataset was used (Tanguy et al., 2017).
3 Methods
In this section, we describe the methods used by each approach separately: the corpus linguistic methods used to examine the newspaper material and the rainfall records used to identify meteorological droughts. We then explain the procedures for combining the two approaches.
3.1 Corpus Linguistics Methods
The corpus linguistic analysis started by calculating the relative frequency of the word ‘drought’ across each corpus. Small capitals indicate the different forms of the word (drought, droughts, droughty or drought-*) as well as the archaic form drouth(s) which was used between 1800 and 1950 and gradually died out throughout the 20th century.
The relative frequencies were calculated per year in relation to the overall number of words for the specific year, considering the frequency of drought per one million words for the 19th and 20th century data and per 10,000 words for the Broadsheet and Tabloid Corpora. This means that we have normalised the data to take into account size difference in individual years within each corpus. The different scales were needed because the corpora are of different nature. The 19th and 20th Century Corpora contain all issues published by the selected newspapers in a particular year whereas the Broadsheet and Tabloid Corpora contain only articles that make reference to droughts. As described in Section 3.3, we then transformed and combined these time series to obtain a single long time series covering the full study period, 1800–2014.
The frequency distribution of the word over time gives us a rough indication of the amount of attention that droughts have received in the UK press from 1800 to 2014. If we accept that newsworthiness is closely associated with the occurrence of a drought and that while the drought lasts it will remain newsworthy, we can assume that years in which the word drought was salient are the years when the United Kingdom experienced a drought. While these assumptions have been found to be generally true (McEnery et al., 2019, 2021), the approach may still produce some false positives, meaning that qualitative analysis is still necessary to confirm or refute the trends indicated by the initial figures. Close reading of the data is therefore needed to confirm whether the reporting was, in fact, about the existence of a drought in the United Kingdom in that specific point in time. We then examined the articles which were highlighted as being concerned with a drought in the United Kingdom to construct the newspaper narrative of a year of drought in terms of its duration, spatial extent, intensity and impacts. These procedures are illustrated more explicitly in the case studies (Section 7).
3.2 Rainfall Records
Here, we use the Standardised Precipitation Index (SPI) (McKee et al., 1993) to identify meteorological droughts. A key advantage of the SPI is that, by virtue of the standardisation process, it enables comparison between locations and between different times of year. The method transforms the original monthly precipitation data so that the SPI is symmetrically distributed around zero (with standard deviation = 1), with a negative SPI denoting drier than normal conditions and a positive SPI wetter than normal conditions. McKee et al. (1993) denotes 0 > SPI > −1.0 as mild drought, −1.0 ≥ SPI > −1.5 as moderate drought, −1.5 ≥ SPI > −2.0 as severe drought and SPI ≤ −2.0 as extreme drought.
The SPI is flexible in that precipitation can be aggregated across a range of timescales (e.g., 1, 3, 6, 12 months), which are relevant for different types of drought impacts. Typically, droughts can be observed in precipitation deficits before soils (agricultural drought), streamflow (hydrological drought) and groundwater. The approach to computing the SPI is described elsewhere (e.g., Svensson et al., 2017). The SPI is fitted here using the Gamma distribution, using the SCI package in R (Gudmundsson and Stagge, 2016) and using the 1961–2010 period for estimating the standardisation parameters (1961–2000 for the M2020-EWP data). We focus on the SPI-12 and SPI-3 (i.e., 12- and 3-months aggregations), with the former representing an approximately annual, long duration drought timescale, and the latter an approximately seasonal timescale. SPI aggregations are referred to with the final month in the accumulation. For example, the August 1976 SPI-12 refers to the aggregation from September 1975 to August 1976.
First, for the EWP and M2020-EWP data, the SPI was calculated for the entire monthly precipitation series, resulting in monthly SPI time series. For the HD dataset, the SPI were spatially averaged for each of the twelve UK Nomenclature of Territorial Units for Statistics 1 (NUTS1) regions. NUTS regions (at different levels of spatial aggregation such as the relatively large NUTS1 regions) are defined standard geographical regions in the European Union3.
Drought events were then identified and characterised using criteria set out in Barker et al. (2019), based on event characteristics defined by Noone et al. (2017). Drought events were defined as three or more consecutive months with negative SPI values, with at least 1 month in the suite of negative values falling below a threshold of −1.5 (equating to “severe” drought; Barker et al., 2016). For each extracted event, the following event characteristics were calculated (see Figure 1):
– Duration (number of months),
– Accumulated deficit (the absolute value of the sum of SPI values across the event duration),
– Mean deficit (accumulated deficit divided by duration), and
– Maximum intensity (the minimum SPI value during the event).
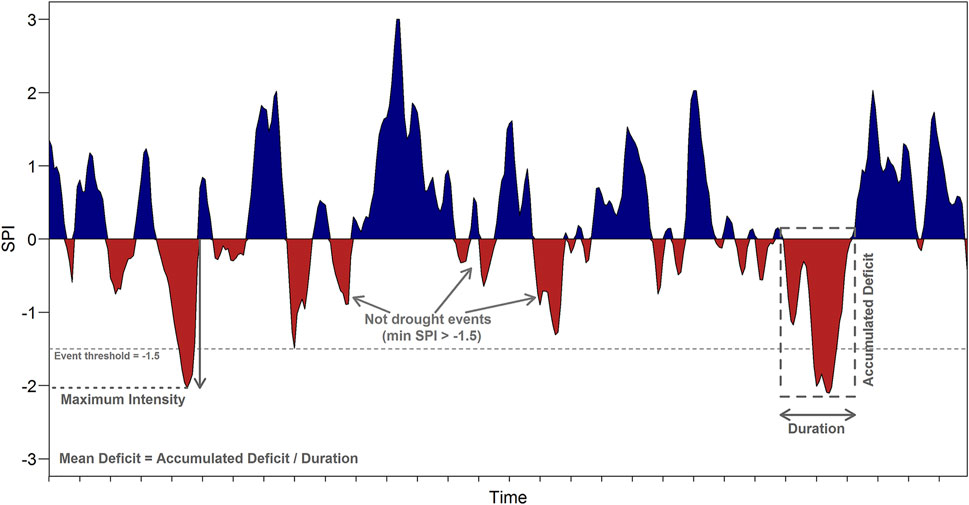
FIGURE 1. Conceptual diagram illustrating drought event identification and characteristics (NB x axis ticks represent years, but SPI data are on a monthly time step).
Due to the seasonal focus of the study, events with a duration of less than 3 months (i.e., one or two months) were removed. As the accumulated deficit and mean deficit were derived from the SPI, they represent relative deficits and not absolute precipitation deficits (for example, as millimetres or a volume). The extracted events were ranked by each event characteristic (i.e., duration, accumulated deficit, mean deficit and maximum intensity), separately. The top 10 events for each characteristic and accumulation period were identified for the HD dataset, whilst for the SPI derived from EWP/M2020-EWP the top 15 events were extracted given the substantially longer series. When ranking by duration, tied events were also sorted by the accumulated deficit, so the longest events with the most severe accumulated deficit ranked highest.
3.3 Combining the Two Approaches
We combined the two approaches by 1) carrying out a correlation analysis, 2) extracting extreme events from both types of data and comparing them in a table, and 3) through case studies.
3.3.1 Correlation Analysis
A simple visual comparison of how the corpus and climate datasets corresponded to each other was made by overlaying the two time series in a single plot. These time series were then used to carry out an objective numerical correlation analysis.
It is important to note that the four different corpora are based on different underlying source data, and their scales (frequencies of occurrence of the word drought) are different. The four datasets were therefore normalised so that they all had a mean of zero and a standard deviation of one before they were concatenated into a single corpus series, as described below. There also seems to be a trend in the frequencies with time for the original corpus data (Figure 2)—particularly for the 19th Century Corpus—which may affect both the magnitude of the peaks and the background “noise”. The 19th century Corpus data is made up of data from eight different newspaper titles, some of which are regionally focused. This means that coverage of drought may have been driven, or influenced, by the interests of a specific region—for example, an emphasis on the impact of a drought on agricultural yields. What is more, fewer titles were available for the beginning of the century. These inhomogeneities meant that we considered the increasing frequencies to be an artefact of the data, and we de-trended each corpus dataset separately.
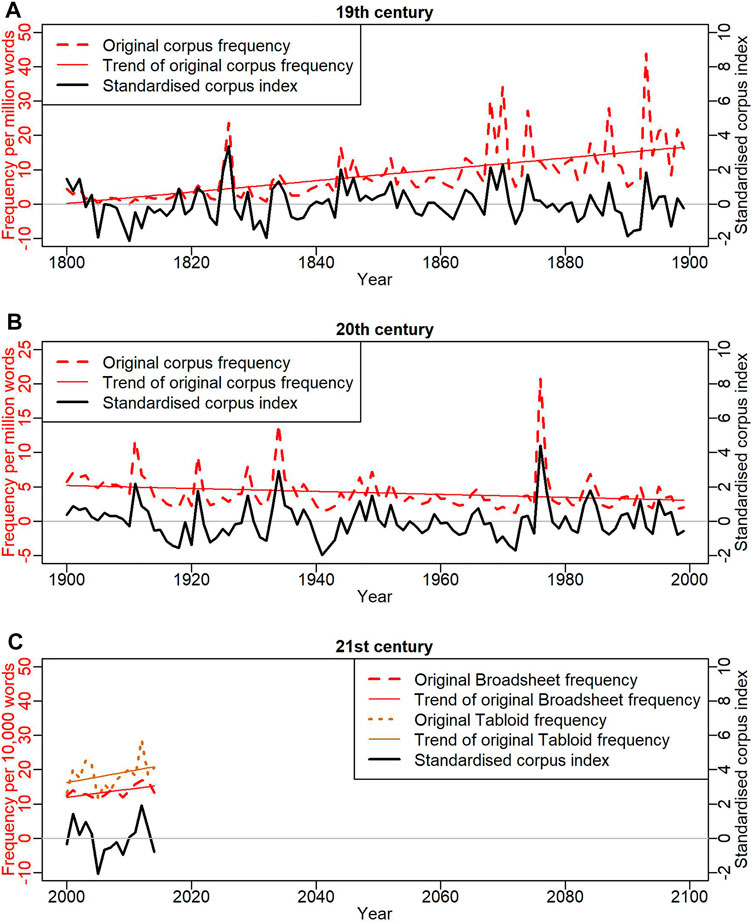
FIGURE 2. Relative frequencies of the word drought and the corresponding standardised corpus index for (A) The 19th Century Corpus, (B) The 20th Century Corpus and (C) The 21st Century Corpus (with the Broadsheet and Tabloid corpora combined).
Once all the datasets followed the same distribution, they were concatenated into a single series from 1800 to 2014, providing a standardised corpus index series. To achieve this, five steps were carried out:
(1) Log-transform the data to make the distribution symmetrical.
(2) De-trend the data to remove, for example, the upward trend with time during the 19th century (see Figure 2).
(3) Standardise the data so that the distribution has a mean = 0 and a standard deviation = 1.
(4) Average the Tabloid and Broadsheet data, which have been transformed according to Steps 1–3. This new averaged time series was then re-standardised according to Step 3, as the averaging would have shrunk the variance to be less than one.
(5) Finally, concatenate the 19th, 20th, and 21st century time series into a single long time series, 1800–2014.
Step 1 was carried out because the original corpus data have a positive skewness. That is, there are several very large values (creating a long upper “tail” to the distribution) but no correspondingly extreme small values, as the frequencies have a lower bound at zero. To remove the skewness and create a more symmetric distribution, the data were log-transformed. Before the log-transform was applied, a small number (1.0) was added to all the values to avoid taking the logarithm of zero (which is mathematically undefined). This did not affect the final results however, as in Step 3 we shift the distribution to have a mean = 0.
In Step 2, we removed any linear trend from the data by carrying out a linear regression and replacing the original data values with the residuals from the linear regression. In Step 3, we standardised the residuals by first subtracting their mean and then dividing by their standard deviation. As a result of these steps, each individual corpus series had a normal distribution with mean = 0 and standard deviation = 1, i.e., a N (0,1) distribution.
The SPI time series are by definition normally distributed, but we de-trended them as described in Step 2 above. Using the SPI time series and the single long corpus time series, we explored how these two datasets relate to each other, both visually (in time series plots) and numerically. For the objective numerical analysis, we used the Pearson correlation coefficient, as the data are normally distributed. There was significant autocorrelation in the corpus data for a lag of 1 year (=0.25 at the 5% level for a two-sided test). As such, we used a block permutation method (e.g., Hesterberg et al., 2005) to estimate significance levels for the cross-correlations between the corpus and SPI data. A two-year block size and 999 resamples were used for a one-sided significance test.
We used different subsets of the SPI-12 and SPI-3 datasets for the cross-correlation analysis with the corpus data. Using only the time series of December SPI-12, rather than the complete SPI-12 time series, results in a single annual value that is completely concurrent with the annual (January–December) corpus data. We also investigated different lags for the SPI-12 series, as newspaper reporting may lag the developing drought. For example, the annual time series of SPI-12 to November covers the 12-month period that precedes the corpus series by 1 month, the annual time series of SPI-12 to October precedes the corpus series by 2 months, etc. For the SPI-3 data, we extracted the annual minimum SPI-3 from all the twelve SPI-3 values in each year to capture the driest 3-month period within each year, assuming newspapers may find short and sharp droughts equally newsworthy as longer ones. There is a short lag of 2 months implicit in this analysis, as the minima are extracted from the SPI-3 aggregations ending in the calendar months January to December (i.e., start months from November to October).
3.3.2 Comparing Droughts in a Tabular Format
In addition to the correlation analysis, which takes into account the data from all years in the data series, we also analysed how the most extreme years in the corpus and the SPI datasets matched up. Using the original corpus data (i.e., not de-trended and standardised), we listed the years for which the word drought showed the highest frequencies in each corpus: top 15 in each the 19th and the 20th Century Corpora and top five frequencies in each of the Broadsheet and Tabloid Corpora, given the latter corpora cover a shorter period of time. These thresholds were established to keep the analysis manageable while ensuring that we would not overlook events that received reasonable attention in the press. Similarly, we listed all years for which the EWP SPI-12 rainfall records fell below −2 and hence indicated the occurrence of an extreme drought in the United Kingdom.
The next step was to combine the results in a table format. We retrieved the frequency of drought for all years for which the rainfall records indicated the occurrence of a drought, irrespective of its saliency in the corpus. Similarly, we examined the rainfall records for years in which drought peaked in the newspaper data, regardless the severity of the meteorological drought. Here, the goal was to determine 1) whether the peaks in the corpus material corresponded to meteorological droughts in the United Kingdom and 2) whether there were any meteorological droughts not captured by the corpus records. The process was thus iterative, moving from one type of data to another until we had results from both approaches for all selected years and any divergence between results was examined further. This included, for example, further investigating the state of the concurrent seasonal SPI-3 droughts (both severe and extreme). We anticipate that while comprehensive, the method may still have left out events that were not as prominent in either approach.
3.3.3 Case Studies
To demonstrate the power of the combined approach, we carried out three different case studies for the years: 1911–1913, 1940–1945, and 1947–1949. Here, we analysed the discourse through close reading of the corpus material and combined the results with the hydrological evidence gathered from the rainfall records for those specific years.
4 Results
This section starts by presenting the results of each approach separately. Section 4.1 offers an overview of the references to drought events in UK newspapers and Section 4.2 presents the precipitation records for the period under analysis. We then combine the two approaches in Section 4.3.
4.1 References to Drought in the UK Press
Figure 2 shows how the relative frequency of the word drought fluctuated throughout time. Note that the y-axis scale changes from one figure panel to another. There are several unequivocal peaks throughout the centuries, and a number of other smaller peaks which are less well defined. The specific years of these peaks are listed in Supplementary Appendix S1. Importantly, the frequency distribution of the word drought is only an initial indication of the reporting of a drought event. As explained in Section 3.1, close reading of the material is needed in order to confirm, or refute, the occurrence of a drought indicated here.
4.2 Rainfall Records
Figure 3 shows the relative severity of precipitation droughts in the regional SPI-12 series for the HD dataset. Across this dataset, the same droughts as identified in previous studies emerge, e.g., 1975–1976, 1933–1934, 1921–1922 and the “Long Drought” period from the late 1880s to about 1910 (Marsh et al., 2007; Barker et al., 2019).
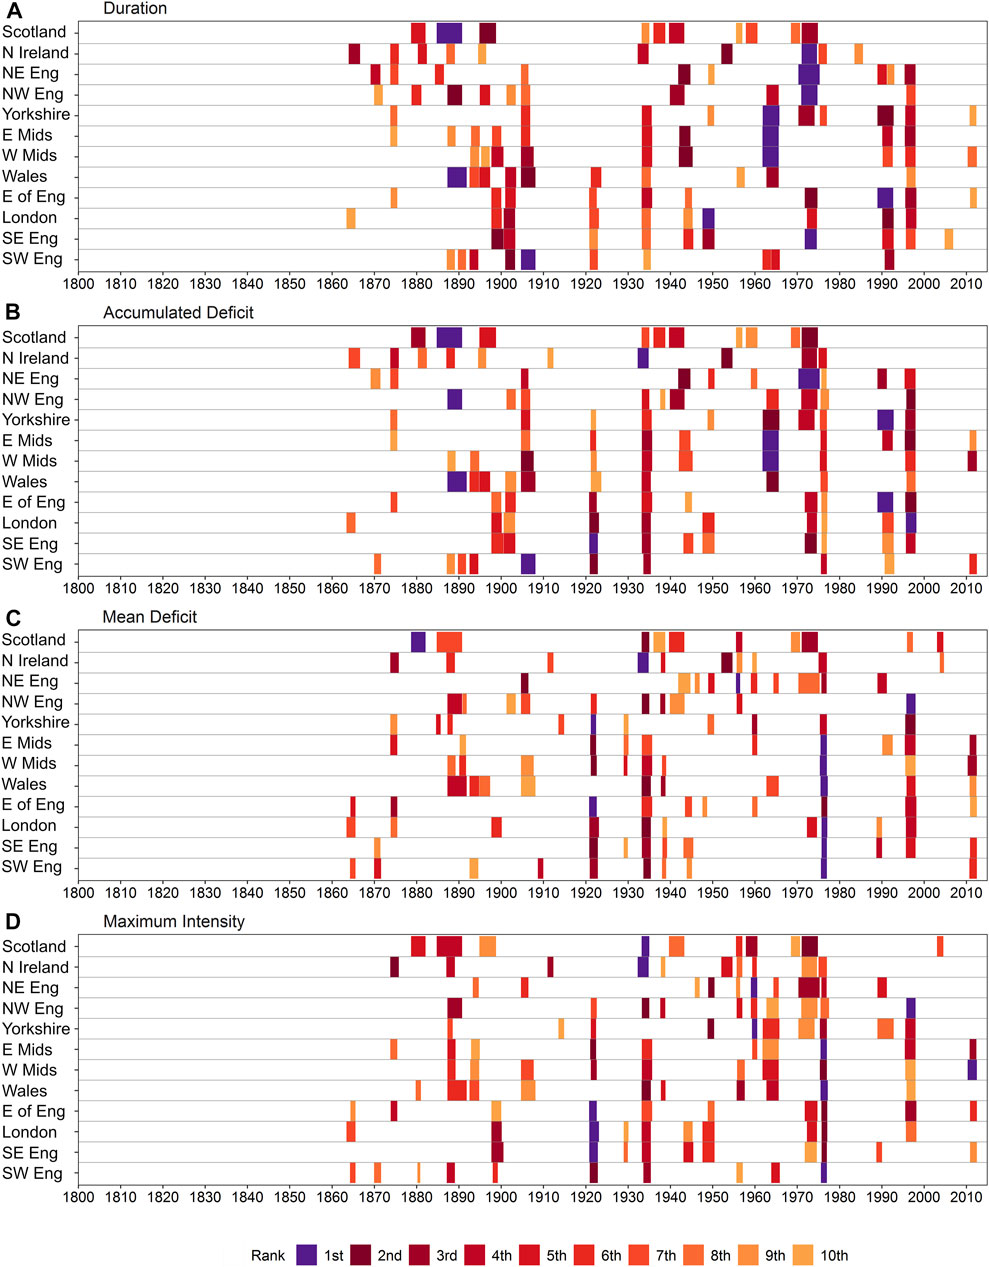
FIGURE 3. Top 10 extracted drought events for the HD SPI-12 series from 1862 to 2014 using a threshold of −1.5, for UK NUTS1 regions which are ordered roughly from north to south on the y-axis. For each region and drought characteristic, the bars are coloured according to the event rank; darker shades represent high-ranking, i.e., more severe, events.
For duration, the most severe events are actually the early 1970s (1973–1974)—rather than the well-known 1975–1976 event, the 1960s, the 1990s for many regions, and periods within the “Long Drought”. The years 1933–1934 also feature prominently. These events also occur in the accumulated deficit series, although this features greater rankings for 1933–1934 and 1921–1922 (in southern England), while 1975–76 is also featured. These three latter events, along with 1995–1997, are also the most prominent for mean deficit and intensity. The corresponding figure for the SPI-3 accumulation is shown in Supplementary Figure A2.1.
Figure 4 shows the relative severity of precipitation droughts for the EWP and the M2020-EWP dataset according to the four event characteristics. While some of the most severe 20th century droughts shown in HD dataset are also represented (1920s, 1930s, 1976, in Figure 3), there are fewer droughts in the post-1976 era. The 19th century sees the major drought of the 1850s which pre-dates HD. This appears as the worst drought according to duration and accumulated deficit, and also features in the rankings of other characteristics. In addition, there are several prominent droughts in the early 1800s.
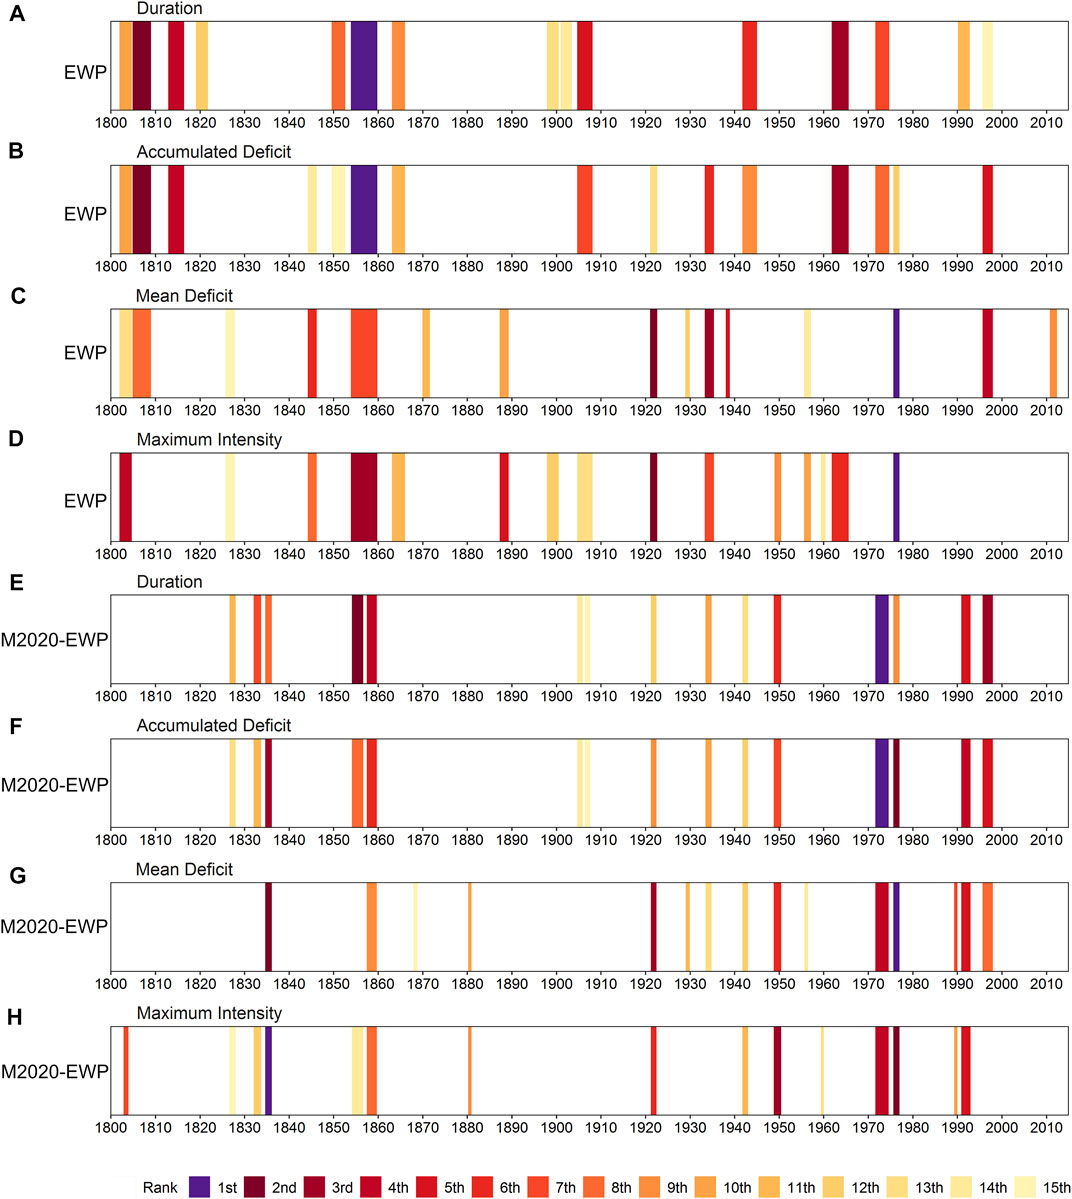
FIGURE 4. Top 15 extracted drought events for SPI-12 derived from the 1800–2014 EWP series (A–D) and the 1800–2000 M202020-EWP series (E–H) using a threshold of −1.5. For each of the four drought characteristics, the bars are coloured according to the event rank; darker shades represent high-ranking, i.e., more severe, events.
There are significant differences in the M2020-EWP compared with the EWP. An immediately obvious discrepancy is in the duration of the droughts, which are considerably longer for the original EWP dataset (Figure 4A) than for the M2020-EWP reconstruction (Figure 4E). Taking all the identified droughts into consideration (not just the top-ranking 15), the average duration of the SPI-12 EWP droughts is 25.2 months compared with 16.8 months for the M2020-EWP droughts. For the SPI-3 accumulation, the average durations are 6.9 and 6.3 months, respectively.
For example, a drought around 1850 is present in the EWP, but not in the M2020-EWP. Further, Murphy et al. (2020a) identified the 1830s as experiencing a very severe drought in terms of intensity (the most severe on record) but that does not feature in the EWP. This is also apparent in the corresponding analysis of the shorter, and often sharper, droughts of the SPI-3 series (Supplementary Figure A2.2). However, the droughts of the early 1800s do not feature at all in M2020-EWP, and instead much higher rankings are attained by more recent droughts—notably those of the 1970s and 1990s.
4.3 Cross-Correlation Analysis of the Corpus and SPI Time Series
Figure 5 shows the concatenated, de-trended and standardised corpus time series (January-December) and the lagged time series of August SPI-12 (i.e., covering the 12-month period from September-August). It can therefore potentially capture a dry winter with no recharge to reservoirs or groundwater, followed by a dry summer. This would be very newsworthy as many major droughts (in the English lowlands especially) are associated with dry winters, even if the impacts typically become manifest in the following summer. For the EWP data, the cross-correlation is strongest for this four-month lag (r = −0.29, significant at the 0.001 level), whereas for the reconstructed M2020-EWP data the correlation is marginally stronger for the SPI-12 series to September (but still rounding to r = −0.26, significant at the 0.002 level). The lag may also reflect a delay in the newspaper reporting until the droughts are properly underway, as discussed later in this section.
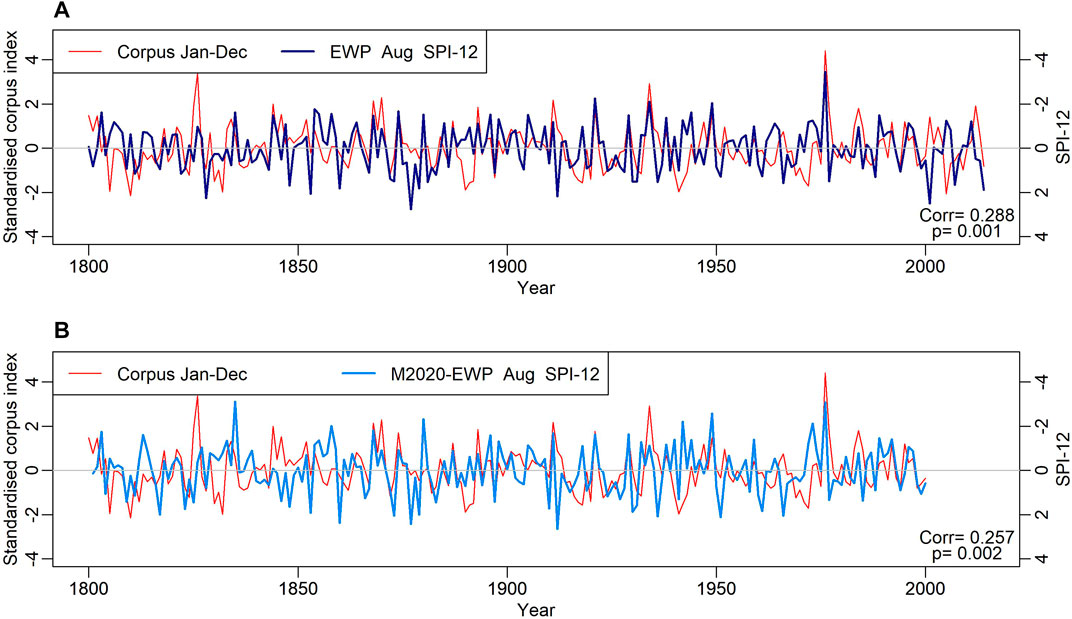
FIGURE 5. Time series of standardised annual corpus linguistics data and of August SPI-12, i.e., the 12-month period preceding the January—December corpus data by 4 months. The SPI-12 is calculated from the EWP data, and from the M2020-EWP data. Note that the scale for the SPI-12 (right-hand side) is reversed in order to overlay the corpus data as well as possible. To reflect this in positive correlations, the SPI-12 data were multiplied by -1.
Figure 6 shows the corpus time series versus the annual minimum SPI-3, which captures precipitation droughts of a shorter duration than SPI-12. Here, the cross-correlation with the corpus series is stronger for the reconstructed M2020-EWP series (r = −0.30) than for the original EWP (r = −0.28). Particularly, the M2020-EWP series reconstruction is in better agreement with the newspaper coverage of droughts in the early 19th century. Murphy et al. (2020a) identified this period in the original EWP series as having too low winter precipitation due to gauge under-catch of snowfall and a high incidence of snow (pre-1870), and as having too high summer precipitation totals (pre-1820) probably due to a low station network density and less certain data at key stations. However, there is a prolonged period in the 1840s where the M2020-EWP differs from both the corpus data and the original EWP (Figures 5, 6).
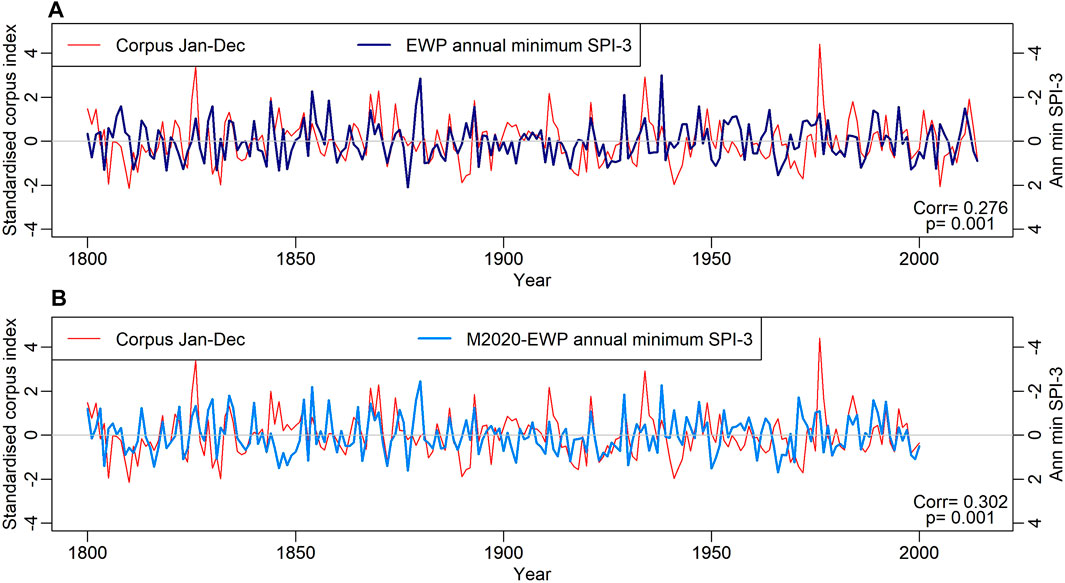
FIGURE 6. Time series of standardised annual corpus linguistics data and of annual minimum SPI-3. The SPI-3 is calculated from the EWP data, and from the M2020-EWP data. Note that the scale for the SPI-3 (right-hand side) is reversed in order to overlay the corpus data as well as possible. To reflect this in positive correlations, the SPI-3 data were multiplied by −1.
In Supplementary Appendix S1, we list all years for which at least one approach indicated the occurrence of a drought event in the United Kingdom between 1800 and 2014, providing the relative frequency of the word drought in the corpus and the rainfall record for each year.
5 Discussion
Overall, we found a general agreement between the corpus data and the rainfall records. In the vast majority of cases, there is supporting evidence of drought in the precipitation records when the frequency of the word drought increases in the newspaper corpora. For example, for the 1933–1935 period, precipitation records indicate that a severe drought started to affect most of the United Kingdom towards the end of 1933, persisted throughout 1934 and continued in some parts of England in 1935. The relative frequency of the word drought doubled between 1932 and 1933 (from 2.3 to 5.5 occurrences per one million words), peaked high in 1934 (14.1 occurrences), and dropped to the previous level in 1935 (6.0 occurrences).
However, it is important to note that the frequency of drought does not always reflect the intensity and/or spatial extent of an event. For example, the precipitation records indicate a severe drought across most of the United Kingdom for the first half of 1956, but the frequency of drought did not spike in that specific year (3.1 instances per a million words). Although evidence was not substantial, the corpus data confirms that a severe drought affected many parts of the United Kingdom in 1956. There was a report on a drought in the southwest due to a dry and sunny March (The Times, 02.04.1956), and another on an absolute drought in East Anglia and shortage of water supplies in Glasgow in early May (The Times, 08.05.1956). Also, despite the low relative frequency of drought in 1964 (2.4 instances), The Times did mention a severe winter drought in February (Extract 1) and again in November.
1) Weekly instead of daily baths were urged on Nottingham’s population today to avoid water rationing in Britain’s driest winter drought for 35 years. (The Times, 17.02.1964)
A plausible explanation for these cases is the measure of newsworthiness. Mentions in a newspaper may be related to the competing news values operating at a given time since, as Bednarek and Caple (2017: 35) observe, news values influence selection, drive coverage and dominance practice. There is also likely a lag between the precipitation deficit being observed and the drought impacts reported. Firstly, because it takes some time for soil-, surface- and groundwater stores to be depleted, typically several months before river flows in southeast Britain are affected (Barker et al., 2016). Secondly, drought impacts may go unreported during the early stages of a drought, but once it is established the reporting may be more complete (Bachmair et al., 2016). The year of 1912 is a clear example. Despite the salient frequency of drought, references are mostly attributed to discussions of the impacts of the 1911 drought.
For three occasions (1803, 1805, 1827), there were long-lasting extreme droughts in the EWP dataset that did not seem to have been reported in the press. This may be because, before 1870, the EWP dataset likely under-estimates the amount of winter precipitation falling (Murphy et al., 2020a). The potential gauge under-catch of snowfall, and higher incidence of snowfall, during this period are accounted for in the M2020-EWP reconstructions, which show a closer similarity to the corpus data (Figure 5B and Figure 6B). But the apparent under-reporting in the newspapers may be also related to gaps in the 19th century data (see McEnery et al., 2019, 2021). For these specific years, the corpus contains texts from the Ipswich Journal and Hampshire Chronicle only and there was hardly any occurrences of drought in them.
There were also five cases (1846, 1903, 1912, 2013, and 2014) for which the word drought peaked in the corpus data but the precipitation metric used in this study did not indicate the occurrence of a drought. With the exception of 1903, all other 4 years are false positives, that is, there was hardly any evidence in the corpus material that the United Kingdom experienced a drought in those years. In 1912, 2013, and 2014, many references to drought were attributed to discussions around the impacts of a drought in previous years (1911 and 2012, respectively). In 1846 as well as in 2013 and 2014, the word drought was frequently mentioned in contexts other than a meteorological drought, such as in relation to drought-resistant plants or extreme weather events due to climate change. Although scanty, there is evidence in the corpus data that the whole of Scotland, north England and parts of Wales were affected by a drought in 1903 (Extract 2).
2) Scotland, even more that than Wales, was afflicted by drought and cold in the spring and early summer of the present year (The Times, 10.08.1903)
It is also important to note that McEnery et al. (2019, 2021) has indicated four other droughts during the 19th century which were not captured by the precipitation-based classification of major droughts of Marsh et al. (2007). These droughts occurred: 1) in Scotland in 1821, spreading to other parts of the country in 1822; 2) in Southern England in 1834; 3) in Scotland in 1850, developing to southern England in 1851 and on to northern England in 1852; 4) across England, Scotland and perhaps parts of Wales in 1880, persisting in southeast England in the summer of 1881. They are not shown in Supplementary Table A1.1 because the frequency of drought fell below the frequency threshold used in this study (i.e. top 15, see Section 3.3), and there was no extreme drought (SPI < 2) in the EWP SPI-12 time series.
However, there are severe, and even extreme, droughts in the SPI-3 time series in either or both of the original EWP and the reconstructed M2020-EWP datasets for all of these four time periods (and in the HD dataset for the latter). Neither of the datasets covers Scotland in the early part of the 19th century, but the M2020-EWP dataset confirm that there is a moderate to extreme SPI-3 drought from March to June 1822. Both the original EWP and the M2019-EWP SPI-3 series show two to three consecutive months of severe or extreme drought bookending the period April 1834 to January 1835, and this was highlighted by Murphy et al. (2020b) as a “forgotten drought” alongside various documentary/newspaper sources of impacts. The original EWP series show severe drought for a single SPI-3 accumulation in March 1850 and for November to December 1851, and both the EWP and M2019-EWP series show extreme drought for the SPI-3 accumulations ending in April and May 1852. The regional HD dataset show extreme drought in the SPI-3 records for all of the United Kingdom in December 1879 and January 1880, and severe to extreme SPI-12 drought in northern and western parts from August to October 1880. However, there is only moderate SPI-3 drought in southern England in summer 1881.
6 Case Studies
We now explore three periods of time in more detail. Given that many other drought events such as the 1920s and 1930s are well covered in previous literature, these specific periods were chosen mainly for the lack of information about them. At the same time, they illustrate the richness of the corpus approach, especially when combined with the meteorological observations, by providing significant detail on regional differences and fine-scale temporal evolution of the droughts. They are:
(1) The years of 1911 and 1913: While the frequency of the word drought peaked in 1911 (third highest frequency in the 20th century) and figured on the 15th place rankings in 1913, the meteorological data suggest that shorter regional droughts occurred during these years, rather than extreme and long-lasting drought (except in Northern Ireland in 1911).
(2) The period between 1940 and 1945: The frequency of drought between 1940 and 1945 was among the lowest in the 20th century corpus (see Figure 2). This is perhaps not surprising, given that the country was at war. Competition for the available space in the press would have been fierce. However, the meteorological data suggest some rather long-lasting droughts did occur (e.g., Figures 3, 4).
(3) The years of 1947 and 1949: These are years in which the two approaches coincide. The frequency of drought ranked 13th and 6th places in the 20th century respectively and the rainfall records indicate meteorological droughts occurred.
In the following descriptions the meteorological droughts are assessed based on the complete monthly time series of SPI-3 and SPI-12 from the regional HD dataset. Heatmaps of the HD dataset for the 3 and 12-months accumulations are shown in Figure 7 for the period from 1910 to 1950.
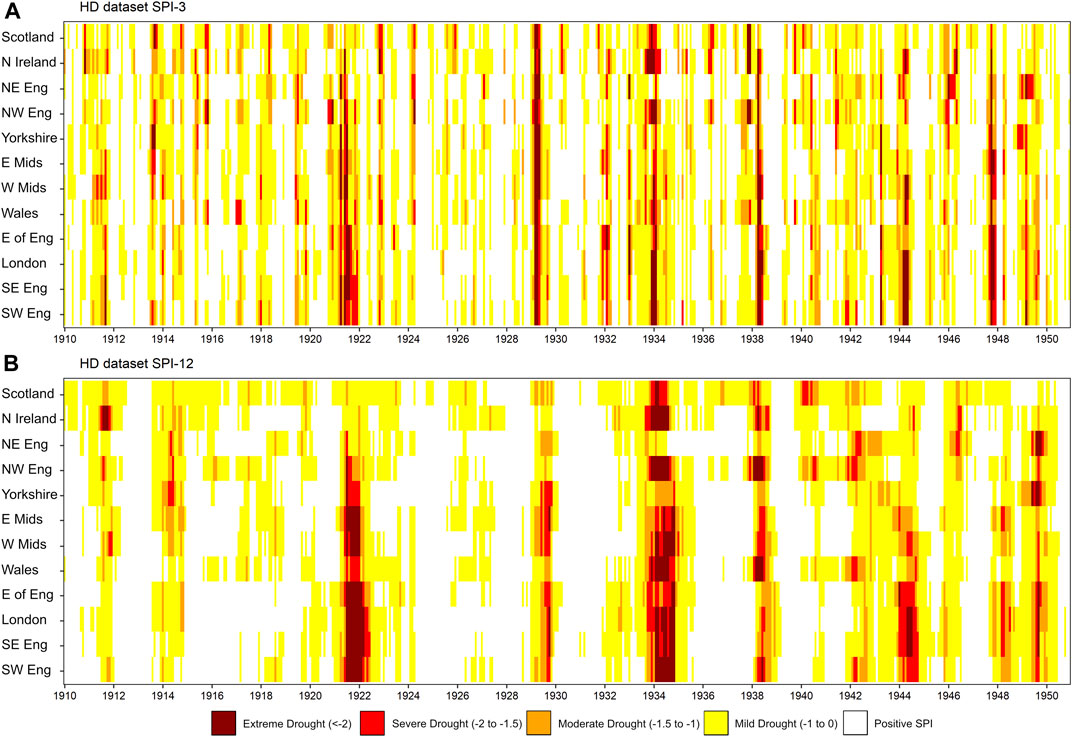
FIGURE 7. Heat maps of the HD dataset from 1910 to 1950, showing continuous monthly time series of SPI accumulations of 3 (A) and 12 (B) months for UK NUTS1 regions which are ordered roughly from north to south on the y-axis. Darker shades indicate lower SPI values, i.e., more extreme precipitation deficits.
6.1 The years of 1911 and 1913
Based on the HD SPI-3 records, two relatively short droughts occurred in 1911 and 1913, the first affecting mainly the south of England and the Midlands, and the second mainly the north and the west of the United Kingdom (Figure 7A). These regional records suggest that normal to moderately dry conditions (∼0 > SPI-3 > −1) occurred across most of the United Kingdom from February to October 1911 (i.e., in the 3-month periods ending in these months). However, severe drought (SPI-3 < −1.5) spread from the west Midlands, where it occurred intermittently from May to September, to cover all of the Midlands and southern England in September. Northern Ireland experienced severe drought in the 3-month period to October, but more importantly, the SPI-12 records show that the prolonged period of moderately dry conditions had accumulated into extreme drought in the SPI-12 accumulations ending in August to October 1911 (Figure 7B). This was followed by a wet period from November 1911 to June 1913, when the regional SPI-3s were largely positive across the United Kingdom. However, mild to moderate drought conditions then again developed swiftly across most of the country for the SPI-3 accumulation to July 1913, reaching severe or extreme levels in parts of the north and west (including southwest England) from August to October. By November 1913 the SPI-3 conditions were again more normal.
In the corpus data, references to drought indicated that a drought began in the 1911 spring and continued into summer, affecting mostly southern Britain. The Times first reported that the country was suffering from drought on 27 April 1911; by June, the situation had become more serious (Extract 3). A different article from the same day stated that the worst hit counties were Cambridgeshire, Worcestershire, and Cheshire, where it was feared that both the hay and the corn crops would be short.
3) In many English districts less than half an inch of rain has fallen during the past four weeks, and in some places less than a quarter of an inch. (The Times, 05.06.1911)
By July, the drought had affected the prices of Hampshire and Dorset Down ewes (The Times, 17.07.1911) and the south of England was reported to have experienced a severe drought which resulted in deficiency of grass, thus endangering the milk supply (The Times, 24.07.1911). The effect on crops, meanwhile, was described as being more varied (Extract 4).
4) The corn has ripened rapidly and the binders are hard at work, and on account of the continued hot weather carting will be practicable a few days after cutting. Mangel wurzel have done very well, but swedes and kale have practically failed on account of the drought. There are fair supplies of cabbage and rape for the sheep, but the former have not hearted well for want of rain. (The Times, 31.07.1911).
The droughty weather had continued to affect parts of southern England throughout August, when it reached Scottish pastures and crops (The Times, 07.08.1911). By mid-September, it was reported as having reached northern Britain, causing shortage of water supplies (The Times, 12.09.1911). Although this drought is not visible in the SPI-3 records of the HD dataset, the SPI-12 records to August 1911 suggest that moderate to severe drought affected Scotland and northern England over the previous 12 months (Figure 7). Even moderate rainfall deficits over such an extended period would eventually result in low reservoir levels and lead to problems with water supply. The long-term drought was worst in Northern Ireland, where the SPI-12 shows severe to extreme drought for the 12-months accumulations ending in July to November 1911 (Figure 7B). We found only two articles reporting this drought (The Times, 10.07.1911 and 18.09.1911).
The corpus data suggests that at the end of September, Britain experienced heavy rain showers but they were not evenly spread throughout the country. A retrospective report of November 1911 suggested that the south of England had been most severely affected by the drought but it had also affected Northern England and Scotland.
Several references to drought in 1913 reflected back to the impacts of the 1911 drought and short drought periods in 1912. Reference to a drought in 1913 first appeared on 17 June, when The Times mentioned a tournament took place in Roehampton although the grounds had been suffering from continued drought. Further evidence came in early July, with a report that the drought had been especially severe in Dorset (The Times, 07.07.1913). It gradually spread to other parts of England and the impacts on crops were still felt throughout August, particularly regarding corn yields (The Times, 09.07.1913, 02.08.1913, 04.08.1913, 12.08.1913).
In agreement with the meteorological data, the corpus data suggests that by mid-August the drought had reached Scotland and the west and southwest of the United Kingdom. Shortage of water supplies was reported in the Vale of Glamorgan and various parts of Scotland (The Times, 12.08.1913, 13.08.1913, 21.08.1913). Drought conditions persisted across most of Great Britain until late August, with Scotland hit the hardest (The Times, 22.08.1913). There was serious shortage of water in Glasgow (The Times, 21.08.1913), the Lochaber Loch and the Caledonian Canal reached unusually low levels (The Times, 21.08.1913, 25.08.1913, 27.08.1913), and fishing in the River Tay was seriously affected (The Times, 19.11.1913). The drought was officially broken all over the country on 25 August 1913, with heavy rain and thunderstorms in the following week (The Times, 01.09.1913). There were signs that the drought continued in northern England into September, but evidence was not substantial. However, the effect of the summer drought was still felt in the following months, especially in relation to agricultural yields across England (The Times, 10.09.1913, 06.10.1913, 11.10.1913, 14.10.1913).
6.2 1940 to 1945
Three episodes of long-lasting SPI-12 droughts occurred during the period 1940–1945, starting in the northwest and finishing in the southeast. The HD SPI-12 accumulations ending in February to August 1940 show moderate to severe droughts in Scotland and northwest England, and were made up of two incidences of shorter droughts (Figure 7B). The HD SPI-3 records reveal severe droughts in the wider northwest of the United Kingdom for the 3-month periods ending in October 1939 and June 1940 (Figure 7A).
The second SPI-12 drought affected northern Britain, Wales and Southwest England, with moderate to severe magnitudes for the 12-months accumulations ending in November 1941 to September 1942. In this case the worst SPI-3 droughts reached severe magnitude and affected northern England and Northern Ireland in the 3-month periods ending in June and July 1941, and Southwest England bookending the period November 1941 to April 1942 (Figure 7).
The last SPI-12 drought in this period reached extreme magnitudes in the southeast corner of England, while severe drought affected the wider south and central England, Wales and Northern Ireland in the 12-month periods ending January to October 1944 (Figure 7B). This long and widespread drought started with a single extreme SPI-3 accumulation to April 1943, affecting eastern and southern England. It ended with three consecutive extreme SPI-3 accumulations ending in March to May 1944 for southern England, West Midlands, Wales and Northern Ireland, although most of the United Kingdom was affected by drought to some degree (Figure 7A).
References to drought in the corpus material in the years of 1940–1942 related mostly to the reporting on the impacts of the drought in southern England in the late 1930s (1937–39). Apart from scanty mentions of drought conditions in specific locations, there was no evidence in the corpus data of a severe drought in the United Kingdom until the summer of 1942, when The Times reported various droughty periods across southern England between April and June. Reference to a drought in other parts of the country was only seen once, in an article on 7 September 1942 which mentioned a drought earlier in the year had affected oat yields and potato crops in East Lothian. This sole report is the only corpus evidence of a drought that in the meteorological record mainly affected the north and west of the United Kingdom. The short durations of the reported droughts in southern England, lasting only a few weeks and being interspersed by significant amounts of rainfall, may account for these droughts not showing up in the HD SPI-3 records.
From spring 1943 to the end of 1945, the newspaper reports largely agree with the droughts observed in the meteorological HD dataset. On 13 April 1943, The Times reported a 31 days’ drought in the Thames catchment. Another article mentioned that London suffered from a drought between 19 June and 6 July that year, which ended with a heavy rainfall (The Times, 17.07.1943). By August 1943, the drought conditions spread to other areas and started to affect the farming industry across Suffolk, Hampshire, Cornwall (The Times, 09.08.1943), East Anglia, Suffolk and Norfolk (The Times, 13.09.1943).
A retrospective report in early 1944 (The Times, 11.01.1944) highlighted that the flow of the Thames was much below the average as winter rainfall in the last three months of 1943 was not sufficient. The article also mentioned the impact on crops, exacerbated in times of war when the country was dependent on its own crops. Another article on 15 February 1944 mentioned deficiency in rainfall in England and Wales in the summer of 1943 which caused shortage of water supplies, while Scotland and Northern Ireland experienced substantial excesses of rainfall.
From April to August 1944, there were various reports of widespread drought conditions across the United Kingdom between March and July, with southeast England and east Midlands hit the hardest. A report on 12 April 1944 framed it as one of the driest March in the United Kingdom in the 20th century. The drought affected the whole of England – and the south, southeast and east in particular – threatening milk supplies. The flow of the Thames was at its lowest level on record for that time of the year and Londoners were asked to keep consumption of water to a minimum (The Times, 06.05.1944). By June, restrictions on the use of water in the London area were introduced (Extract 5) and remained in place until October (The Times, 12.10.1944).
5) “The Metropolitan Water Board decided yesterday to suspend until further notice authority to consumers to use hoses, outside taps, or sprinklers for watering gardens, allotments, or sports grounds, for washing vehicles or streets, or for any ornamental fountain.” (The Times, 17.06.1944)
From the end of June to mid-October, The Times focused on impacts of the drought on farming. The drought affected milk supplies (The Times, 28.06.1944) as well as wheat, corn and potato crops in southern England, especially in Norfolk, Suffolk and Hertfordshire (The Times, 10.07.1944). Fruit stocks were scarce (The Times, 26.08.1944), and sugar beet and potato crops in southwest counties were below average (The Times, 09.10.1944).
References to drought were scanty in 1945 and revolved mainly around the impacts of the 1944 drought. On 9 May 1945, The Times reported that although reservoirs had not been fully replenished, there was little chance that the country would face water problems in 1945.
6.3 The years of 1947 and 1949
The SPI-3 records from the HD dataset show severe to extreme meteorological drought throughout the United Kingdom in the 3-month periods ending in September to December 1947, with October being extreme in all regions except Scotland where it was severe. For the longer-duration SPI-12 this translated into severe drought in the 12-month periods ending in March and April 1948, for southeast England and east Midlands (Figure 7).
In 1949 the SPI-3 accumulation to March was severe to extreme in all areas except the northwest where the drought varied from mild to moderate. In northeast England, SPI-3 droughts remained severe until June 1949, and scattered values of moderate to severe SPI-3 droughts occurred in Wales and southern England until September (Figure 7A). The generally dry conditions in 1949 resulted in all areas except Scotland, Northern Ireland and east Midlands experiencing at least one severe or extreme SPI-12 accumulation ending between June and November 1949. The most spatially widespread extreme drought occurred for the SPI-12 accumulation to September (Figure 7B).
In the corpus data, the first reference to a drought in the United Kingdom in 1947 appeared in late June, when The Times reported on potato shortage due to a drought in the main producing areas of Lincolnshire, Cambridgeshire and Norfolk (The Times, 26.06.1947). A report some days later (The Times, 07.07.1947) alerted that hard winter followed by a drought had brought poor harvest prospects for farmers throughout the country, especially for wheat, barley, oat, potatoes and sugar beet crops.
An absolute drought was reported in central and northeast Scotland in August and there were record hours of unbroken sunshine in several towns across the country (The Times, 13.08.1947). A week later, the drought had spread southwards, with hardly any rain recorded in most parts of Britain (The Times, 19.08.1947), reducing water levels in reservoirs (The Times, 20.08.1947). At the end of August, the United Kingdom experienced scorching temperatures and a severe widespread drought, which persisted through the first week of September (The Times, 25.08.1947, 29.08.1947, 02.09.1947). A retrospective report on 1 September 1947 described the previous month as the sunniest and driest August on record.
The drought started to break down in most of Scotland and Northern Ireland on 4 September 1947 and the rain gradually moved down towards northwest England and Wales, reaching southwest and southeast England a couple of days later (The Times, 04 to 08.09.1947). The rain remained negligible in other parts of the country, where the drought was only broken in mid-September (The Times, 18.09.1947, 19.09.1947). A month later, The Times reported that drought conditions had started to develop again in parts of southeast England and East Anglia (The Times, 11.10.1947, 20.10.1947). It was referred to as the third drought in the country in 1947.
The impacts of the 1947 drought were widely reported. It had a marked effect on the milk production from July onwards, with acute shortage in Lincoln, Northampton and the Midlands (The Times, 23.08.1947). There were reports of an increasing number of farmland fires in Derbyshire and rejection of milk supplies as farmers had no water for cooling (The Times, 26.08.1947). By mid-September, pastures were still bare and scorched in most of the country, except in Wales and southwest England. Milk supplies became short (The Times, 11.09.1947, 15.09.1947, 16.09.1947) and only regained force in December (The Times 27.10.1947, 15.12.1945, 29.12.1947).
The drought also affected salmon production in estuaries in northern Scotland (The Times, 06.09.1947) and the farming industry in East Anglia, Nottinghamshire and northern Scotland where the yields of sugar beet, turnips, and swedes were below average, and kale and cabbage were substantially damaged (The Times, 11.09.1947, 15.09.1947, 16.09.1947). Later that year, there were reports of poor wheat yields, especially in Devon and Dorset (The Times, 06.10.1947, 20.11.1947).
A retrospective article on 31 December 1947 stated that the British Isles had had the warmest and driest August since 1881, especially in east Kent and east Suffolk; Scotland had the driest August since 1869. The dry weather persisted until autumn, with absolute drought over most of Britain. It was the driest October on record for most of England and Wales, causing the flow of the Thames to reach very low levels.
The first indication of drought conditions in 1949 appeared on 8 June, when The Times reported that rainfall had prevented the drought from damaging cherry crops in Kent. In mid-June, large parts of Ireland, Scotland, Wales, and the western England experienced absolute drought and high temperatures (The Times, 18.06.1949). By the end of the month, dry weather and high temperatures prevailed across the entire country, with absolute droughts covering the whole of England, Wales and great part of Scotland (The Times, 27.06.1949, 28.06.1949).
The drought started to break on 29 June 1949, when heavy rain fell in Yorkshire, later spreading to much of northeast England, north Lancashire and the Lake district (The Times, 29.06.1949, 30.06.1949). The dry weather and high temperatures persisted in other parts of England and Wales (The Times, 04.07.1949). On the 5 July, thunderstorms were reported in eastern Scotland and steady rain across various parts of the country, but droughty conditions persisted in Devon, Cornwall, south and west Wales, Lancashire, Yorkshire and the Channel Islands (The Times, 06.07.1949). By mid-July, the drought had been confined to southeast England (The Times, 15.07.1949).
The effects of the drought on water supplies were felt throughout the country from late June 1949, with campaigns to persuade people to reduce water consumption in north Yorkshire and south Durham (The Times, 27.06.1949), Kent and parts of Sussex (The Times, 29.06.1949), and London (The Times, 01.07.1949). Restrictions on water use were introduced in London early July and south Wales late that month (The Times, 04.07.1949, 06.07.1949, 26.07.1949).
Milk yields in Somerset, Lincolnshire and Cumberland shrank and there was an increased number of heath and plantation fires across Berkshire and Dorset (The Times, 06.07.1949 and 11.07.1949). Overall, agricultural production remained stable, despite some disappointing yields of potato and sugar beet crops in Gloucestershire, Hampshire, Oxfordshire and Surrey (The Times, 11.07.1949, 08.08.1949, 12.08.1949, 12.09.1949), and vegetable crops were scarce (The Times, 20.09.1949).
Rainfall was deficient again in most parts of Britain in mid-September 1949, except west-Scotland and some parts of the Midlands; with an absolute drought in Kent, Norfolk and Suffolk (The Times, 13.09.1949). Water supplies in London, Birmingham, Manchester, and Derbyshire were at risk (The Times, 15.09.1949, 16.09.1949). Hosepipe bans were introduced in London (The Times, 17.09.1949 and 19.09.1949) and a drought order was granted to the Metropolitan Water Board for additional abstraction from the Thames (The Times, 20.09.1949). By mid-October, rainfall and the flow of the Thames had increased but not yet sufficient for restrictions to be lifted (The Times, 12.10.1949). Despite the strain on water supplies, the 1949 drought was not ranked as the most severe drought in Thames records as the average flow was higher than in the same period in the years of 1921, 1934 and 1944 (The Times, 11.10.1949).
7 Conclusion
The present study demonstrated how corpus linguistics in combination with precipitation metrics can be used to examine the representation of drought in the United Kingdom, presenting evidence going back as far as 1800, with unprecedented scale and depth. On balance, our conclusion is that the combined approach was mutually informative. Bringing together two entirely different, but highly complementary, approaches allowed a more confident assertion of conclusions.
We found an overwhelming agreement between the corpus data and meteorological records in relation to when a drought event occurred in the United Kingdom. With very few exceptions, there are plausible explanations for the few cases in which the corpus and rainfall data diverged in relation to the existence of a drought in the United Kingdom (see Section 6 and Section 7). The analysis demonstrates that newspapers tend to talk about dry weather conditions more frequently during periods in which the meteorological records indicated the existence of a drought in the United Kingdom. This is important because, while serving as a rich source of information, newspapers pose the challenge of working with a narrative driven by news values and the interests of a publishing house. In addition to the level of attention paid to drought relative to other concerns, the reality presented in the press may be only partial or even distorted and skewed. By cross-examining the newspaper material with long-term meteorological data, we were able to check our corpus observations against reality. Conversely, the newspaper material complemented the meteorological data by indicating droughts which had not been captured by precipitation metrics, especially in the 19th century when rainfall records were sparse and uncertain (see Section 6), as well as adding significant richness to our understanding of drought development, severity and impacts. Crucially, in a departure from past studies, the corpus approach provides a longitudinal rather than event-based approach, and an objective rather than selective assessment of evidence from the news media, with which to benchmark the meteorological drought analysis.
Through the case studies, it becomes evident that, despite the consistency of results, subtle differences emerged when we cross-examined the characteristics of each event from the two perspectives taken. The newspaper narrative does not always coincide with the meteorological data in all aspects regarding the intensity and/or spatial extent of the analysed events, perhaps due to the interests and remit of The Times in the selected years. For example, while the meteorological data indicated that the 1911 drought hit Northern Ireland the hardest, The Times focused mainly on the impacts of the drought in southern England, devoting little attention to other parts of the country.
The analysis has also highlighted differences between the two approaches in relation to the duration of events. Long-lasting drought events do not appear to elicit as much newspaper coverage as intense, but shorter droughts. As illustrated by the case studies, newspapers often describe droughts as lasting only a few weeks, or even days, which is too short for our shortest meteorological measure, the SPI-3, to capture. This may be explained by the media attention cycle as the issue becomes most relevant when its impacts are felt more evidently by the population. This aspect was especially evident in the 19th century data, when dry weather conditions were a matter for concern due to its impacts on agriculture and cattle farming (McEnery et al., 2019, 2021). Interestingly, the reconstructed M2020-EWP series better reflects the corpus data in the early part of the 19th century, than the original EWP series does. Also, the duration of the extracted droughts is considerably shorter for the M2020-EWP dataset than for the original EWP dataset. Both these issues are probably at least partly due to the wetter winters found by Murphy et al. (2020a) in the M2020-EWP compared with the EWP dataset for the period pre-1870.
Regarding impacts of droughts, the corpus analysis allowed us to delve into the narrative around the effects and scope of the selected events, as the case studies demonstrate. However, it is important to stress that while the corpus data offers perspectives on the droughts as they were perceived at the time, some caution is warranted as it was our only source of impact information. Additional benefits could be achieved by contrasting and complementing the newspaper narrative with other sources, such as journals, diaries or other archives (as done in Noone et al. (2017) and Harvey-Fishenden et al. (2019)).
Future studies could also explore the context of droughts in specific regions using the combined approached presented here. This could have the additional advantage of using local newspapers, which may bring new information about localised impacts and responses to droughts. Also, it goes without saying that the analysis would gain in quality if other events were explored in more detail. Finally, a worthwhile future avenue would be application of corpus methods to pre-1800 sources, to complement existing work on multi-centennial drought assessment from documentary sources (e.g., droughts from southeast England from 1,200–1700; Pribyl, 2020).
On balance, this paper demonstrates the power of combining corpus linguistics with meteorological metrics on a scale that would not otherwise be possible, thus contributing to a better understanding of how drought is perceived, in addition to how it is traditionally “measured”.
Data Availability Statement
Publicly available datasets were analyzed in this study. The datasets are not made available in the article or supplements, but most are open datasets available from the links below, or if not open, contact details are provided. The newspaper datasets are made available for registered users of CQPWeb, Lancaster’s software platform for large-corpus analysis. Instances of the word “drought” in the newspaper corpora are available from the Historic Droughts project pages on the UK Data Service. See https://historicdroughts.ceh.ac.uk/content/datasetsdatasets. Specifically: 1) https://reshare.ukdataservice.ac.uk/853195/, 2) https://reshare.ukdataservice.ac.uk/853196/, 3) https://reshare.ukdataservice.ac.uk/853399/4) https://reshare.ukdataservice.ac.uk/853403/. The precipitation data is available from: 1) Historic Droughts Rainfall: https://catalogue.ceh.ac.uk/documents/af1db516-3411-416f-9c51-5ab99d912f8a, 2) England and Wales Precipitation: https://www.metoffice.gov.uk/hadobs/hadukp/, 3) Murphy et al. (2020a) dataset was secured from the authors of the paper. Interested parties should contact the lead authors of the article, https://rmets.onlinelibrary.wiley.com/doi/10.1002/joc.6208.
Author Contributions
CD, JH, and TM conceived and designed the study. CD led on the 20th and 21st C corpus analyses, HB on the 19th C analysis. CS, LB, and MT conducted analysis of the rainfall data. CS and CD conducted the integrated analysis. CD, CS, and JH wrote the manuscript, with contributions from all authors.
Funding
This research was conducted as part of the Historic Droughts project within the UK Drought and Water Scarcity Programme which was funded by the UK Natural Environment Research Council grant NE/L01061X/1. Financial support for JH, LB, CS, and MT was also provided by NERC/UKCEH National Capability funding through UKSCAPE (NE/R016429/1).
Conflict of Interest
The authors declare that the research was conducted in the absence of any commercial or financial relationships that could be construed as a potential conflict of interest.
Publisher’s Note
All claims expressed in this article are solely those of the authors and do not necessarily represent those of their affiliated organizations, or those of the publisher, the editors, and the reviewers. Any product that may be evaluated in this article, or claim that may be made by its manufacturer, is not guaranteed or endorsed by the publisher.
Acknowledgments
We thank Conor Murphy (Maynooth University) for providing the revised England and Wales Precipitation (EWP) series (Murphy et al., 2020a).
Supplementary Material
The Supplementary Material for this article can be found online at: https://www.frontiersin.org/articles/10.3389/fenvs.2022.760147/full#supplementary-material
Footnotes
1See https://www.bl.uk/collection-guides/british-newspaper-archive.
2https://www.metoffice.gov.uk/hadobs/hadukp/data/download.html.
3https://data.gov.uk/dataset/4977ad50-f78e-49be-9cf7-fa0adec4b9f8/nuts-level-1-january-2018-full-extent-boundaries-in-the-united-kingdom.
References
Bachmair, S., Svensson, C., Hannaford, J., Barker, L. J., and Stahl, K. (2016). A Quantitative Analysis to Objectively Appraise Drought Indicators and Model Drought Impacts. Hydrol. Earth Syst. Sci. 20, 2589–2609. doi:10.5194/hess-20-2589-2016
Baker, H., Fry, M., and Bachiller-Jareno, N. (2020a). Historic Droughts Inventory of References from British Nineteenth-century Newspapers 1800-1900. [data collection]. Colchester, Essex: UK Data Service. SN: 853195. doi:10.5255/UKDA-SN-853195
Baker, H., Fry, M., and Bachiller-Jareno, N. (2020b). Historic Droughts Inventory of References from British Twentieth-century Newspapers 1900-1999. [data collection]. Colchester, Essex: UK Data Service. SN: 853196. doi:10.5255/UKDA-SN-853196
Barker, L. J., Hannaford, J., Chiverton, A., and Svensson, C. (2016). From Meteorological to Hydrological Drought Using Standardised Indicators. Hydrol. Earth Syst. Sci. 20, 2483–2505. doi:10.5194/hess-20-2483-2016
Barker, L. J., Hannaford, J., Parry, S., Smith, K. A., Tanguy, M., and Prudhomme, C. (2019). Historic Hydrological Droughts 1891-2015: Systematic Characterisation for a Diverse Set of Catchments across the UK. Hydrol. Earth Syst. Sci. 23, 4583–4602. doi:10.5194/hess-23-4583-2019
Bednarek, M., and Caple, H. (2017). The Discourse of News Values: How News Organizations Create Newsworthiness. New York: Oxford University Press.
Brezina, V., McEnery, T., and Wattam, S. (2015). Collocations in Context: A New Perspective on Collocation Networks. Ijcl 20 (2), 139–173. doi:10.1075/ijcl.20.2.01bre
Cole, G., and Marsh, T. (2006). The Impact of Climate Change on Severe Droughts: Major Droughts in England and Wales from 1800 and Evidence of Impact. Bristol, UK: The Environment Agency.
Dayrell, C., Fry, M., and Bachiller-Jareno, N. (2020a). Data from: Historic Droughts Inventory of References from British Broadsheet Newspapers 1990-2014. [data collection]. Colchester, Essex: UK Data Service. SN: 853399. doi:10.5255/UKDA-SN-853399
Dayrell, C., Fry, M., and Bachiller-Jareno, N. (2020b). Historic Droughts Inventory of References from British Tabloid Newspapers 1992-2014. [data collection]. Colchester, Essex: UK Data Service. SN: 853403. doi:10.5255/UKDA-SN-853403
Environment Agency (2015). Write a Drought Plan: How to Write a Water Company Drought Plan. Available at: https://www.gov.uk/guidance/write-a-drought-plan (Accessed January 25, 2022).
Gudmundsson, L., and Stagge, J. H. (2016). Package ‘SCI’. Available at: https://cran.r-project.org/web/packages/SCI/SCI.pdf (Accessed August 16, 2021).
Hardie, A. (2012). CQPweb - Combining Power, Flexibility and Usability in a Corpus Analysis Tool. Ijcl 17 (3), 380–409. doi:10.1075/ijcl.17.3.04har
Harvey-Fishenden, A., Macdonald, N., and Bowen, J. P. (2019). Dry Weather Fears of Britain's Early 'industrial' Canal Network. Reg. Environ. Change 19, 2325–2337. doi:10.1007/s10113-019-01524-5
Hesterberg, T., Moore, D. S., Monaghan, S., Clipson, A., and Epstein, R. (2005). “Bootstrap Methods and Permutation Tests,” in Introduction to the Practice of Statistics. Editors D. S. Moore, and G. McCabe. 2nd ed. (New York: W. H. Freeman).
Jones, P. D., and Lister, D. H. (1998). Riverflow Reconstructions for 15 Catchments over England and Wales and an Assessment of Hydrologic Drought since 1865. Int. J. Climatol. 18, 999–1013. doi:10.1002/(sici)1097-0088(199807)18:9<999::aid-joc300>3.0.co;2-8
Jones, P. D., Lister, D. H., Wilby, R. L., and Kostopoulou, E. (2006). Extended Riverflow Reconstructions for England and Wales, 1865-2002. Int. J. Climatol. 26, 219–231. doi:10.1002/joc.1252
Lennard, A. T., Macdonald, N., Clark, S., and Hooke, J. M. (2016). The Application of a Drought Reconstruction in Water Resource Management. Hydrol. Res. 47, 646–659. doi:10.2166/nh.2015.090
Loader, N. J., Young, G. H. F., McCarroll, D., Davies, D., Miles, D., and Bronk Ramsey, C. (2020). Summer Precipitation for the England and Wales Region, 1201-2000 Ce , from Stable Oxygen Isotopes in Oak Tree Rings. J. Quat. Sci. 35, 731–736. doi:10.1002/jqs.3226
Marsh, T., Cole, G., and Wilby, R. (2007). Major Droughts in England and Wales, 1800-2006. Weather 62 (4), 87–93. doi:10.1002/wea.67
McEnery, T., Baker, H., and Dayrell, C. (2021). “Analysing the Impacts of 19th-century Drought: A Corpus-Based Study,” in Exploring Discourse and Ideology through Corpora. Editors M. Fuster-Márquez, C. Gregori-Signes, J. Santaemilia, and P. Rodríguez-Abruñeiras (Bern: Peter Lang Publishing Group), 276, 47–70. Linguistic Insights. doi:10.3726/b17868
McEnery, T., Baker, H., and Dayrell, C. (2019). “Working at the Interface of Hydrology and Corpus Linguistics,” in Using Corpus Methods to Triangulate Linguistic Analysis. Editors P. Baker, and J. Egbert (New York: Routledge), 52–84. doi:10.4324/9781315112466-3
McEnery, T., and Hardie, A. (2012). Corpus Linguistics: Method, Theory and Practice. Cambridge: Cambridge University Press.
McKee, T. B., Doesken, N. J., and Kleist, J. (1993). “The Relationship of Drought Frequency and Duration to Time Scales,” in Proceedings of the 8th Conference on Applied Climatology, California: Anaheim, January 1993, 17179–22183.
Murphy, C., Wilby, R. L., Matthews, T., Horvath, C., Crampsie, A., Ludlow, F., et al. (2020b). The Forgotten Drought of 1765-1768: Reconstructing and Re‐Evaluating Historical Droughts in the British and Irish Isles. Int. J. Climatol. 40, 5329–5351. doi:10.1002/joc.6521
Murphy, C., Wilby, R. L., Matthews, T. K. R., Thorne, P., Broderick, C., Fealy, R., et al. (2020a). Multi‐Century Trends to Wetter winters and Drier Summers in the England and Wales Precipitation Series Explained by Observational and Sampling Bias in Early Records. Int. J. Climatol. 40, 610–619. doi:10.1002/joc.6208
Noone, S., Broderick, C., Duffy, C., Matthews, T., Wilby, R. L., and Murphy, C. (2017). A 250-year Drought Catalogue for the Island of Ireland (1765-2015). Int. J. Climatol. 37, 239–254. doi:10.1002/joc.4999
Pribyl, K. (2020). A Survey of the Impact of Summer Droughts in Southern and Eastern England, 1200-1700. Clim. Past. 16, 1027–1041. doi:10.5194/cp-16-1027-2020
Serinaldi, F., and Kilsby, C. G. (2012). A Modular Class of Multisite Monthly Rainfall Generators for Water Resource Management and Impact Studies. J. Hydrol. 464-465, 528–540. doi:10.1016/j.jhydrol.2012.07.043
Spraggs, G., Peaver, L., Jones, P., and Ede, P. (2015). Re-construction of Historic Drought in the Anglian Region (UK) over the Period 1798-2010 and the Implications for Water Resources and Drought Management. J. Hydrol. 526, 231–252. doi:10.1016/j.jhydrol.2015.01.015
Svensson, C., Hannaford, J., and Prosdocimi, I. (2017). Statistical Distributions for Monthly Aggregations of Precipitation and Streamflow in Drought Indicator Applications. Water Resour. Res. 53, 999–1018. doi:10.1002/2016wr019276
Tanguy, M., Fry, M., Svensson, C., and Hannaford, J. (2017). Data from: Historic Gridded Standardised Precipitation Index for the United Kingdom 1862-2015 (Generated Using Gamma Distribution with Standard Period 1961-2010) V4. NERC Environmental Information Data Centre. doi:10.5285/233090b2-1d14-4eb9-9f9c-3923ea2350ff
Todd, B., Macdonald, N., Chiverrell, R. C., Caminade, C., and Hooke, J. M. (2013). Severity, Duration and Frequency of Drought in SE England from 1697 to 2011. Clim. Change 121, 673–687. doi:10.1007/s10584-013-0970-6
Water Act (2014). Chapter 21, Water Act 2014. London: The Stationery Office. Available at: http://www.legislation.gov.uk/ukpga/2014/21/contents/enacted (Accessed August 16, 2021).
Wigley, T. M. L., Lough, J. M., and Jones, P. D. (1984). Spatial Patterns of Precipitation in England and Wales and a Revised, Homogeneous England and Wales Precipitation Series. J. Climatol. 4, 1–25. doi:10.1002/joc.3370040102
Keywords: drought, water scarcity, historic droughts, corpus linguistics, discourse analysis, precipitation, standardised precipitation index (SPI), long-term meteorological records
Citation: Dayrell C, Svensson C, Hannaford J, McEnery T, Barker LJ, Baker H and Tanguy M (2022) Representation of Drought Events in the United Kingdom: Contrasting 200 years of News Texts and Rainfall Records. Front. Environ. Sci. 10:760147. doi: 10.3389/fenvs.2022.760147
Received: 17 August 2021; Accepted: 08 February 2022;
Published: 18 March 2022.
Edited by:
Anders Hansen, University of Leicester, United KingdomReviewed by:
Ana Horta, Charles Sturt University, AustraliaAna Cristina Russo, University of Lisbon, Portugal
Copyright © 2022 Dayrell, Svensson, Hannaford, McEnery, Barker, Baker and Tanguy. This is an open-access article distributed under the terms of the Creative Commons Attribution License (CC BY). The use, distribution or reproduction in other forums is permitted, provided the original author(s) and the copyright owner(s) are credited and that the original publication in this journal is cited, in accordance with accepted academic practice. No use, distribution or reproduction is permitted which does not comply with these terms.
*Correspondence: Carmen Dayrell, c.dayrell@lancaster.ac.uk