Sensitivity of WRF multiple parameterization schemes to extreme precipitation event over the Poyang Lake Basin of China
 Chao Deng1,2 Yongxiang Chi3 Yuansen Huang4 Caiying Jiang4 Lingjun Su2 Hui Lin5 Lizhi Jiang5
  Xiaojun Guan5
  Lu Gao1,2,6,7*
- 1Institute of Geography, Fujian Normal University, Fuzhou, China
- 2College of Geographical Science, Fujian Normal University, Fuzhou, China
- 3Fujian Institute of Geological Survey, Fuzhou, China
- 4Nanping meteorological bureau of Fujian Province, Nanping, China
- 5Fujian Key Laboratory of Severe Weather, Fuzhou, China
- 6Fujian Provincial Engineering Research Center for Monitoring and Accessing Terrestrial Disasters, Fujian Normal University, Fuzhou, China
- 7Key Laboratory for Humid Subtropical Eco-geographical Processes of the Ministry of Education, Fujian Normal University, Fuzhou, China
Global warming leads to more frequent and more violent extreme weather events, which cause severe natural disasters. The sensitivity of physical schemes in numerical weather prediction models for extreme precipitation is a significant challenge. To simulate a heavy precipitation process from 1 July 2020 to 10 July 2020 over the Poyang Lake Basin, where floods occur frequently, the Weather Research and Forecast model (WRF) was employed. The observation (OBS) from 92 meteorological stations was applied to evaluate WRF performance. To assess the optimal parameter, 27 combinations of multiphysics schemes based on three cumulus schemes (CUs), three microphysical schemes (MPs) and three land surface schemes (LSMs) were employed in WRF simulation. The Euclid distance (ED) was derived to evaluate the performance of the modelled total cumulative precipitation (TCP). The results showed that the simulation generally reproduced the spatial distribution of precipitation and captured the storm centre. In general, WRF underestimated the observation for most areas but overestimated the observation in the northeastern part of the basin. For total cumulative precipitation (TCP), the spatial correlation coefficients ranged from 0.6 to 0.8. M11 had the highest value of 0.796. The scores (TS, POD, FAR) of M15 were 0.66, 0.79, and 0.21, respectively. With the maximum similarity of 0.518, M7 (BMJ-WDM6-Noah) showed the best performance in ED based on six evaluation metrics. The mean values of OBS and M19 were 259.34 and 218.33 mm, respectively. M19 (NT-Thompson-Noah) was closest to the OBS for the range of the TCP. In terms of daily precipitation, the CC of M3 was maximum (0.96), and the RMSE of M24 was minimum (11.9 mm. day-1). The minimum error between the simulation and OBS was found for M3 (NT-Thompson-Noah). Therefore, with a comprehensive evaluation, five optimal combinations of physical schemes (M22, M19, M9, M3, M21) were found for the PLB, which is of great significance for extreme precipitation simulation and flood forecasting.
Introduction
Global climate change affects the water cycle, which can easily cause the changes in precipitation and patterns for different regions, ultimately resulting in extreme precipitation (Yang Q et al., 2021; O'Gorman 2015). Precipitation is an important parameter of atmospheric motion as well as the water cycle. The natural disasters triggered by rainstorms have brought significant socioeconomic losses and human casualties (Jonkman 2005; Jia et al., 2022; Qiao et al., 2022). Due to climate warming, the frequency and intensity of extreme precipitation events have increased globally for most areas (Sun and Ao 2013; Stegall and Kunkel 2019; Yin et al., 2021; Yin et al., 2022). Gradually, several studies have found that extreme precipitation events increase frequently in China, concentrating in the southeastern region and the Yangtze River basin area, especially during the rainy season from April to September (Bao et al., 2015; Gao et al., 2017; Yao et al., 2022). With a humid subtropical climate, Poyang Lake Basin (PLB) is located in the middle and lower reaches of the Yangtze River, China. However, the PLB often suffers serious floods, drought and other disasters due to the climatic characteristics and topography in summer (Wu et al., 2021; Yang X Xet al. 2021). According to the statistics, the No. 1 flood that occurred in the basin in July 2020 alone affected more than 5.21 million people and 455 thousand hectares of crops. Therefore, it is important to enhance the forecasting of extreme precipitation events for the purpose of reducing the damage caused.
The formation of extreme precipitation is a complex multiscale process. Although many different definitions have been adopted to the extreme precipitation, there is no uniform criteria of extreme precipitation events. Some studies select percentile and absolute critical value method to identify extreme precipitation (Liu et al., 2017). For example, the long-term 90th or 95th percentile of daily precipitation series is selected as extreme value (Camuffo et al., 2020). According to the precipitation grading system in China, the rainstorm is identified when the daily precipitation exceeds 50 mm. In addition, the series of extreme climate indices are commonly used (Lei et al., 2021). The precipitation event selected in this study reached the rainstorm level (average daily precipitation exceeds 50 mm) according to the criteria from China Meteorology Administration. Compared with traditional precipitation observation methods, quantitative precipitation forecasting (QPF) can obtain more precipitation information and effectively prevent intense precipitation and floods (Gao et al., 2022). Therefore, numerical weather prediction (NWP), which is based on precise physical control equations, can solve the problem of precipitation dynamics (Sun et al., 2014). Generally, NWP models are usually divided into global climate models (GCMs) and regional climate models (RCMs) at different simulated area ranges (Yi et al., 2018). However, the global climate models (GCMs) are not ideal for representing the intensity of extreme precipitation events on a small spatial scale. Some studies contend that GCMs are generally not capable of capturing intense precipitation signals due to their coarse resolutions (Mahajan et al., 2015). Additionally, the physical processes of the models are not fully expressed. However, the regional climate models (RCMs), such as the PSU/NCAR mesoscale model (MM5) and Weather Research and Forecast (WRF) meet the requirement of high spatial and temporal resolution for the simulation of complex areas with specific terrain, and at the same time, they simulate complex local processes that are easily overlooked and resolve detailed regional atmospheric and ground processes (Bao et al., 2015). The RCMs capture fine-scale features such as topographic precipitation, rain shadows and storms and describe regional-scale physical and parametric structures (Jin et al., 2010). Additionally, previous studies found that RCMs were capable of simulating precipitation in complicated terrain areas (Ji et al., 2018). However, the simulation is still limited by factors such as subgrid parameters, which has become a challenge for numerical weather prediction (NWP) systems (Yang et al., 2019).
As a new generation of mesoscale high-resolution prediction models, WRF employed for atmospheric research and operational forecasting describes the land‒atmosphere continuum processes in detail with higher spatial and temporal resolutions (Di et al., 2017). Compared to MM5, WRF has a more source-oriented physical parameterization scheme and a more complete dynamics framework (Chinta et al., 2021). With a stable model and an assimilated data function, it effectively reduces the error of precipitation forecasting, which works better for extreme precipitation simulations. In the WRF simulation process, uncertainties dominated by the initial boundary conditions, spatial resolution, and physical schemes affect the accuracy of precipitation prediction. Many previous studies have indicated that physical schemes play a significant role in climate models, atmospheric circulation models and mesoscale numerical prediction models. As the parameters primarily responsible for calculating atmospheric water vapour, cloud liquid water, cloud ice, and various types of precipitation, microphysical schemes (MPs) are highly sensitive in predicting convective storms and precipitation especially for intense precipitation simulations (Rajeevan et al., 2010; Cossu and Hocke 2014). Cumulus schemes (CUs) describe the changes in heat and water vapour caused by updrafts, downdrafts, and compensatory movements outside the clouds (Wu et al., 2019). Therefore, the accuracy of precipitation forecasting can be improved by suitable parameter schemes. In addition, the occurrence of intense precipitation is also influenced by the subsurface (Jin et al., 2010). Atmospheric circulation has been influenced by land surface schemes (LSMs), which reveal land‒air interactions (Di et al., 2015; Lv et al., 2020). The land surface scheme controls the transport of water and heat fluxes in the soil, as well as the water vapour and heat exchange between the land surface and atmosphere. The performance of physical parameterization combinations varies by study area (Yang et al., 2019). Therefore, it is necessary to study the region-specific sensitivity of physical parameterization combinations to forecast future events.
Many simulations of heavy rainfall or storms in Yangtze River basin which has a huge water system and complex terrain have been carried out based on WRF (Wang et al., 2012; Ma et al., 2015; Yao et al., 2022). Previous studies frequently adopted the fixed physical parameterization schemes and hardly considered the combination of physical parameters schemes. It is difficult for one single set of physical schemes to maintain its best performance consistently for different areas and accurately capture the physical processes of extreme precipitation. In particular, the physical parameterization schemes of simulation are sensitive to terrain changes. Therefore, it is necessary to evaluate a set of appropriate physical parameterization schemes on local scales. This study focused on the parameterization sensitivity of cloud microphysical schemes, cumulus schemes, and land surface schemes by using WRF to improve the understanding of how to accurately simulate extreme rainfall. Additionally, the suitable combination members were selected to evaluate the reliability of WRF in extreme precipitation prediction. The observation interpolated from 92 meteorological stations were applied to validate the total cumulative precipitation (TCP). To compare the performance of WRF combination members, an extreme precipitation over the PLB was simulated from 1 July 2020 to 10 July 2020.
The objectives of this study include 1) whether WRF simulations can capture the spatial and temporal characteristics of extreme precipitation over Poyang Lake Basin, 2) how sensitive the extreme precipitation is to different combinations of physical schemes, and 3) which model is a reliable combination scheme for PLB? It is of great significance to study extreme precipitation in the PLB.
Data and methods
Observation
The Poyang Lake Basin (PLB) is located in the centre of Southeast China (Figure 1), between 113.74°-118.47°E and 24.57°–30.01°N, with a total area of 16.22 km2 × 104 km2. The PLB that is comparatively flat encompasses five subbasins: Xiushui (subbasin size: 3548 km2), Ganjiang (8048 km2), Fuhe (15,811 km2), Xinjiang (15,535 km2), and Raohe (6374 km2). The basin has a humid subtropical climate, which is controlled by the East Asian monsoon (Lei et al., 2022). Therefore, it has obvious seasonal characteristics and an uneven spatial distribution for precipitation, with mainly falling from April to June, leading to frequent floods in summer. The basin is an important flood storage and detention area for the Yangzte River, as it connects to the main stream of the Yangtze River. Additionally, the Poyang Lake is the largest freshwater lake in China (Wagner et al., 2016; Zhang et al., 2016).
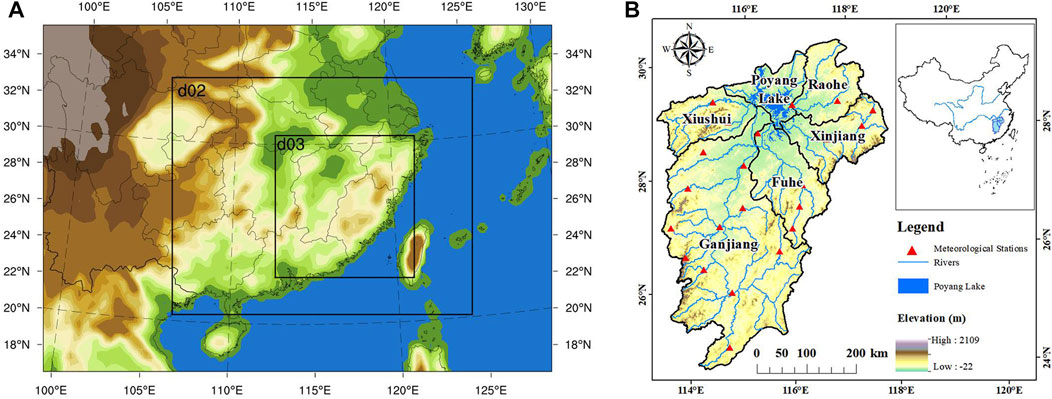
FIGURE 1. Location of study area. (A) WRF model domains with three grids (d01-27, d02-9, d03-3 km). (B) Topographic features of the Poyang Lake Basin, China.
The meteorological stations (located in the simulated nested area) were provided by the China Meteorological Center (Table 1). The stations were distributed with large elevation differences, ranging from 5.7 to 1840.4 m. Normally, the station data represent the weather conditions on different subsurfaces. Generally, a bilinear interpolation method was employed to compare the accuracy of WRF simulation. The observations from meteorological stations were interpolated into the innermost 3 km grid of the WRF by using the Cressman algorithm (Yin et al., 2014) to validate the simulation results. The initial and lateral boundary field information of WRF was driven by Final Operational Global Analysis (FNL) reanalysis from the National Centers for Environmental Prediction with a horizontal resolution of 1° × 1° and 34 vertical pressure levels at 6-h intervals (00, 06, 12, and 18 UTC).
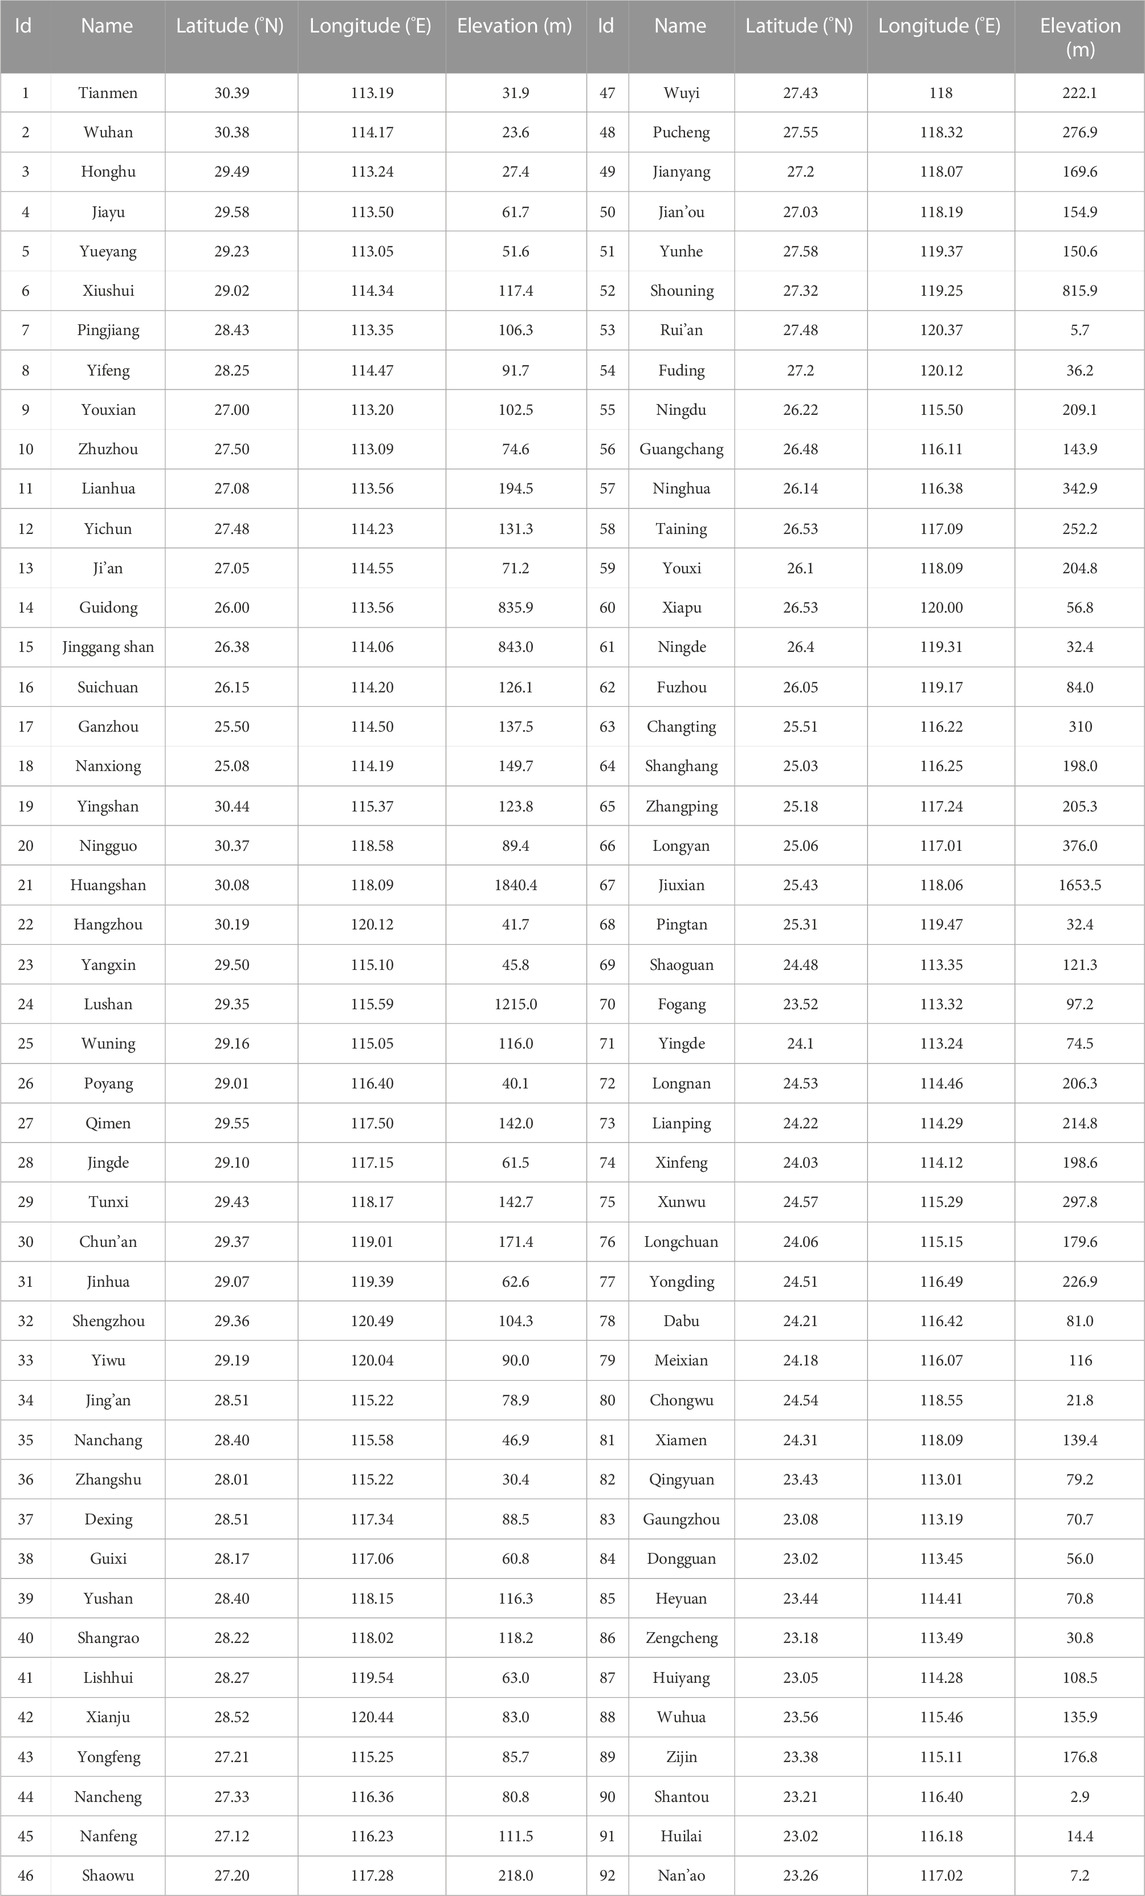
TABLE 1. Meteorological stations information.
WRF model configuration
The WRF model is a fully compressible, non-hydrostatic model, with the grid of Arakawa C and terrain following eta-coordinates. The model system integrates numerical weather prediction, atmospheric simulation and data assimilation (Jackson et al., 2008). WRF version 4.3 was used in this study. Three domains with a grid spacings of 27 (d01), 9 (d02), and 3 km (d03), respectively, were employed for the simulation (Figure 1). The domain sizes were 115 × 79, 202 × 160, and 280 × 286, respectively. The Lambert conformal conic projection was used as the model horizontal coordinates. The time steps were 90 s. Additionally, one-way nesting was applied in this study. The simulation of the three domains was initialized at 00 UTC 1 on July 2020 to 00 UTC on 11 July 2020. To ensure the accuracy of the simulated results, the first 36 h of the simulations were considered the model spin-up time, which was excluded from the data analysis. The model outputs at every 6 hours were employed for evaluation. The USGS data were used for topographic data with resolutions of 5, 2 m and 30 s, respectively. The regions of domains were set up with full consideration of the surrounding terrain and the influence of key weather and climate systems, avoiding cross regions with vastly different climate characteristics or geographic features in the simulation. The physical parameter schemes involved in this precipitation simulation experiment included the cumulus scheme (CU), microphysical scheme (MP) and land surface scheme (LSM). The specific combination members of the WRF model were listed in Table 2. The cumulus schemes (CUs) selected were Betts-Miller-Janjic (BMJ), Kain-Fritsch (KF) and New Tiedtke (NT). The microphysical schemes (MPs) evaluated were WRF Single-Moment 6-class (WSM6), Thompson and WRF Double-Moment 6 (WDM6), respectively. The suitable land surface models (LSMs) included Noah, Noah-MP and CLM4, respectively. In addition, the other WRF physical parameter schemes were found for the Rapid Radiative Transfer Model (RRTM) long wave radiation, Dudhia short wave radiation and Yonsei University (YSU) planetary boundary layer scheme. The cumulus scheme was not applied to the d03 domain (3 km) due to the high spatial resolution.
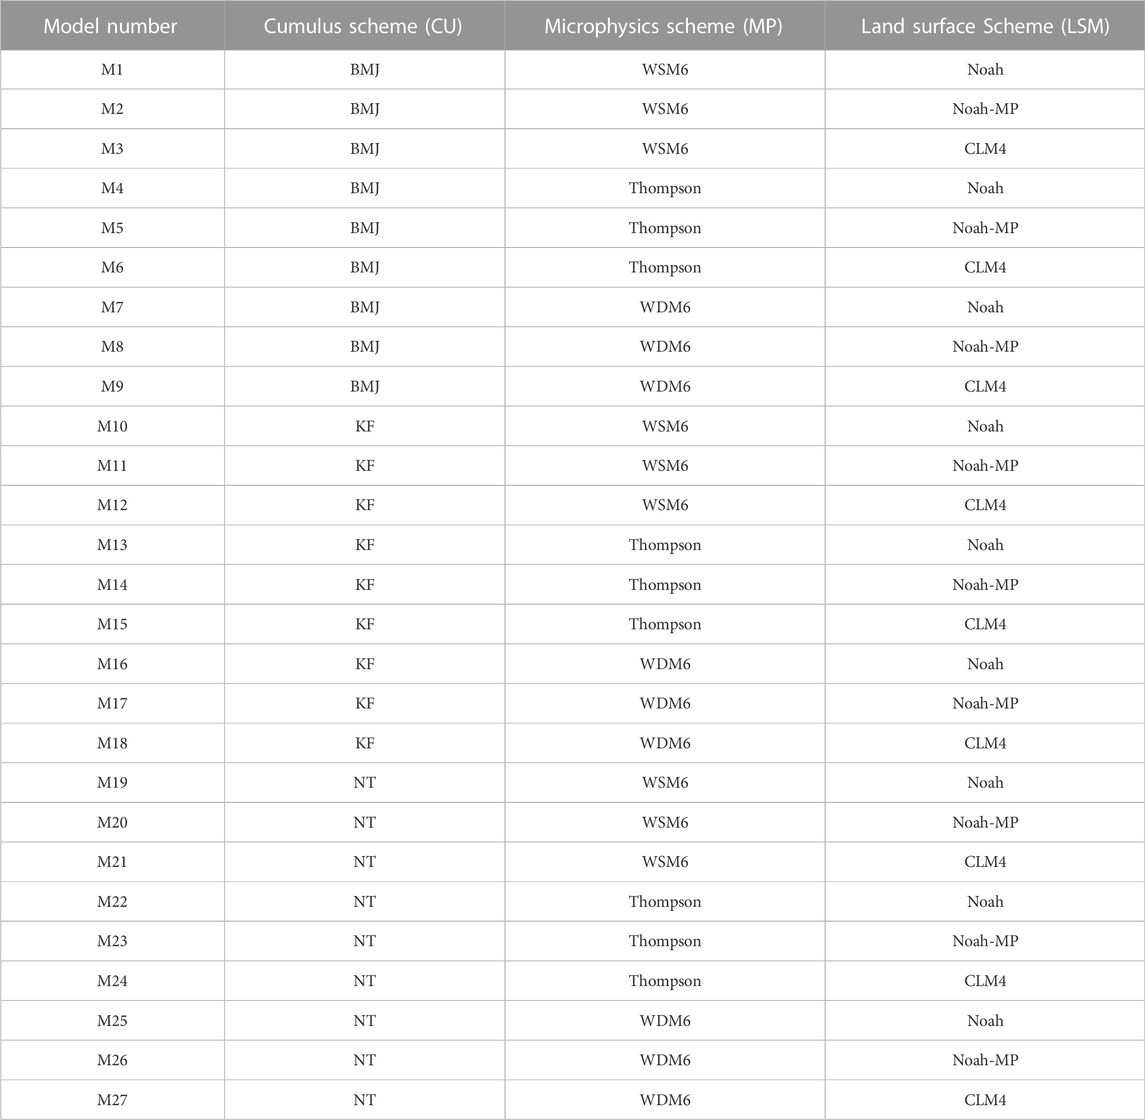
TABLE 2. Combinations of physical parameterization schemes in WRF simulations.
Evaluation criteria
To quantitatively validate the accuracy of the WRF results, the surface-scale and point-scale evaluation systems for the simulated results were established. Six statistical metrics were selected to verify the simulation performance of the precipitation. The statistical indicators of continuity included the correlation coefficient (CC), root mean square error (RMSE) and bias (Moazami et al., 2014; Kumar et al., 2017). The CC was used to measure the linear correlations between simulation and spatially interpolated observations. RMSE was used to measure the average error. Bias was employed to measure the precision of the results. The results with high CC and low RMSE indicate good simulation performance. Categorical statistical metrics (Sen et al., 2014; Jiang et al., 2021) were employed to evaluate the detection capacity for simulations, including the probability of detection (POD), false alarm ratio (FAR) and threat score (TS). The POD reflects the detection ability of a certain precipitation magnitude, FAR represents the empty report of the model on the precipitation magnitude, and TS is a comprehensive score for checking the performance of the model for eliminating the impact of random hits. The definition, formula and optimal value for the indices are shown in Table 2. The 95th percentile of the corresponding precipitation fields was selected as the threshold, which providing the comparison for the spatial distributions of the intense precipitation (Table 3).
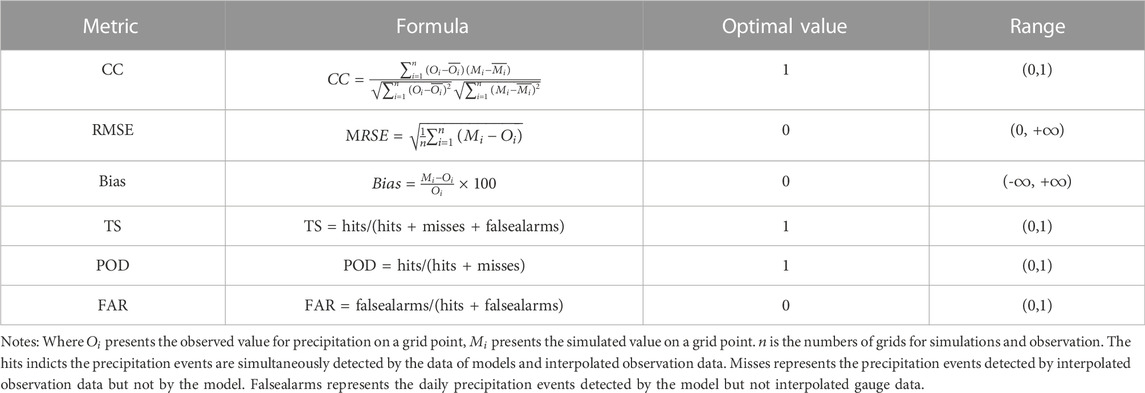
TABLE 3. Definition of evaluation criteria.
It is difficult to accurately select the parameterized scheme combination with the best comprehensive performance based on only one single evaluation and analysis. The emphasis of each metric was different. Therefore, Euclid distance (ED) (Van Cooten et al., 2009), which is defined as measuring the absolute distance between two points in multidimensional spaces, was employed to quantitatively and comprehensively evaluate each combination of WRF physical parameterization schemes. To represent different evaluation metrics, ED was of great significance in the optimal combination of numerical weather model parameterization schemes. Specifically, the six metrics of CC, MSRE, Bias, TS, POD and FAR were synthesized by a vector Se, defined as follows:
The values of the six metrics were further scaled to between 0 and 1. Then, the optimal theoretical values for the metrics were formed into vector [So (1,01,1,0)]. ED was calculated as the magnitude of difference of the vector Se and the vector So. With a lower value of ED, one combination member has better performance. For a more visual comparison, the similarity S defined by ED was employed, which can be formulated as follows:
where d represents the value of ED, and S represents similarity. The range is from 0 to 1. The higher S is, the smaller ED is, which means better simulation.
Results
Evaluation of TCP in WRF simulations
Figure 2 shows the comparison results of the simulations and observation (OBS) under different physical parameterization schemes. The value of reference points (REF) in the taylor diagram reached 1, and the central normalized RMSE was 0. In terms of cumulus schemes (CU), the simulation results were divided into three groups for comparison. Figure 2A shows the simulation results from M1 to M9. The cumulus schemes were all BMJs. The correlation coefficient for M8 was highest with a value of 0.793. In terms of the performance of the results from M10 to M18 with the cumulus schemes of KF, M11 had the highest value of 0.796, which is shown in Figure 2B. Similarly, Figure 2C shows the results from M19 to M27, which had the same cumulus schemes as KF. M19 had a good performance for correlation coefficient, with a value of 0.781. In terms of standard deviation, the values of M11, M2, M26, and M1 in the simulations were closest to 1, which indicated good performance. The distribution of the standard deviation was more dispersed for the simulated results of scheme combinations using the cumulus scheme of BML and KF, which means there was a large difference in simulation capability. The simulated results using the cumulus scheme of NT were relatively concentrated, mainly between 0.5 and 1. The spatial correlation coefficients between the simulated and observed values for 27 combinations were concentrated from 0.6 to 0.8. The highest correlation coefficient values were found for M8, M11, M19, and M4. The combinations with the lowest correlation coefficients (below 0.65) were M6, M13, and M15. Overall, M11 performed well in terms of the correlation coefficient and standard deviation. Among the three CU schemes investigated in this study, the WRF combination members using KF displayed larger central root mean square error, lower correlation coefficient, and poorer standard deviation. Therefore, the BML and NT schemes performed better for extreme precipitation over the PLB.
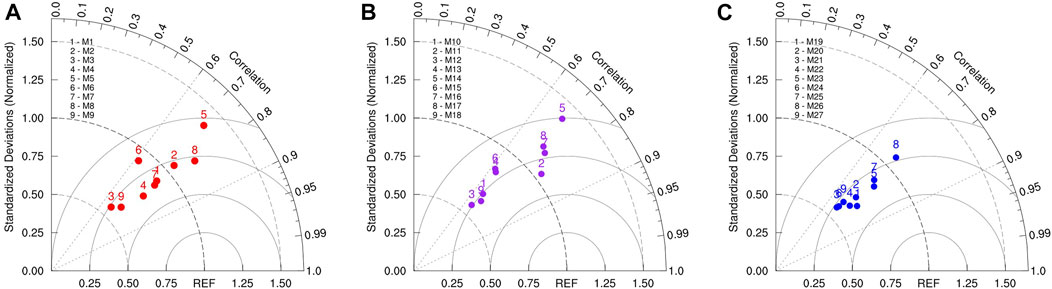
FIGURE 2. Taylor diagram of TCP for WRF combination members. (A) WRF combinations for BMJ cumulus schemes; (B) KF cumulus schemes; (C) NT cumulus schemes.
Table 4 shows the performance of categorical statistical metrics (TS, POD, FAR) for 27 WRF combination members. This revealed the accuracy of precipitation forecasting. For the TS metric, the highest score was found for M15, followed by M7, M5, and M22, which were more than 0.5. However, M13, M14, M17, and M26 had the lowest scores (below 0.1). For POD, the highest score was found for M15, followed by M7, M5, and M22, which all exceeded 0.7. M13, M14, and M17 had the lowest scores (below 0.1). M5, M7, M15, and M22 showed better FAR scores (below 0.3), especially M15, which has the lowest value of 0.21, indicating a low false alarm rate. However, M13, M14, M17, and M26 showed worse performance with high FAR scores (over 0.8). Overall, M15 performed best, followed by M7, M5, and M22, while M13, M14, and M17 performed worst among the three evaluation metrics. The combination members using the BMJ and KF schemes were better than those using KF in precipitation forecasting for WRF simulations. Additionally, with the same CU and MP schemes, the precision of M15 was better than those of M13 (with the Noah LSM) and M14 (with the Noah-MP LSM), which were mainly controlled by the land surface scheme.
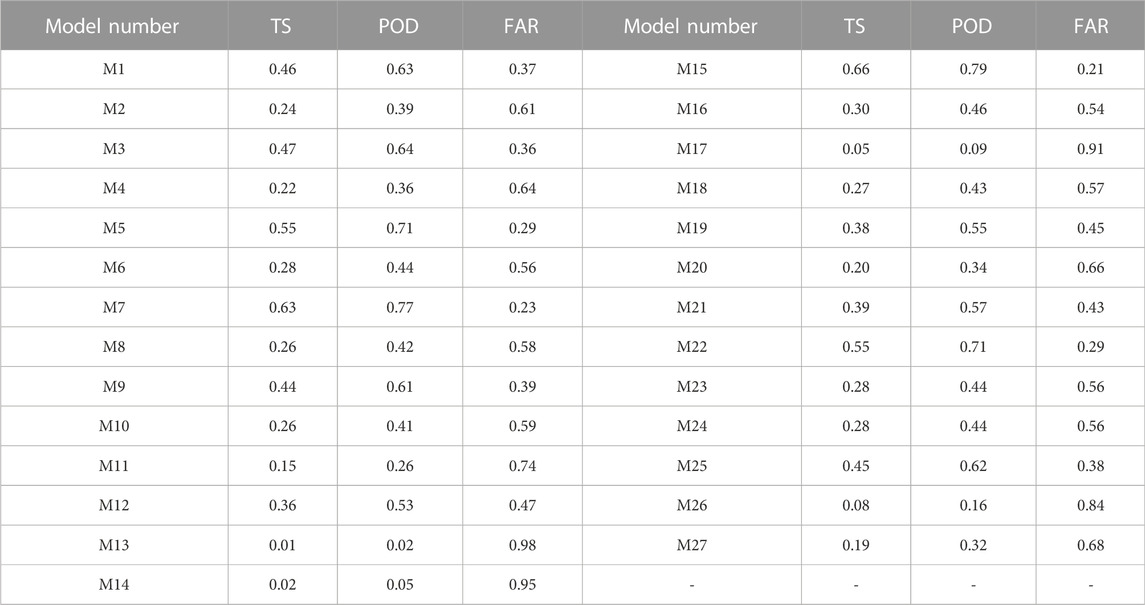
TABLE 4. Scores of evaluation metrics for total cumulative precipitation.
Table 5 shows the similarity based on ED ranking from highest to lowest for 27 combinations in terms of TCP. The value of similarity ranged from 0.333 to 0.518. The values of WRF combination members were relatively close and concentrated from 0.4 to 0.5. The highest value was found for M7, which indicated that M7 displayed the best performance for the simulation of TCP. The lowest value was found for M14. M22, M25, and M1 demonstrated high values of similarity, followed by M7. Among the five combination members with the highest values, the simulations using WDM6 and WSM6 for the MP scheme, which configured the same CU scheme options of BMJ, were more suitable for extreme precipitation forecasting. In terms of the NT cumulus scheme, Thompson and WDM6 were more suitable for the simulation configuration. Noah was found to be the best land surface scheme. Therefore, the combination member of BMJ-WDM6-Noah performed best.
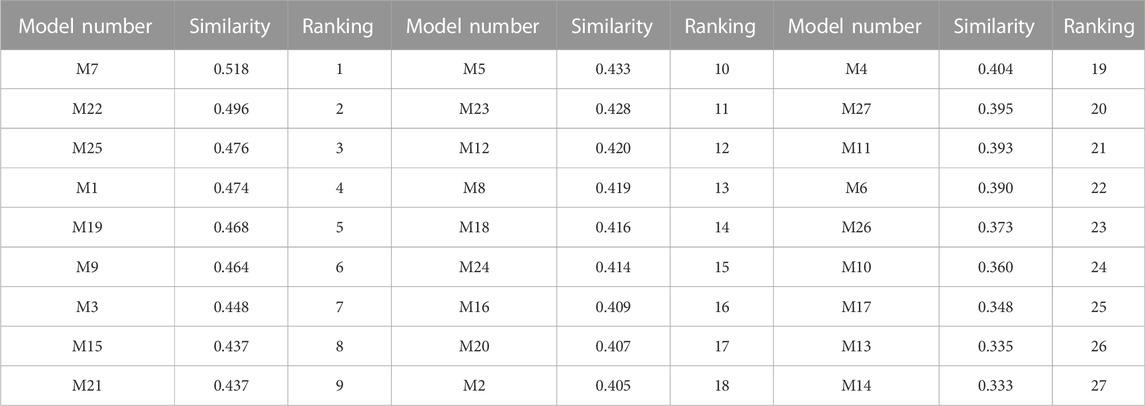
TABLE 5. Similarity by Euclidean distance for WRF combination members.
Figure 3 shows the range and mean value of the TCP for the observation (OBS) and WRF simulation. The TCP is shown in Figure 3A. The value of observation was relatively concentrated, with the quartile (25%–75%) ranging from 200 to 400 mm. The differences among the simulated results were significant. For example, M5, M14, M15, and M16 demonstrated relatively smaller ranges, while M21, M24, and M27 displayed larger ranges. All simulation members underestimated the median values compared to the OBS. The median value of M19 was closest to OBS. For maximum values, all simulation members were higher than OBS, especially M9 and M21, which had the largest difference. In terms of mean values (Figure 3B), the deviation between M19 and OBS was smallest, followed by M3, M9, M18, M21, M22, M24, and M27 (over 200 mm), with relatively small differences from OBS. Additionally, M18, M19, M20, M21, M24, and M27 overestimated the 75th percentile values compared to OBS. However, the difference among them was small. In general, the deviation between M19 and OBS was the smallest. Therefore, M19 was regarded as the optimal member among the 27 simulation scheme combinations.
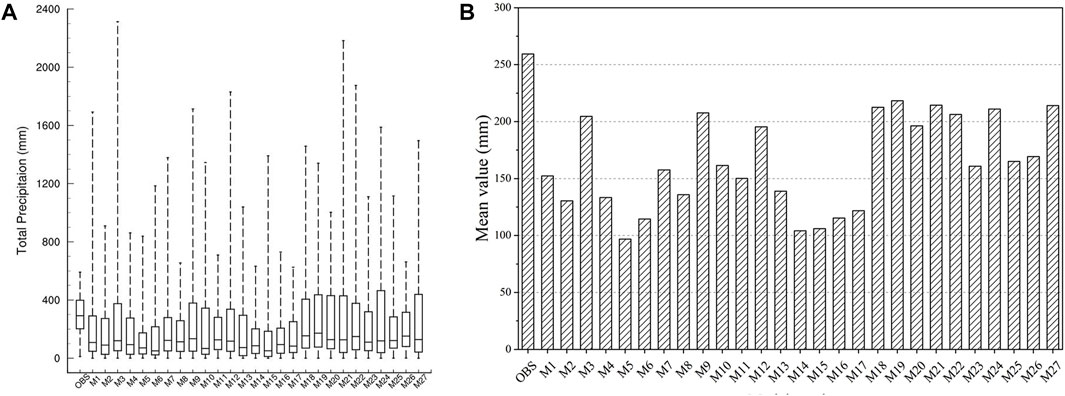
FIGURE 3. TCP of observation and WRF simulations. (A) Range of TCP for simulation and observation. Thick horizontal lines in boxes indicate the median values, and boxes show the inner-quartile (25%–75%). (B) Mean values of the TCP.
Spatial evaluation of TCP in WRF simulations
Figure 4 illustrates the spatial distributions of TCP for WRF combination members and OBS by interpolation. Spatially, the OBS indicated that the TCP generally increased from south to north of PLB, exhibiting a clear gradient, with the maximum precipitation in the northeast and the minimum in the south of the basin. The low value appeared near Poyang Lake. The storm centre with high values (over 400 mm) was mainly located in the northeastern PLB, specifically the Raohe Basin, the western Xinjiang Basin, and a small part of the northern Ganjiang and Fuhe Basins. According to the simulated combination members, the results can basically reproduce the spatial distribution characteristics of the TCP showing an increasing trend from south to north as a whole. The storm centre with high values appeared in the northeastern PLB. The maximum precipitation (over 600 mm)of the WRF simulation was higher than the observed value. The high value appeared in Poyang Lake, which was contrary to the result of OBS. This may be due to the lack of meteorological stations near Poyang Lake, resulting in some differences between the observations by spatial interpolation and simulations. The distribution of the storm centre (high value) was different from the OBS. The simulation combination members underestimated the coverage of the high value area, which was further north relative to the OBS. The performance of the simulation combination members was different. In terms of the storm centre, the distributions of M7 and M1 were relatively small and concentrated in the Raohe Basin, with the maximum precipitation in the northeastern PLB. The distribution of M22 was relatively large and mainly concentrated in the Raohe Basin, Xiushui Basin, and Poyang Lake, and the maximum precipitation was in the northern Raohe Basin. M25 was mainly distributed in the Raohe Basin, the northeastern area of Poyang Lake (more than 400 mm) and the northern Ganjiang and Fuhe Basins. However, less precipitation was found in the southwestern PLB. In contrast, the precipitation centre of M19 covered the largest area with a distribution of five subbasins, which can more effectively capture the precipitation of the PLB.
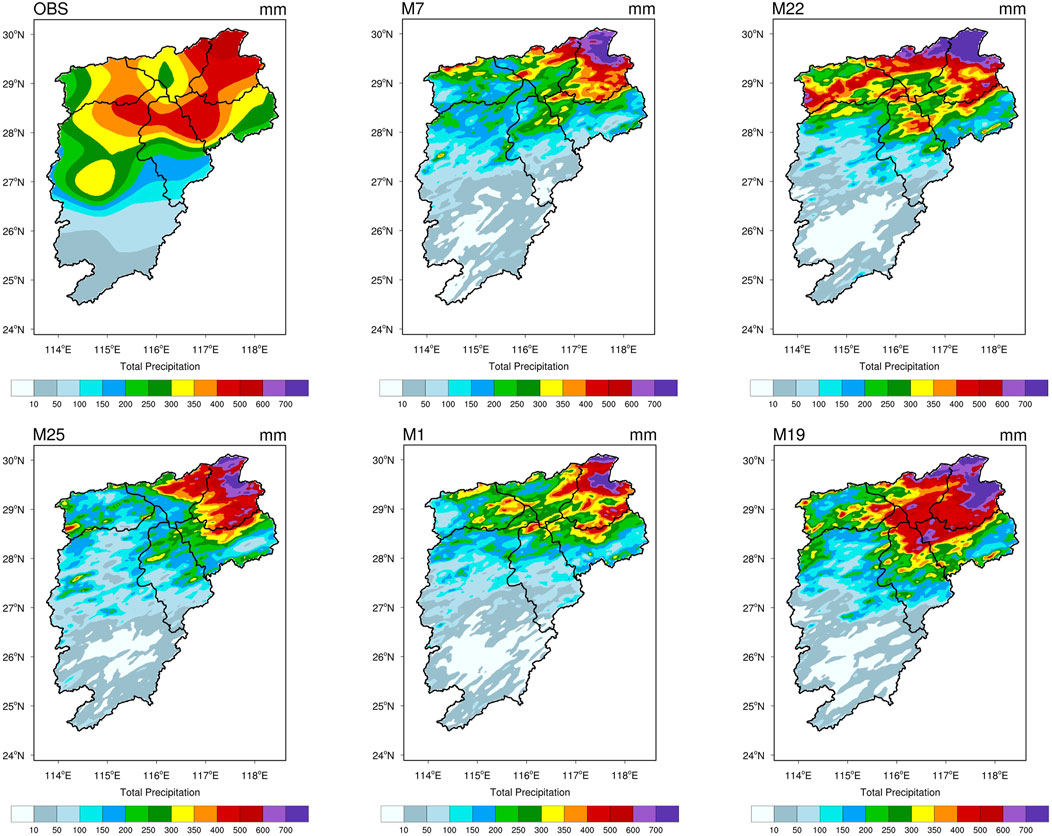
FIGURE 4. Spatial distribution of TCP for OBS and WRF combination members.
To more intuitively analyse the spatial difference, Figure 5 describes the bias distribution of WRF simulations compared to the interpolated observation (simulated value minus the observed value). Overall, a negative value indicated that the WRF simulation underestimated the OBS, while a positive value indicated an overestimation. The largest underestimation was found in the central and western regions of the PLB, concentrated in the central and northern parts of the Ganjiang Basin. In addition, the junction areas of Xinjiang and Fuhe Basin underestimated precipitation. The overestimated areas were found in the northeastern part of the BLP, mainly in the Raohe Basin and Poyang Lake. Specifically, the overestimation areas for M22 and M19 were larger than those of M7, M25, and M1. The overestimated area for M22 was distributed in the northern Raohe Basin, Poyang Lake, and Xiushui Basin. For M19, overestimation is found at the junction with Xinjiang and the Fuhe Basin, especially in the Raohe Basin and Poyang Lake. Additionally, the overestimated areas were scattered in the middle of the Fuhe Basin but did not appear in other simulations.
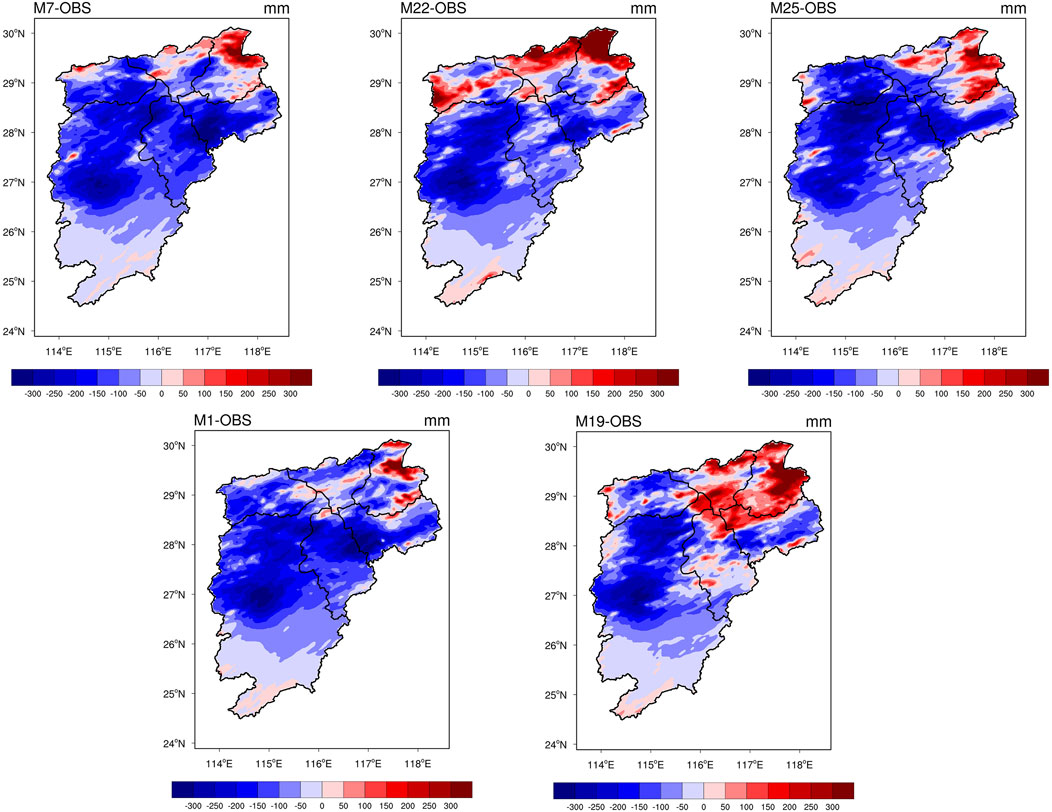
FIGURE 5. Bias distribution of WRF combination members compared to observed precipitation by interpolation (simulation minus observation).
Temporal validation of daily precipitation
Figure 6 shows the time series of average daily precipitation of the observations and 27 combination members over the PLB. For the OBS (black line), the minimum value appeared on 6 July 2020 with a value of 7.09 mm. The maximum value was found on 9 July 2020 with a value of 68.78 mm. For WRF simulations, most of the combination members fit the OBS well from 3 July and 7 July, while the simulated values were underestimated compared to the OBS from 7 July to 10 July. In particular, the maximum overestimation occurred at the peak of rainfall. Among the combination members, M3 demonstrated the best performance, followed by M21, M22, and M24 (thick lines). However, M13, M18, and M12 displayed great differences compared to the OBS, resulting in poor fittings. Figure 7 shows the correlation coefficient (CC) and root mean square error (RMSE) for 27 WRF simulations. For CC, the maximum value (0.96) was found for M3, followed by M21, M24, M22, and M27. In terms of RMSE, the minimum value of M24 was 11.9 mm. day-1, followed by M21, M3, M27, and M22. Overall, for the change in average daily precipitation, the best performers were M21, M3, M24, and M22, while the worst performer was M13.
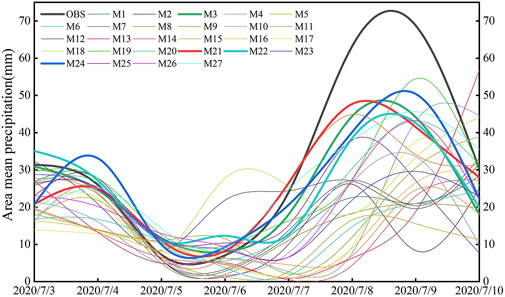
FIGURE 6. Time series of average daily precipitation for observation and WRF simulations.
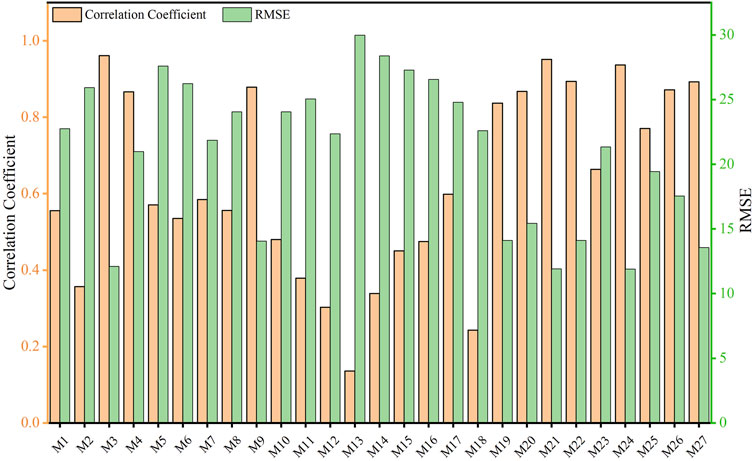
FIGURE 7. The correlation coefficient and RMSE for 27 WRF combination members.
For those combination members with good performance in daily precipitation, M22, M3, and M21 performed better in TCP evaluation, while M24 performed worse. Among the five combinations (M7, M22, M25, M1, and M19) with the best performance of TCP, M19, and M25 performed well with small bias for daily precipitation, while M7 and M1 displayed large bias.
Discussion
Identification of suitable WRF combinations for physical schemes
This study selected a typical extreme precipitation event in the PBL. The study area is located in the lower reaches of the Yangtze River basin, where the precipitation variation is large, and the terrain with many mountains is complex, resulting in difficulty for simulation. In this study, the high-resolution WRF model was used to simulate precipitation, which was especially beneficial to the areas with complex terrain. We found that WRF basically simulated the spatial distribution of precipitation that the storm centre was located in the north of the PLB, which was similar to a previous study. Yu et al. (2011) captured the rainstorm centre and the main rain belt by using WRF, which was distributed from northeast to southwest in the Yangtze River Basin. Bao et al. (2015) found that WRF showed a high spatial pattern correlation with observations in extreme precipitation simulations. Therefore, the WRF model has been proven to be effective in simulating extreme precipitation. However, the simulation is influenced by other factors that can lead to certain deviations. For example, the deviation near Poyang Lake may be affected by the lack of meteorological stations. For comparison with simulations, the meteorological stations were interpolated in the grid of WRF by bilinear interpolation method. Although the errors of results were limited by the distances and numbers of the ground stations, the required spatial resolution of observation was obtained by interpolation method (Yang Q et al., 2021). Global or regional precipitation products such as the Tropical Rainfall Measuring Mission (TRMM) and China Precipitation Analysis (CPA) data have been increasingly applied to the validation of model results, which effectively overcome the impact of sparse ground stations (Nooni et al., 2022). Therefore, the precipitation datasets from satellite and reanalysis product can be also considered in WRF evaluation in future work. The maximum deviation in the central and northern parts of the Ganjiang Basin may be affected by the mountainous terrain (Argüeso et al., 2012; Bian et al., 2022). In addition, it may also be affected by the uneven spatiotemporal distribution of precipitation.
Compared with fixed physical parameterization schemes, the combination of microphysical schemes, cumulus schemes and land surface schemes performs differently in extreme precipitation. For extreme precipitation simulations, it is still a challenge to identify the optimal configuration from a large number of combined physical schemes (Zhou et al., 2018). Our findings showed that the performance of WRF combinations in simulating extreme precipitation is restricted by evaluation metrics. It is difficult for one combination to maintain its best performance consistently in all metrics. In terms of the evaluation of TCP, the combination of M7 (BMJ-WDM6-Noah) was the most suitable simulation, followed by M22 (NT-Thompson-Noah). Combined with the daily precipitation evaluation, M3 (NT-Thompson-Noah) was the optimal combination due to the minimum bias of daily precipitation. Although M7, M25, and M1 performed well in the total rainfall evaluation, their daily precipitation error was large. M24 and M27 showed small daily precipitation errors, but displayed worse performance in the total cumulative precipitation assessment. This may be related to the serious underestimation of the simulation value from 7 July to 10 July. The results reveal that the identification of physical schemes is based on the study area and precipitation characteristics. The temporal evaluation and spatial distribution of precipitation have brought uncertainty to the simulation. Therefore, the appropriate combination should be determined by the research emphasis. Based on the comprehensive factor, five optimal WRF combinations are identified for the extreme precipitation in the PLB (Table 6). Therefore, the construction of a quantitative and integrated parametric scheme combination evaluation method is an important issue for future research on precipitation simulation.
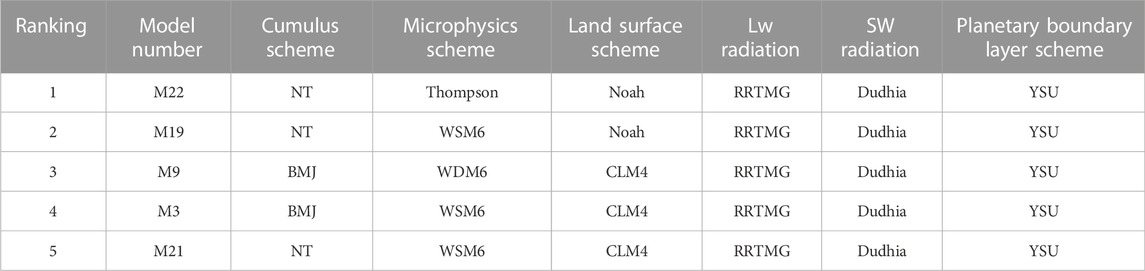
TABLE 6. Optimal combinations of WRF physical schemes.
Applicability of physical schemes
Research on physical schemes has received extensive attention, such as the comparison of microphysical schemes, radiation schemes, cumulus schemes and the performance of WRF ensembles. Many studies have confirmed that the magnitude and distribution of precipitation are sensitive to the CU and MP schemes (Zhou et al., 2018; Ma et al., 2019). Our findings demonstrated that the performance of the KF evaluated in this study was the worst, which is different from the results of previous studies. One possible reason is the regional dependencies for different cumulus schemes (Yu et al., 2011). By comparing the three microphysical schemes of WSM6, WDM6 and Thompson, we found that Thompson was the best for the simulation in the PLB, which indicated that the scheme containing more complete and complex cloud physical processes in the high-resolution simulation was more advantageous. The investigation was also similar to previous evaluation studies. Merino et al. (2022) found that the Thompson scheme had the best performance in the verification of extreme precipitation in the Mediterranean by using the station data. For the microphysical parameter evaluation of extreme precipitation in the central Himalayas, the model results driven by the Thompson scheme were found to have the best consistency with the observation results (Karki et al., 2018).
Few relevant studies have focused on parameter schemes over PLB, especially for the sensitivity of microphysical schemes (Wagner et al., 2013). Previous studies have found that the WSM6 scheme has a good simulation effect in most areas of China. Our results demonstrated that WDM6 of MP outperforms WSM6 in the case of the same cumulus scheme. WDM6 and Thompson have advantages in simulating convective clouds of precipitation due to the double moment method scheme (Xue et al., 2021).
The WRF members behaved differently for each of the evaluation metrics, resulting in a challenge in identifying the suitable combination of physical schemes. Therefore, the confirmation of the physical scheme was based on actual needs, which gradually became an indicative factor. As physical processes in atmospheric simulations are susceptible to topographic and climatic conditions, the physical scheme plays a decisive role in the simulation process. The accuracy of WRF simulation is influenced by driving conditions, domain scales and terrains. Therefore, the NWP precipitation evaluation index system needs to be constructed to improve the simulation accuracy. By optimizing the combination of parameterization schemes, the simulation results are more reliable than the default parameters of the model. These investigations demonstrate a reference for regional extreme precipitation forecasting. The limitation of this study was the number of extreme precipitation events. The extreme precipitation events selected in this study was a typical event, which has more serious negative impact on Poyang Lake Basin. Previous studies have shown that the rainstorm in the first 10 days of July is an important reason for the flood in the PLB, accounting for a large proportion of historical disasters. Therefore, this rainstorm is a typical event, it can represent the basic law of rainstorm (similar atmospheric physical mechanisms) and flood in this basin. We set up comparative ensemble tests as many as possible to reduce the errors caused by this typical event. In general, our research is universal and representative. In addition, the different initial and lateral boundary conditions for WRF should also be explored for more accurate forecasting of extreme weather events at the local scale.
Conclusion
This study simulated extreme precipitation events over the PLB by numerical weather forecasting from 1 July to 10 July 2020. To reproduce the extreme precipitation process, 27 combination members of WRF physical schemes were designed, with three CU schemes (KF, BMJ, GF), three MP schemes (WDM6, WSM6, Thompson) and three land surface schemes (Noah, Noah-MP, CLM4). Additionally, compared to the observations interpolated by data from 92 meteorological stations data, the appropriate WRF configurations were identified by spatial and temporal evaluation. Then, the major findings were summarized as follows.
1) The spatial comparison showed that the WRF model basically simulated the spatial and temporal distribution of extreme precipitation over the PLB and captured the precipitation centre in the northeast of the PLB. However, compared with the observed value, the WRF combinations showed the overestimation mainly in the Raohe Basin and Poyang Lake. The largest underestimation was found in the central and western regions of the PLB, concentrated in the central and northern parts of the Ganjiang Basin.
2) For TCP, the metrics of CC, RMSE, Bias, TS, POD, and FAR were employed to validate the performance of WRF combination members. The spatial correlation coefficients ranged from 0.6 to 0.8 for WRF combination members. And M11 has the highest value of 0.796. For standard deviation, the values of M11, M2, M26, and M1 in the simulations were closest to 1. In terms of categorical statistical metrics, the highest scores (TS, POD, FAR) were found for M15, followed by M7. The TS, POD and FAR of M15 were 0.66, 0.79, and 0.21, respectively. Based on the comprehensive ED metric, the value of similarity ranged from 0.333 to 0.518. M7 with maximum similarity (0.518) demonstrated the best performance in extreme precipitation simulation. The quartile (25%–75%) of observation ranged from 200 to 400 mm. The mean value of OBS and M19 were 259.34 and 218.33 mm, respectively. The deviation between M19 and OBS was smallest. In addition, M19 performed well in the range of the TCP.
3) For the error analysis of daily precipitation, the maximum value of CC was 0.96, which was found for M3. The minimum value of RMSE was 11.9 mm. day-1, which was found for M24. The simulated values were underestimated compared to the OBS from 7 July to 10 July. M3 (BMJ-WSM6-CLM4) and M21 (NT-WSM6-CLM4) were optimal among the members. In general, five optimal combinations of WRF physical schemes (M22, M19, M9, M3, M21) were selected for extreme precipitation simulation over the PLB in this study.
Data availability statement
The original contributions presented in the study are included in the article/supplementary material, further inquiries can be directed to the corresponding author.
Author contributions
LG and CD designed the research scheme and completed model simulation, CD prepared the original draft, LG edited and reviewed the manuscript, CD, YH, and CJ contributed to the data collection and processing, YC, LS, HL, LJ, and XG contributed to the discussion. All authors have read and agreed to the published version of the manuscript.
Funding
This work was supported by the National Natural Science Foundation of China (Grant No. 42271030), Fujian Provincial Funds for Distinguished Young Scientists (Grant No. 2022J06018).
Conflict of interest
The authors declare that the research was conducted in the absence of any commercial or financial relationships that could be construed as a potential conflict of interest.
Publisher’s note
All claims expressed in this article are solely those of the authors and do not necessarily represent those of their affiliated organizations, or those of the publisher, the editors and the reviewers. Any product that may be evaluated in this article, or claim that may be made by its manufacturer, is not guaranteed or endorsed by the publisher.
References
Argüeso, D., Hidalgo-Muñoz, J. M., Gámiz-Fortis, S. R., Esteban-Parra, M. J., and Castro-Díez, Y. (2012). Evaluation of WRF mean and extreme precipitation over Spain: Present climate (1970–99). J. Clim. 25 (14), 4883–4897. doi:10.1175/jcli-d-11-00276.1
Bao, J., Feng, J., and Wang, Y. (2015). Dynamical downscaling simulation and future projection of precipitation over China. J. Geophys. Res. Atmos. 120 (16), 8227–8243. doi:10.1002/2015jd023275
Bian, Y., Sun, P., Zhang, Q., Luo, M., and Liu, R. J. J. o. H. (2022). Amplification of non-stationary drought to heatwave duration and intensity in eastern China: Spatiotemporal pattern and causes. J. Hydrology 612, 128154. doi:10.1016/j.jhydrol.2022.128154
Camuffo, D., Becherini, F., and della Valle, A. (2020). Relationship between selected percentiles and return periods of extreme events. Acta Geophys. 68 (4), 1201–1211. doi:10.1007/s11600-020-00452-x
Chinta, S., Yaswanth Sai, J., and Balaji, C. (2021). Assessment of WRF model parameter sensitivity for high-intensity precipitation events during the Indian summer monsoon. Earth Space Sci. 8 (6). doi:10.1029/2020ea001471
Cossu, F., and Hocke, K. (2014). Influence of microphysical schemes on atmospheric water in the Weather Research and Forecasting model. Geosci. Model Dev. 7 (1), 147–160. doi:10.5194/gmd-7-147-2014
Di, Z., Duan, Q., Gong, W., Wang, C., Gan, Y., Quan, J., et al. (2015). Assessing WRF model parameter sensitivity: A case study with 5 day summer precipitation forecasting in the greater beijing area. Geophys. Res. Lett. 42 (2), 579–587. doi:10.1002/2014gl061623
Di, Z., Duan, Q., Wang, C., Ye, A., Miao, C., and Gong, W. (2017). Assessing the applicability of WRF optimal parameters under the different precipitation simulations in the Greater Beijing Area. Clim. Dyn. 50 (5-6), 1927–1948. doi:10.1007/s00382-017-3729-3
Gao, L., Huang, J., Chen, X. W., Chen, Y., and Liu, M. B. (2017). Risk of extreme precipitation under nonstationarity conditions during the second flood season in the southeastern coastal region of China. J. Hydrometeorol. 18 (3), 669–681. doi:10.1175/jhm-d-16-0119.1
Gao, L., Wei, J., Lei, X., Ma, M., Wang, L., Guan, X., et al. (2022). Simulation of an extreme precipitation event using ensemble-based WRF model in the southeastern coastal region of China. Atmosphere 13 (2), 194. doi:10.3390/atmos13020194
Gao, W., Chang, N.-B., Wang, J., Kan, Y., Liu, C., Liu, Y., et al. (2015). “Evaluation of WRF microphysics and cumulus parameterization schemes in simulating a heavy rainfall event over Yangtze River delta,” in Proceeding of the Remote Sensing and Modeling of Ecosystems for Sustainability XII. Paper presented at the.
Jackson, C. S., Sen, M. K., Huerta, G., Deng, Y., and Bowman, K. P. (2008). Error reduction and convergence in climate prediction. J. Clim. 21 (24), 6698–6709. doi:10.1175/2008jcli2112.1
Ji, D., Dong, W., Hong, T., Dai, T., Zheng, Z., Yang, S., et al. (2018). Assessing parameter importance of the weather research and forecasting model based on global sensitivity analysis methods. J. Geophys. Res. Atmos. 123 (9), 4443–4460. doi:10.1002/2017jd027348
Jia, H., Chen, F., Pan, D., Du, E., Wang, L., Wang, N., et al. (2022). Flood risk management in the Yangtze River basin—comparison of 1998 and 2020 events. Int. J. Disaster Risk Reduct. 68, 102724. doi:10.1016/j.ijdrr.2021.102724
Jiang, Q., Li, W. Y., Fan, Z. D., He, X. G., Sun, W. W., Chen, S., et al. (2021). Evaluation of the ERA5 reanalysis precipitation dataset over Chinese Mainland. J. Hydrology 595, 125660. doi:10.1016/j.jhydrol.2020.125660
Jin, J., Miller, N. L., and Schlegel, N. (2010). Sensitivity study of four land surface schemes in the WRF model. Adv. Meteorology 2010, 1–11. doi:10.1155/2010/167436
Jonkman, S. N. (2005). Global perspectives on loss of human life caused by floods. Nat. Hazards 34 (2), 151–175. doi:10.1007/s11069-004-8891-3
Karki, R., Hasson, S. u., Gerlitz, L., Talchabhadel, R., Schenk, E., Schickhoff, U., et al. (2018). WRF-based simulation of an extreme precipitation event over the Central Himalayas: Atmospheric mechanisms and their representation by microphysics parameterization schemes. Atmos. Res. 214, 21–35. doi:10.1016/j.atmosres.2018.07.016
Kumar, D., Pandey, A., Sharma, N., and Flugel, W. A. (2017). Evaluation of TRMM-precipitation with rain-gauge observation using hydrological model J2000. J. Hydrologic Eng. 22 (5). doi:10.1061/(asce)he.1943-5584.0001317
Lei, X., Xu, W., Chen, S., Yu, T., Hu, Z., Zhang, M., et al. (2022). How well does the ERA5 reanalysis capture the extreme climate events over China? Part I: Extreme precipitation. Front. Environ. Sci. 10, 921658. doi:10.3389/fenvs.2022.921658
Lei, X. Y., Gao, L., Ma, M. M., Wei, J. H., Xu, L. G., Wang, L., et al. (2021). Does non-stationarity of extreme precipitation exist in the Poyang Lake Basin of China? J. Hydrology-Regional Stud. 37, 100920. doi:10.1016/j.ejrh.2021.100920
Liu, B. J., Chen, X. H., Chen, J. F., and Chen, X. H. (2017). Impacts of different threshold definition methods on analyzing temporal-spatial features of extreme precipitation in the Pearl River Basin. Stoch. Environ. Res. Risk Assess. 31 (5), 1241–1252. doi:10.1007/s00477-016-1284-9
Lv, M., Xu, Z., and Yang, Z. L. (2020). Cloud resolving WRF simulations of precipitation and soil moisture over the central Tibetan plateau: An assessment of various physics options. Earth Space Sci. 7 (2). doi:10.1029/2019ea000865
Ma, J. H., Wang, H. J., and Fan, K. (2015). Dynamic downscaling of summer precipitation prediction over China in 1998 using WRF and CCSM4. Adv. Atmos. Sci. 32 (5), 577–584. doi:10.1007/s00376-014-4143-y
Ma, Y., Yang, Y., Qiu, C., and Wang, C. (2019). Evaluation of the WRF-lake model over two major freshwater lakes in China. J. Meteorological Res. 33 (2), 219–235. doi:10.1007/s13351-019-8070-9
Mahajan, S., Evans, K. J., Branstetter, M., Anantharaj, V., and Leifeld, J. K. (2015). “Fidelity of precipitation extremes in high resolution global climate simulations,” in Proceeding of the Annual International Conference on Computational Science (ICCS), Reykjavik, ICELAND (Amsterdam, Netherlands: Reykjavik Univ). Paper presented at the 15th.
Merino, A., García-Ortega, E., Navarro, A., Sánchez, J. L., and Tapiador, F. J. (2022). WRF hourly evaluation for extreme precipitation events. Atmos. Res. 274, 106215. doi:10.1016/j.atmosres.2022.106215
Moazami, S., Golian, S., Kavianpour, M. R., and Hong, Y. (2014). Uncertainty analysis of bias from satellite rainfall estimates using copula method. Atmos. Res. 137, 145–166. doi:10.1016/j.atmosres.2013.08.016
Nooni, I. K., Tan, G. R., Yan, H. M., Chaibou, A. A. S., Habtemicheal, B. A., Gnitou, G. T., et al. (2022). Assessing the performance of WRF model in simulating heavy precipitation events over East africa using satellite-based precipitation product. Remote Sens. 14 (9), 1964. doi:10.3390/rs14091964
O'Gorman, P. A. (2015). Precipitation extremes under climate change. Curr. Clim. Change Rep. 1 (2), 49–59. doi:10.1007/s40641-015-0009-3
Qiao, Y., Xu, W., Meng, C., Liao, X., and Qin, L. (2022). Increasingly dry/wet abrupt alternation events in a warmer world: Observed evidence from China during 1980–2019. Int. J. Climatol. 42 (12), 6429–6440. doi:10.1002/joc.7598
Rajeevan, M., Kesarkar, A., Thampi, S. B., Rao, T. N., Radhakrishna, B., and Rajasekhar, M. (2010). Sensitivity of WRF cloud microphysics to simulations of a severe thunderstorm event over Southeast India. Ann. Geophys. 28 (2), 603–619. doi:10.5194/angeo-28-603-2010
Sen, B., Kilinc, R., Sen, B., and Sonuc, E. (2014). Validation of daily precipitation estimates of the regional climate model regcm4 over the domains in Turkey with NWP verification techniques. Fresenius Environ. Bull. 23 (8A), 1892–1903.
Stegall, S. T., and Kunkel, K. E. (2019). Simulation of daily extreme precipitation over the United States in the CMIP5 30-yr decadal prediction experiment. J. Appl. Meteorology Climatol. 58 (4), 875–886. doi:10.1175/jamc-d-18-0057.1
Sun, J. Q., and Ao, J. (2013). Changes in precipitation and extreme precipitation in a warming environment in China. Chin. Sci. Bull. 58 (12), 1395–1401. doi:10.1007/s11434-012-5542-z
Sun, J., Xue, M., Wilson, J. W., Zawadzki, I., Ballard, S. P., Onvlee-Hooimeyer, J., et al. (2014). Use of NWP for nowcasting convective precipitation: Recent progress and challenges. Bull. Am. Meteorological Soc. 95 (3), 409–426. doi:10.1175/bams-d-11-00263.1
Van Cooten, S., Elmore, K. L., Barbe, D. E., McCorquodale, J. A., and Reed, D. J. (2009). A statistical methodology to discover precipitation microclimates in Southeast Louisiana: Implications for coastal watersheds. J. Hydrometeorol. 10 (5), 1184–1202. doi:10.1175/2009jhm1076.1
Wagner, S., Fersch, B., Kunstmann, H., Yuan, F., Yang, C., and Yu, Z. (2013). “Hydrometeorological modelling for Poyang Lake region, China,” in Proceeding of the International Association of Hydrological Sciences Symposium on Climate and Land Surface Changes in Hydrology, Gothenburg, SWEDEN (Wallingford, England: IAHS-IAPSO-IASPEI Joint Assemply). Paper presented at the.
Wagner, S., Fersch, B., Yuan, F., Yu, Z. B., and Kunstmann, H. (2016). Fully coupled atmospheric-hydrological modeling at regional and long-term scales: Development, application, and analysis of WRF-HMS. Water Resour. Res. 52 (4), 3187–3211. doi:10.1002/2015wr018185
Wang, S. Z., Yu, E. T., and Wang, H. J. (2012). A simulation study of a heavy rainfall process over the Yangtze River valley using the two-way nesting approach. Adv. Atmos. Sci. 29 (4), 731–743. doi:10.1007/s00376-012-1176-y
Wu, Q., Xu, B., Wang, Y. H., and Zhan, M. J. (2021). Intraseasonal evolution and climatic characteristics of hourly precipitation during the rainy season in the Poyang Lake Basin, China. Geomatics Nat. Hazards Risk 12 (1), 1931–1947. doi:10.1080/19475705.2021.1953619
Wu, T. J., Min, J. Z., and Wu, S. (2019). A comparison of the rainfall forecasting skills of the WRF ensemble forecasting system using SPCPT and other cumulus parameterization error representation schemes. Atmos. Res. 218, 160–175. doi:10.1016/j.atmosres.2018.11.016
Xue, H. L., Zhou, X., Luo, Y. L., and Yin, J. F. (2021). Impact of parameterizing the turbulent orographic form drag on convection-permitting simulations of winds and precipitation over South China during the 2019 pre-summer rainy season. Atmos. Res. 263, 105814. doi:10.1016/j.atmosres.2021.105814
Yang, L., Wang, S., Tang, J., Niu, X., and Fu, C. (2019). Evaluation of the effects of a multiphysics ensemble on the simulation of an extremely hot summer in 2003 over the CORDEX-EA-II region. Int. J. Climatol. 39 (8), 3413–3430. doi:10.1002/joc.6028
Yang, Q., Yu, Z., Wei, J., Yang, C., Gu, H., Xiao, M., et al. (2021). Performance of the WRF model in simulating intense precipitation events over the Hanjiang River Basin, China – a multi-physics ensemble approach. Atmos. Res. 248, 105206. doi:10.1016/j.atmosres.2020.105206
Yang, X. X., Wu, J., Liu, J., and Ye, X. C. (2021). Changes of extreme precipitation and possible influence of ENSO events in a humid basin in China. Atmosphere 12 (11), 1522. doi:10.3390/atmos12111522
Yao, R., Zhang, S. L., Sun, P., Dai, Q., and Yang, Q. T. (2022). Estimating the impact of urbanization on non-stationary models of extreme precipitation events in the Yangtze River Delta metropolitan region. Weather Clim. Extrem. 36, 100445. doi:10.1016/j.wace.2022.100445
Yi, L., Zhang, W., and Wang, K. (2018). Evaluation of heavy precipitation simulated by the WRF model using 4D-var data assimilation with TRMM 3B42 and GPM IMERG over the huaihe River basin, China. Remote Sens. 10 (4), 646. doi:10.3390/rs10040646
Yin, J. B., Guo, S. L., Wang, J., Chen, J., Zhang, Q., Gu, L., et al. (2022). Thermodynamic driving mechanisms for the formation of global precipitation extremes and ecohydrological effects. Sci. China-Earth Sci. doi:10.1007/s11430-022-9987-0
Yin, J., Guo, S., Gentine, P., Sullivan, S. C., Gu, L., He, S., et al. (2021). Does the hook structure constrain future flood intensification under anthropogenic climate warming? Environ. Sci. 57 (2). doi:10.1029/2020WR028491
Yin, Z. H., Zhang, P. Y., and Cheng, M. H. (2014). Research on attaining methods of rainfall "truth" by assessment of radar measurement of rainfall. Acta Phys. Sin. 63 (23), 239201. doi:10.7498/aps.63.239201
Yu, E., Wang, H., Gao, Y., and Sun, J. (2011). Impacts of cumulus convective parameterization schemes on summer monsoon precipitation simulation over China. Acta Meteorol. Sin. 25 (5), 581–592. doi:10.1007/s13351-011-0504-y
Zhang, Q., Xiao, M. Z., Singh, V. P., and Wang, Y. Q. (2016). Spatiotemporal variations of temperature and precipitation extremes in the Poyang Lake basin, China. Theor. Appl. Climatol. 124 (3-4), 855–864. doi:10.1007/s00704-015-1470-6
Keywords: WRF, parameterization schemes, extreme precipitation, sensitivity, Poyang Lake Basin
Citation: Deng C, Chi Y, Huang Y, Jiang C, Su L, Lin H, Jiang L, Guan X and Gao L (2023) Sensitivity of WRF multiple parameterization schemes to extreme precipitation event over the Poyang Lake Basin of China. Front. Environ. Sci. 10:1102864. doi: 10.3389/fenvs.2022.1102864
Received: 19 November 2022; Accepted: 15 December 2022;
Published: 04 January 2023.
Edited by:
Shao Sun, Chinese Academy of Meteorological Sciences, ChinaCopyright © 2023 Deng, Chi, Huang, Jiang, Su, Lin, Jiang, Guan and Gao. This is an open-access article distributed under the terms of the Creative Commons Attribution License (CC BY). The use, distribution or reproduction in other forums is permitted, provided the original author(s) and the copyright owner(s) are credited and that the original publication in this journal is cited, in accordance with accepted academic practice. No use, distribution or reproduction is permitted which does not comply with these terms.
*Correspondence: Lu Gao, l.gao@foxmail.com