Comprehensive assessment of the environmental and employment impacts of international trade from the perspective of global value chains
 Shukuan Bai
 Boya Zhang
 Yadong Ning
- Key Laboratory of Ocean Energy Utilization and Energy Conservation of Ministry of Education, School of Energy and Power Engineering, Dalian University of Technology, Dalian, China
A comprehensive assessment of the environmental and employment impacts of international trade is essential for coordinating sustainable development between the economy, environment, and society. International trade is an important driving force for global economic growth. However, the environmental and social impacts of trade under global value chains (GVCs) have not yet been comprehensively characterized. This study aims to estimate the impacts of international trade from 2000–2014 on carbon emissions and employment using the gross export decomposition method, incorporating a counterfactual method based on the multi-region input–output model. We found that (1) at the global level, international trade has been conducive to carbon emission reductions since 2003 and played a role in increasing employment throughout the study period; however, the impacts of GVC-related trade have been mixed, generating global emissions savings, but leading to job losses. This implies that there is a trade-off between carbon emission reduction through GVC embedding and employment creation. (2) At the national level, a country’s participation in international trade benefits the environment, employment, or both. In this sense, international trade is no longer a zero-sum game; rather, it is likely to be a positive-sum game for all participants regarding environmental benefits and job creation. (3) In bilateral trade, developed and developing economies have positive and negative impacts, meaning that they should take joint actions to balance environment–employment–trade growth. These findings are useful for determining the responsibilities of different countries toward climate change and achieving sustainable development of the economy, society, and environment.
1 Introduction
With trade globalization, international trade allows countries to benefit economically while changing the scale and geographic position of environmental and social impacts (Wiedmann and Lenzen, 2018). Environmentally, international trade geographically separates consumption and environmental pollution generated by the production of consumer goods, providing a mechanism to transfer consumption-related pollution emissions to distant regions where goods are produced, especially carbon emissions. This phenomenon is closely related to the “pollution haven hypothesis” (Levinson and Taylor, 2008). Socially, international trade has profoundly impacted social development in all countries, especially regarding employment. Similar to the transfer of pollution emissions, developed countries tend to outsource low-skilled labor to developing countries, resulting in a transfer of job opportunities. With the deepening international division of labor, the debate on the relationship between trade, the environment, and employment is increasing.
The trade, employment, and emissions nexus are closely related to the debate on allocating climate change responsibilities among different countries (Arto et al., 2014). According to the principle of producer responsibility, each country is responsible for the emissions generated within its national territory. A major critique of this principle is that large quantities of goods imported from developing countries with lax climate policies may result in “carbon leakage” and undermine the overall effort to mitigate climate change. To address this issue, consumer responsibility has received increasing attention, as it incorporates carbon emissions embodied in trade. Based on the principle of consumer responsibility, each country should be responsible for all carbon emissions driven by its final consumption, regardless of where those emissions are generated. However, while this principle mitigates carbon leakage, it also introduces new potential problems, “producers” can freely consume resources and pollute the environment to stimulate economic growth and job creation, without undertaking the corresponding environmental responsibility of export production. To achieve political consensus and equity, the best choice is to share the responsibility between producers and consumers. A comprehensive assessment of the environmental and employment impacts of international trade could provide a basis for responsibility allocation criteria. Accurate measurements of carbon emissions and employment embodied in trade are fundamental prerequisites for these issues.
The rise of global value chains (GVCs) is one of the most important developments in twenty-first century international trade (Baldwin, 2012). The concept of GVCs refers to those in global production networks, where different countries gain value by participating in certain production stages of a product (Krugman, 1995; Gereffi, 2001). The increasing complexity of GVCs has made it difficult to distinguish the value creators of each production link by conventional gross trade statistics. This has brought challenges in measuring the factor content embodied in trade accurately. To address double counting problems caused by traditional trade accounting in gross value, value-added trade is widely accepted as a measure of cross-border value-added flows. Some researchers have focused on trade in value-added accounting (Hummels et al., 2001; Daudin et al., 2011; Johnson and Noguera, 2012; Stehrer, 2012; Los et al., 2016; Los and Timmer, 2018; Miroudot and Ye, 2020; Xiao et al., 2020). Koopman et al. (2010), Koopman et al. (2014) proposed the gross export decomposition method for tracing value-added (KWW method), which is a widely accepted accounting framework. Wang et al. (2014) expanded the KWW method to the bilateral/sector level and fully decomposed the gross bilateral exports into sixteen value-added and double-counting components. Their innovative work also provides new insights for measuring trade factor content from the perspective of GVC. A GVC perspective can help us systematically trace carbon emissions and employment embodied in trade, and it can reveal their source structure, the final destination of absorption, and transfer routes, which helps capture the environmental and employment impacts of international trade more accurately.
Relevant literature on trade, environment, and employment can be classified into two main groups: one concerning the measurement of factor content embodied in trade and the other focusing on assessing the impacts of trade. With the development of GVC theory and accounting, a considerable body of recent research has focused on measuring the carbon emissions embodied in international trade from the perspective of GVCs. Meng et al. (2018) developed a well-defined quantification framework that can trace carbon emissions through eight value chain routes. Fei et al. (2020) estimated the carbon emissions embodied in China’s international trade from 1995 to 2011 using the gross trade accounting method and analyzed the impacts of GVC divisions. Dai et al. (2021) measured carbon emissions embodied in Sino -US trade from the GVC perspective using the hypothetical extraction method. Wang Z et al. (2022) calculated China’s carbon emissions embodied in GVCs between 2000 and 2014. Mi et al. (2021) analyzed the China’s imported emissions from the perspective of the GVC. Chen et al. (2022) examined the impact of the GVC embedding pattern on the carbon emissions embodied in exports. In the above literature, several scholars have explored carbon emissions embodied in trade through different value chain routes; some scholars have defined value chain routes according to the source of value-added and final demand destination, and other scholars have considered the heterogeneities in different GVC activities (simple and complex GVC activities). However, few studies integrate these factors into a consistent value chain route definition. This study attempts to fill this gap by constructing new value chain routes to combine the source and destination of the embodied factor content and different types of GVC activities. Integrating these factors into a new value chain route could provide valuable insights into the role of a detailed value chain route in carbon emission transfer and scientific evidence for trade and carbon emission mitigation policy design.
Because labor is a key production factor, measuring labor/employment embodied in trade has received lots of attention. Related studies involve trade in employment (Trefler and Zhu, 2010; Jiang and Milberg, 2013; Timmer et al., 2014; Simas et al., 2015; Lin et al., 2018; Arto et al., 2020; Pérez-Sánchez et al., 2021) and labor/employment footprint (Alsamawi et al., 2014; Wiedmann and Lenzen, 2018; Yang et al., 2020; Bohn et al., 2021). Among them, some scholars have attempted to decompose employment related to GVCs. For example, Jiang and Milberg (2013) proposed a five-part decomposition method of employment in trade that can distinguish employment related to GVCs. Timmer et al. (2014) decomposed the value of a final product into the value added by all labor and capital employed in its GVC. Based on the decomposition method of Wang et al. (2014), Lin et al. (2018) decomposed employment in the Sino-US trade. However, little information on employment embodied in trade through different value chain routes can be found in the above studies. In the context of GVCs, employment embodied in a country’s trade may come from multiple countries and be created at various stages of the value chains; consequently, the characteristics of employment embodied in trade may differ between value chain routes. Sorting the employment embodied in trade through different value chain routes can provide a deeper understanding of the role of different value chain routes in employment creation.
Further, some studies explored the relationship between carbon emission and employment, such as evaluating the employment effect of carbon emission reduction (Bai et al., 2021; Yu and Li, 2021), investigating the impact of female labor share on trade-related embodied carbon emission (Wang et al., 2021). Sanki et al. (2017) estimated the emissions and employment embodied in the UK’s trade flows and found a clear trade-off between embodied emissions reductions by reducing consumption and the creation of job opportunities; however, these studies did not consider GVCs. Zhong and Su (2021) focused on the effects of labor market structural change on CO2 emissions dynamics in GVCs. Taking trade as the link in their relationship, embodied emissions can be regarded as the environmental cost of trade, and embodied employment can be regarded as the trade benefits. Wang S et al. (2022) explained the influence mechanism of labor input and environmental cost from the perspective of GVC embedding. For instance, developing countries can increase employment by undertaking manufacturing outsourcing from developed countries. However, processing and manufacturing are often the most pollution-intensive production segments, which can generate a large amount of carbon emissions in developing countries and increase their environmental costs. Consequently, firms may reduce their labor inputs, leading to job losses.
To summarize, previous studies on the measurement of factor content embodied in trade have focused on either embodied carbon emissions in trade or employment embodied in trade. Only a few studies have attempted to link these two lines of research. However, to the best of our knowledge, there is a lack of studies discussing embodied carbon emissions and employment in a unified GVC framework. Arto et al. (2014) suggested that international climate negotiations should consider developing countries’ employment benefits and developed countries’ environmental benefits. It is unfair to only consider the embodied carbon emissions in trade and ignore trade-related employment creation when assigning carbon emission responsibilities. It is also difficult to achieve a political consensus on emission reduction between developed and developing countries. To explore the benefits and losses of countries participating in GVCs and determine the responsibilities of different countries for climate change. This study further applies the methodology framework to a wide range of economies in the world and maps the process of emission transfer and employment transfer between different economies.
The following section reviews the literature on international trade impact assessment. Carbon emissions are the main factor in environmental degradation (Khan et al., 2021). Some studies focused on the impact of trade on carbon emissions from a range of perspectives, such as the environmental Kuznets curve hypothesis (Wang et al., 2023a), trade structure (Li et al., 2021), and decoupling (Wang et al., 2023b). Many studies seek to assess the impact of international trade on a country’s direct emissions by calculating carbon transfers, also known as the balance of embodied emissions in trade (Hertwich and Peters, 2009; Peters et al., 2011; Jakob and Marschinski, 2013; Jiang et al., 2016; Kanemoto et al., 2016; Dai et al., 2021). However, carbon transfers cannot be used to assess whether international trade increases or decreases global emissions, because the net carbon transfer of the world is zero. The pollution haven hypothesis suggests that international trade is conducive to increasing global emissions, and some scholars focus on testing the pollution haven hypothesis (Dietzenbacher and Mukhopadhyay, 2007; Chen and Chen, 2011; Xu et al., 2020; Duan et al., 2021). López et al. (2013) proposed a balance of avoided factor content method to test the pollution haven hypothesis. This is a counterfactual method that considers carbon emissions embodied in exports minus emissions avoided by imports. Based on López et al.’s (2013) method, Zhang et al. (2017) extended the balance of avoided emission (BAE) to an MRIO model. Furthermore, Li et al. (2022) evaluated the impact of trade on global carbon mitigation by comparing embodied carbon emissions in free-trade and non-trade scenarios. These innovative works provide useful insights into understanding how different regions, sectors, and trade patterns affect global emissions. Although there have already been many studies related to the impact of international trade on carbon emission, much less is known about the impacts of different value chain routes. The present study attempts to contribute to the existing literature through following: (1) reassess the impacts of trade on global carbon emissions, considering the heterogeneous value chain routes; (2) consider the dynamics of GVCs, extending the environmental impact assessment methodology by combining BAE method with the GVC decomposition method.
Owing to the importance of employment in policy making, the employment impact of trade has received increasing attention. Some studies have focused on the employment impact of exports. Los et al. (2015) assessed the impact of exports on China’s employment. Feenstra and Sasahara (2018) assessed the impact of exports on U.S employment. Sasahara (2019) compared the employment impacts of exports from China, the U.S, and Japan. Some studies evaluated the employment impact of the trade from the perspective of GVCs. OECD (2016) assessed the impact of GVCs on employment by linking employment data to the trade in value-added indicators. Lin et al. (2018) analyzed the amount of employment created by GVC trade between the US and China. Horvát et al. (2020) analyzed the impact of GVCs on labor markets based on trade in employment indicators. Ma et al. (2019) and Szymczak and Wolszczak-Derlacz (2021) examined the impact of GVC participation on employment. Wang S et al. (2022) investigated the impact of GVC embeddedness on employment, considering the environmental cost. However, there are still some critical issues that require further discussion. First, few studies have examined the differences in the impact of simple and complex GVC activities on employment. This study attempts to fill this gap by discussing the employment impact of different GVC activities based on the production activity decomposition framework proposed by Wang et al. (2017). Second, past research tended to focus on the impact of trade on domestic employment rather than global employment. The cumulative employment impacts of trade across the GVCs should be a matter of concern in a globalized era. The balance of avoided factor content method is also suitable for assessing other types of factor content in international trade (López et al., 2013). Therefore, this study applies this balance to estimate the impact of international trade on global employment.
In this study, we first decompose the carbon emissions and employment embodied in international trade between seventeen countries and regions from 2000 to 2014 using the gross export decomposition method based on the multi-region input–output (MRIO) model, distinguishing the source, destination, and trade patterns of embodied factor content. We then propose five value chain routes by considering the source and destination of embodied factor content and different types of GVC activities. We also analyze the transfers of embodied carbon emissions and employment by five value chain routes. Finally, we calculate the balance of avoided factor content in five value chain routes and provide a comprehensive discussion of the environmental and employment impacts of international trade from global, national, and bilateral perspectives.
This study makes several contributions to the literature. First, this study provides a comprehensive assessment of carbon emissions and employment embodied in international trade based on a unified GVC accounting framework. This research framework indirectly links embodied emissions and employment through trade, where embodied emissions can be regarded as a negative cost of trade and embodied employment can be regarded as a positive benefit of trade. We highlight a global perspective where the goal is to reduce worldwide emissions while losing the least number of jobs. Second, this study combines the gross exports decomposition method with the balance of avoided factor content, which can be easily applied to other factor contents of trade if data are available, and provides an effective tool to evaluate the impacts of international trade from the perspective of GVCs. Third, this work contributes to the existing knowledge of GVCs by constructing five new value chain routes, considering the source and destination of trade embodied factor content and differentiating “simple” and “complex” GVC activities. The findings from this study provide important insights into understanding the role of different value chain routes, which may provide abundant path information to help guide countries’ upgrading in GVCs. Finally, this study considers a wide range of economies in the world, including developed economies, represented by the United States, the EU, Japan, and Korea and developing economies, such as China and India. We compare the impact of different economies’ trade activities on global carbon emissions and employment. This study has important implications for countries to balance trade growth, carbon emissions reduction, and job creation under the GVC division context.
The remainder of this paper is organized as follows: Section 2 presents the methodology and data; Section 3 presents the main results on the measurement of embodied carbon emissions and employment and a comprehensive discussion of the environmental and employment impacts of different value chain routes; and Section 4 provides the main conclusions and implications.
2 Methodology and data
2.1 Decomposition of embodied carbon emissions and employment in exports
The methodology used in this study is based on an MRIO model. Regarding an MRIO model composed of G regions, the row balance equation can be expressed as follows:
where X denotes the gross output vector, with the superscript representing region, A denotes the technical coefficient matrix, describing intermediate products flow across regions, with the superscripts representing the supplying and using regions, Y denotes the final use vector, and
Eq. 1 can be rearranged as follows:
where Lss = (I−Ass)−1 is the local Leontief inverse matrix of region s.
According to the gross exports decomposition method of Wang et al. (2014), the gross bilateral exports Esr can be completely decomposed as Eq. 3. This study improved Wang et al. (2014)’s method by further decomposing the fifth term of their decomposition equation into two parts, making the gross bilateral exports can be more accurately decomposed.
where Vs denotes the value-added coefficient of region s and is defined as the value-added per unit of output. The notation “T” denotes transpose and “#” denotes the element-wise matrix multiplication operation.
Taking the carbon emissions embodied in a region’s exports as an example, defining Fs as the direct carbon emission intensity of region s, which is calculated by dividing the carbon emissions vector by the gross output of region s. Using the direct carbon emission intensity Fs as a substitute variable for the direct value-added coefficient Vs in Eq. 3 and removing four pure double counting terms, the gross embodied carbon emissions in region s’s gross exports to region r, which we labeled EEGsr, can be decomposed into thirteen parts as Eq. 4. The meaning of each term in Eq. 4 is illustrated in Supplementary Figure S1. Following this framework, we can completely decompose embodied carbon emissions in international trade by source and final destination of absorption.
The first sixth terms in Eq. 4 are emissions originating from region s but to meet final demand abroad, which are called domestic emissions absorbed abroad and denoted by EEXsr. They are the only measure of emission trade that is consistently associated with bilateral gross trade flows (Meng et al., 2018). These emissions can quantify the actual amount of emissions transfer and have become the focus of the debate on the allocation of responsibility for carbon emissions. Consequently, we focused on the transfer process of domestic emissions embodied in exports and absorbed by other regions. To depict transfer routes of embodied emissions, we further classified them into the five value chain routes as Eq. 5.
This is the first attempt to construct the above five value chain routes. The source and destination of trade embodied factor content and the heterogeneous of “simple” and “complex” GVC activities are comprehensively considered. According to Wang et al. (2017), cross-country production-sharing activities can be divided into two categories: GVC and non-GVC activities, depending on whether embodied factor content crosses the national border for production purposes. GVC activities can be further decomposed into simple and complex GVC based on the number of national border crossings of intermediate inputs. The definitions of the five value chain routes are shown in Table 1.
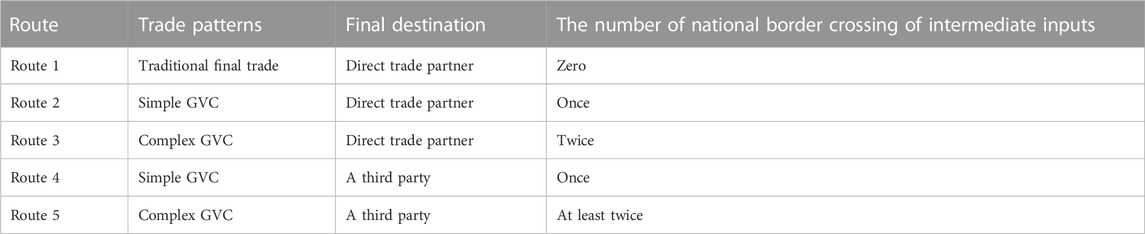
TABLE 1. Definition of five value chain routes.
This study adopted the balance of domestic embodied factor content to measure net transfers. For example, the net emission transfers were calculated by the difference between domestic emissions embodied in exports and emissions embodied in imports. The balance equation can be expressed as follows:
Summing up the net emission transfers of region s’s bilateral trade with all other regions of the world, we obtained the total net emission transfers of region s’ foreign trade.
A positive or negative BEEs indicates that a region’s foreign trade increases or decreases domestic direct emissions, respectively. By distinguishing five value chain routes, we can also measure the emissions transfers through different value chain routes.
Following the same logic as the decomposition of embodied carbon emissions, replacing the carbon emission intensity in Eqs. 4–7 with the direct labor input coefficient (the number of persons engaged per unit output), we can also trace the embodied employment in international trade and estimate the net transfers of embodied employment. The detailed equation is presented in Supplementary Material.
2.2 Measurement of the global impacts of international trade
This study extends the balance of avoided factor content to estimate the impact of international trade on global emissions and employment. Specifically, we combined the balance of avoided factor content method with the gross export decomposition method introduced above. The improved method considers the dynamics of GVCs and the heterogeneous impacts of different value chain routes. Taking the balance of avoided emissions (BAE) as an example, it equals the domestic emissions embodied in exports minus total avoided emissions in other countries via imports. The emissions avoided by imports (EAM) refers to the virtual emissions produced by imported products using domestic technology. The avoided emissions in region s by importing from region r through the five value chain routes can be calculated as follows:
The BAE between region s and region r is:
By calculating the two sub-balances of avoided emissions (Eq. 9-1 and Eq. 9-2), we can identify each region’s responsibility for increasing or decreasing global emissions in bilateral trade, which can be explained by production technology (carbon emission intensity F, production structure B, L) and trade balance. According to Eqs. 5, 8, we can expand Eq. 9 in the form of five value chain routes, and measure the impact of different value chain routes on global emissions.
The impact of region s’s foreign trade on global emissions can be measured by totaling the bilateral balance of avoided emissions between region s and each region:
A positive or negative BAEs indicates that a region’s international trade increases or decreases global emissions, respectively.
The world BAE is calculated by the following:
Similarly, this study expanded the balance of avoided factor content to assess the employment impact of trade. Following López et al.’s (2013) definition, we defined the balance of displaced employment (BDL) as the difference between employment embodied in exports and employment displaced by imports. More detailed calculations using equations associated with employment impacts are presented in the Supplementary Material.
2.3 Data sources
The input–output tables used in this study can be obtained from the World input-output database (WIOD) (Timmer et al., 2015). It provides input–output data of 56 sectors for 43 economies and a region called the rest of the world (ROW) during 2000–2014. Table 2 presents the countries and regions covered in this study. For convenience, the European Union member states were merged into the EU. The CO2 emissions data can be derived from the WIOD Environmental Accounts (Corsatea et al., 2019). WIOD also provides Socio-Economic Accounts, which covers the data on employment for each sector in each country/region. However, it is missing data for the ROW region. The data on employment for the ROW region were retrieved from the International Labour Office, and we allocated it to the sectors using a weighted average of the employment structure of representative countries (Stadler et al., 2014).
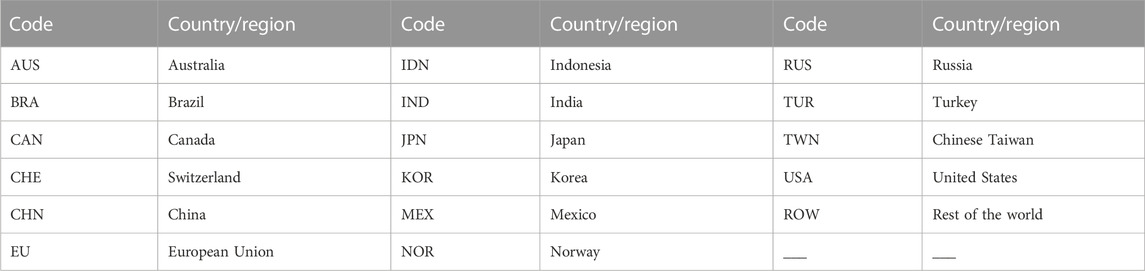
TABLE 2. Country and region classification.
3 Results and discussion
3.1 Preliminary results on embodied carbon emissions and employment
Figure 1 presents gross embodied carbon emissions and employment in international trade from 2000 to 2014. In Figure 1A, the left bar shows the emissions embodied in each region’s exports and the right bar shows the emissions embodied in imports. For the world economy as a whole, the gross embodied carbon emissions in world exports are equal to those of world imports, as the exports of one region are the imports of another region. Regarding the changing trends, the embodied carbon emissions in international trade increased from 6146.96 Mt in 2000–9779.87 Mt in 2014. There was a marked decline in 2009 owing to the global financial crisis. It began to rebound in 2010 and showed slight fluctuations from 2011 to 2014. A comparison of imports and exports in a certain region shows a significant imbalance between embodied carbon emissions in some economies’ exports and imports, such as the United States, China, the EU, and Russia. Comparing the different regions, the ROW region contributed the most to embodied carbon emissions, whether from exports or imports. The top five economies accounting for a large proportion of embodied carbon emissions in world exports were China, the EU, Russia, the United States, and Korea. For embodied carbon emissions in world imports, the EU, United States, China, Japan, and Korea were the top five contributors.
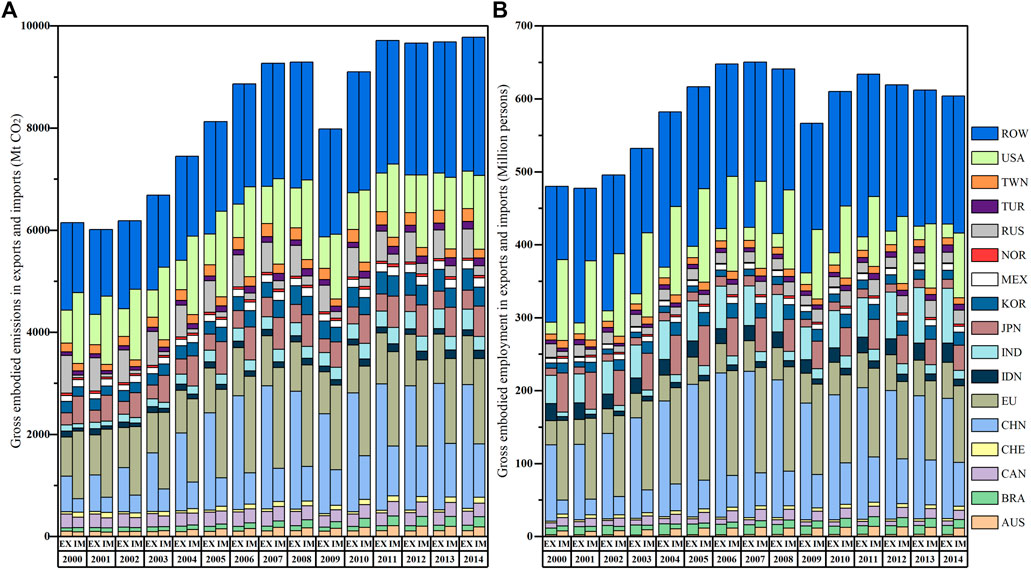
FIGURE 1. Gross embodied carbon emissions (A) and employment (B) in international trade Note: Abscissa label EX denotes exports and IM denotes imports.
Growth in the scale of international trade impacted employment worldwide. Figure 1B shows the gross embodied employment in international trade. The overall changing trend was similar to that of embodied carbon emissions; the gross embodied employment rose from 480.16 million persons in 2000 to 603.81 million persons in 2014. However, it began to decrease in 2008 during the global financial crisis, recovered in 2010, and decreased again during 2012–2014. The ROW region contributes the largest amount of embodied employment. On the one hand, the production of exported goods and services in the ROW region generated employment for 175.33 million in 2014 and accounted for 29% of gross embodied employment in international trade. On the other hand, the ROW region created jobs elsewhere for 187.91 million in 2014 through its imports and accounted for 31% of gross embodied employment in international trade. Combined, there is a significant imbalance between embodied employment in the ROW region’s exports and imports, but this imbalance shows an obvious waning trend. The five economies contributing the most to embodied employment in world exports were China, India, the EU, Indonesia, and the United States. Regarding embodied employment in world imports, the EU, United States, Japan, China, and Korea were the top five contributors.
The gross embodied carbon emissions in exports consist of foreign and domestic emissions. Domestic emissions are not entirely absorbed abroad as some may return home. Only domestic emissions absorbed abroad, which are completely driven by foreign final demand, reflect the actual volume of embodied carbon emission transfers. It is also the focus of controversy over the division of carbon emissions responsibilities. Figure 2A presents domestic emissions driven by foreign final demand, which accounted for approximately 79%–82% of the gross embodied carbon emissions during the study period, and its changing trend was consistent with the gross embodied carbon emissions. These emissions were exported through five value chain routes; more than half of domestic emissions exports were through the simple GVC and were absorbed in the direct importer (Route 2), followed by traditional final trade (Route 1), accounting for 31%–34%; 9%–11% of domestic emissions exports were through the complex GVC and absorbed by third parties (Route 5); 40% were through a simple GVC and absorbed by third parties (Route 4); and less than 1% were through the complex GVC and absorbed in the direct importer (Route 3). Compared to 2000, the shares of Route 1 and Route 4 in 2014 decreased slightly, the share of Route 5 in 2014 increased, and the share of Route 2 experienced several fluctuations and recovered to the level of 2000 in 2014.
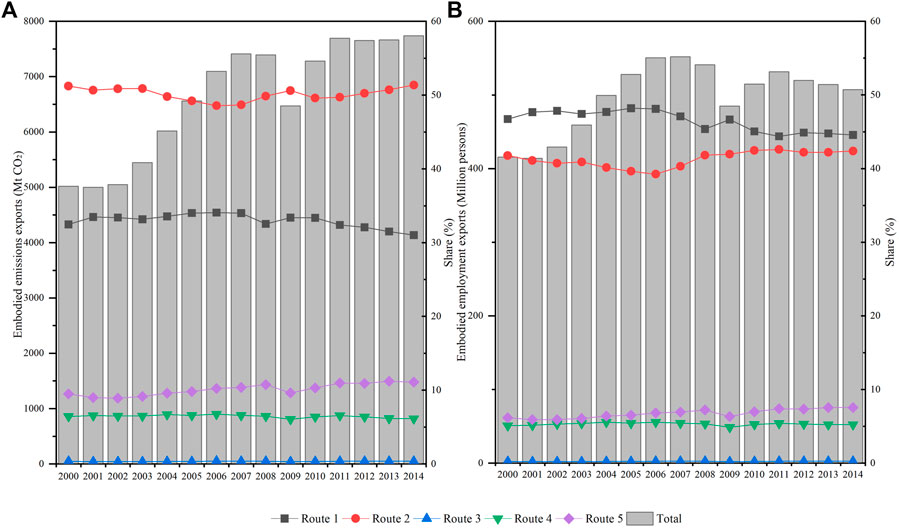
FIGURE 2. Domestic emissions (A) and employment (B) driven by foreign final demand and their share of export routes.
From the perspective of GVCs, a country’s exports may require labor inputs at different value chain stages both at home and abroad (Lin et al., 2018); therefore, the gross embodied employment may include domestic and foreign employment. Domestic employment driven by foreign final demand reflects the extent to which a country’s workforce depends on its integration into the global economy (Horvát et al., 2020). Figure 2B presents domestic employment driven by foreign final demand, which accounted for approximately 84%–87% of the gross embodied employment during the study period. Domestic employment embodied in gross exports can be further split into five value chain routes: 87%–89% of domestic employment was supported by the direct importer’s final demand, embodied in three value chain routes; 44%–48% were through traditional final trade (Route 1); 39%–42% were through the simple GVC (Route 2); and .2%–.3% were through the complex GVC (Route 3). Domestic employment, which was supported by a third party’s final demand, accounted for 11%–13% of the gross embodied employment. For employments embodied in two value chain routes, the simple GVC (Route 4) accounted for 5%–6%, and the complex GVC (Route 5) accounted for 6%–8%. Compared with 2000, the shares of Route 1 in 2014 decreased, whereas the shares of the other four routes increased by varying degrees.
Figure 2 shows the aggregate results of the value chain routes at the global aggregate level, where the route characteristics of embodied carbon emissions (or employment) in exports and imports are the same, but they vary at the regional level. Figure 3 presents the share of embodied carbon emissions (or employment), export routes, and import routes for different economies in 2014. Regional comparisons of the share of embodied carbon emission export routes are shown in Figure 3A. The results show that 46% of China’s domestic emissions exports were through Route 1, which is significantly higher than the world average (31%). This is because China, as a global factory, specializes in the downstream stage of global production and exports abundant final goods (Zhang et al., 2017). Russia had a lower proportion of domestic emissions exports through Route 1. Because minerals are Russia’s main export products, a greater proportion of emissions were embodied in intermediate exports, especially for the simple GVC-related trade, and finally absorbed in the direct trade partner (Route 2), accounting for 61% of Russia’s domestic emissions exports. Australia had route characteristics similar to those of Russia. Based on data from the Australian Bureau of Statistics, minerals accounted for 57.1% of Australia’s exports in 2014. Regional comparisons of the share of embodied carbon emission import routes are shown in Figure 3B. The results show that Indonesia, China, and India have a greater share of foreign emissions imports through Route 2 than the world average (51%). This may be explained by the fact that these economies play the most important roles in processing and assembling producers in the GVC and international production network, that is, importing intermediate products from newly industrialized countries such as Japan and Korea for processing and assembly before exporting the final products to developed countries such as the United States and Europe. Furthermore, a comparison of Figures 3A, B shows that there are significant differences in domestic embodied carbon emission export routes and foreign embodied carbon emission import routes for economies such as Russia and China. Figure 3 also provides other economies’ domestic emissions exports and foreign emissions imports, and a similar analysis can be conducted for these economies.
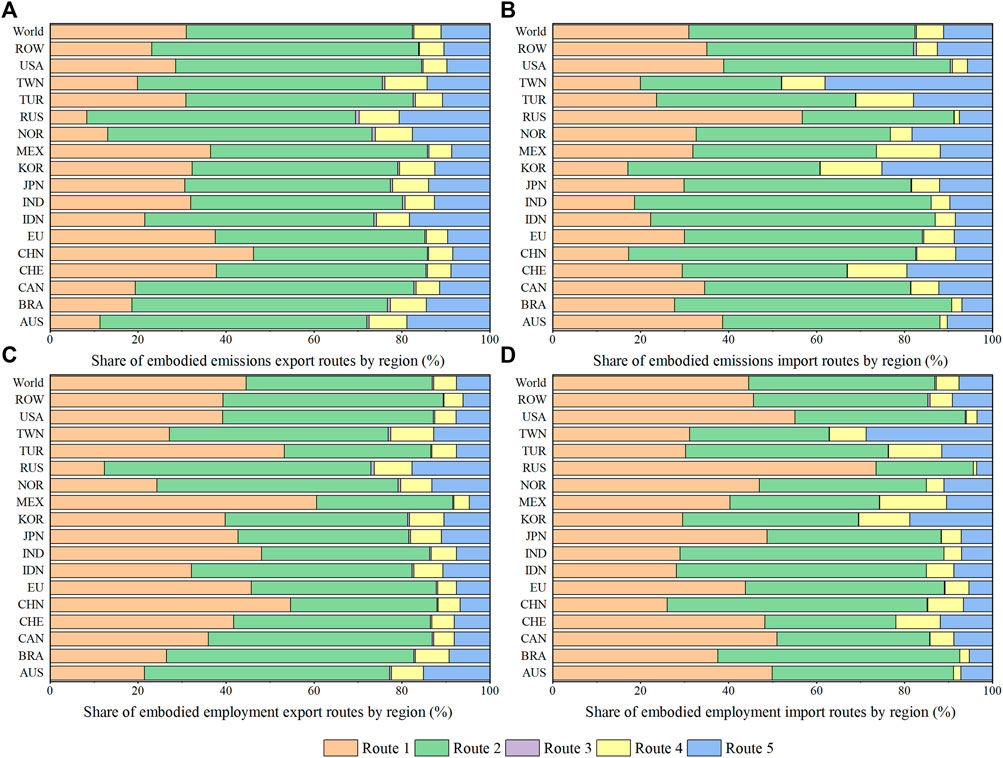
FIGURE 3. Regional comparisons of the embodied carbon emissions export (A) and import (B) routes, and embodied employment export (C) and import (D) routes.
The share of embodied employment export routes for different economies is shown in Figure 3C. The results show that 61% of Mexico’s domestic employment exports were through Route 1, which is significantly higher than the world average (45%). For China and Turkey, the shares of domestic employment exports through Route 1 were 55% and 53%, respectively. The domestic employment of these economies is mainly sustained by the export of abundant final products. Russia had the largest share of domestic employment exports through Route 2 (61%). Compared to other regions, Taiwan had a greater share of intra-regional employment exports through Route 4, and Australia had a greater share of domestic employment exports through Route 5. These results reveal the extent to which a region’s employment is affected by its integration into the global economy through different patterns. Regional comparisons of the shares of embodied employment import routes are shown in Figure 3D. Unlike export routes, Route 1 dominated embodied foreign employment imports in Russia, accounting for 74%. Indonesia had the greatest share of foreign employment imports through Route 2, accounting for 60%, followed by China (59%). Mexico had a greater share of foreign employment imports through Route 4 than other regions, while Taiwan had a greater share of foreign employment imports through Route 5. These results contribute to a better understanding of how a region’s trade activities affect foreign employment.
3.2 Carbon transfer and employment transfer via international trade
Figure 4 shows the transfers of embodied carbon emissions and employment in international trade in 2014. As shown in Figure 4A, China is the world’s largest exporter of domestic embodied carbon emissions, with embodied carbon emissions export accounting for 28% of the global total in 2014. The top five destination economies of final demand that drove domestic emissions embodied in China’s exports, after the ROW region, were the United States, the EU, Japan, Korea, and Russia. It is suggested that the final consumption of these economies is the main driver of carbon emissions in China’s exports. The ROW region was the largest region with foreign embodied carbon emission imports. The top five source regions of foreign emissions embodied in its imports were China, the EU, Russia, India, and the United States. Comparing the embodied domestic emissions exports and embodied foreign emissions imports of various regions, we found that developing economies such as China, Russia, and India tend to have a large “emissions surplus,” that is, the embodied domestic emissions exports are larger than embodied foreign emissions imports. Developed economies such as the EU, the United States, and Japan tend to have a large “emissions deficit,” that is, the embodied foreign emissions imports are larger than embodied domestic emissions exports. This is consistent with the results of several studies (e.g., Peters et al., 2011; Wu et al., 2021).
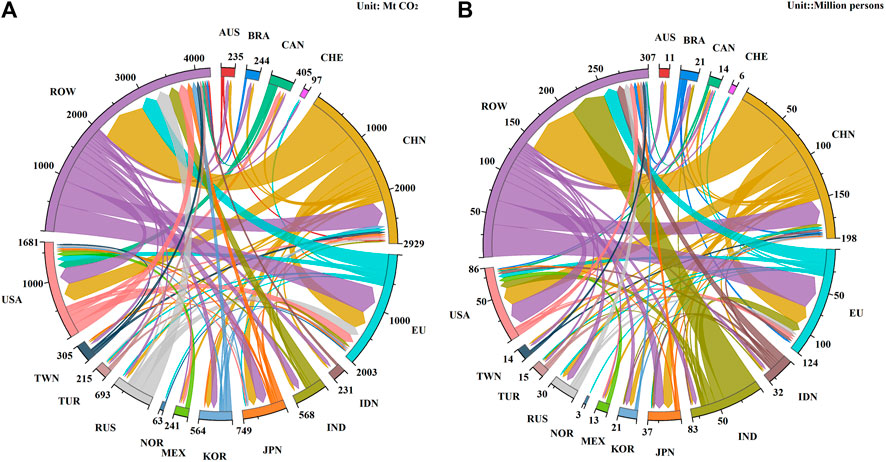
FIGURE 4. Transfers of embodied carbon emissions (A) and employment (B) in international trade in 2014.
Figure 4B shows the transfer of embodied employment, the major region of domestic embodied employment export is China, constituting 30% of global domestic employment exports. In addition to the ROW region, the top five final demand destination economies driving China’s employment were the EU, the United States, Japan, Russia, and Korea. Notably, the domestic employment of the ROW region and India were also significant, constituting 28% and 14% of the total domestic employment exports of all regions, respectively. Regarding foreign embodied employment imports, the ROW region was the largest importer of foreign embodied employment: China, India, the EU, Indonesia, and Russia were the top five source regions of foreign embodied employment in its imports, which differed from the sources of foreign emissions in its imports. Comparing the embodied domestic employment export and embodied foreign employment import of various regions, the United States, EU, and ROW had the largest “employment deficit,” with embodied employment imports much higher than those of the domestic employment exports. The opposite situation was true in China, India, and Indonesia, which had a large “employment surplus.”
After mapping the transfer process of embodied carbon emissions and employment, we calculated the net transfer of embodied carbon emissions and embodied employment for each economy in 2014. Trade was decomposed into five value chain routes, and the results are shown in Table 3. Regarding net emissions transfers, five regions (i.e., Canada, China, India, Russia and Taiwan) corresponded to a positive net transfer, making them net exporters of embodied carbon emissions. It is suggested that the foreign trade of these regions increased domestic direct emissions, for example, China’s foreign trade in 2014 increased its domestic direct emission by 1939.4 Mt. This result shows that China paid a high environmental cost from high-carbon-intensity export product production. The remaining regions corresponded to negative net transfer, and were thus net importers of embodied carbon emissions. For example, the EU was the largest net importer of embodied carbon emissions in 2014, followed by the United States; these two economies generated emissions savings through international trade of 707.6 and 551.1 Mt, respectively.
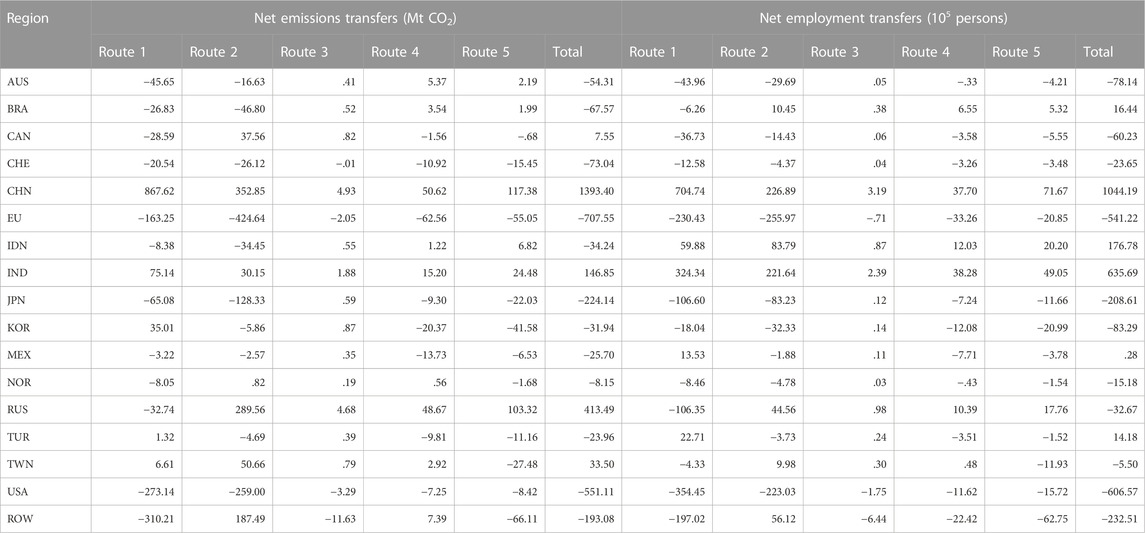
TABLE 3. Net transfer of embodied carbon emissions and embodied employment for each economy in 2014.
From the perspective of different value chain routes, the results demonstrate that traditional final trade (Route 1) dominated six economies’ net emission transfers: Australia, China, India, Norway, the United States, and the ROW region. International trade through simple GVCs to meet the direct partner’s final demand (Route 2) dominated the net emission transfers of eight economies: Brazil, Canada, Switzerland, the EU, Indonesia, Japan, Taiwan and Russia. Table 3 shows that international trade through complex GVCs to meet the direct partner’s final demand (Route 3) tends to increase domestic direct emissions except for Switzerland, the EU, the United States, and the ROW. Simple GVC-related trade to meet a third party’s final demand (Route 4) played the most significant role in the net emissions transfer for Mexico. Complex GVC-related trade to meet a third party’s final demand (Route 5) dominated the net emission transfers of Korea and Turkey. This demonstrates that there are visible differences in the contributions of specific value chain routes to emission transfers across economies, which are closely linked to an economy’s position in the global production chain. The net emission transfer direction of an economy may vary according to value chain routes. For instance, Russia was a net importer in terms of carbon emissions transfer through traditional final trade (Route 1), but was a net exporter in terms of carbon emissions transfer through GVC-related trade (Route 2–4).
Regarding net employment transfers, six regions were net exporters of embodied employment: Brazil, China, India, Indonesia, Mexico, and Turkey, suggesting that foreign trade increased their domestic employment. For example, China’s foreign trade activity directly created 104.4 million domestic jobs in 2014. The other eleven regions were all net importers of embodied employment, and the United States was the largest net employment importer in 2014. There were also significant differences in net employment transfers through different value chain routes; international trade through Route 1 dominated the net employment transfers, such as in China, India, Japan, Russia, and the United States. International trade through Route 2 dominated the net employment transfers of four economies: Brazil, the EU, Indonesia, and Korea. The net employment transfers through Route 3 for most economies corresponded to a positive value, whereas most economies’ net employment transfers through Route 4 were negative. In addition, international trade through Route 5 played the most significant role in net employment transfer for Taiwan. Overall, a win–win outcome for reducing domestic emissions and increasing domestic employment can be achieved in some economies through a specific value chain route.
When comparing our results of net transfer of embodied emissions or employment to those of previous studies (e.g., Jakob and Marschinski, 2013; Jiang et al., 2016), it must be pointed out that the amount of transfer may be different, although the direction of net transfer accords with earlier observations. This discrepancy could be attributed to that the definition of net transfer in this study is different from those of previous studies. In earlier studies based on gross trade accounting, the net transfer of embodied factor content is defined as the difference between the gross value of embodied factor content in exports and those in imports. In this study, the concept of net transfer is based on the separation of the source of embodied factor and its final destination of absorption.
3.3 Environmental and employment impacts of international trade
To evaluate whether international trade increased or reduced global emissions and employment, this study calculated the balance of avoided emission (BAE) and balance of displaced employment (BDL). This section presents the results of the environmental and employment impacts of international trade from global, national, and bilateral perspectives. Figure 5A presents the changing trend in the BAE through international trade from 2000 to 2014, and trade is decomposed into five different value chain routes. The total BAE of international trade was positive before 2003 and negative from 2003 to 2014, suggesting that international trade activity increased global emissions before 2003 and decreased global emissions thereafter. It showed an overall downward trend and reached its lowest value in 2011, at 1736 Mt, and began to increase in 2012. Compared with previous studies on evaluating global environmental impacts using a similar method, our results show a similar general trend to that of López et al. (2013) and Zhang et al. (2017). The difference is that the levels observed in this study are in between those observed by López et al. (2013) and Zhang et al. (2017). For instance, the present study found that international trade generated global emission savings by 902.35 Mt. The results of López et al. (2013) and Zhang et al. (2017) are 1101.11 Mt and 822.61 Mt in 2009. A possible explanation for this might be that different studies deal with domestic technological assumptions differently. Another possible explanation for this is that these studies adopt different regional aggregation levels. Zhang et al. (2017) calculated the environmental impact of trade between 41 regions in the WIOD. López et al. (2013) aggregated the economies in the WIOD into 7 regions. This study aggregated the economies in the WIOD into 17 regions.
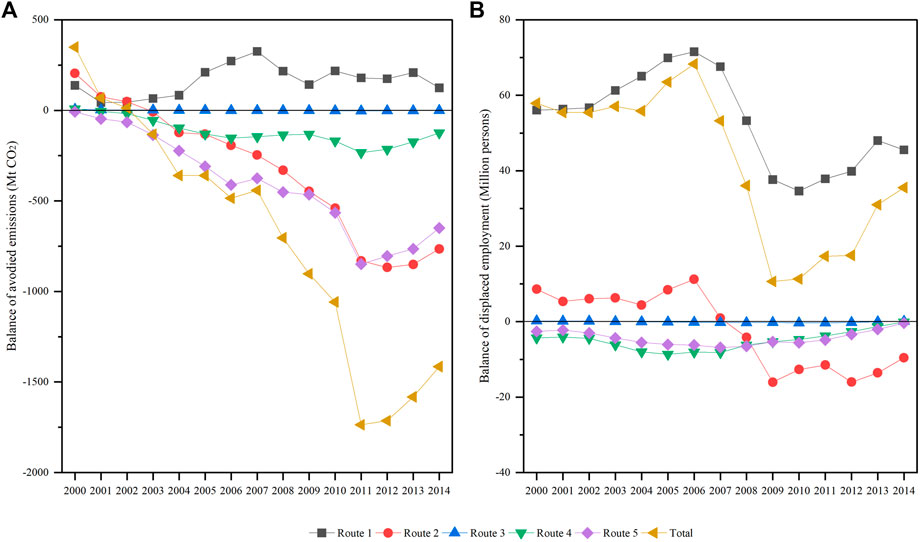
FIGURE 5. Environmental (A) and employment (B) impacts of gross international trade.
From the viewpoint of different value chain routes, Route 1 led to the largest increase in global emissions. This suggests that trade in final products generally focuses on regions with relatively higher carbon emission intensities and promotes increased global carbon emissions. Route 5 contributed to the largest decrease in global emissions, dominating the overall environmental impact of international trade. Route 2 also significantly decreased global emissions in most years and exceeded the effect of Route 5 in 2012, followed by Route 4, both of which involved simple GVC-related trade. Route 3 had a positive impact on global emissions before 2007 and became negative during 2008–2014, but the change was not obvious. Routes 3 and 5 were complex GVC-related trades. In contrast to traditional final trade, GVC-related trade could help decrease global emissions. Since the GVC can better reflect the nature of globalization, this finding further supports the idea that globalization improves environmental quality. Furthermore, the carbon emission reductions effect of simple GVC-related trade (Route 2 add Route 4) was stronger than that of complex GVC-related trade (Route 3 add Route 5).
Figure 5B presents the changing trend in BDL through international trade from 2000 to 2014. The results show that total international trade activity corresponded to a positive BDL throughout the study period, meaning that international trade contributed to increasing global employment. Changing trends remained relatively stable until 2004, began to increase in 2005, and peaked in 2006 at 68 million persons. There was a marked decline in BDL from 2007 to 2009, but it then increased again and recovered to 36 million persons in 2014. Considering different value chain routes, Route 1 always corresponded to a positive BDL during the study period, which contributed to the largest increase in global employment and played a dominant role in determining the overall changing trend of employment impact. The BDL of trade through Route 2 changed from positive to negative in 2008 and led to the highest job losses in 2009 (16 million persons); its negative effect showed a waning trend by the end of the study period. Route 3’s impact on global employment was positive before 2003 and negative after 2003. The BDL of trade through Routes 4 and 5 was always negative during the study period but their negative impact showed a waning trend. These results show that global trade-related employment is mainly created by traditional final trade and that GVC-related trade leads to a decrease in global employment to some extent. Synthetically considering the environmental and employment impacts of international trade, at the global level, international trade was generally conducive to carbon emissions reduction and employment creation; however, the impacts of GVC-related trade were mixed, generating global emissions savings, but leading to decreases in employment. This implies that there is a trade-off between carbon emission reduction through GVC embedding and employment creation.
To discuss the difference in the global impacts of different economies’ trade activities, this study calculated BAE and the BDL at the national and regional levels. The results for 2014 are shown in Table 4, where six economies (i.e., Canada, China, Mexico, Russia, Turkey, and the United States) had a positive total BAE, and the other 11 countries and regions had a negative total BAE. China had the largest positive BAE, and the results show that its gross trade activity increased global emissions by 299.27 Mt in 2014. The ROW region had the largest negative BAE and achieved the greatest reduction in global emissions (1224.36 Mt) owing to its trade activity. Considering BAE in different value chain routes, the global environmental impacts of six economies (Switzerland, China, the EU, Mexico, Turkey, and the United States) were dominated by traditional final trade (Route 1). International trade through Route 2 dominated the environmental impacts of another six economies (Canada, India, Japan, Korea, Norway, and Russia). The global environmental impacts of the remaining five countries and regions were dominated by trade through Route 5. In 12 economies, international trade through Route 3 tended to decrease global emissions. The BAE in trade through Route 4 was negative for ten economies, suggesting that these trade flows contributed to decreasing global emissions. By contrast, trade through Route 4 in the other seven economies led to an increase in global emissions. The results for total BDL show that the trade activities of seven economies (Australia, Brazil, Switzerland, the EU, Korea, Norway, and Taiwan) decreased global employment, while the other 10 economies increased global employment owing to their trade activity. China’s trade contributed most to increasing global employment, creating 26.52 million jobs in 2014, and Korea’s trade led to the largest decrease in global employment (5.78 million in 2014). Regarding BDL in the five value chain routes, the employment impacts of 10 economies were dominated by trade value chain Route 1, while the employment impacts of the other seven economies were dominated by trade value chain Route 2. The BDL in trade through Route 3 was positive for the seven economies, suggesting that these trade flows contributed to increasing global employment. For trade through Routes 4 and 5, seven economies and nine economies, respectively, contributed to global employment.

TABLE 4. Environmental and employment impacts of each economy’s trade activity in 2014.
By combining the results on carbon emissions and employment, we can divide these economies into four types, according to the signs of BAE and BDL. The first type is an economy with both positive BAE and BDL, which suggests that these economies’ trade activities simultaneously increase global emissions and employment. Six economies in 2014 belonged to this type: Canada, China, Mexico, Russia, Turkey, and the United States. The second type is an economy with both negative BAE and BDL, which contributes to decreasing global emissions and results in decreasing global employment. Seven economies in 2014 belonged to this type: Australia, Brazil, Switzerland, the EU, Korea, Norway, and Taiwan. A total of 13 economies fall into the first two categories, highlighting the significant consistency in the direction of change of the two impacts. The third type is an economy with a negative BAE and positive BDL, represented by India, Indonesia, Japan, and the ROW region. These economies’ trade activities decreased global emissions and increased global employment. This is the most desirable condition. It should be noted that although some economies do not belong to this type in terms of total BAE and BDL, this win-win situation for the environment and employment exists in trade through specific value chain routes, such as Russia’s trade through Route 1 and the EU’s trade through Route 2. The least desirable type is an economy with a positive BAE and negative BDL, which results in a growth in global emissions and a decrease in global employment. There was no economy belonging to this type in 2014 at the aggregate level, suggesting that a country’s participation in international trade is good for the environment, employment, or both. In this sense, international trade is no longer a zero-sum game; rather, it is likely to be a positive-sum game for all participants in terms of environmental and employment benefits. This profoundly implies that countries should actively participate in international trade and firm opposition to growing protectionist and anti-globalization sentiments.
International trade can be seen as a collection of bilateral trade flows. To provide a detailed analysis of the environmental and employment impacts of international trade from a bilateral perspective, the BAE and BDL were calculated at the bilateral level. We also captured two sub-balances [sub-BAE based on Eq. 9 and sub-BDL based on Eq. (A6)] to identify the role of trading partners of certain bilateral trade in global carbon emissions and global employment. Table 5 presents the results for the selected ten bilateral trade flows in 2014. Considering total value, the top five bilateral trades with the largest positive BAE were trades between China and the United States, China and the EU, Canada and China, Canada and the United States, and China and Mexico. These bilateral trades led to the largest increase in global emissions. The top five bilateral trades with the largest negative BAE were trades between Australia and Chinese Taiwan, Indonesia and Chinese Taiwan, mainland China and Chinese Taiwan, China and Korea, and Australia, and Korea. These bilateral trades have made a significant contribution to global emission reduction. Regarding the employment impacts of bilateral trade, the top five bilateral trades with the largest positive BDL were trades between China and the United States, China and the EU, India and the United States, the EU and India, and China and Japan. These bilateral trades have created many jobs. The top five bilateral trades with the largest negative BDL were those between mainland China and Taiwan, China and Korea, the EU and Russia, Australia and China, and Brazil and China. These bilateral trades resulted in significant joblessness. To understand the roles played by both parties in bilateral trade, we took China–United States trade and China–Korea trade as examples to explain in detail.
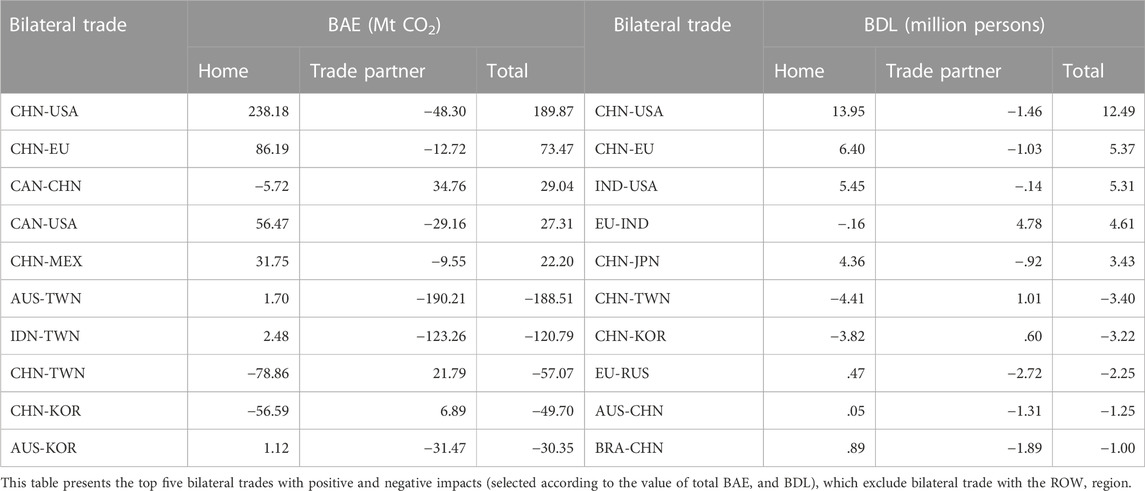
TABLE 5. Environmental and employment impacts of the selected bilateral trade in 2014.
Bilateral trade between China and the United States generated the largest emissions and employment, which is of great significance globally. In this bilateral trade flow, China’s environmental performance is increasing global emissions (238.18 Mt). The environmental performance of the United States is decreasing global emissions (-48.30 Mt). This can be attributed to China’s huge trade surplus and high carbon intensity and the USA’s clean production technology and its relatively lower carbon intensity. The overall environmental impacts of bilateral trade between China and the United States show increased global emissions (189.87 Mt). This is in line with Guo et al. (2010), who found that bilateral trade between China and the United States increase global emissions. China’s employment impact performance is increasing global employment (13.95 million), whereas the USA’s employment impact performance is decreasing it (−1.46 million). The overall employment impact of bilateral trade between China and the United States shows increasing global employment (12.49 million). China’s comparative advantage in labor-intensive exports may play a vital role in employment growth.
China is Korea’s largest trading partner, the largest export destination, and a source of imports. In bilateral trade between China and Korea, China had a trade deficit and Korea had a relatively lower carbon emission intensity than China, which avoided a large amount of carbon emissions by importing products from Korea. Consequently, China’s environmental performance was decreasing global emissions (−56.59 Mt). In contrast, Korea’s environmental performance is increasing global emissions (6.89 Mt). This is mainly because of Korea’s trade surplus. The overall environmental impact of bilateral trade between China and Korea was conducive to global carbon emission reduction (−49.70 Mt). The employment impact of bilateral trade between China and Korea, China’s performance was reduced global employment (−3.82 million), suggesting that China’s imports from Korea resulted in job losses. This is because imports replaced products that could have been produced by domestic labor in the country, and more labor input is required in China than in Korea to produce the same product. Korea’s performance is increasing global employment (.6 million), but this increase is not sufficient to offset the decline in employment caused by China. Therefore, China–Korea bilateral trade generally led to a decrease in global employment (−3.22 million).
Similar analyses can be performed on other bilateral trades. These intuitive results are useful for identifying each country’s environmental responsibility and employment benefits from international trade. In bilateral trades, developed or developing economies have positive and negative impacts, meaning that developed economies and developing economies should take joint actions to balance environment–employment–trade growth and actively assume common and differentiated global responsibilities.
4 Conclusion and implication
In the context of trade globalization and global production fragmentation, the contribution of international trade to economic growth has been strongly proven; however, it has also led to an unprecedented displacement of environmental and social impacts, which have not been comprehensively characterized. A comprehensive assessment of the environmental and employment impacts of international trade is essential for coordinating sustainable development between the economy, environment, and society. This study set out to evaluate the impact of international trade on global carbon emissions and employment. The main findings are summarized as follows:
This study estimated embodied carbon emissions and employment in international trade and their transfers through various value chain routes. The results showed that developed economies represented by the United States and the EU benefit the environment through trade carbon transfer, while developing economies represented by China and India experience significant employment gains from trade employment transfer. In this sense, all stakeholders in international trade should take responsibility for trade-related carbon emission reduction. From the perspective of value chain routes, whether carbon transfer or employment transfer, the effect of a specific value chain route on transfers varies significantly across economies. This is closely linked to the position of an economy in the global production chain, and the net transfer direction of a certain economy may vary with value chain routes. A win-win outcome for reducing domestic emissions and increasing domestic employment can be achieved in some economies through a specific value chain route. These results highlight the importance of distinguishing the value chain routes.
This study evaluated the impact of international trade on the global environment and employment using a counterfactual method. We found that, at the global level, international trade in general is conducive to global carbon emissions reduction and employment creation; however, the impacts of GVC-related trade have been mixed, generating global emissions savings but leading to a decrease in employment. This implies that there is a trade-off between carbon emission reduction through GVC embedding and employment creation. Specifically, for environmental impacts, we found that the impacts of international trade on global carbon emissions reversed in 2003 and played a role in reducing global emissions from 2003 to 2014. Route 5 contributed to the largest decrease in global emissions, thereby dominating the overall environmental impact. Regarding employment impacts, international trade always plays a role in increasing global employment during the study period; Route 1 contributes to the largest increase in global employment and plays a dominant role in determining the overall changing trend of employment impacts.
Moreover, this study further estimated the impact of each economy’s trade activity, showing that China’s trade activity has resulted in the largest increase in global emissions. The ROW region achieved the greatest reduction in global emissions through trade activity. China’s trade has contributed the most to increasing global employment, while Korea’s trade led to the largest decrease in global employment. The trade activities of some economies were conducive to both carbon emission reduction and job creation globally. The main conclusion that can be drawn is that a country’s participation in international trade can be good for the environment, employment, or both. In this sense, international trade is no longer a zero-sum game; rather, it is likely to be a positive-sum game for all participants in terms of global environmental benefits and job creation. Regarding bilateral trade, both developed and developing economies have positive and negative impacts, meaning that developed countries and developing countries should take joint actions to balance environment–employment–trade growth.
This study contributes to existing knowledge of GVCs by constructing five new value chain routes, considering the source and destination of trade embodied factor content and differentiating “simple” and “complex” GVC activities. The findings from this study provide important insights into understanding the role of different value chain routes, which may provide abundant path information to help guide countries’ upgrading in GVCs. Second, the findings of this study provide useful information for determining the responsibilities of different countries to climate change. To achieve political consensus and equity, both environmental and employment benefits should be considered when allocating emission reduction responsibilities. Third, the findings of this study can aid all countries in understanding their benefits and environmental responsibilities across the global value chains. This may provide scientific evidence for further policy formulation and help to promote the sustainable development of the economy, society, and environment.
Based on these findings, some policy implications were proposed. First, policymakers should consider embodied carbon emissions and employment in trade when formulating trade policies, especially for GVC-related trade policies. A comprehensive assessment of the environmental and employment impacts of international trade can provide useful information for the government to formulate scientific policies. The impacts of trade on carbon emissions and employment vary by country and value chain route. In some cases, there is a conflict between carbon emission reduction and job creation. If a policy only pays attention to reducing carbon emissions and neglects employment impacts, it may lead to job losses and threaten social stability, which would, in turn, hinder progress in tackling global climate change. An intelligently designed trade policy should help achieve the synergy between carbon emission reduction and employment creation. For instance, carbon tax has shown promise as a tool for reducing carbon emissions and increasing jobs (Brown et al., 2020).
Second, developed and developing countries should deepen their international cooperation and actively assume common and differentiated global responsibilities. International trade leads to a geographic separation of consumers from pollution emitted during production, allowing consumers to shift the pollution induced by their consumption elsewhere. Meanwhile, it also causes job opportunities transfer from the developed world to the developing world. Combining these, we can see that both worlds benefited from trade but paid the price. This provides some explanation as to why developed and developing countries should share responsibility for global climate change. Therefore, whenever emission reduction responsibilities are to be discussed, a fair allocation scheme that considers both the employment benefits of developing countries and the environmental benefits of developed countries should be used.
Third, a global perspective should be envisaged to reduce worldwide emissions while minimizing job losses. Developed countries should increase their support for emission-intensive trading partners through technology transfers and financial assistance in their foreign investment and industrial transfers. Developing countries should increase investment in the research and development of high-tech industries and actively innovate and move away from the traditional economic development model that relies on exporting high-energy-consuming and low-value-added products. Meanwhile, more high-skilled talents should be matched with the development of innovative knowledge-intensive industries to promote rapid economic transformation.
This study had several limitations. First, there was a lag in the study period owing to WIOD data limitations. In addition, this study did not discuss employment by different skill types because WIOD Socio-Economic Accounts 2016 no longer provides information on the educational attainment of the labor force. We look forward to updating and expanding our results after the release of more recent data. Second, although the results of this study provide some reference for allocating emission reduction responsibilities, we did not provide a detailed responsibility allocation scheme, and further studies are expected to establish a quantitative responsibility allocation scheme that considers the environmental and employment impacts. Third, this study did not distinguish between processing trade and general trade, which are also important issues in the current reconstruction of the GVC; further research might explore this issue.
Data availability statement
The raw data supporting the conclusion of this article will be made available by the authors, without undue reservation.
Author contributions
SB: Conceptualization, Methodology, Data curation, Writing—original draft. YN: Conceptualization, Writing—review and editing, Supervision, Funding acquisition. BZ: Conceptualization, Writing—review and editing.
Funding
This work was supported by the National Natural Science Foundation of China [grant number: 71873021].
Acknowledgments
We would like to thank Editage for the English language editing.
Conflict of interest
The authors declare that the research was conducted in the absence of any commercial or financial relationships that could be construed as a potential conflict of interest.
Publisher’s note
All claims expressed in this article are solely those of the authors and do not necessarily represent those of their affiliated organizations, or those of the publisher, the editors and the reviewers. Any product that may be evaluated in this article, or claim that may be made by its manufacturer, is not guaranteed or endorsed by the publisher.
Supplementary material
The Supplementary Material for this article can be found online at: https://www.frontiersin.org/articles/10.3389/fenvs.2022.1099655/full#supplementary-material
References
Alsamawi, A., Murray, J., and Lenzen, M. (2014). The employment footprints of nations: Uncovering master-servant relationships. J. Ind. Ecol. 18, 59–70. doi:10.1111/jiec.12104
Arto, I., Rueda-Cantuche, J. M., Andreoni, V., Mongelli, I., and Genty, A. (2014). The game of trading jobs for emissions. Energy Policy 66, 517–525. doi:10.1016/j.enpol.2013.11.046
Arto, I., Rueda-Cantuche, J. M., Román, M. V., Cazcarro, I., Amores, A. F., and Dietzenbacher, E. (2020). EU trade in employment. Luxembourg: Publications Office of the European Union. EUR 30214 EN. 978-92-76-18826-1, JRC120520. doi:10.2760/22372
Bai, S., Zhang, B., Ning, Y., and Wang, Y. (2021). Comprehensive analysis of carbon emissions, economic growth, and employment from the perspective of industrial restructuring: A case study of China. Environ. Sci. Pollut. Res. 28, 50767–50789. doi:10.1007/s11356-021-14040-z
Baldwin, R. (2012). Global supply chains: Why they emerged, why they matter, and where they are going. NBER Working Paper No. DP9103.
Bohn, T., Brakman, S., and Dietzenbacher, E. (2021). Who’s afraid of Virginia Wu? US employment footprints and self-sufficiency. Econ. Syst. Res. 34, 469–490. doi:10.1080/09535314.2021.1935219
Brown, M. A., Li, Y., and Soni, A. (2020). Are all jobs created equal? Regional employment impacts of a U.S. Carbon tax. Appl. Energy 262, 114354. doi:10.1016/j.apenergy.2019.114354
Chen, H., Zhang, C., and Yin, K. (2022). The impact of global value chain embedding on carbon emissions embodied in China’s exports. Front. Environ. Sci. 10, 1–13. doi:10.3389/fenvs.2022.950869
Chen, Z. M., and Chen, G. Q. (2011). Embodied carbon dioxide emission at supra-national scale: A coalition analysis for G7, bric, and the rest of the world. Energy Policy 39, 2899–2909. doi:10.1016/j.enpol.2011.02.068
Corsatea, T. D., Lindner, S., Arto, I., Román, M. V., Rueda-Cantuche, J. M., Velázquez Afonso, A., et al. (2019). World input-output database environmental Accounts. Update 2000-2016. Luxembourg: Publications Office of the European Union, JRC116234. doi:10.2791/947252
Dai, F., Yang, J., Guo, H., and Sun, H. (2021). Tracing CO2 emissions in China-us trade: A global value chain perspective. Sci. Total Environ. 775, 145701. doi:10.1016/j.scitotenv.2021.145701
Daudin, G., Rifflart, C., and Schweisguth, D. (2011). Who produces for whom in the world economy? Can. J. Econ. 44, 1403–1437. doi:10.1111/j.1540-5982.2011.01679.x
Dietzenbacher, E., and Mukhopadhyay, K. (2007). An empirical examination of the pollution haven hypothesis for India: Towards a green Leontief paradox? Environ. Resour. Econ. 36, 427–449. doi:10.1007/s10640-006-9036-9
Duan, Y., Ji, T., and Yu, T. (2021). Reassessing pollution haven effect in global value chains. J. Clean. Prod. 284, 124705. doi:10.1016/j.jclepro.2020.124705
Feenstra, R. C., and Sasahara, A. (2018). The ‘China shock, ’ exports and U.S employment: A global input–output analysis. Rev. Int. Econ. 26, 1053–1083. doi:10.1111/roie.12370
Fei, R., Pan, A., Wu, X., and Xie, Q. (2020). How GVC division affects embodied carbon emissions in China’s exports? Environ. Sci. Pollut. Res. 27, 36605–36620. doi:10.1007/s11356-020-09298-8
Gereffi, G. (2001). Beyond the producer driven/buyer driven dichotomy: The evolution of global value chains in internet era. IDS Bull. 32 (3), 30–40. doi:10.1111/j.1759-5436.2001.mp32003004.x
Guo, J., Zou, L. L., and Wei, Y. M. (2010). Impact of inter-sectoral trade on national and global CO2 emissions: An empirical analysis of China and US. Energy Policy 38, 1389–1397. doi:10.1016/j.enpol.2009.11.020
Hertwich, E. G., and Peters, G. P. (2009). Carbon footprint of nations: A global, trade-linked analysis. Environ. Sci. Technol. 43, 6414–6420. doi:10.1021/es803496a
Horvát, P., Webb, C., and Yamano, N. (2020). Measuring employment in global value chains. OECD Sci. Technol. Industry Work. Pap. 01, 43. doi:10.1787/00f7d7db-en
Hummels, D., Ishii, J., and Yi, K.-M. (2001). The nature and growth of vertical specialization in world trade. J. Int. Econ. 54, 75–96. doi:10.1016/S0022-1996(00)00093-3
Jakob, M., and Marschinski, R. (2013). Interpreting trade-related CO2 emission transfers. Nat. Clim. Chang. 3, 19–23. doi:10.1038/nclimate1630
Jiang, X., Chen, Q., Guan, D., Zhu, K., and Yang, C. (2016). Revisiting the global net carbon dioxide emission transfers by international trade: The impact of trade heterogeneity of China. J. Ind. Ecol. 20, 506–514. doi:10.1111/jiec.12404
Jiang, X., and Milberg, W. (2013). Capturing the jobs from globalization: Trade and employment in global value chains. Working Paper 30. Manchester: The Univeristy of Manchester. Capturing The Gains 2013.
Johnson, R. C., and Noguera, G. (2012). Accounting for intermediates: Production sharing and trade in value added. J. Int. Econ. 86, 224–236. doi:10.1016/j.jinteco.2011.10.003
Kanemoto, K., Moran, D., and Hertwich, E. G. (2016). Mapping the carbon footprint of nations. Environ. Sci. Technol. 50, 10512–10517. doi:10.1021/acs.est.6b03227
Khan, S. A. R., Ponce, P., and Yu, Z. (2021). Technological innovation and environmental taxes toward a carbon-free economy: An empirical study in the context of COP-21. J. Environ. Manage. 298, 113418. doi:10.1016/j.jenvman.2021.113418
Koopman, R., Powers, W., Wang, Z., and Wei, S. (2010). Giving credit where credit is due: Tracing value added in global value chains. NBER Working Paper 16426. Cambridge, MA: National Bureau of Economic Research. doi:10.3386/w16426
Koopman, R., Wang, Z., and Wei, S. (2014). Tracing Value-Added and double counting in gross exports. Am. Econ. Rev. 104, 459–494. doi:10.1257/aer.104.2.459
Krugman, P. (1995). Chapter 24 Increasing returns, imperfect competition and the positive theory of international trade. Handb. Int. Econ. 3, 1243–1277. doi:10.1016/S1573-4404(05)80004-8
Levinson, A., and Taylor, M. S. (2008). Unmasking the pollution haven effect. Int. Econ. Rev. Phila. 49, 223–254. doi:10.1111/j.1468-2354.2008.00478.x
Li, R., Wang, Q., Liu, Y., and Jiang, R. (2021). Per-capita carbon emissions in 147 countries: The effect of economic, energy, social, and trade structural changes. Sustain. Prod. Consum. 27, 1149–1164. doi:10.1016/j.spc.2021.02.031
Li, R., Wang, Q., Wang, X., Zhou, Y., Han, X., and Liu, Y. (2022). Germany’s contribution to global carbon reduction might be underestimated – a new assessment based on scenario analysis with and without trade. Technol. Forecast. Soc. Change 176, 121465. doi:10.1016/j.techfore.2021.121465
Lin, G., Wang, F., and Pei, J. (2018). Global value chain perspective of US–China trade and employment. World Econ. 41, 1941–1964. doi:10.1111/twec.12545
López, L. A., Arce, G., and Kronenberg, T. (2013). “Pollution haven hypothesis in emissions embodied in world trade: The relevance of global value chains,” in The wealth of nations in a globalizing world (Albacete: Workshop EU FP7 WIOD Project). July, 18th–19th, 2013.
Los, B., Timmer, M. P., and de Vries, G. J. (2015). How important are exports for job growth in China? A demand side analysis. J. Comp. Econ. 43, 19–32. doi:10.1016/j.jce.2014.11.007
Los, B., Timmer, M. P., and De Vries, G. J. (2016). Tracing value-added and double counting in gross exports: Comment. Am. Econ. Rev. 106, 1958–1966. doi:10.1257/aer.20140883
Los, B., and Timmer, M. P. (2018). Measuring bilateral exports of value-added: A unified framework. NBER Work. Pap. No., 24896.
Ma, S., Liang, Y., and Zhang, H. (2019). The employment effects of global value chains. Emerg. Mark. Financ. Trade 55, 2230–2253. doi:10.1080/1540496X.2018.1520698
Meng, B., Peters, G. P., Wang, Z., and Li, M. (2018). Tracing CO2 emissions in global value chains. Energy Econ. 73, 24–42. doi:10.1016/j.eneco.2018.05.013
Mi, Z., Zheng, J., Green, F., Guan, D., Meng, J., Feng, K., et al. (2021). Decoupling without outsourcing? How China’s consumption-based CO2 emissions have plateaued. iScience 24, 103130. doi:10.1016/j.isci.2021.103130
Miroudot, S., and Ye, M. (2020). Multinational production in value-added terms. Econ. Syst. Res. 32, 395–412. doi:10.1080/09535314.2019.1701997
OECD (2016). Global value chains and trade in value-added: An initial assessment of the impact on jobs and productivity. OECD Trade Policy Papers, No. 190. Paris: OECD Publishing. doi:10.1787/5jlvc7sb5s8w-en
Pérez-Sánchez, L., Velasco-Fernández, R., and Giampietro, M. (2021). The international division of labor and embodied working time in trade for the US, the EU and China. Ecol. Econ. 180, 106909. doi:10.1016/j.ecolecon.2020.106909
Peters, G. P., Minx, J. C., Weber, C. L., and Edenhofer, O. (2011). Growth in emission transfers via international trade from 1990 to 2008. Proc. Natl. Acad. Sci. U. S. A. 108, 8903–8908. doi:10.1073/pnas.1006388108
Sakai, M., Owen, A., and Barrett, J. (2017). The UK’s emissions and employment footprints: Exploring the trade-offs. Sustain 9, 1242. doi:10.3390/su9071242
Sasahara, A. (2019). Explaining the employment effect of exports: Value-added content matters. J. Jpn. Int. Econ. 52, 1–21. doi:10.1016/j.jjie.2019.02.004
Simas, M., Wood, R., and Hertwich, E. (2015). Labor embodied in trade: The role of labor and energy productivity and implications for greenhouse gas emissions. J. Ind. Ecol. 19, 343–356. doi:10.1111/jiec.12187
Stadler, K., Steen-Olsen, K., and Wood, R. (2014). The “rest of the world” - estimating the economic structure of missing regions in global multi-regional input-output tables. Econ. Syst. Res. 26, 303–326. doi:10.1080/09535314.2014.936831
Stehrer, R. (2012). Trade in value added and the value added in trade. WIIW Working Paper 81. Available at: https://wiiw.ac.at/trade-in-value-addedand-the-valued-added-in-trade-dlp-2620.pdf.
Szymczak, S., and Wolszczak-Derlacz, J. (2021). Global value chains and labour markets–simultaneous analysis of wages and employment. Econ. Syst. Res. 34, 69–96. doi:10.1080/09535314.2021.1982678
Timmer, M. P., Dietzenbacher, E., Los, B., Stehrer, R., and de Vries, G. J. (2015). An illustrated user guide to the world input-output database: The case of global automotive production. Rev. Int. Econ. 23, 575–605. doi:10.1111/roie.12178
Timmer, M. P., Erumban, A. A., Los, B., Stehrer, R., and De Vries, G. J. (2014). Slicing up global value chains. J. Econ. Perspect. 28, 99–118. doi:10.1257/jep.28.2.99
Trefler, D., and Zhu, S. C. (2010). The structure of factor content predictions. J. Int. Econ. 82, 195–207. doi:10.1016/j.jinteco.2010.07.006
Wang, Q., Wang, L., and Li, R. (2023b). Trade protectionism jeopardizes carbon neutrality – decoupling and breakpoints roles of trade openness. Sustain. Prod. Consum. 35, 201–215. doi:10.1016/j.spc.2022.08.034
Wang, Q., Zhang, F., and Li, R. (2023a). Revisiting the environmental kuznets curve hypothesis in 208 counties: The roles of trade openness, human capital, renewable energy and natural resource rent. Environ. Res. 216, 114637. doi:10.1016/j.envres.2022.114637
Wang, S., Chen, H., and Yin, K. (2022). The employment effect of Chinese industrial enterprises embedded in environmental cost-adjusted global value chains. Environ. Sci. Pollut. Res. 29, 18160–18176. doi:10.1007/s11356-021-17118-w
Wang, S., Li, Z., and Zhang, H. (2021). Does female labor share reduce embodied carbon in trade? Environ. Sci. Pollut. Res. 28, 8246–8257. doi:10.1007/s11356-020-11172-6
Wang, Z., Wei, S. J., Yu, X., and Zhu, K. (2017). Measures of participation in global value chain and global business cycles. NBER Working Paper 23222. Cambridge, MA: National Bureau of Economic Research. doi:10.3386/w23222
Wang, Z., Wei, S., and Zhu, K. (2014). Quantifying international production sharing at the bilateral and sector level. NBER Working Paper 19677. Cambridge, MA: National Bureau of Economic Research. doi:10.3386/w19677
Wang, Z., Zhang, Y., Liao, C., Ai, H., and Yang, X. (2022). What contributes to the growth of China’s embodied CO2 emissions? Incorporating the global value chains concept. Appl. Econ. 54, 1335–1351. doi:10.1080/00036846.2021.1976382
Wiedmann, T., and Lenzen, M. (2018). Environmental and social footprints of international trade. Nat. Geosci. 11, 314–321. doi:10.1038/s41561-018-0113-9
Wu, X., Li, C., Guo, J., Wu, X., Meng, J., and Chen, G. (2021). Extended carbon footprint and emission transfer of world regions: With both primary and intermediate inputs into account. Sci. Total Environ. 775, 145578. doi:10.1016/j.scitotenv.2021.145578
Xiao, H., Meng, B., Ye, J., and Li, S. (2020). Are global value chains truly global? Econ. Syst. Res. 32, 540–564. doi:10.1080/09535314.2020.1783643
Xu, H., Zhao, G., Xie, R., and Zhu, K. (2020). A trade-related CO2 emissions and its composition: Evidence from China. J. Environ. Manage. 270, 110893. doi:10.1016/j.jenvman.2020.110893
Yang, L., Wang, Y., Wang, R., Klemeš, J. J., Almeida, C. M. V. B. D., Jin, M., et al. (2020). Environmental-social-economic footprints of consumption and trade in the Asia-Pacific region. Nat. Commun. 11, 4490–4499. doi:10.1038/s41467-020-18338-3
Yu, D. J., and Li, J. (2021). Evaluating the employment effect of China’s carbon emission trading policy: Based on the perspective of spatial spillover. J. Clean. Prod. 292, 126052. doi:10.1016/j.jclepro.2021.126052
Zhang, Z., Zhu, K., and Hewings, G. J. D. (2017). A multi-regional input–output analysis of the pollution haven hypothesis from the perspective of global production fragmentation. Energy Econ. 64, 13–23. doi:10.1016/j.eneco.2017.03.007
Keywords: international trade, carbon emissions, employment, global value chain, multi-region input-output model
Citation: Bai S, Zhang B and Ning Y (2023) Comprehensive assessment of the environmental and employment impacts of international trade from the perspective of global value chains. Front. Environ. Sci. 10:1099655. doi: 10.3389/fenvs.2022.1099655
Received: 16 November 2022; Accepted: 21 December 2022;
Published: 18 January 2023.
Edited by:
Shuhong Wang, Shandong University of Finance and Economics, ChinaReviewed by:
Binbin Lu, Nankai University, ChinaQiang Wang, China University of Petroleum, Huadong, China
Copyright © 2023 Bai, Zhang and Ning. This is an open-access article distributed under the terms of the Creative Commons Attribution License (CC BY). The use, distribution or reproduction in other forums is permitted, provided the original author(s) and the copyright owner(s) are credited and that the original publication in this journal is cited, in accordance with accepted academic practice. No use, distribution or reproduction is permitted which does not comply with these terms.
*Correspondence: Yadong Ning, ningyd@dlut.edu.cn