Spatiotemporal changes in temperature projections over Bangladesh using multi-model ensemble data
 H. M. Touhidul Islam1†
  Mohammad Kamruzzaman2*†‡
  Shamsuddin Shahid3
  Mohammed Mainuddin4
  Edris Alam5,6
  Abu Reza Md. Towfiqul Islam1*
  Jatish Chnadra Biswas7
  Md. Azharul Islam8
- 1Department of Disaster Management, Begum Rokeya University, Rangpur, Bangladesh
- 2Farm Machinery and Postharvest Technology Division, Bangladesh Rice Research Institute, Gazipur, Bangladesh
- 3School of Civil Engineering, Universiti Teknologi Malaysia (UTM), Jiangsu, Malaysia
- 4CSIRO Land and Water, Canberra, ACT, Australia
- 5Faculty of Resilience, Rabdan Academy, Abu Dhabi, United Arab Emirates
- 6Department of Geography and Environmental Studies, University of Chittagong, Chittagong, Bangladesh
- 7Krishi Gobeshona Foundation (KGF), Bhabha Atomic Research Centre, Dhaka, Bangladesh
- 8Department of Environmental Science, Bangladesh Agricultural University, Mymensingh, Bangladesh
Temperature rise is a concern for future agriculture in different regions of the globe. This study aimed to reveal the future changes and variabilities in minimum temperature (Tmin) and maximum temperature (Tmax) in the monthly, seasonal, and annual scale over Bangladesh using 40 General Circulation Models (GCMs) of Coupled Model Intercomparison Project Phase 5 (CMIP5) for two radiative concentration pathways (RCPs, RCP4.5 and RCP8.5). The statistical downscaling climate model (SimCLIM) was used for downscaling and to ensemble temperature projections (Tmax and Tmin) for the near (2021–2060) and far (2071–2100) periods compared to the base period (1986–2005). Multi-model ensemble (MME) exhibited increasing Tmax and Tmin for all the timescales for all future periods and RCPs. Sen’s slope (SS) analysis showed the highest increase in Tmax and Tmin in February and relatively less increase in July and August. The mean annual Tmax over Bangladesh would increase by 0.61°C and 1.75°C in the near future and 0.91°C and 3.85°C in the far future, while the mean annual Tmin would rise by 0.65°C and 1.85°C in the near future and 0.96°C and 4.07°C in the far future, for RCP4.5 and RCP8.5, respectively. The northern and northwestern parts of the country would experience the highest rise in Tmax and Tmin, which have traditionally been exposed to temperature extremes. In contrast, the southeastern coastal region would experience the least rise in temperature. A higher increase in Tmin than Tmax was detected for all timescales, signifying a future decrease in the diurnal temperature range (DTR). The highest increase in Tmax and Tmin will be in winter compared to other seasons for both the periods and RCPs. The spatial variability of Tmax and Tmin changes can be useful for the long-term planning of the country.
1 Introduction
Temperature is an important factor in determining the effects of climate change (CC) on the globe or on the region of interest (Almazroui et al., 2020b). Since 1850, the earth’s temperature has risen significantly (Ozturk et al., 2018; Wang et al., 2021). This has altered the frequency, severity, duration, timing, and spatial variability of temperature extremes (Islam A. R. M. T. et al., 2021; Pérez et al., 2021; Mallick et al., 2022a), and significantly impacted ecological instability, public health, agricultural production, water supplies, and socioeconomic progress (Allen et al., 2010; Islam H. M. T. et al., 2021; Mallick et al., 2022b). Even if all countries reduce greenhouse gas (GHG) emissions committed in the Paris Agreement, the earth’s average temperature will increase by 2.6°C–4.8°C in 2100 (Wang et al., 2021). Hence, it is of absolute necessity to examine future temperature projections to reduce global warming consequences and for strategic planning of CC adaptations.
GCMs are used to project temperature globally. Different Coupled Model Intercomparison Projects (CMIPs) introduced many GCMs to examine future climate patterns. The CC assessment models have been updated significantly since CMIP3 (Song et al., 2021). The RCPs have lately been developed in CMIP5 to provide projections for different radiative forcings (Rahman and Rob, 2019). CMIP5 models have thoroughly outlined the earth system with high geospatial resolution and integrated physics (Almazroui et al., 2020a) and, therefore, shown better skill in climate projections than CMIP3 models (Song et al., 2021; Islam et al., 2022). GCMs have been extensively used for climate modeling (IPCC, 2014). However, they still cannot fully describe many regional climate dynamics because of their coarser resolution (Ali et al., 2021; Wang et al., 2021). Downscaling strategies, which can retrieve higher resolution data from coarse resolution datasets, are crucial for addressing this difficulty for regional or local scale climate modeling (Kamruzzaman et al., 2019b; Kamruzzaman et al., 2021a; Kamruzzaman et al., 2021b; Das et al., 2022a; Das et al., 2022b). Statistical Downscaling (SD) and Dynamic Downscaling (DD) are the two main approaches used for climate downscaling. The SD is frequently preferred because of its simplicity, cost, quick computations, and lower computational requirements (Rashid et al., 2015).
GCM projections are inherently coupled with uncertainty due to the modeling approach, initial condition, and future scenarios (Katzenberger et al., 2021). Moreover, an individual GCM cannot model all atmospheric processes and identify every climatic variation at a smaller scale with greater accuracy (Almazroui et al., 2020b; Ali et al., 2021). Therefore, multi-model ensembles (MME) of GCMs are usually suggested for climate modeling to address uncertainty and improve projection performance (Xu and Xu, 2012; Wang et al., 2021). A large number of studies have projected temperature based on MME of CMIP5 models at various scales (Almazroui et al., 2016; 2020a; Pattnayak et al., 2017; Amin et al., 2018a; Kumar and Sarthi, 2019; Ali et al., 2021). They found that the future temperature will increase, which might be attributed mostly to climatic diversity, geographical factors, and societal context (King et al., 2018). Hence, further research, particularly at the regional or national level, is required to assess the suitability of GCMs in temperature projection and provide ample and precise supplementation for the sensitivity of local or regional temperature variability to climatic changes.
Bangladesh is extremely vulnerable to CC due to its unique geographical location, poor infrastructure, low-lying topography, and high population density (Huq, 2001). Understanding potential climatic change is essential for creating adaptation strategies and increasing resilience to CC. However, a few studies used CMIP5 models to assess future changes in temperature in Bangladesh for various CC scenarios (Alamgir et al., 2015; Hasan et al., 2018; Rahman and Rob, 2019; Bosu et al., 2021). Alamgir et al. (2019) projected Tmax and Tmin over Bangladesh using MME of eight CMIP5 GCMs. They projected an increase in Tmax by 1.3°C–4.3°C and Tmin by 1.8°C–5.1°C for different RCPs. They also projected the highest rise in Tmax and Tmin in the northern region and the lowest in the southeastern coastal region of Bangladesh. Hasan et al. (2018) utilized MME of five bias-correction CMIP5 regional climate models to project the climate extremes. They reported a higher increase in Tmax and Tmin in the southwest region than in other parts of Bangladesh. Earlier research was mostly concentrated on a limited number of GCMs or RCMs for monthly or annual Tmax and Tmin projections at the regional or national scale. Unfortunately, understanding the spatiotemporal trends and variations of future temperature changes at monthly, seasonal, and annual timescales is limited. Moreover, no extensive study has been conducted for temperature projections employing all existing CMIP5 GCMs at various time scales over Bangladesh. This study is expected to fill this gap.
This study used CMIP5 GCM temperature simulation to investigate probable temperature changes across Bangladesh. The main objectives of this research are i) to investigate the monthly, seasonal, and annual future Tmax and Tmin trends across Bangladesh for the near (2021–2060) and the far (2061–2100) periods based on the MME of 40 CMIP5 GCMs; ii) to examine the spatiotemporal variability and changes in future Tmax and Tmin over the country. The novelty of this study is that this is the first study using all available CMIP5 models to project temperature over Bangladesh. Furthermore, a pattern-scaling bias-correction technique based on the SimCLIM climate model has been adopted for the first time for temperature downscaling and projection in Bangladesh. The findings of this study will help design and develop targeted CC adaptation or mitigation strategies in Bangladesh.
2 Methods
2.1 Study area
Bangladesh is a flat topographical country in Southeast Asia, consisting of low-lying alluvial plains in the deltas of Asia’s three largest rivers known as the Ganges-Brahmaputra-Meghna. It has a tropical monsoon climate distinguished by considerable seasonal rainfall variation, moderate hot temperature, and high humidity (Islam H. M. T. et al., 2021). The four main seasons of Bangladesh can be categorized as pre-monsoon (March to May), monsoon (June to September), post-monsoon (October to November), and winter (December to February) (Kamruzzaman et al., 2019a; Jerin et al., 2021). The country’s mean temperature varies from 26.9°C to 31.1°C in pre-monsoon, while in winter, it ranges from 17.0°C to 20.6°C. January is the coldest month, with a mean temperature of 20.6°C in the coastal zone and 17°C in the northwestern and northeastern regions. May is the warmest month when the average temperature varies from 27°C in the eastern and southern parts to 31°C in the western-central region. The northwestern region of Bangladesh has the highest temperature extremes. In some pre-monsoon summer months, the temperature can rise over 42°C, while in winter, the nighttime temperature can fall below 5°C (Shahid et al., 2012; Alamgir et al., 2019).
2.2 Data sources
In this study, downscaled data for two time slices, i.e. near (2021–2060) and far (2061–2100), was used to assess the future changes of Tmax and Tmin for two different periods based on the reference period (1986–2005). SimCLIM 4.0 was employed to anticipate future Tmax and Tmin using the MME of 40 GCMs, presented in Table 1. The earth System Grid (ESG) was used to collect CMIP5 GCMs temperature projection data (Taylor et al., 2012; Islam et al., 2022). CMIP5 models included multiple emission scenarios, namely RCP2.6, 4.5, 6.0, and 8.5 (IPCC, 2014). RCP4.5 represents moderate greenhouse gas (GHG) emissions and, thus, provides a median projection of global climate. In contrast, RCP8.5 represents high GHG emissions in the future like the present and, therefore, provides a higher range of projections. This study used the GCM simulations for RCP4.5 and RCP8.5.
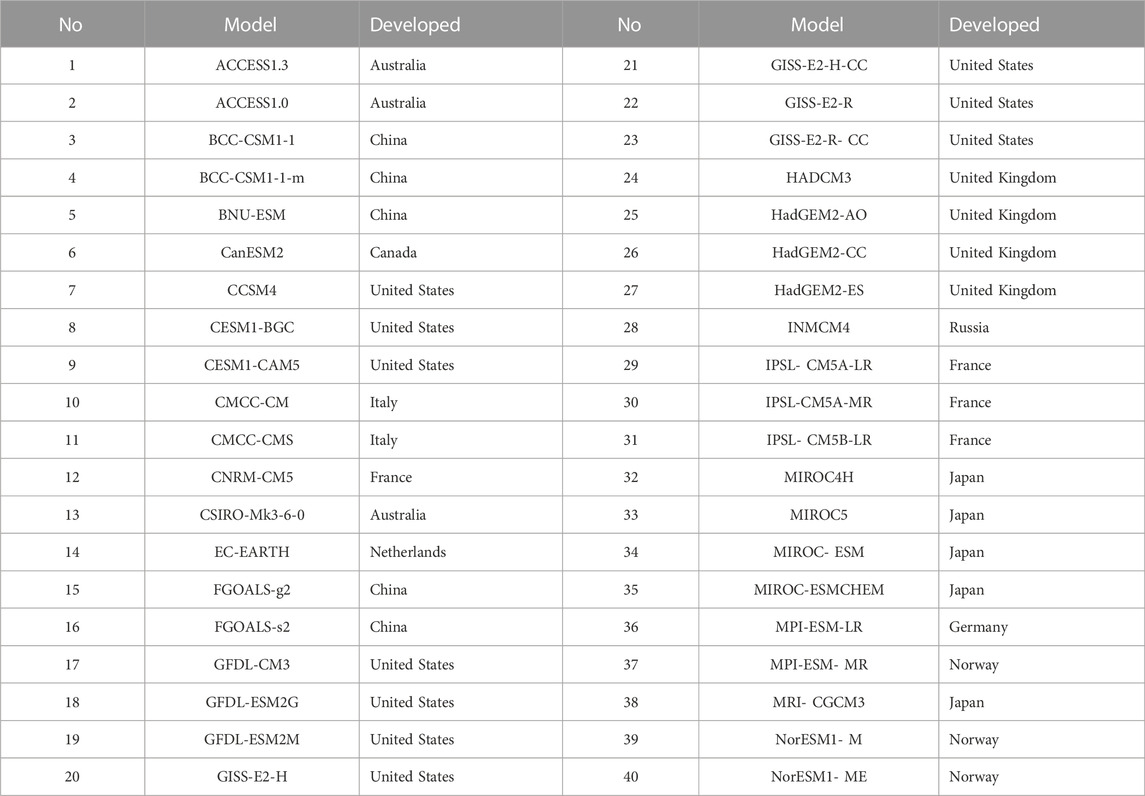
TABLE 1. The CMIP5 40 GCMs used in SimCLIM4.0 (Yin et al., 2013).
For downscaling and projection of GCM temperature, monthly Tmax and Tmin data of 30 meteorological stations (Figure 1) were used as reference (1986–2005) datasets. The data were collected from the Bangladesh Metrological Department (BMD). The recommended method by World Meteorological Organization (WMO) was used for the homogeneity test of the collected data at all meteorological stations. In Bangladesh, BMD now runs 39 weather stations to monitor the country’s weather (BMD, 2020). Some stations were set up after 1990, so no long-term data are available at those sites. The meteorological stations were selected based on their location, data availability (less than 3% of data is missing) and homogeneity, allowing these data to cover all over Bangladesh. Inverse Distance Weighting (IDW) Interpolation of the neighboring stations’ temperatures was used to fill up the missing data of the chosen stations. The IDW was also used for visualizing the spatial changes in future Tmax and Tmin. Despite some limitations, such as the bull’s-eye effect around data points, consider only distance effect, and the inability to measure prediction errors (Tobin et al., 2011; Daly, 2006), it is one of the most popular interpolation techniques in the world, including Bangladesh. The land of Bangladesh is very flat, as mentioned in the study area description. The influence of each station in such topography predominantly varies with distance, as assumed in the IDW method.
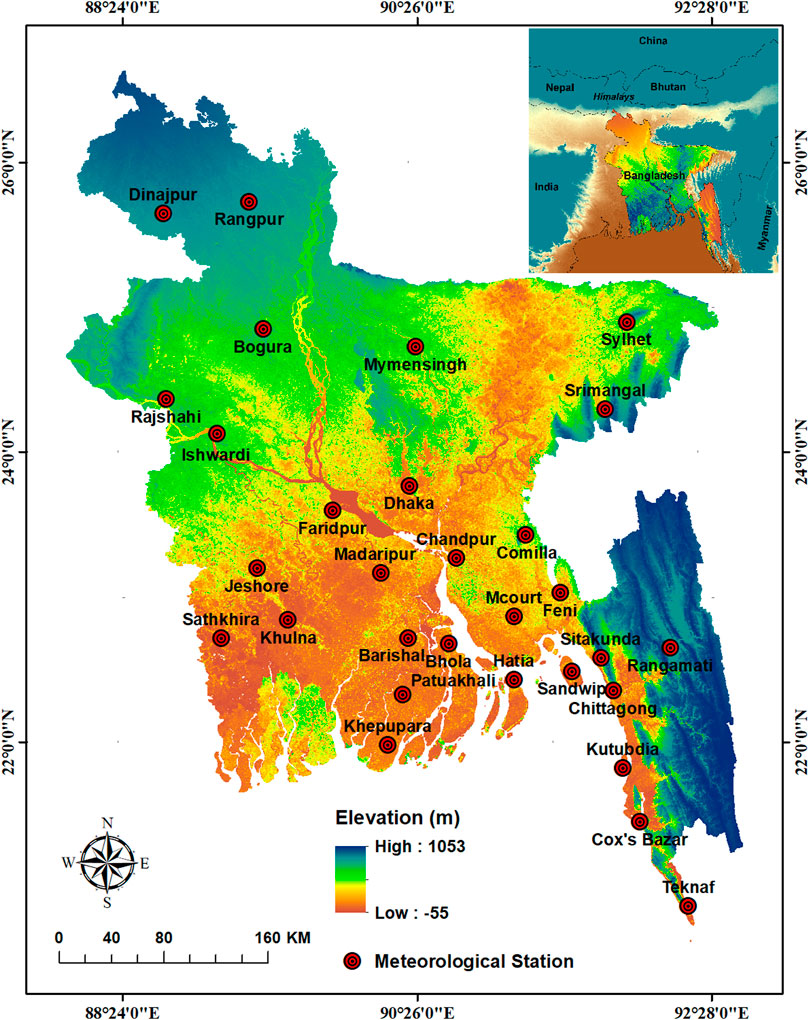
FIGURE 1. Geographical position of the study area and the sites of the meteorological stations.
2.2.1 SimCLIM 4.0
SimCLIM 4.0 (https://www.climsystems.com/simclim) is a user-friendly application for climate data processing that facilitates access to critical climatic information for determining climate risk and response. SimCLIM 4.0 for Desktop can handle both spatial and site data. It includes several tools, such as spatial scenario generation and impact models, to provide meaningful and comfortable information retrieval on historical, present, and future climate extremes (Warrick et al., 2012; Islam et al., 2022). SimCLIM, first utilized in New Zealand, was primarily inspired by CLIMPACTS (Warrick, 2009). It now covers many other countries and regions worldwide, including Bangladesh, to create climate datasets (Amin et al., 2018a; b; Rahman and Rob, 2019; Zheng et al., 2020; Islam et al., 2022). This study used SimCLIM 4.0 to generate climate projections for RCP4.5 and RCP8.5.
SimCLIM downscales and projects climatic parameters using a pattern scaling bias correction technique. Local differences between two specified periods are estimated first and then adjusted using global mean Tmin and Tmax variations (Rogelj et al., 2012; Yin et al., 2013). This enables downscaling GCMs considering the geographical, temporal, and multivariable climatic structure.
Then the local variation (
where m is the future sample periods number in any 5-year average between 2021 and 2100.
Pattern-scaling downscaling enables SimCLIM 4.0 to anticipate multiple climatic parameters at fine accuracy and resolution for diverse spatiotemporal scales (Amin et al., 2018a; Amin et al., 2018b; Islam et al., 2022). It has easily configurable downscaling capabilities for downscaling GCMs to the geographic resolution necessary for the CC impact evaluation (Yin et al., 2013).
Some climate processes are not fully understood or cannot be resolved due to computational constraints, leading to uncertainty in initial conditions, boundary conditions (such as a radiative forcing scenario), parameterization, and, eventually, climate simulations. Multi-model ensemble (MME) approaches, in which the results of selected GCMs are combined for climate projections, are frequently employed to reduce the uncertainties associated with GCMs. Moreover, the MME performs well in comparison with the performance of individual models, as the MME GCMs compensate for each other’s computational errors.
SimCLIM can also produce an “ensemble” model from the user-selected GCM outputs with lower, upper, and median projections (Amin et al., 2018b). This study used the MME median of the 40 GCMs to reduce the influence of individual GCMs.
2.3 Statistical analyses
2.3.1 Mann-kendall test (MK)
The non-parametric Mann-Kendall (MK) test, suggested by the World Meteorological Organization (WMO) to examine the trends in hydro-meteorological time series, was employed for identifying projected temperature trends (Mann, 1945; Kendall, 1975). The MK test null hypothesis (H0) implies the existence of no monotonic trend in the time series, whereas the alternative hypothesis (Ha) states the existence of a monotonic trend. The MK test statistic S) can be expressed as:
The S value is assumed to be identical to the normal distribution with an average of zero, and the statistical discrepancy of S can be estimated by Eq. (5):
The Z value is used to determine whether or not a significant trend exists in the time-series data. The normalized Z value can be calculated by Eq. (6):
In a Z statistic, the positive value represents increasing and the negative value represents a decreasing trend. The null hypothesis (H0) of no trend is rejected at the 99%, 95%, and 90% significance levels if Z value is greater than or equal to 2.58, 1.96, and 1.65, respectively. This study used a 95% confidence level for recognizing a positive or negative significant trend.
2.3.2 Sen’s slope estimator
Sen’s slope (SS) estimator, a non-parametric method introduced by Sen (1968), was used to analyze the trend magnitude in projected temperature. The main advantage of this strategy over other techniques is that the outlier has less impact on the computed slope (Novotny and Stefan, 2007). It is computed as follows;
where xj and xi denote the jth and ith values, respectively, in the time series. A positive or negative value of β suggests an increasing or decreasing rate of changes, respectively.
3 Results
3.1 Reproducibility of climate models
The simulated Tmax and Tmin of MME of 40 CMIP5 GCMs are compared with the observed Tmax and Tmin and presented using the line graph of average (Figures 2A, C) and standard deviations (STD) for the period 1986–2005 (Figures 2B, D). The line graph of monthly mean Tmax and Tmin provides an overall view of the models’ reliability, whereas STD shows variability in temperature. The simulated historical MME Tmax and Tmin showed good performance, with R2 => 0.80, thus regarded to be in accordance with the observed temperature.
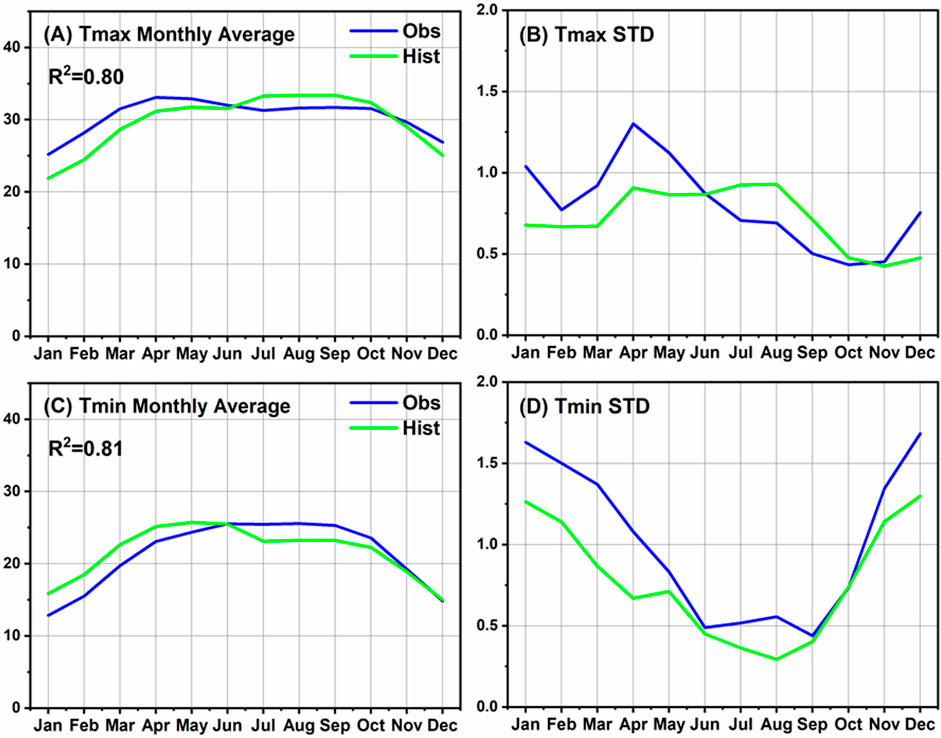
FIGURE 2. Comparison of observed and historical GCM of maximum temperature (Tmax) and minimum temperature (Tmin) for the period 1986–2005. (A,C) Monthly average, (B,D) Standard deviation.
The MME temperature reproduced the observed temperature with a little underestimation or overestimation in different months. The MME underestimated observed Tmax by about 1.81°C–3.73°C during winter months (Dec–Feb), while it overestimated Tmin by 0.14–3.03°C. Similar underestimation and overestimation of Tmax and Tmin were also observed in pre-monsoon months in a range of 1.16°C–2.89°C and 1.36°C–2.89°C, respectively. The underestimation and overestimation of Tmax were also noticed in monsoon and post-monsoon months. In contrast, Tmin was underestimated in monsoon and post-monsoon months at a range of 0.04–2.09°C and 0.31–1.29°C, respectively. The results showed the ability of the downscaling method to reproduce the observed temperature at the stations reliably.
3.2 Spatiotemporal Tmax trends for the future periods
The monthly Tmax trends (SS) for future periods considering RCP4.5 and RCP8.5 are exhibited in Figures 3, 4, respectively. The figures show the spatial distribution of Tmax trends for the near (2021–2060) and far (2061–2100) futures over Bangladesh, providing a glimpse into the future Tmax. The SS analysis revealed that the greatest Tmax increases were in January, February and December at a rate of 0.03–0.16°C/decade for RCP4.5 and 0.35–0.81°C/decade for RCP8.5 (Figures 3, 4). The highest increase in these months was projected at Rangpur, Mymensingh, and Sylhet stations in northern Bangladesh. A similar spatial trend was observed in March and April, where the highest increase was observed in Rangpur. The greatest increases in August, October, and November Tmax were also noticed at this station. For May-July, the greater Tmax increase was in the western region (the greatest is in Rajshahi) and the lower in the northeastern region (the lowest was in Sylhet). The results indicate a higher Tmax rise in the near and lower in the far period for RCP4.5. In contrast, a higher Tmax trend was observed in the far future than near future for RCP8.5.
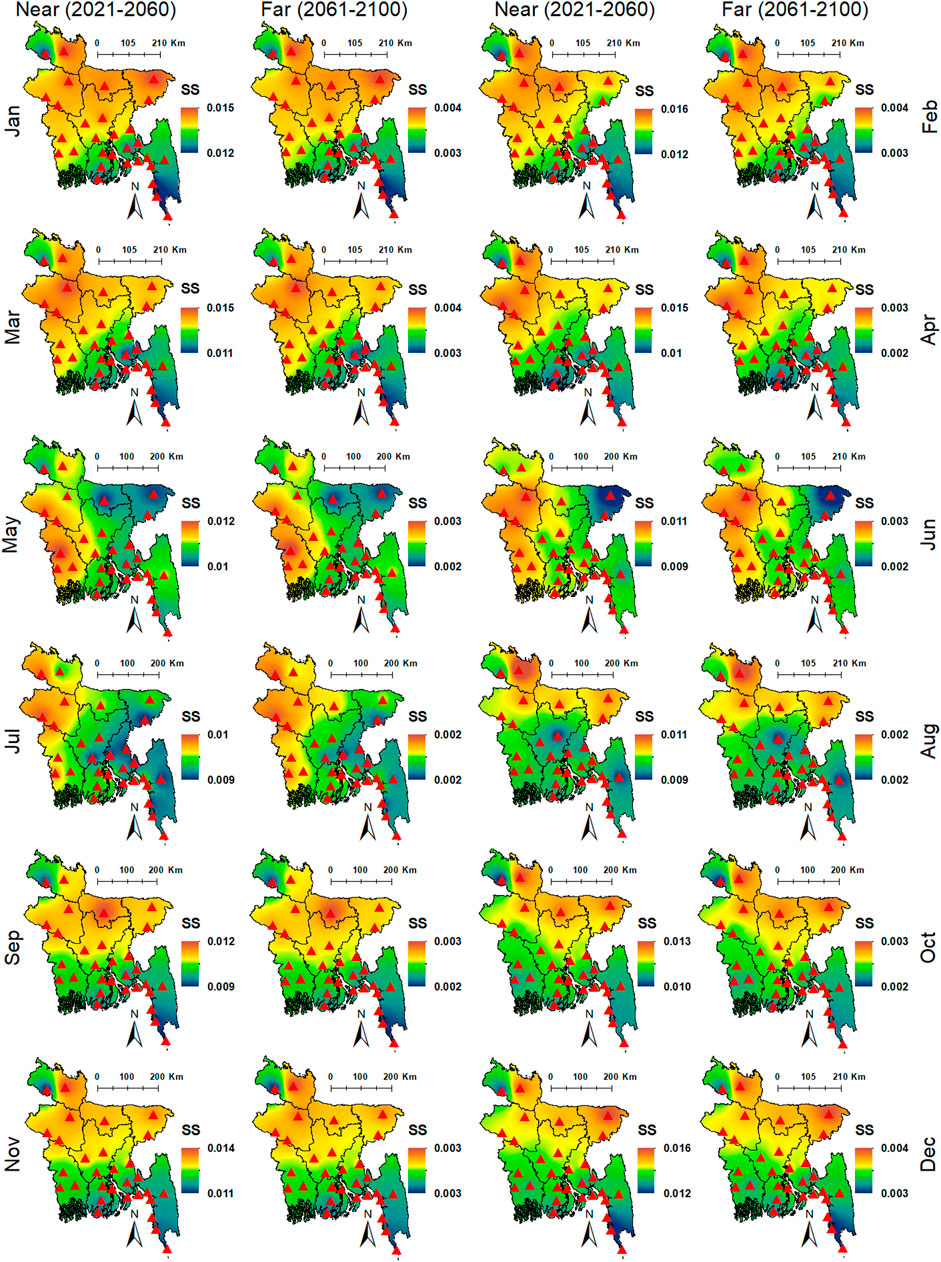
FIGURE 3. Spatial distribution of monthly (Jan-Dec) Tmax (oC) trends (SS) for near (2021–2060) and far (2061–2100) futures periods over Bangladesh considering 30 meteorological stations for RCP4.5.
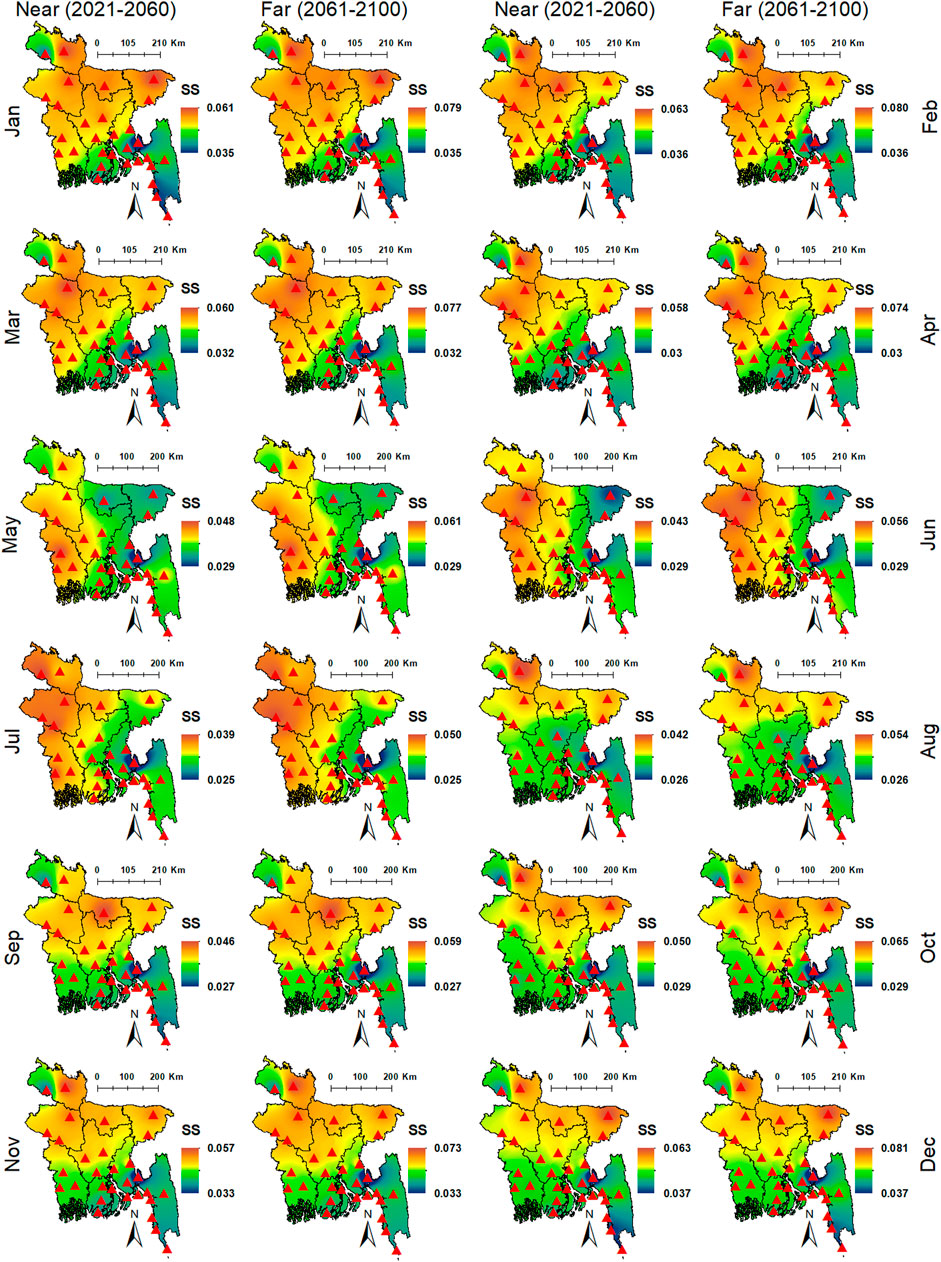
FIGURE 4. Same as Figure 3 but for the RCP8.5.
Figure 5 presents the annual and seasonal change (SS) in Tmax for the near and far future periods at 30 stations across Bangladesh for RCP4.5 and RCP8.5. The highest annual Tmax increase was by 0.13°C/decade in near and 0.03°C/decade in far futures for RCP4.5. The projected increases for RCP8.5 were 0.51°C/decade in the near and 0.66°C/decade in the far period. Among the seasons, winter exhibited the highest increase at a rate of 0.16°C/decade in near and 0.04°C/decade in far futures for RCP4.5. For RCP8.5, increases were 0.62°C/decade in the near and 0.80°C/decade in the far periods. SS analysis of annual and seasonal Tmax indicated the highest trend in Rangpur, Rajshahi, Bogura, Sylhet, and Mymensingh in northern and northwestern Bangladesh (Figure 5).
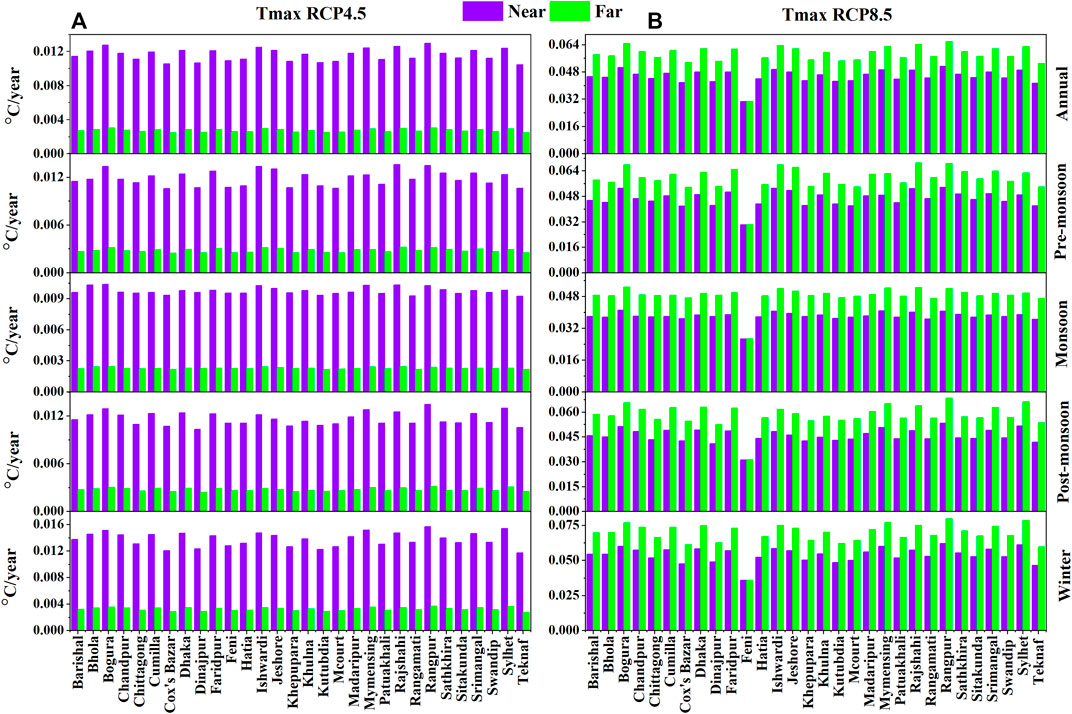
FIGURE 5. Sen’s slope estimator for annual and seasonal Tmax (oC) trend (SS) analysis for near (2021–2060) and far (2061–2100) periods over Bangladesh considering 30 meteorological stations under (A) RCP4.5 and (B) RCP8.5.
Table 2 presents the areal average Tmax trends of Bangladesh in monthly, seasonal and annual scales for both RCPs. Like Figures 3, 4, the greatest Tmax increases were also found in December-January, similar to the results presented in Table 2. The mean annual Tmax was projected to increase by 0.12°C/decade in the near and 0.03°C/decade in the far future for RCP4.5. The changes would be 0.46°C/decade and 0.59°C/decade for RCP8.5 in the near and far future, respectively. The highest increase in Tmax in Bangladesh will be in winter than in other seasons.
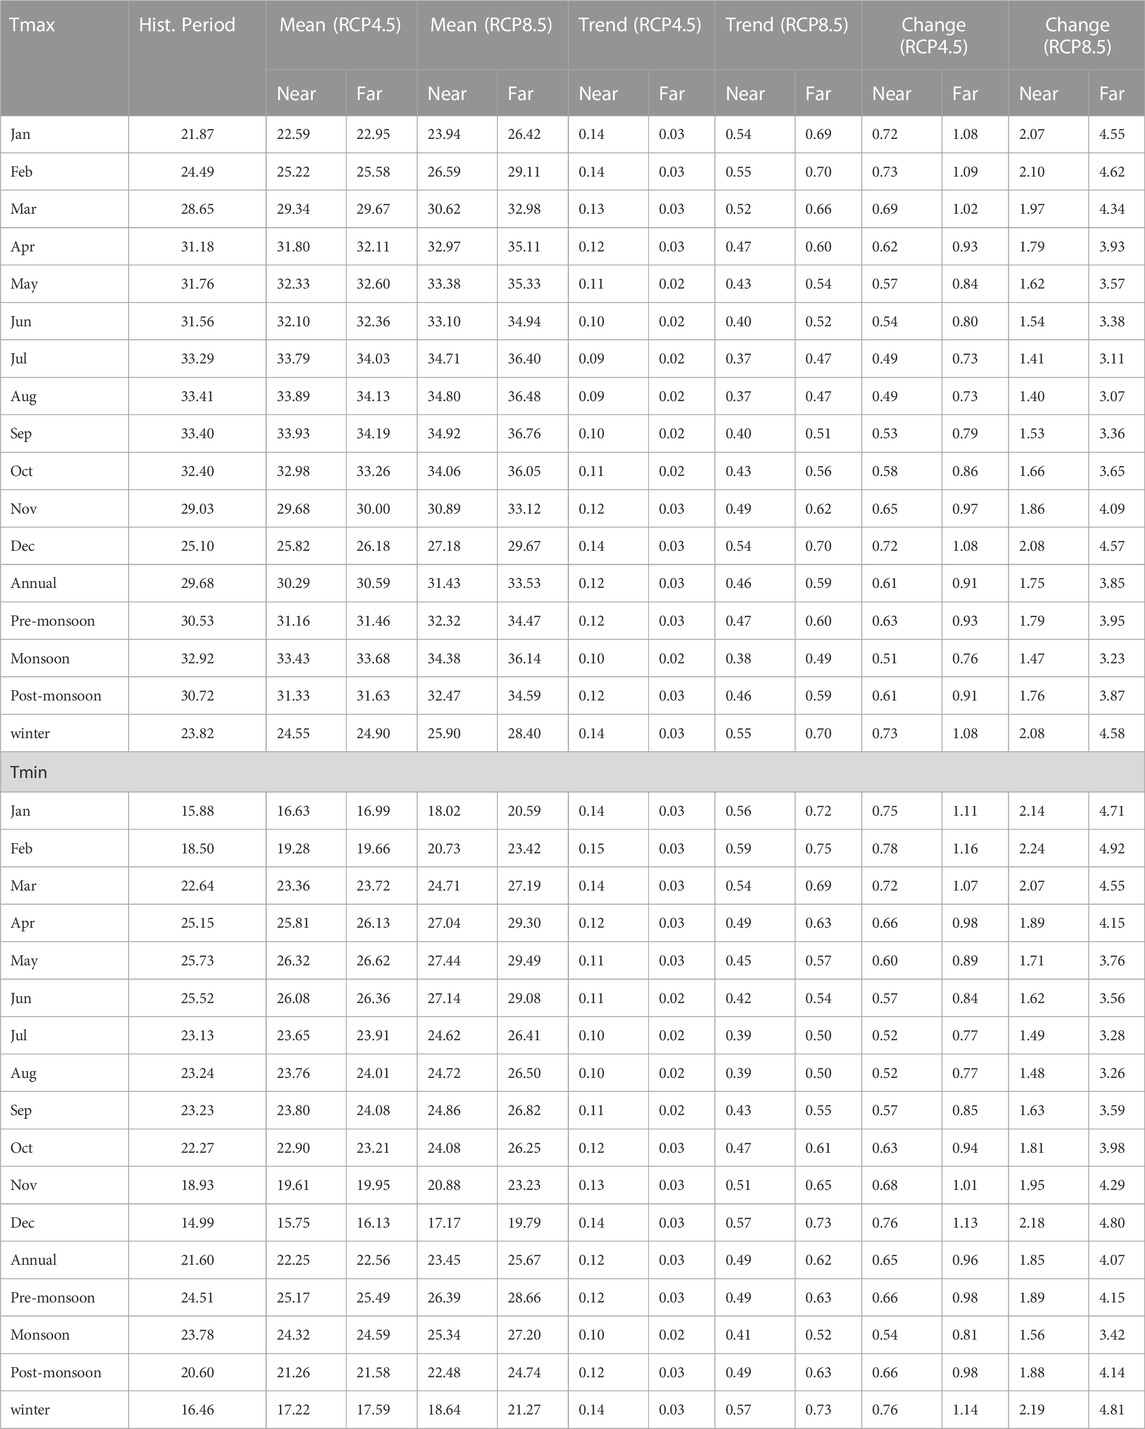
TABLE 2. Monthly and seasonal mean Tmax (°C) and Tmin (°C) and its changes in overall Bangladesh during near and far future periods for RCP4.5 and RCP8.5.
3.3 Spatiotemporal Tmin trends for the future periods
The spatial distribution of Tmin trends (SS) for the near (2021–2060) and far (2061–2100) futures for RCP4.5 and RCP8.5 are presented in Figure 6, 7, respectively. The MK test revealed a significant trend in Tmin at all 30 stations in both future periods and RCPs. SS revealed the highest Tmin rise in February at a rate of 0.03–0.17°C/decade for RCP4.5 and 0.48–0.85°C/decade for RCP8.5 in both futures. The lowest Tmin rise was projected in July and August for both RCPs. The highest rise was for January-April at Srimangal, Sylhet, and Mymensingh, in the northern or northeastern region, and for May-June at Ishwardi and Rajshahi stations, in the western region, for both RCPs. Moreover, a higher rise in Tmin was observed in the northern region in September-December, like January–April (Figures 6, 7).
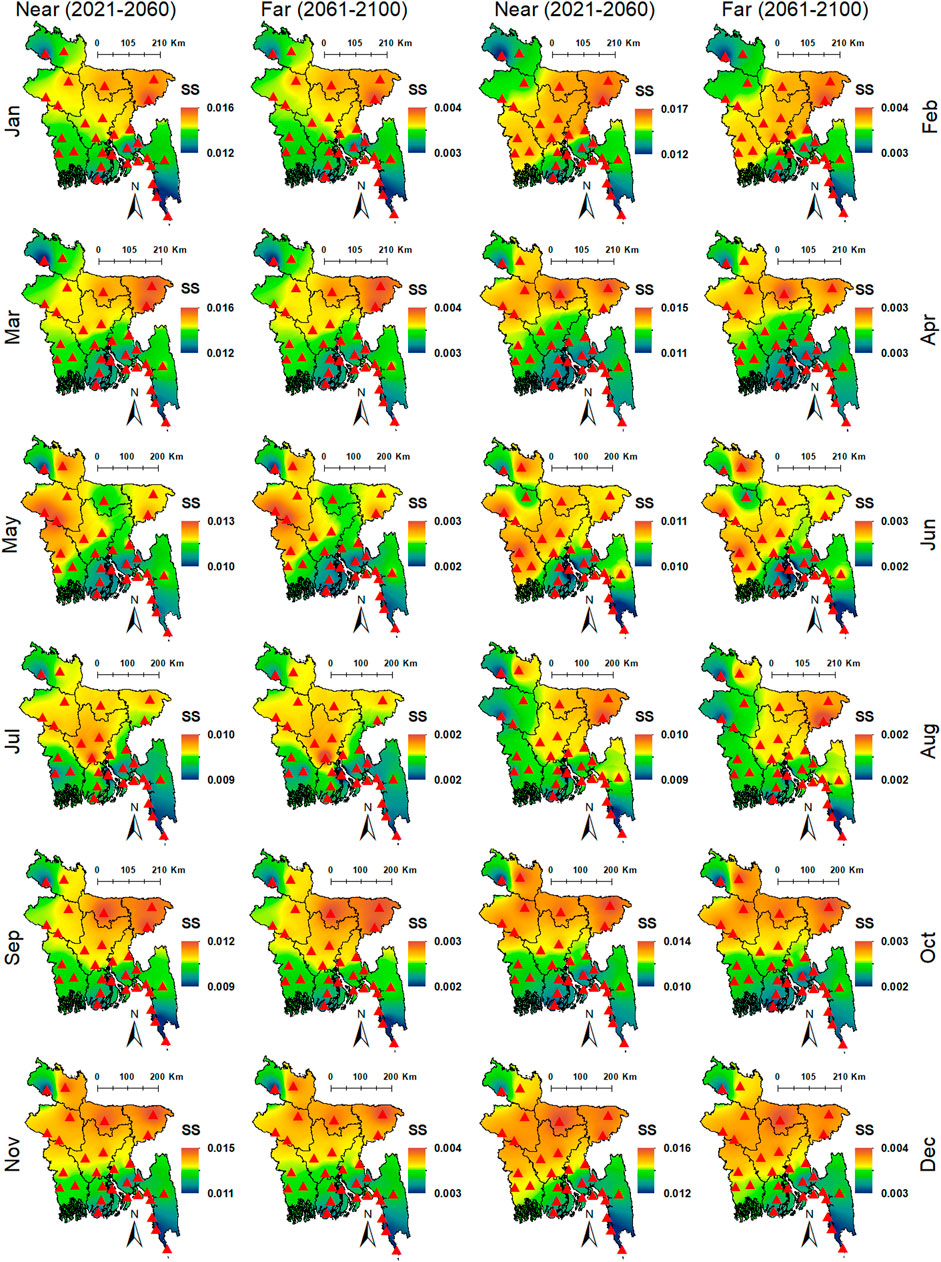
FIGURE 6. Spatial distribution of monthly (Jan-Dec) Tmin (oC) trends (SS) for near (2021–2060) and far (2061–2100) futures over Bangladesh considering 30 meteorological stations for RCP4.5.
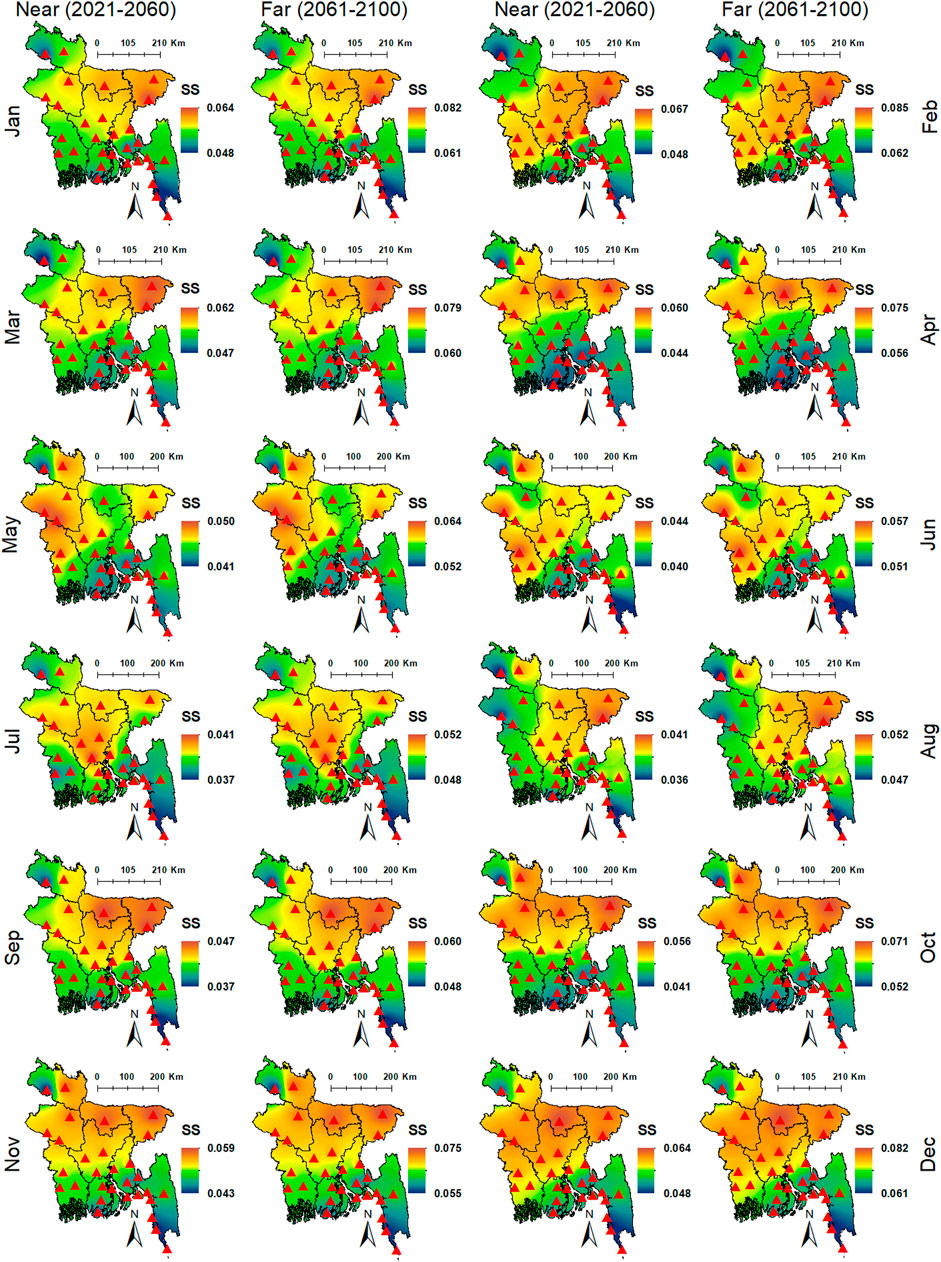
FIGURE 7. Same as Figure 6 but for the RCP8.5.
Figure 8 depicts the annual and seasonal changes (SS) in Tmin for the near and far future periods at 30 sites across Bangladesh for RCP4.5 and RCP8.5. For RCP4.5, the projected highest annual Tmin rise was 0.13°C/decade in near futures and 0.03°C/decade in far futures. The increases for RCP8.5 were 0.53°C/decade in the near and 0.68°C/decade in the far future. winter would experience the greatest increase among the seasons, by 0.16°C/decade in near and 0.04°C/decade in far futures for RCP4.5. However, RCP8.5 showed to rise of 0.64°C/decade in the near period and 0.83°C/decade in the far period. The SS revealed the highest increase in annual Tmin in the eastern, central, northern, and western regions. The highest increase in Tmin during pre-monsoon, post-monsoon, and winter was found in central to eastern, northeastern, and northwestern Bangladesh (Figure 8).
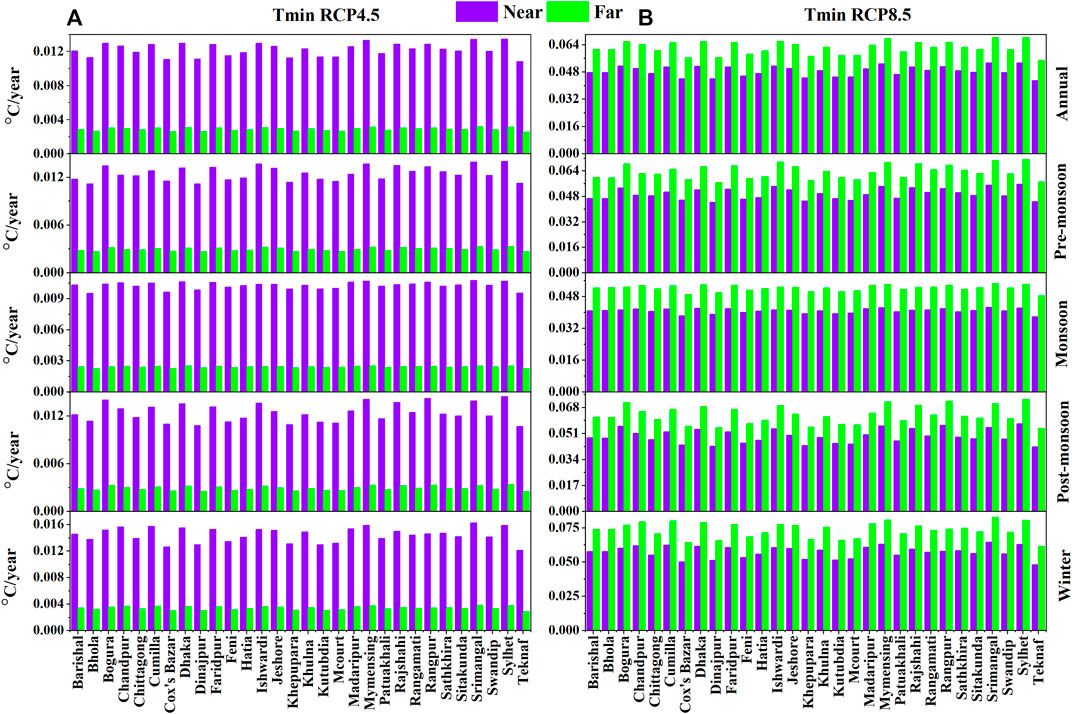
FIGURE 8. Sen’s slope estimator for annual and seasonal Tmin (oC) trend (SS) analysis for near (2021–2060) and far (2061–2100) periods over Bangladesh at 30 meteorological stations under (A) RCP4.5 and (B) RCP8.5.
Table 2 shows the Tmin trends at monthly, yearly, and seasonal timeframes for both RCPs over the whole of Bangladesh. The mean annual Tmin for RCP4.5 showed an increase of 0.12°C/decade and 0.03°C/decade in the near and far future, respectively. In comparison, the trends for RCP8.5 were 0.49°C/decade and 0.62°C/decade in the near and far future, respectively. Nevertheless, the seasonal Tmin trend analysis showed the highest increase in winter for both the periods and RCPs (Table 2).
3.4 Future projected Tmax variability and change
Figure 9 illustrates the monthly and seasonal MME Tmax variability over Bangladesh for the near and far periods for RCP4.5 and RCP8.5. The Tmax variability for RCP4.5 and RCP8.5 is shown using black and red lines, respectively. Figures 9A, B, L shows that Tmax in January, February, and December would differ from 22°C to 27°C for RCP4.5 and 22.5°C–31.5°C for RCP8.5 in the near and far periods. This projected Tmax range would reach 31.5°C–34.5°C for RCP4.5 while 32°C–38°C for RCP8.5 in May-September (Figures 9E–I). Tmax would range from 29°C to 33.5°C for RCP4.5 and 29.5°C–37.5°C for RCP8.5 throughout the transitional months of March–April and October–November (Figures 9C, D, J, K).
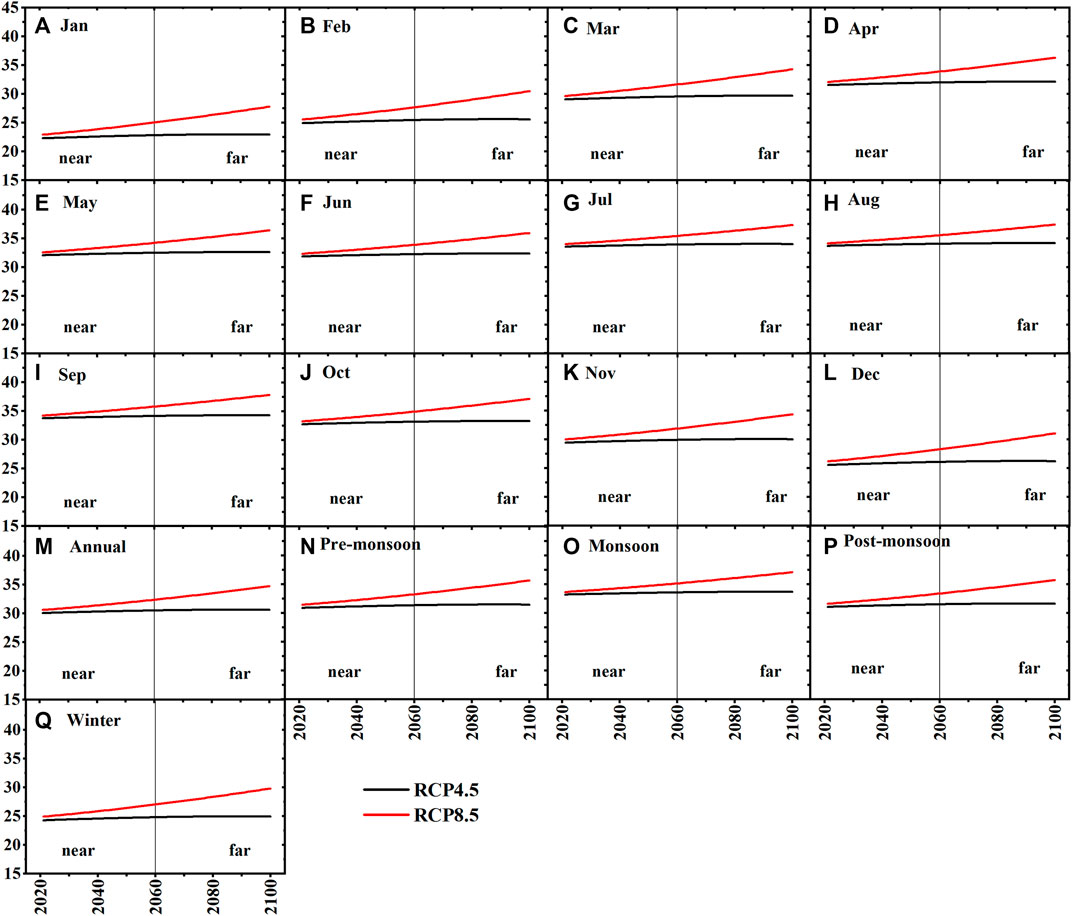
FIGURE 9. Monthly, Annual and Seasonal Tmax (oC) variability of multi-model ensemble (MME) of CMIP5 datasets under RCP4.5 and RCP8.5 for the near and far periods in Bangladesh. (A) January, (B) February, (C) March, (D) April, (E) May, (F) June, (G) July, (H) August, (I) September, (J) October, (K) November, (L) December, (M) Annual, (N) Pre-monsoon, (O) Monsoon, (P) Post-monsoon, and (Q) Winter.
The projected annual Tmax was in the range of 30.05°C–30.62°C for RCP4.5, while between 30.57°C and 34.71°C for RCP8.5 in both periods (Figure 9M). The projected Tmax variability was very much identical during pre-monsoon and post-monsoon seasons, extending from 30.5°C to 32°C for RCP4.5 and 31°C–36°C for RCP8.5 for both periods (Figures 9N, P). However, a higher Tmax variability was projected during monsoon, 33°C–37°C for RCP4.5 and RCP8.5 (Figure 9O), and the lower variability in the winter, 24°C–25°C for RCP4.5 and 24.5°C–30°C for RCP8.5 (Figure 9Q). The results revealed a higher deviation in the warming signal for different months and seasons for both RCPs. Higher future warming is likely for RCP8.5 than RCP4.5 because of the higher radiative forcing for RCP8.5.
The projected change in mean monthly Tmax for near and far futures for RCP4.5 and RCP8.5 is illustrated in Figures 10A,B, respectively. The results showed an increase in Tmax in all months for both futures and scenarios. The greatest increase in Tmax would be in February by 0.64–0.83°C (1.84–2.39°C) in the near and 0.96–1.24°C (4.05–5.26°C) in the far future for RCP4.5 (RCP8.5), while relatively less increase in the June–August (Figures 10A,B). However, a higher increase in Tmax will be in the far period than in the near for both RCPs.
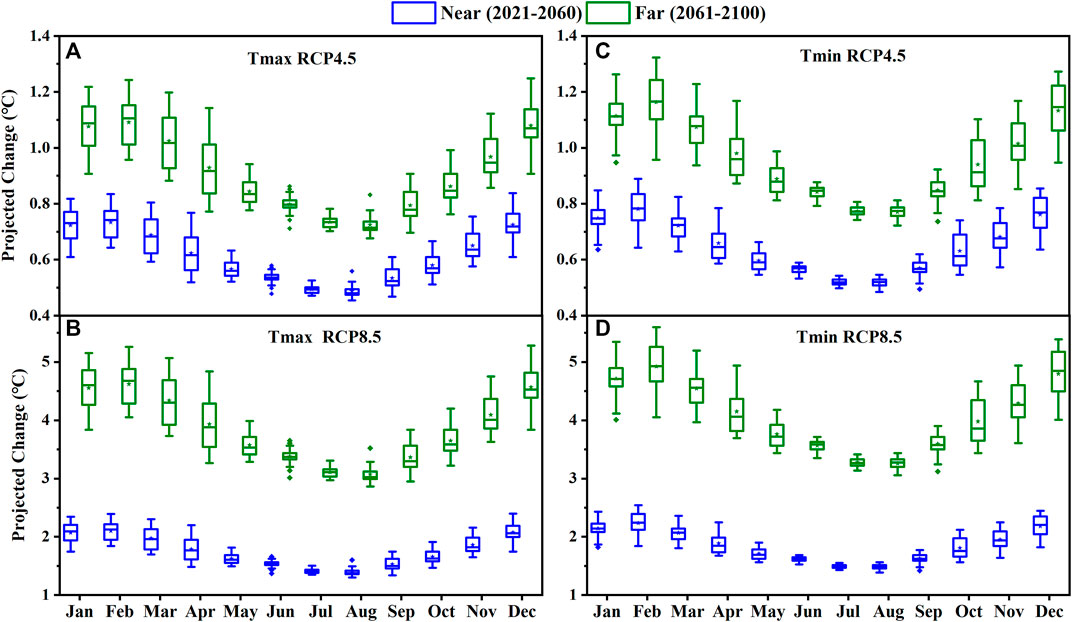
FIGURE 10. Projected change in average monthly Tmax (°C) and Tmin (°C) for near (2021–2060) and far (2061–2100) future periods over Bangladesh for RCP4.5 and RCP8.5. (A) Tmax RCP4.5, (B) Tmax RCP8.5, (C) Tmin RCP4.5, and (D) Tmin RCP8.5.
The annual Tmax over Bangladesh was predicted to rise under RCP4.5 by 0.55–0.68°C (1.58–1.98°C) in the near future with an average of 0.61°C (1.75°C) and 0.81–1.02°C (3.47–4.31°C) in the far future with an average of 0.91°C (3.85°C) (RCP8.5) (Figures 11A,B; Table 2). However, on a seasonal timescale, winter displayed the greatest rise in projected Tmax and monsoon showed the least for both periods and RCPs. The highest increase in Tmax was projected in winter, 0.62–0.83°C (1.78–2.37°C) with an average of 0.73°C (2.08°C) in the near period and 0.92°C–1.23°C (3.90°C–5.21°C) with an average of 1.08°C (4.58°C) in far future for RCP4.5 (RCP8.5). In contrast, the least increase in Tmax was projected in monsoon, 0.49–0.55°C (1.40°C–1.57°C) in the near future with a mean of 0.51°C (1.47°C) and 0.73–0.82°C (3.07–3.45°C) with a mean of 0.76°C (3.23°C) in far future for RCP4.5 (RCP8.5) (Figures 11A,B; Table 2).
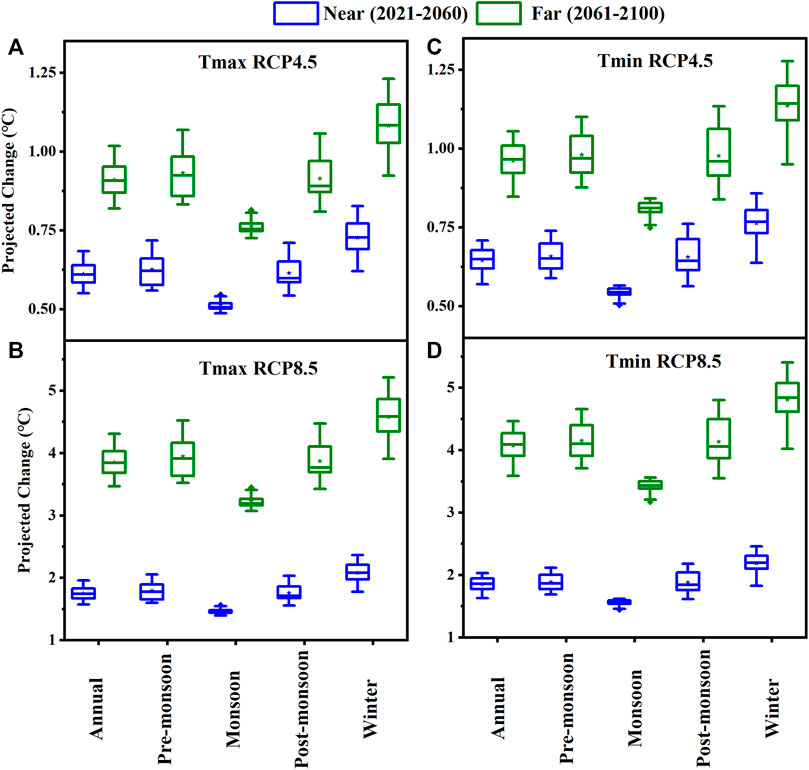
FIGURE 11. Projected change in annual and seasonal temperature for near (2021–2060) and far (2061–2100) future periods in Bangladesh for RCP4.5 and RCP8.5. (A) Tmax RCP4.5, (B) Tmax RCP8.5, (C) Tmin RCP4.5, and (D) Tmin RCP8.5.
The spatial distribution of projected annual and seasonal Tmax changes is exhibited in Figure 12. It shows the degree of the Tmax change varies greatly across Bangladesh for both futures and RCPs. A noticeable increase in annual Tmax was detected at the Rangpur, in the north, for RCP4.5. In contrast, the rising Tmax area was extended from the central, northern, and western regions except for Dinajpur (extreme northwestern part) for RCP8.5. An analogous to the annual spatial pattern was observed for the monsoon season for both periods and RCPs. The pre-monsoon season showed a higher increase at the Rajshahi, Rangpur, Bogura, Ishwardi, and Jessore stations in northwestern and western regions. Overall, the winter exhibited the highest Tmax increase for both periods and RCPs. A higher increase in winter Tmax was also observed over the whole of Bangladesh, except in the extreme northwest and some parts of the south and southeast. The projected changes in annual and seasonal Tmax were higher in the central, northern, and western regions and lesser in the extreme northwest (Dinajpur) and some parts in the south and southeast.
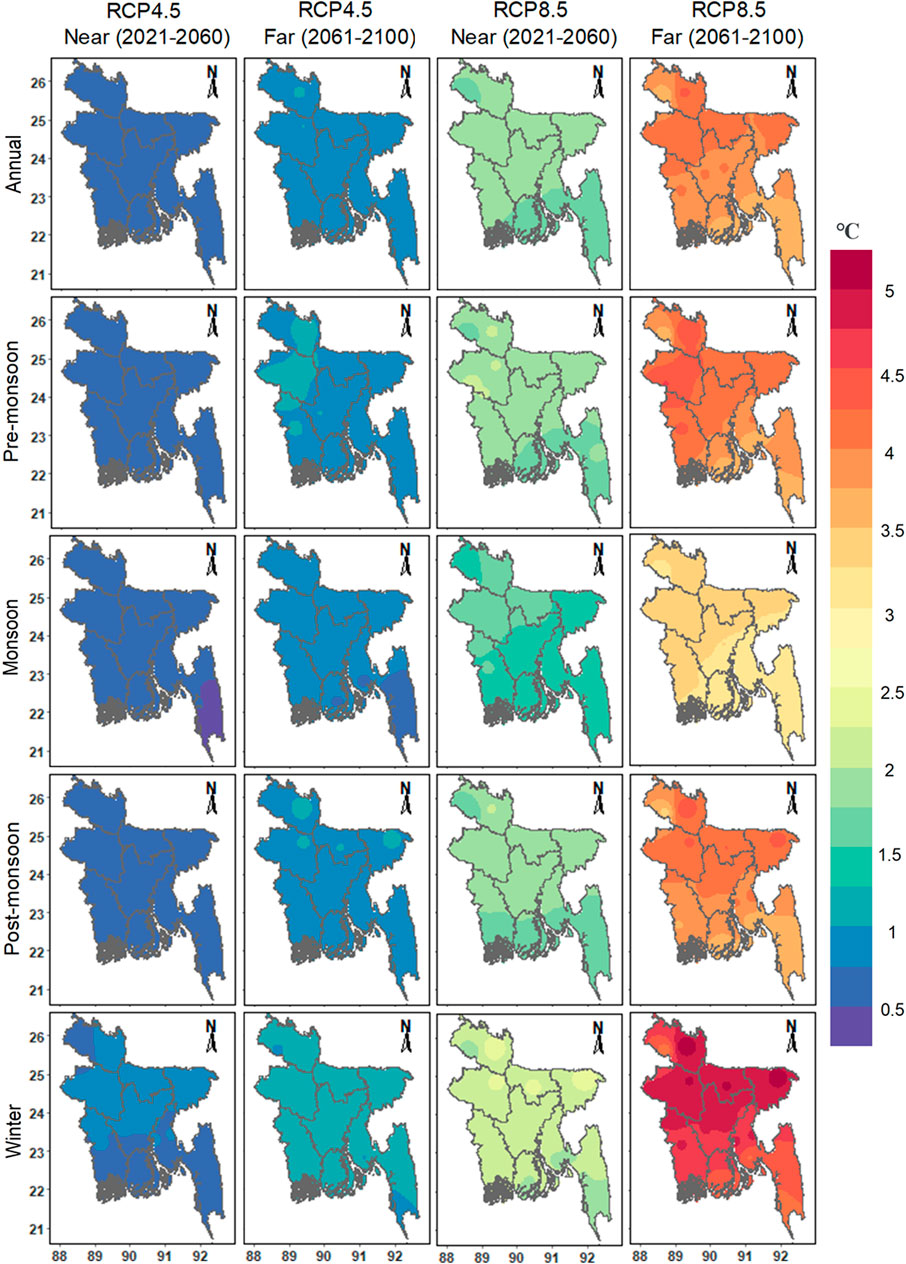
FIGURE 12. Spatial distribution of projected change in annual and seasonal Tmax (°C) for near (2021–2060) and far (2061–2100) future periods in Bangladesh for RCP4.5.
3.5 Future projected Tmin variability and change
Figure 13 exhibits the average monthly and seasonal Tmin variability across Bangladesh for the near and far futures for RCP4.5 (black) and RCP8.5 (red). The figure shows that the projected Tmin in January, February, and December vary from 15°C to 20°C for RCP4.5 while 16°C–25°C for RCP8.5 in both periods (Figures 13A, B, L). The projected Tmin would be higher during May-September and reach 23°C–27°C for RCP4.5 while 24°C–31°C for RCP8.5 (Figures 13E–I). During the seasonal transitional months of March-April and October-November, the Tmin would fluctuate from 19°C to 24.5°C for RCP4.5, while it will remain between 20°C and 31°C for RCP8.5 (Figures 13C,D,J,K).
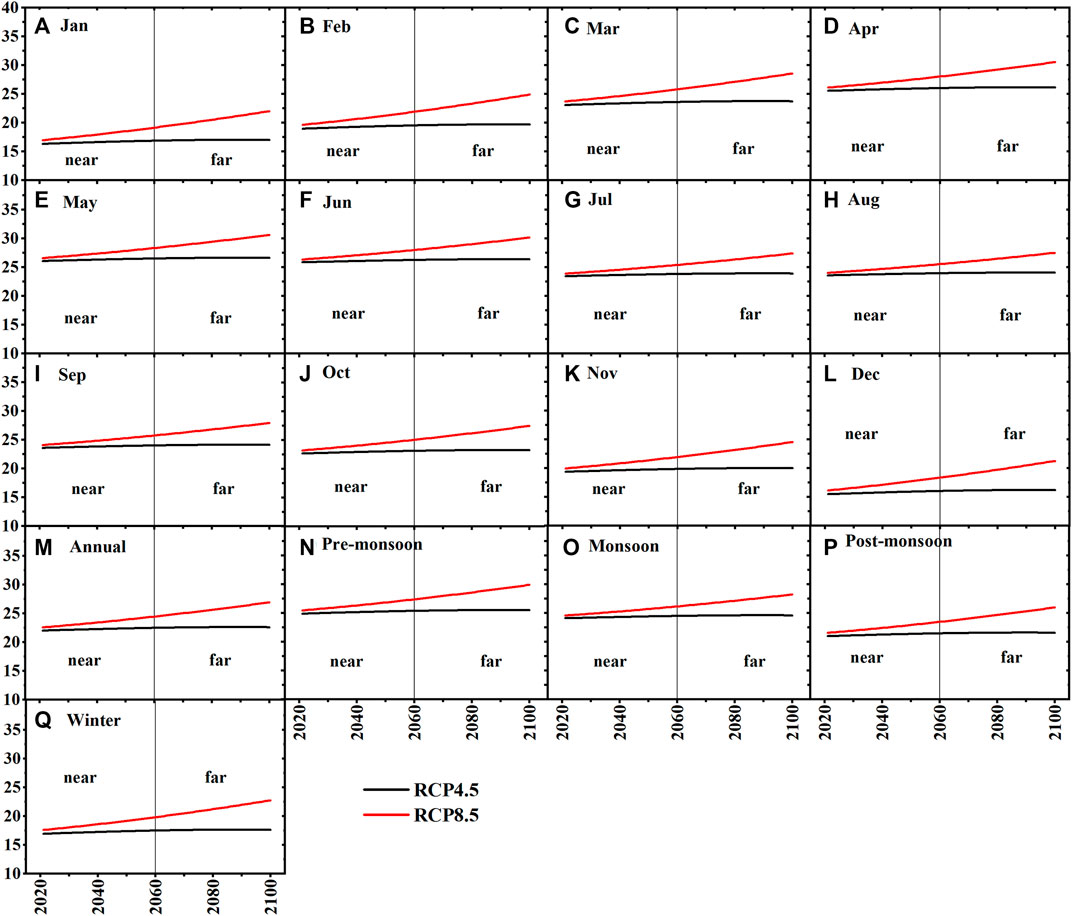
FIGURE 13. Monthly, Annual and Seasonal Tmin (oC) variability of multi-model ensemble (MME) of CMIP5 dataset under RCP4.5 and RCP8.5 for the near and far periods in Bangladesh. (A) January, (B) February, (C) March, (D) April, (E) May, (F) June, (G) July, (H) August, (I) September, (J) October, (K) November, (L) December, (M) Annual, (N) Pre-monsoon, (O) Monsoon, (P) Post-monsoon, and (Q) Winter.
The projected mean annual Tmin ranges from 22°C to 22.60°C for RCP4.5, while between 22.5°C and 27°C for RCP8.5 for both periods (Figure 13M). The variability of Tmin showed a gradual decrease from the pre-monsoon to the winter season (Figures 13N–Q). The projected Tmin in the pre-monsoon was 24.5°C–30°C. It would decrease to 24°C–28.5°C and 21°C–26°C in monsoon and post-monsoon, respectively, for both periods and RCPs. The projected Tmin in winter was between 16.5°C and 23°C for both periods and RCPs. The results revealed higher deviation in monthly, annual, and seasonal Tmin than Tmax between RCPs.
The projected changes in average monthly Tmin for the near and far future for RCP4.5 and RCP8.5 are demonstrated in Figures 10C,D, respectively. The projected monthly Tmin showed a rise in all months for both periods and RCPs. The highest rise in Tmin was projected for February by 0.64–0.89°C (1.84°C–2.55°C) in the near future, with a mean of 0.78°C (2.24°C) and 0.96°C–1.32°C (4.05°C–5.60°C) in far future, with a mean of 1.16°C (4.92°C) for RCP4.5 (RCP8.5). In contrast, a relatively less increase in Tmin was projected for June–August (Figures 10C,D; Table 2). Nevertheless, Tmin was projected to rise higher in the far future than near future for both RCPs.
RCP4.5 projected an increase in annual Tmin over Bangladesh by 0.57–0.71°C (1.63°C–2.03°C), with an average of 0.65°C (1.85°C), in the near future, and by 0.85–1.06°C (3.59°C–4.46°C), with an average of 0.96°C (4.07°C), in the far future (RCP8.5) (Figures 11C,D; Table 2). Nevertheless, on a seasonal timescale, winter exhibited the highest increase in Tmin and monsoon revealed the lowest for both periods and RCPs. The projected incrase in winter Tmin was 0.64–0.86°C (1.83°C–2.46°C) with an average of 0.76°C (2.19°C) in the near period, and 0.95°C–1.28°C (4.02°C–5.41°C) with an average of 1.14°C (4.781°C) in the far future for RCP4.5 (RCP8.5). Conversely, the monsoon Tmin was projected to rise the least, 0.50–0.56°C (1.44°C–1.62°C) with a mean of 0.54°C (1.56°C) in the near future and 0.75–0.84°C (3.17°C–3.56°C) with a mean of 0.81°C (3.42°C) in far future for RCP4.5 (RCP8.5) (Figures 11C,D; Table 2).
The spatial patterns of projected changes in annual and seasonal Tmin are presented in Figure 14. For both periods and scenarios, an increase in Tmin was observed for all annual and seasonal timescales over Bangladesh. The higher annual Tmin rise was projected in northeastern, northern, and northwestern parts of Bangladesh for both periods and RCPs. The higher increase in pre-monsoon and post-monsoon Tmin was projected in Srimongal, Sylhet, Mymensingh Bogura, and Rajshahi in northeastern, northern, and northwestern Bangladesh. The higher rise in winter Tmin was projected in Dhaka, Faridpur, Madaripur, Srimongal, Sylhet, Mymensingh, and Rangpur in the central, northern, and northeastern regions of Bangladesh. Among the seasons, the winter exhibited the highest increase in Tmin, particularly in the region extending from the west to north and northeast. The study also showed a relatively lower increase in Tmin in the extreme northwest, middle south, and southeast while higher in the middle, north, and west of Bangladesh.
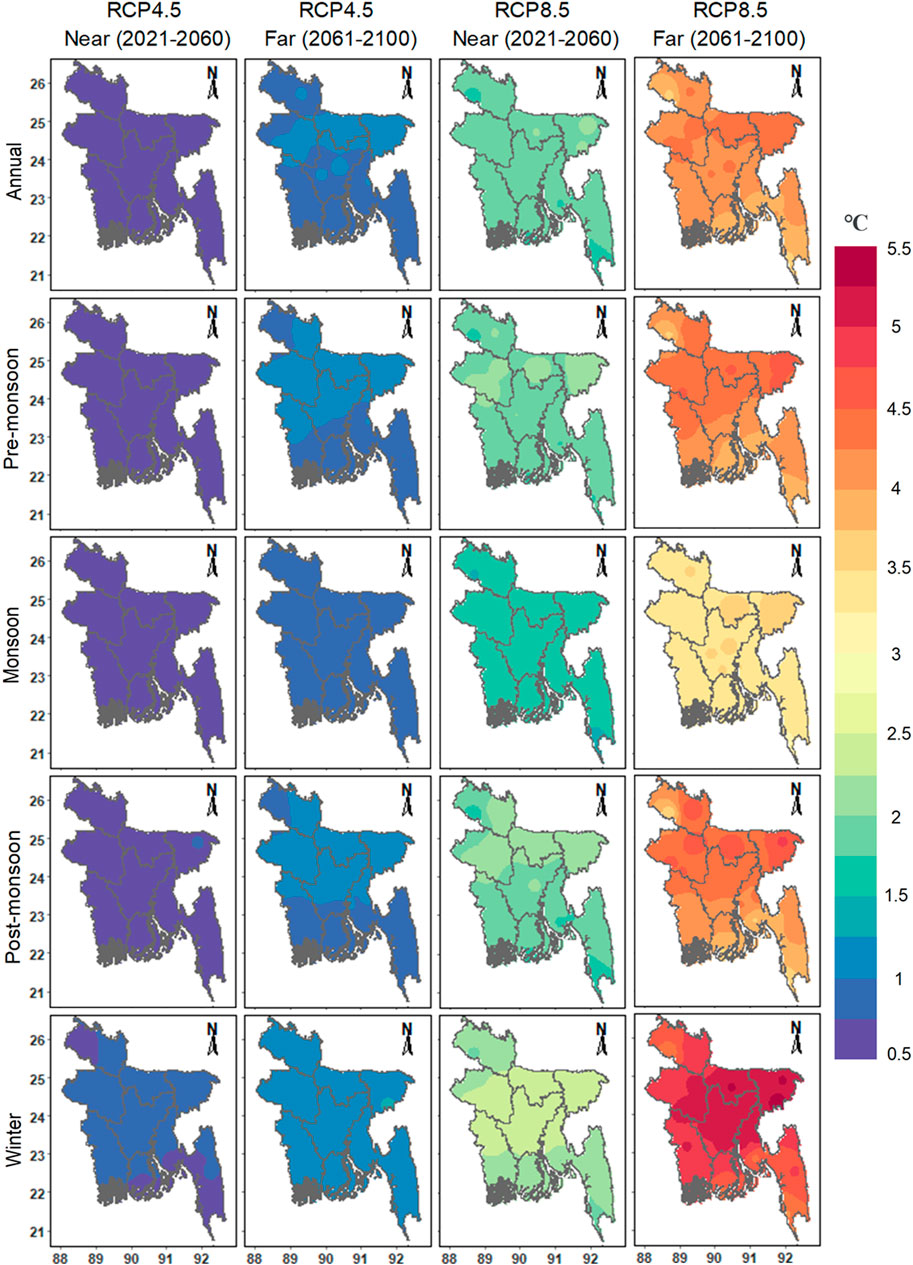
FIGURE 14. Spatial distribution of projected change in annual and seasonal Tmin (°C) for near (2021–2060) and far (2061–2100) future periods in Bangladesh for RCP8.5.
4 Discussion
4.1 Reproducibility of CMIP5 models
The ability of models to generate the “present climate” is a critical aspect of GCM projections (Yang et al., 2019). This study used SimCLIM 4.0 for Tmax and Tmin projection of Bangladesh for two RCPs using MME of 40 GCMs (4.5 and 8.5). SimCLIM has been widely used for temperature projection at higher resolution and better accuracy in various temporal and geographical scales around the world, including Bangladesh (Amin et al., 2018a; b; Rahman and Rob, 2019; Zheng et al., 2020; Wang et al., 2021). Though some underestimations and overestimations of CMIP5 MME were observed in this study, overall, it showed satisfactory performance in reproducing observed Tmax and Tmin. In this study, SimCLIM model projection showed a cold bias in Tmax, but a warm bias in Tmin. Tmax seems to have a greater cold bias in the winter and pre-monsoon months than in monsoon or post-monsoon months, whereas Tmin has a warm bias in the winter and pre-monsoon months than in monsoon or post-monsoon months. This finding almost coincided with the results of Chotamonsak et al. (2011) in Southeast Asia employed a WRF RCM (regional climate model). They found a higher cold bias in the cool-dry season (Nov–Feb) than the hot-dry (Mar–Apr) and rainy seasons (May–Oct), where Tmin showed a weaker warm bias in the cool-dry season (Nov–Feb) than the hot-dry (Mar–Apr) and rainy seasons (May–Oct). Some studies also identified cold bias for Tmax or annual mean temperature in Bangladesh using CMIP5 MME (Pattnayak et al., 2017; Kamruzzaman et al., 2021a). Moreover, biases in GCMs are primarily attributed to the global energy balance amongst different physical mechanisms or processes used for modeling, such as radiative mechanisms like cloud and surface albedo effect as well as non-radiative mechanisms like surface turbulent fluxes and large-scale atmospheric oscillation (IPCC 2007; Yang and Rong-Cai, 2015; Pattnayak et al., 2017). However, the origins of biases are not the goal of this research and, therefore, not investigated.
4.2 Spatiotemporal trends in temperature (Tmax and Tmin) projection
The present study showed increasing trends in monthly, annual and seasonal Tmax and Tmin in both the future periods and scenarios. The study revealed that Bangladesh’s seasonal warming is substantially quicker than the global average, nearly 2–3 times higher in hot and humid summer seasons. Even seasonal warming in Bangladesh is much quicker than in India (Kothawale et al., 2010; Rahman and Lateh, 2016). The study indicates that the country may experience higher annual and seasonal temperature trends in the future. A sharp rise in Tmax and Tmin may negatively influence irrigation timing and planning, evapotranspiration, soil moisture availability and mineralization. As a result, higher irrigation rates will be needed in future, causing greater groundwater level depletion in many areas of the country (Mainuddin et al., 2022). Higher temperatures will cause increased carbon loss from soil (Hossain et al., 2017) and, thus, depletion of soil organic matter. As soil organic matter is soil’s bloodline, its depletion will reduce soil productivity if corrective measures are not taken. Besides, high temperature is most likely to reduce rice production, the dominant food crop in Bangladesh, yield by 0%–61% depending on the country’s seasonal temperature rise and locations (Hossain et al., 2021). To counter the deleterious effects, integrated nutrient management (Naher et al., 2020) and the use of recalcitrant organic material (Hossain et al., 2017) and efficient water management (Hossain et al., 2021) will be needed. It might ultimately raise agricultural production costs and impede the government’s poverty reduction goal.
4.3 Spatiotemporal temperature (Tmax and Tmin) variability and change
The projected Tmax and Tmin temperature variability is a useful indicator of providing information on how much temperature will rise in future. The mean annual Tmax and Tmin range estimated in this study are similar to other studies (Hasan et al., 2013; 2018; Alamgir et al., 2019). Hasan et al. (2018) reported an increase in average annual Tmax from 31.5°C to 32°C for RCP4.5 and 32.5°C–34°C for RCP8.5 over Bangladesh, which is slightly higher or lower than that found in this study. They also reported a rise in mean Tmin above 23°C in 2100 for RCP4.5 and 24.5°C–26.5°C during the 2080s for RCP8.5 using five bias-corrected CMIP5 models. It is nearly analogous to the finding of the present study.
This study projected an increase in mean annual Tmax in Bangladesh by 0.61°C (1.75°C) in the near period and 0.91°C (3.85°C) in the far for RCP4.5 (RCP8.5). The mean annual Tmin is projected to rise by 0.65°C (1.85°C) in the near period while 0.96°C (4.07°C) in the far future for RCP4.5 (RCP8.5). A greater increase in Tmax and Tmin is found in the far future, coinciding with the findings of Alamgir et al. (2019). They reported the highest temperature increase (Tmax and Tmin) in northern and the lowest in the southeastern coastal part of Bangladesh using MME of eight CMIP5 models. It differs slightly from this study as this study found higher increases in the western and central regions. One of the key findings of this study was that Tmin changes were greater than Tmax changes, a finding validated by prior research using CMIP5 models (Hasan et al., 2018; Alamgir et al., 2019; Rahman and Rob, 2019). Therefore, it indicates that nighttime temperatures (Tmin) will rise faster than daytime temperatures (Tmax), and eventually, the diurnal temperature range (DTR) will fall. Studies showed that the worldwide average DTR decreased significantly between 1950 and 1990 (Karl et al., 1991; Easterling et al., 1997). DTR decreases have also been documented in Bangladesh (Shahid et al., 2012; Abdullah et al., 2022) and neighboring India (Roy and Balling, 2005; Jhajharia and Singh 2011). DTR would decline by the existence of urban heat islands, land use changes owing to overpopulation and increased economic activities, and expansion in agricultural areas because of deforestation (Gallo et al., 1996; Bonan, 2001; Abdullah et al., 2022). Alternations in DTR can affect agricultural productivity and human health (Lobell, 2007; Shahid et al., 2012; Peng et al., 2013). Bangladesh might experience reduced rice yields in future as the investigation found that greater nighttime temperatures or lower DTR negatively impact rice yield (Peng et al., 2004). A decline in DTR would also increase human discomfort as greater summer Tmin will not permit the required nocturnal cooling to offset the high Tmax throughout a heatwave period (De et al., 2005; Tam et al., 2009).
The maximum increase in temperature in February and minimum in July and August are not consistent with the findings of Alamgir et al. (2019). The present study revealed that winter will experience the highest increase in Tmax and Tmin, indicating that crops grown in winter will suffer from increased respiratory losses, thus, a reduction in yields is obvious. For example, dry season irrigated rice yield would be decreased by 13%–23% if the temperature rises by 4°C (Maniruzzaman et al., 2018). However, the result of this study agrees with several other studies (Manabe et al., 1991; Chowdhury and Ndiaye, 2017; Rahman and Rob, 2019). Chowdhury and Ndiaye (2017) also reported that the winter temperature (Tmax and Tmin) would increase faster in northern and central regions, which is mostly similar to our study.
The projected monsoon Tmax and Tmin showed a relatively lower increase than in other seasons. Similar to annual and winter, the pre-monsoon and post-monsoon season exhibits greater changes in Tmax and Tmin. Central and northwestern regions were predicted to have the most significant annual and seasonal temperature changes. The northwestern portion of Bangladesh, particularly the Barind region, is considered a drought-prone zone. The annual average rainfall over the region is about 1,400 and 1,550 mm (national average 2,200 mm), with an uneven distribution within the seasons (Shahid and Khairulmaini 2009). Due to the effects of climate change, the spatial distribution of changes in drought characteristics shows that drought-vulnerable areas will expand in the future in the central and southern regions under both RCP4.5 and RCP8.5 scenarios (Kamruzzaman et al., 2019b; 2022). The highest increase in Tmax and Tmin in these regions may be attributable to land use and land cover (LULC) changes, less evaporative cooling and other factors (Shahid, 2011; Islam H. M. T. et al., 2021). Available soil moisture can remove surface heat through evaporation, but if the land is dry, there is no opportunity to transport it away, which increases the local temperature. However, a large increase in temperature might lead to an increase in rainfall through more evaporation. A number of studies also reported increasing rainfall in these regions (Fahad et al., 2018; Pour et al., 2018; Kamruzzaman et al., 2019b; Karim et al., 2020; Das et al., 2022b; Islam et al., 2022). Extreme rainfall events may increase with the increase in mean rainfall. This might result in higher flood risks, soil erosion, and crop loss (IPCC, 2014).
The MME projected a sharp temperature increase in all timescales over Bangladesh. It is very crucial to be aware of anthropogenic impacts on CC for sustainable development. Population growth, uncontrolled energy consumption, unplanned industrialization and urbanization, growing transportation, and LULC changes might increase GHG emissions in Bangladesh in the future. It eventually may cause a further rise in temperature. Therefore, it is required to investigate the variability and change in the driving factors of GHG emissions and temperature increase in Bangladesh to understand future temperature rise-induced consequences in Bangladesh. This will contribute to developing effective financial, environmental, and CC adaptation planning and mitigation strategies at the local and national levels.
Future studies should consider climatic hot spot areas of Bangladesh in the near future. Besides, future studies should consider high-resolution CMIP6 climate methods. The direct utilization of the climate model outputs is not suggested for decision-making research at a finer scale. Thus, the scientific community depends on multi-ensemble downscaling tools (e.g., SimCLIM model), which could further include uncertainty under specific scenarios. With the introduction of CMIP6 GCMs, an analogous evaluation can be done to obtain a better insight into the temperature projections of Bangladesh. Higher-resolution projections of temperature would also help to understand the complicated atmospheric processes.
5 Conclusion
The spatiotemporal patterns in future temperature (Tmax and Tmin) variabilities over Bangladesh in monthly, seasonal and yearlyscales were examined in this study. A single GCM is insufficient for understanding CC in any region. Hence, multi-model ensembles (MME) were employed in this study to better assess temperature changes. In contrast to early studies, the present study adopted the median of 40-model CMIP5 GCMs to generate an MME. The key findings can be outlined as.
• Temperature for all timescales exhibited increasing trends in both future periods and RCPs. The SS estimator revealed a greater Tmax and Tmin rise in the near future than in the far future for RCP4.5, while the opposite for RCP8.5.
• The projected Tmax and Tmin revealed a higher increase in February and a lower increase in July and August.
• winter would experience the highest increase in Tmax and Tmin among the seasons for both future periods and RCPs.
• A higher increase in Tmin than Tmax for all timescales would cause a decrease in DTR in future, indicating a faster rise in nighttime temperature (Tmin) than the daytime temperature (Tmax).
The results of this study can support determining CC adaptation or mitigation strategies in Bangladesh. The study can be repeated with recently released CMIP6 GCMs to update the projections for the new scenarios. Besides, the projected changes in temperature extremes can be evaluated in a future study.
Data availability statement
The raw data supporting the conclusions of this article will be made available by the authors, without undue reservation.
Author contributions
HI: Formal analysis; visualization; writing—original draft. MK: Data curation; software; supervision; writing—review and editing. SS: Writing—review and editing. MM: Writing—review and editing. EA: writing—review and editing; AI: Supervision; JB: Writing—review, and editing. MI–review and editing.
Funding
The research was supported by a research grant from the Bangladesh Rice Research Institute (BRRI) under the project name: “Strengthening Farm Machinery Research Activity for Mechanized Rice Cultivation”; Project Code: 224298400, Ministry of Agriculture, Bangladesh. This study was undertaken with the financial help from a research project (CRP-II, 2ndPhase) of Krishi Gobeshona Foundation (KGF). The authors gratefully appreciate KGF for the help.
Conflict of interest
The authors declare that the research was conducted in the absence of any commercial or financial relationships that could be construed as a potential conflict of interest.
Publisher’s note
All claims expressed in this article are solely those of the authors and do not necessarily represent those of their affiliated organizations, or those of the publisher, the editors and the reviewers. Any product that may be evaluated in this article, or claim that may be made by its manufacturer, is not guaranteed or endorsed by the publisher.
References
Abdullah, A. Y. M., Bhuian, M. H., Kiselev, G., Dewan, A., Hassan, Q. K., and Rafiuddin, M. (2022). Extreme temperature and rainfall events in Bangladesh: A comparison between coastal and inland areas. Int. J. Climatol. 42, 3253–3273. doi:10.1002/joc.6911
Alamgir, M., Ahmed, K., Homsi, R., Dewan, A., Wang, J. J., and Shahid, S. (2019). Downscaling and projection of spatiotemporal changes in temperature of Bangladesh. Earth Syst. Environ. 3, 381–398. doi:10.1007/s41748-019-00121-0
Alamgir, M., Shahid, S., Hazarika, M. K., Nashrrullah, S., Harun, S. B., Shamsudin, S., et al. (2015). Analysis of meteorological drought pattern during different climatic and cropping seasons in Bangladesh. ’ J. Amer Water Resour. Assoc. 51, 794–806. doi:10.1111/jawr.12276
Ali, S., Kiani, R. S., Reboita, M. S., Dan, L., Eum, H., Cho, J., et al. (2021). Identifying hotspots cities vulnerable to climate change in Pakistan under CMIP5 climate projections. Int. J. Climatol. 41, 559–581. doi:10.1002/joc.6638
Allen, C. D., Macalady, A. K., Chenchouni, H., Bachelet, D., McDowell, N., Vennetier, M., et al. (2010). A global overview of drought and heat-induced tree mortality reveals emerging climate change risks for forests. For Ecol Manage 259, 660–684. doi:10.1016/j.foreco.2009.09.001
Almazroui, M., Islam, M. N., Alkhalaf, A. K., Saeed, F., Dambul, R., and Rahman, M. A. (2016). Simulation of temperature and precipitation climatology for the CORDEX-MENA/Arab domain using RegCM4. Arabian J. Geosciences 9, 13. doi:10.1007/s12517-015-2045-7
Almazroui, M., Khalid, M. S., Islam, M. N., and Saeed, S. (2020a). Seasonal and regional changes in temperature projections over the Arabian Peninsula based on the CMIP5 multi-model ensemble dataset. Atmos. Res. 239, 104913. doi:10.1016/j.atmosres.2020.104913
Almazroui, M., Saeed, S., Saeed, F., Islam, M. N., and Ismail, M. (2020b). Projections of precipitation and temperature over the south asian countries in CMIP6. Earth Syst. Environ. 4, 297–320. doi:10.1007/s41748-020-00157-7
Amin, A., Nasim, W., Fahad, S., Ali, S., Ahmad, S., Rasool, A., et al. (2018a). Evaluation and analysis of temperature for historical (1996–2015) and projected (2030–2060) climates in Pakistan using SimCLIM climate model: Ensemble application. Atmos. Res. 213, 422–436. doi:10.1016/j.atmosres.2018.06.021
Amin, A., Nasim, W., Mubeen, M., Sarwar, S., Urich, P., Ahmad, A., et al. (2018b). Regional climate assessment of precipitation and temperature in Southern Punjab (Pakistan) using SimCLIM climate model for different temporal scales. Theor. Appl. Climatol. 131, 121–131. doi:10.1007/s00704-016-1960-1
BMD (2020). Bangladesh climate data portal. Agargoan, Dhaka: Government of Bangladesh. Available at: http://bmd.wowspace.org/team/homex.php (Accessed January 10, 2021).
Bonan, G. B. (2001). Observational evidence for reduction of daily maximum temperature by Croplands in the Midwest United States. J. Clim. 14, 2430–2442. doi:10.1175/1520-0442(2001)014<2430:oefrod>2.0.co;2
Bosu, H., Rashid, T., Mannan, A., and Meandad, J. (2021). Climate change analysis for Bangladesh using CMIP5 models. Dhaka Univ. J. Earth Environ. Sci. 9, 1–12. doi:10.3329/dujees.v9i1.54856
Chotamonsak, C., Salathé, E. P., Kreasuwan, J., Chantara, S., and Siriwitayakorn, K. (2011). Projected climate change over Southeast Asia simulated using a WRF regional climate model. Atmos. Sci. Lett. 12, 213–219. doi:10.1002/asl.313
Chowdhury, M. R., and Ndiaye, O. (2017) Climate change and variability impacts on the forests of Bangladesh—a diagnostic discussion based on CMIP5 GCMs and ENSO, ’’Int. J. Climatol. 37:4768–4782. doi:10.1002/joc.5120
Daly, C. (2006). Guidelines for assessing the suitability of spatial climate data sets. Int. J. Climatol. 26 (6), 707–721. doi:10.1002/joc.1322
Das, S., Islam, A., and Kamruzzaman, M. (2022a). Assessment of climate change impact on temperature extremes in a tropical region with the climate projections from CMIP6 model. Clim. Dyn. doi:10.1007/S00382-022-06416-9
Das, S., Kamruzzaman, M., and Islam, A. (2022b). Assessment of characteristic changes of regional estimation of extreme rainfall under climate change: A case study in a tropical monsoon region with the climate projections from CMIP6 model. J. Hydrol. (Amst) 610, 128002. doi:10.1016/J.JHYDROL.2022.128002
De, U. S., Dube, R. K., Rao, G. S. P., and Easterling, D. R. (2005). Extreme weather events over India in the last 100 years. J. Indian Geophys. UnionScience 9, 277.
Easterling, D. R., Horton, B., Jones, P. D., Peterson, T. C., Karl, T. R., Parker, D. E., et al. (1997). Maximum and minimum temperature trends for the globe. Science 277 (5324), 364–367. doi:10.1126/science.277.5324.364
Fahad, M. G. R., Saiful Islam, A. K. M., Nazari, R., Alfi Hasan, M., Tarekul Islam, G. M., and Bala, S. K. (2018). Regional changes of precipitation and temperature over Bangladesh using bias-corrected multi-model ensemble projections considering high-emission pathways. Int. J. Climatol. 38, 1634–1648. doi:10.1002/joc.5284
Gallo, K. P., Easterling, D. R., and Peterson, T. C. (1996). The influence of land use/land cover on climatological values of the diurnal temperature range. J. Clim. 9, 2941–2944. doi:10.1175/1520-0442(1996)009<2941:tioluc>2.0.co;2
Hasan, M. A., Hasan, M. A., and Islam, A. K. M. S. (2013). “Changes of seasonal temperature extremes in future over Bangladesh using projections by a regional climate model high end climate impact and extremes (HELIX) view project STARS project view project changes of seasonal temperature extremes in future over Bangladesh using projections by a regional climate model,” in Proceeding of the National Seminar on Climate Change Impact and Adaptation Center for Climate Change and Sustainability Research (3CSR).
Hasan, M. A., Islam, A. K. M. S., and Akanda, A. S. (2018). Climate projections and extremes in dynamically downscaled CMIP5 model outputs over the bengal delta: A quartile based bias-correction approach with new gridded data. Clim. Dyn. 51, 2169–2190. doi:10.1007/s00382-017-4006-1
Hossain, M. B., Rahman, M. M., Biswas, J. C., Miah, M. M. U., Akhter, S., Maniruzzaman, M., et al. (2017). Carbon mineralization and carbon dioxide emission from organic matter added soil under different temperature regimes. Int. J. Recycl. Org. Waste Agric. 6, 311–319. doi:10.1007/s40093-017-0179-1
Hossain, M. B., Roy, D., Maniruzzaman, M., Biswas, J. C., Naher, U. A., Haque, M. M., et al. (2021). Response of crop water requirement and yield of irrigated rice to elevated temperature in Bangladesh. Int. J. Agron. 2021, 1–11. doi:10.1155/2021/9963201
IPCC (2007). “Technical summary of climate change 2007: The physical science basis,” in Contribution of working group I to the fourth assessment report of the intergovernmental panel on climate change.
IPPC (2014). IPCC, 2014: Climate change 2014: Mitigation of climate change. Contribution of working group III to the fifth assessment report of the intergovernmental panel on climate change.
Islam, A. R. M. T., Islam, H. M. T., Shahid, S., Khatun, M. K., Ali, M. M., Rahman, M., et al. (2021). Spatiotemporal nexus between vegetation change and extreme climatic indices and their possible causes of change. J. Environ. Manage 289, 112505. doi:10.1016/j.jenvman.2021.112505
Islam, H. M. T., Islam, A., Abdullah-Al-Mahbub, M., Shahid, S., Tasnuva, A., Kamruzzaman, M., et al. (2021). Spatiotemporal changes and modulations of extreme climatic indices in monsoon-dominated climate region linkage with large-scale atmospheric oscillation. Atmos. Res. 264, 105840. doi:10.1016/J.ATMOSRES.2021.105840
Islam, H. M. T., Islam, A. R. M. T., Shahid, S., Alam, G. M. M., Biswas, J. C., Rahman, M. M., et al. (2022). Future precipitation projection in Bangladesh using SimCLIM climate model: A multi-model ensemble approach. Int. J. Climatol. 42, 6716–6740. doi:10.1002/joc.7605
Jerin, J. N., Islam, H. M. T., Islam, A. M. R. T., Shahid, S., Hu, Z., Badhan, M. A., et al. (2021). Spatiotemporal trends in reference evapotranspiration and its driving factors in Bangladesh. Theor. Appl. Climatol. 144, 793–808. doi:10.1007/s00704-021-03566-4
Jhajharia, D., and Singh, V. P. (2011). Trends in temperature, diurnal temperature range and sunshine duration in Northeast India. Int. J. Climatol. 31, 1353–1367. doi:10.1002/joc.2164
Kamruzzaman, M., Almazroui, M., Salam, M. A., Mondol, M. A. H., Rahman, M. M., Deb, L., et al. (2022). Spatiotemporal drought analysis in Bangladesh using the standardized precipitation index (SPI) and standardized precipitation evapotranspiration index (SPEI). Sci. Rep. 12, 20694. doi:10.1038/s41598-022-24146-0
Kamruzzaman, M., Hwang, S., Cho, J., Jang, M. W., and Jeong, H. (2019a). Evaluating the spatiotemporal characteristics of agricultural drought in Bangladesh using effective drought index. WaterSwitzerl. 11, 2437. doi:10.3390/W11122437
Kamruzzaman, M., Jang, M-W. W., Cho, J., and Hwang, S. (2019b). Future changes in precipitation and drought characteristics over Bangladesh under CMIP5 climatological projections. Water 11, 2219. doi:10.3390/w11112219
Kamruzzaman, M., Shahid, S., Islam, A. T., Hwang, S., Cho, J., et al. (2021a). Comparison of CMIP6 and CMIP5 model performance in simulating historical precipitation and temperature in Bangladesh: A preliminary study. Theor. Appl. Climatol. 145, 1385–1406. doi:10.1007/s00704-021-03691-0
Kamruzzaman, M., Shahid, S., Roy, D. K., Islam, A. R. M. T., Hwang, S., Cho, J., et al. (2021b). Assessment of CMIP6 global climate models in reconstructing rainfall climatology of Bangladesh. Int. J. Climatol. n/a 42, 3928–3953. doi:10.1002/joc.7452
Karim, F., Mainuddin, M., Hasan, M., and Kirby, M. (2020). Assessing the potential impacts of climate changes on rainfall and evapotranspiration in the northwest region of Bangladesh. Climate 8, 94. doi:10.3390/CLI8080094
Karl, T. R., Kukla, G., Razuvayev, V. N., Changery, M. J., Quayle, R. G., Heim, R. R., et al. (1991). Global warming: Evidence for asymmetric diurnal temperature change. Geophys Res. Lett. 18, 2253–2256. doi:10.1029/91GL02900
Katzenberger, A., Schewe, J., Pongratz, J., and Levermann, A. (2021). Robust increase of Indian monsoon rainfall and its variability under future warming in CMIP6 models. Earth Syst. Dyn. 12, 367–386. doi:10.5194/esd-12-367-2021
King, A. D., Knutti, R., Uhe, P., Mitchell, D. M., Lewis, S. C., Arblaster, J. M., et al. (2018). On the linearity of local and regional temperature changes from 1.5°C to 2°C of global warming. J. Clim. 31, 7495–7514. doi:10.1175/JCLI-D-17-0649.1
Kothawale, D. R., Munot, A. A., and Kumar, K. K. (2010). Surface air temperature variability over India during 1901-2007, and its association with enso. Clim. Res. 42, 89–104. doi:10.3354/cr00857
Kumar, P., and Sarthi, P. P. (2019). Surface temperature evaluation and future projections over India using CMIP5 models. Pure Appl. Geophys 176, 5177–5201. doi:10.1007/s00024-019-02203-6
Lobell, D. B. (2007). Changes in diurnal temperature range and national cereal yields. Agric For Meteorol 145, 229–238. doi:10.1016/j.agrformet.2007.05.002
Mainuddin, M., Peña-Arancibia, J. L., Karim, F., Hasan, M. M., Mojid, M. A., and Kirby, J. M. (2022). Long-term spatio-temporal variability and trends in rainfall and temperature extremes and their potential risk to rice production in Bangladesh. PLOS Clim. 1, e0000009. doi:10.1371/journal.pclm.0000009
Mallick, J., Islam, A. R. M. T., Ghose, B., Islam, H. M. T., Rana, Y., Hu, Z., et al. (2022a). Spatiotemporal trends of temperature extremes in Bangladesh under changing climate using multi-statistical techniques. Theor. Appl. Climatol. 147, 307–324. doi:10.1007/s00704-021-03828-1
Mallick, J., Salam, R., Islam, H. M. T., Shahid, S., Kamruzzaman, M., Pal, S. C., et al. (2022b). Recent changes in temperature extremes in subtropical climate region and the role of large-scale atmospheric oscillation patterns. Theor. Appl. Climatol. 148, 329–347. doi:10.1007/s00704-021-03914-4
Manabe, S., Stouffer, R. J., Spelman, M. J., and Bryan, K. (1991). Transient responses of a coupled ocean–atmosphere model to gradual changes of atmospheric CO2. Part I. Annual mean response. J. Clim. 4, 785–818. doi:10.1175/1520-0442(1991)004<0785:troaco>2.0.co;2
Maniruzzaman, M., Biswas, J. C., Hossain, M. B., Haque, M. M., Naher, U. A., Choudhury, A. K., et al. (2018). Effect of elevated air temperature and carbon dioxide levels on dry season irrigated rice productivity in Bangladesh. Am. J. Plant Sci. 09, 1557–1576. doi:10.4236/ajps.2018.97114
Mann, H. B. (1945). Nonparametric tests against trend. Econometrica 13 (3), 245–259. doi:10.2307/1907187
Naher, U. A., Hossain, M. B., Haque, M. M., Maniruzzaman, M., Choudhury, A. K., and Biswas, J. C. (2020). Effect of long-term nutrient management on soil organic carbon sequestration in rice-rice-fallow rotation. Curr. Sci. 118, 587. doi:10.18520/cs/v118/i4/587-592
Novotny, E. v., and Stefan, H. G. (2007). Stream flow in Minnesota: Indicator of climate change. J. Hydrol. (Amst) 334, 319–333. doi:10.1016/j.jhydrol.2006.10.011
Ozturk, T., Turp, M. T., Türkeş, M., and Kurnaz, M. L. (2018). Future projections of temperature and precipitation climatology for CORDEX-MENA domain using RegCM4.4. Atmos. Res. 206, 87–107. doi:10.1016/j.atmosres.2018.02.009
Pattnayak, K. C., Kar, S. C., Dalal, M., and Pattnayak, R. K. (2017). Projections of annual rainfall and surface temperature from CMIP5 models over the BIMSTEC countries. Glob. Planet Change 152, 152–166. doi:10.1016/j.gloplacha.2017.03.005
Peng, S., Huang, J., Sheehy, J. E., Laza, R. C., Visperas, R. M., Zhong, X., et al. (2004). Rice yields decline with higher night temperature from global warming. Proc. Natl. Acad. Sci. U. S. A. 101, 9971–9975. doi:10.1073/pnas.0403720101
Peng, S., Piao, S., Ciais, P., Myneni, R. B., Chen, A., Chevallier, F., et al. (2013). Asymmetric effects of daytime and night-time warming on Northern Hemisphere vegetation. Nature 501, 88–92. doi:10.1038/nature12434
Pérez, J., Correa-Araneda, F., López-Rojo, N., Basaguren, A., and Boyero, L. (2021). Extreme temperature events alter stream ecosystem functioning. Ecol. Indic. 121, 106984. doi:10.1016/j.ecolind.2020.106984
Pour, S. H., Shahid, S., Chung, E. S., and Wang, X. J. (2018). Model output statistics downscaling using support vector machine for the projection of spatial and temporal changes in rainfall of Bangladesh. Atmos. Res. 213, 149–162. doi:10.1016/j.atmosres.2018.06.006
Rahman, M. M., and Rob, M. A. (2019). The use of a CMIP5 climate model to assess regional temperature and precipitation variation due to climate change: A case study of Dhaka megacity, Bangladesh. Earth Syst. Environ. 3, 399–417. doi:10.1007/s41748-019-00117-w
Rahman, M. R., and Lateh, H. (2016). Meteorological drought in Bangladesh: Assessing, analysing and hazard mapping using SPI, GIS and monthly rainfall data. Environ. Earth Sci. 75, 1026. doi:10.1007/s12665-016-5829-5
Rashid, M. M., Beecham, S., and Chowdhury, R. K. (2015). Statistical downscaling of CMIP5 outputs for projecting future changes in rainfall in the Onkaparinga catchment. Sci. Total Environ. 530-531, 171–182. doi:10.1016/j.scitotenv.2015.05.024
Rogelj, J., Meinshausen, M., and Knutti, R. (2012). Global warming under old and new scenarios using IPCC climate sensitivity range estimates. Nat. Clim. Chang. 2, 248–253. doi:10.1038/nclimate1385
Roy, S. S., and Balling, R. C. (2005). Analysis of trends in maximum and minimum temperature, diurnal temperature range, and cloud cover over India. Geophys Res. Lett. 32 (12). doi:10.1029/2004GL022201
Sen, P. K. (1968). Estimates of the regression coefficient based on kendall’s tau. J. Am. Stat. Assoc. 63, 1379–1389. doi:10.1080/01621459.1968.10480934
Shahid, S., Harun, S. B., and Katimon, A. (2012). Changes in diurnal temperature range in Bangladesh during the time period 1961-2008. Atmos. Res. 118, 260–270. doi:10.1016/j.atmosres.2012.07.008
Shahid, S. (2011). Impact of climate change on irrigation water demand of dry season Boro rice in northwest Bangladesh. Clim. Change 105, 433–453. doi:10.1007/s10584-010-9895-5
Shahid, S., and Khairulmaini, O. S. (2009). Spatio-temporal variability of rainfall overBangladesh during the time period 1969-2003. Asia. Pac. J. Atmos. Sci. 43 (3), 375–389.
Song, Y. H., Chung, E. S., and Shahid, S. (2021). Spatiotemporal differences and uncertainties in projections of precipitation and temperature in South Korea from CMIP6 and CMIP5 general circulation models. Int. J. Climatol. 41, 5899–5919. doi:10.1002/joc.7159
Tam, W. W. S., Wong, T. W., Chair, S. Y., and Wong, A. H. S. (2009). Diurnal temperature range and daily cardiovascular mortalities among the elderly in Hong Kong. Arch. Environ. Occup. Health 64, 202–206. doi:10.1080/19338240903241192
Taylor, K. E., Stouffer, R. J., and Meehl, G. A. (2012). An overview of CMIP5 and the experiment design. Bull. Amer. Meteor. Soc. 93 (4), 485–498. doi:10.1175/BAMS-D-11-00094.1
Tobin, C., Nicotina, L., Parlange, M. B., Berne, A., and Rinaldo, A. (2011). Improved interpolation of meteorological forcings for hydrologic applications in a Swiss Alpine region. J. Hydrol. 401 (1-2), 77–89. doi:10.1016/j.jhydrol.2011.02.010
Wang, X., Hou, X., Piao, Y., Feng, A., and Li, Y. (2021). Climate change projections of temperature over the coastal area of China using SimCLIM. Front. Environ. Sci. 9. doi:10.3389/fenvs.2021.782259
Warrick, R., Ashford, G., Kouwenhoven, P., Li, Y., Urich, P., and Ye, W. (2012). Spatial risk-based assessments for climate adaptation using the SimCLIM modelling system: A case study of domestic rainwater harvesting as the sole source of water. J. Water Clim. Change 3, 257–265. doi:10.2166/wcc.2012.003
Warrick, R. A. (2009). “Using SimCLIM for modelling the impacts of climate extremes in a changing climate: A preliminary case study of household water harvesting in Southeast queensland,” in Proceeding of the 18th World IMACS Congress and MODSIM 2009 - International Congress on Modelling and Simulation: Interfacing Modelling and Simulation with Mathematical and Computational Sciences.
Xu, C., and Xu, Y. (2012). The projection of temperature and precipitation over China under RCP scenarios using a CMIP5 multi-model ensemble. Atmos. Oceanic Sci. Lett. 5 (6), 527–533. doi:10.1080/16742834.2012.11447042
Yang, Y., and Rong-Cai, R. (2015). Understanding the global surface-atmosphere energy balance in FGOALS-s2 through an attribution analysis of the global temperature biases. Atmos. Ocean. Sci. Lett. 8, 107–112. doi:10.1080/16742834.2015.11447246
Yang, Y., Bai, L., Wang, B., Wu, J., and Fu, S. (2019). Reliability of the global climate models during 1961–1999 in arid and semiarid regions of China. Sci. Tot. Environ. 667, 271–286. doi:10.1016/j.scitotenv.2019.02.188
Keywords: temperature projection, minimum and maximum temperature, Bangladesh, statistical downscaling, SimCLIM
Citation: Islam HMT, Kamruzzaman M, Shahid S, Mainuddin M, Alam E, Islam ARMT, Biswas JC and Islam MA (2023) Spatiotemporal changes in temperature projections over Bangladesh using multi-model ensemble data. Front. Environ. Sci. 10:1074974. doi: 10.3389/fenvs.2022.1074974
Received: 20 October 2022; Accepted: 19 December 2022;
Published: 06 January 2023.
Edited by:
Shaoquan Liu, Institute of Mountain Hazards and Environment (CAS), ChinaReviewed by:
Daniel Fiifi Tawia Hagan, Nanjing University of Information Science and Technology, ChinaLei Zhang, South China Sea Institute of Oceanology (CAS), China
Copyright © 2023 Islam, Kamruzzaman, Shahid, Mainuddin, Alam, Islam, Biswas and Islam. This is an open-access article distributed under the terms of the Creative Commons Attribution License (CC BY). The use, distribution or reproduction in other forums is permitted, provided the original author(s) and the copyright owner(s) are credited and that the original publication in this journal is cited, in accordance with accepted academic practice. No use, distribution or reproduction is permitted which does not comply with these terms.
*Correspondence: Mohammad Kamruzzaman, milonbrri@gmail.com; Abu Reza Md. Towfiqul Islam, towfiq_dm@brur.ac.bd
†These authors contributed equally to this work and share first authorship
‡ORCID: Mohammad Kamruzzaman, orcid.org/0000-0001-6640-8082