Research on the coupling coordinated development evaluation of China’s provincial technological innovation and financial support based on KGM-MOP
 Qing Yang1
  Xiaohua Wang
- 1School of Safety Science and Emergency Management, Wuhan University of Technology, Wuhan, China
- 2Business School, Ningbo Tech University, Ningbo, China
Technology finance is an important means to support technological innovation, the development level of which is one of the key points of innovation driven strategy in the new era. Based on the correlation-variation coefficient method, we screen the indicators of various provinces in China. An empirical research on technology finance by using the coupling coordinated development evaluation with data of 30 provinces from 2011 to 2020 are carried out. The forecast intervals for next 5 years are predicted with KGM (1, n) grey model. Then we use NSGA-III method to determine the trend of coupling coordinated development of each region in the forecast intervals. The research shows that the indicators of technology finance are industry-oriented, the level of integration of technology and finance across the country is different, to be specific, the East is on the high side, the central part is steady with some opportunities, the West has room for improvement and the Northeast has obvious weaknesses, and the driving force of the coupling coordinated development of technology and finance is limited in sustainability, etc. We propose to strengthen the top-level design and supervision of technology finance, implement accurate measures according to local conditions, and adopt the regional linkage and mutual assistance development mode to help regional efficient and coordinated development.
1 Introduction
The effective combination of technology innovation and financial services is a key means to promote the high-quality development of the world economy. Technology finance is an important measure to promote independent innovation and accelerate industrial transformation and upgrading. Schumpeter (Schumpeter, 1991) expounded the theory of credit creation in his German work theory of economic development, and elaborated the concept of technology finance for the first time.
Scholars at home and abroad have been exploring the development path of technology and finance, and finance is an important factor in improving knowledge productivity (Ang, 2010). A good financial system can improve the success rate of innovation and accelerate economic growth (King and Levine, 1993; Foster et al., 2008). Financial support plays an important role in promoting scientific and technological innovation (Alexandra and Liu, 2014). Financial innovation is conducive to the transfer and dispersion of risks (Beck et al., 2013), but the intensity or efficiency of the effect is divided into regions, stages and enterprises (Zhang et al., 2019a; Zhang et al., 2019b). Kelly and Kim (2018) found that venture capital can effectively increase the R&D expenditure and talent introduction expenditure of the invested enterprises, and the larger the investment scale and the earlier the opportunity, the more it can affect the impact of venture capital on the innovation performance of high-tech industries.
Policy guidance has a profound impact on the integration of technology and finance, Luo et al. (2021) found that government investment can help improve the R&D investment willingness of high-tech industries. Guellec and Potterie (2003) pointed out that financial incentives have a short-term positive impact on corporate R&D, but a negative impact will occur due to the long-term high tax relief. Clausen (Clausen, 2009) found that policy effects are heterogeneous, with government subsidies having stronger stimulatory effects in areas with large social return rate gaps. Soderblom et al. pointed out that government investment in technology will send a positive signal to other investment entities in technology finance, shortening the time for other investment entities to identify “good projects” or “good enterprises” (Soderblom et al., 2015).
The analysis of the development environment and influencing factors of technology and finance has always been the focus of research, such as R&D expenditure (Alexandra and Liu, 2014), marketization level (Chowdhury and Maung, 2012), public service level (Lawton et al., 2013), urbanization level (Sahin, 2000), business environment (Giannetti, 2012), number of technology talents (Schertler, 2007), informatization level (Consoli, 2005), policy and financial loans (Geddes and Schmidt, 2020), entrepreneurship (Audretsch and Fritsch, 2003), etc. Hsu et al. found that the resource allocation efficiency of technology capital market is greatly affected by the development level of regional capital market. Under the same investment scale, regions with developed technology capital markets can achieve higher innovation performance (Hsu et al., 2014). Bertoni and Tykvová. (2015) discovered that the global value chain promoted the influence of independent venture capital investors on invention and innovation.
Some scholars have also explored the two-way interactive relationship between technology innovation and financial development. For example, the government-market-regional synergy coefficient and coupling coordination degree interaction strength or validity measurement show that regional technology finance has a significant threshold effect on technological innovation (Zheng and Zhang, 2018; Cheng et al., 2020; Zhang and Gu, 2020); Wang et al. analyzed the differences in the coupling efficiency of technology and finance in various provinces from the perspective of space, and verified the influence of government entities and institutional environment on the coupling efficiency of the two (Wang and Yang, 2018); Wang et al. (2012) used the synergetic theory to build a system synergy model, and analyzed the relationship between technological innovation and technology finance; Zhu and Yu (2021) constructed the VIF-variation coefficient method to screen the indicators; Liu and Jun-lin (2021) used entropy method, linear weighted sum method, and coupling degree coordination model to conduct empirical research on the degree of coupling between technological innovation and financial development in China, and Zhou and Chaocai (2020) found that technology finance, economic transformation and technological innovation have non-synergistic development.
With the popularization of digital drive and the development of mobile Internet technology ecology, regional finance and technological innovation are gradually changing. In order to further measure the role of technology finance on regional social economy, it is necessary to screen indicator data and evaluation dimensions more scientifically and clearly. The measurement indicators of the operation performance of the technological system of financial support factors include the amount of technological loans, the amount of venture capital investment, the amount of financing in the capital market of technological enterprises, the number of university projects and other financial support indicators, as well as the number of technological papers, the output value of high-tech products introduced, the sales income of new products, the turnover of the technology market, the turnover of technology trading contracts, the import and export volume of high-tech products and their proportions and other technological indicators (Kumbhakar et al., 2014; Badunenko and Kumbhakar, 2017; Li et al., 2019). As for the measurement of the efficiency of technology finance, there is still a wide controversy on the selection of indicators, and there are also common calibre mismatches or double counting problems in the actual use process.
The main contributions of this study are twofold. First of all, we use the coupling coordination degree to evaluate the development level of technology and finance. Different from the independent evaluation of technology and finance in the past, previous research focused on the support of finance to technology [(Wang et al., 2012; Zhu and Yu, 2021)], or the promotion of technology to financial development (Consoli, 2005; Schertler, 2007; Cheng et al., 2020; Zhang and Gu, 2020). We innovatively considered the interaction between technology and finance, and focused on the synergistic development between the two systems (Audretsch and Fritsch, 2003; Chowdhury and Maung, 2012), which is more systematic. Secondly, we integrate the KGM and NSGA-III algorithms, and use the KGM for short-term sequence data prediction to form a fusion space of technology and finance, then we use the NSGA-III method to solve the maximum coupling coordination degree of each region in the fusion space as the most feasible solution. In general, the study grasps the development status of national technological innovation and financial support dynamically from the perspective of time and space.
This paper is organized as follows: It addresses an analysis of related works on the mutual development on technology and finance in Section 1. Section 2 describes the integration approaches of evaluation model, adaptation relationship, KGM and NSGA in detail. Construction of evaluation index system are presented in Section 3. Empirical experiment and application of coupling coordination development evaluation model with KGM-NSGAIII among 30 provinces is completed in Section 4. In Section 5, conclusions and suggestions are pointed out.
2 Research methodology
2.1 Coupling coordinated development evaluation model
Ebert and Welsch believed that the integration method of multiple indicators in the comprehensive evaluation is related to the scale of the indicator data after standardization. In this study, the calculation is carried out by the method of linear function data standardization. The formula is shown in (Eq. 1):
Where
Coupling degree is a measure of the degree of association between systems, which can reflect the degree of mutual influence and interaction between systems. However, coupling degree can only accurately judge the degree of mutual influence between systems in the time dimension. Therefore, the author (Xie and Hu, 2021) builds a coordinated development degree model to avoid errors in the evaluation results caused by using coupling degree to judge the quality of the results, so as to scientifically evaluate the coordinated development degree of each subsystem, as shown in Eq. 2:
Where
2.2 The adaptation relationship between underlying indicators and subsystems
Comprehensive, coordinated and sustainable development of the region is the premise for the stable, healthy and efficient operation of the national economy, while the coordinated development of the region is a complex systematic project. Each subsystem of the evaluation index system for the deep integration of technology and finance covers multiple underlying indicators. The typical sequence decomposition is a form of clear attribution of indicators: each indicator only belongs to a certain subsystem and there are one or more indicators under a subsystem; what’s more, the connection relationship between subsystems and indicators does not intersect.
In the research of deep integration of technology finance, the indicator system is a panel data that includes time, indicators and regions. Doing principal component analysis by year will lead to completely different principal hyperplanes for the indicator values of different years (Deng, 1982), thus it is impossible to guarantee the uniformity, integrity and comparability of the analysis of the system.
In this study, we use the global principal component analysis model for index adaptation, that is, time series is added to the traditional principal component analysis method. For example, the same index data of different years and places are put together in time order to form time series stereo data, so as to make up for the lack of comparison of the evaluation results when the principal component analysis is performed on each annual data table. Finally, according to the analysis result of the global principal component, that is, the maximum load coefficient is used to determine the matching relationship between the underlying index and the subsystem. In order to clearly divide the attribution relationship between the indicators and the system, the complete division method can be adopted (that is, the indicators between subsystems or principal components do not intersect).
2.3 KGM
The Grey System Theory (GST) pioneered by Deng (Xin and Liu, 2018) in 1982 is based on the idea of “Grey-Box,” which is efficient to deal with uncertain problems with very little information and small samples. Xin and Liu (2018) general nonlinear multivariate grey model based on the kernel method (Smola and Scholkopf, 2004). The nonlinear form of the GM (1, n) model can be written as
Where
The
Where
2.4 NSGA-III
EVOLUTIONARY multi-objective optimization (EMO) methodologies have amply shown their niche in finding a set of well-converged and well-diversified non-dominated solutions in different two- and three-objective optimization problems since the beginning of the 1990s. MOEA/D (Knowles and Corne, 2007) uses a predefined set of weight vectors to maintain a diverse set of trade-off solutions. For each weight vector, the resulting problem is called a sub-problem.
NSGA-III uses a predefined set of reference points to ensure diversity in obtained solutions. The maintenance of diversity among population members in NSGA-III is aided by supplying and adaptively updating a number of well-spread reference points. A set of predefined search directions spanning the entire Pareto-optimal front can be specified beforehand and multiple searches can be performed along each direction. Instead of multiple search directions, multiple predefined reference points can be specified for this purpose. Thereafter, points corresponding to each reference point can be emphasized to find a set of widely distributed sets of Pareto-optimal points.
The NSGA-III approach with a supply of a set of reference points has a similar implicit principle to the hypergrid-based archiving techniques, such as adaptive grid algorithm (Deb et al., 2632), ɛ-MOEA (Martinez-Iranzo et al., 2009) and ev-MOGA (Deb and Jain, 2014).
The pseudocode of NSGA-III (Abdallah et al., 2022) is as follows:
Input: structured reference points
Output:
1.
2.
3.
4.
5. repeat
6.
7. until
8. Last front to be included:
9. If
10.
11. else
12.
13. Points to be chosen from
14. Normalize objectives and create reference set
• Normalize (
15. Associate each member R of
•
• Compute niche count of reference point j
16. Choose K members one at a time from
•
17. end if
2.5 Analysis flow
The development of technology and finance involves multiple dimensions of the socio-economic system. The normative exploration of socio-economic issues requires the establishment of an indicator system and the use of reasonable models to measure or predict. The study extracts concise and effective indicators from the rich indicators, and predicts and optimizes the trend and goal of the coupling coordinated development of technology and finance through the model. The specific process is shown in Figure 1.
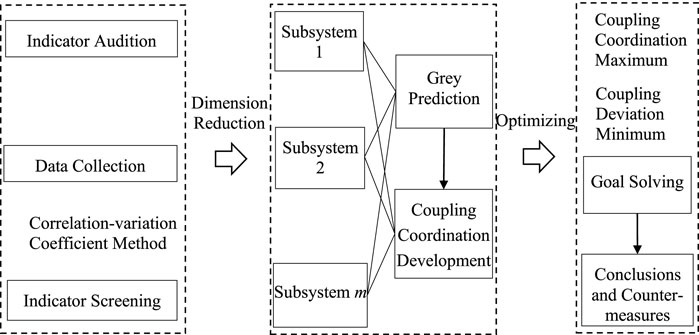
FIGURE 1. Analysis flow of optimization for coupling coordinated development of technology and finance.
2.5.1 Indicator audition
We mainly consider comprehensive requirements. The index system should reflect the main features and conditions of the evaluation system from different perspectives. The evaluation of deep integration of technology and finance should cover major fields such as economy, finance, science and technology, as well as main dynamic change features of development level and coordination. The selection of indicators should emphasize representativeness and typicality, and avoid indicators with similar or repeated meanings. Focus on high-frequency indicators of classic views of international authorities.
2.5.2 Data collection
The availability of data, the reliability of data or the stability of data quality should be considered in the indicator design. The statistical data under the existing statistical system should be used as much as possible, and the National Statistical Yearbook and the website of the National Bureau of Statistics should be selected as the main source of data. The indicators with clear concept, strong representativeness, high reliability and high availability are preferred.
2.5.3 Indicator screening
Using indicators with low correlation, large difference and high contribution as analysis indicators can make the evaluation and prediction results more accurate and effective. In the study, the correlation-variation coefficient method, principal component analysis and other methods are used to screen the indicators.
2.5.4 Model calculation
Traditional evaluation methods pay more attention to the value of the final result. In this study, the coupling coordinated development degree is used to evaluate the development and coordination of S&T and finance, which can not only evaluate the level of development, but also evaluate the structure of development to increase the analysis dimension of technology finance.
2.5.5 Prediction optimization
Since the integrated development of technology and finance is a new kind of thing, the effective data obtained in this study can hardly meet the basic requirements of linear prediction (generally more than 30 years). Therefore, we use the grey prediction method to solve the problem of prediction accuracy of low sample. The grey prediction of short-term sequence data is difficult to convince people, so the study uses the prediction data as the optimization boundary to solve the NSGA-III objective, predicts the coupling coordinated development of technology and finance in various regions in the next 5 years, and enhances the reliability and time span of the prediction results.
The development and coordination of technology and finance both involve the implicit interaction of multiple subjects, which has the complexity of social and economic issues, just like constructing an invisible interactive development network in the social and economic system (Abdallah et al., 2020; Abdallah et al., 2022). The development of technology will provide more technical support and capital operation space for finance, while finance will provide more capital for technology, especially to meet the demand of human resources, so that mankind can play its endless wisdom, technological achievements can be rapidly grown and transformed, and they can be turned into carriers of capital appreciation.
3 Construction of evaluation index system
Based on the principle of coupling coordination and the connotation of the development of technology finance, the study constructs the correlation-variation coefficient method to screen the indicators for the problems of redundant indicators and unrepresentative indicators.
3.1 Selection of indicators
3.1.1 Primary selection of indicators
We take “technology finance” and “indicators” as the retrieval “themes” in the Chinese CNKI, EBSCO, Science Direct, Springer and other databases, and select 113 journal papers according to the pertinence, authority, timeliness, normativeness and directness of the literature. Considering the limitations of different indicator systems in terms of geographical coverage, time span, research field and data source, and based on the statistical analysis of the evaluation indicator system of the deep integration of technology finance, the following 32 indicators are selected:
Full-time Equivalent of R&D Personnel of Industrial Enterprises above Designated Size (F1), R&D Expenditure of Industrial Enterprises above Designated Size (F2), Number of Scientific Research and Technology Development Institutions (F3), Number of Patent Applications for Inventions (F4), Main Business Income of High-tech Enterprises (F5), Sales Profit of High-tech Industry (F6), Proportion of Total Industrial Output Value of High-tech Industry in Total Industrial Output Value (F7), Output Value of New Product (F8), Value of Contracts Traded in the Technology Market (F9), Number of Patents Granted (F10), Government Technology Appropriation (F11), Total Loans of Financial Institutions (F12), Premium Income of Insurance Companies (F13), Total Stock Market Value (F14), The Investment Intensity of Venture Capital (F15), Number of New Product Development Projects (F16), Export Volume of High-tech Products (F17), Number of Colleges and Universities (F18), Proportion of Output Value of Tertiary Industry in GDP (F19), General Budget Revenue of Local Finance (F20), Number of Technology Incubation Enterprises (F21), Venture Capital Amount (F22), Employees of Technology Incubation Enterprises (F23), Urbanization Rate (F24), Number of Technology Enterprises (F25), Number of Undergraduates (F26), Number of Retrievals of the Three Major Scientific Papers (F27), GDP per capita (F28), Expenditure of R&D Institutions of Industrial Enterprises above Designated Size (F29), Number of R&D Personnel of Industrial Enterprises above Designated Size (F30), Total Import and Export Volume of Foreign-invested Enterprises (F31) and Amount of Foreign Technology Introduction Contract (F32).
3.1.2 Data source and preprocessing
The study selects 30 provinces in China (except Hong Kong, Macao and Taiwan) as the research objects. The data mainly come from the 2011–2020 China Statistical Yearbook, China Science and Technology Statistical Yearbook, China Statistical Yearbook on High Technology Industry, China Financial Yearbook, China Venture Capital Development Report, CEI database, and Statistical Yearbooks and Statistical Bulletins of provincial and municipal statistical bureaus. Among them, a small number of missing data are processed by interpolation. According to the China Statistical Yearbook, China is divided into four regions: the eastern region (Beijing, Tianjin, Hebei, Shanghai, Jiangsu, Zhejiang, Shandong, Guangdong, Fujian and Hainan), the northeast region (Heilongjiang, Jilin and Liaoning), the central region (Shanxi, Anhui, Jiangxi, Henan, Hubei and Hunan) and the western region (Neimenggu, Guangxi, Chongqing, Sichuan, Guizhou, Yunnan, Xizang (Tibet), Shaanxi, Gansu, Qinghai, Ningxia and Xinjiang).
Since different indicator data have differences in dimension and order of magnitude, the range method is used to standardize the data and the range of values is [0, 1]. In the study, the total variance, component matrix and eigenvalue are obtained by dimension reduction method, and then the indicator weight and normalization are calculated.
3.2 Indicator selection steps based on the correlation-variation coefficient method
3.2.1 First screening: Based on the correlation coefficient method
Panel data of 30 provinces in China from 2011 to 2020 are selected. Based on the correlation-variation coefficient method, the correlation coefficient matrix and the coefficient of variation are calculated based on the standardised panel data to complete the screening of indicators.
The initial screening of indicators based on the correlation coefficient method is carried out to remove indicators with multiple co-linearities and eliminate the redundancy of information between indicators in order to improve the scientific and rational nature of the evaluation results. The coefficient of determination is the average of the coefficients of determination of each indicator and the remaining indicators. The larger the value of the coefficient of determination, the more important the indicator is in the evaluation system, so the indicator is retained as a reference indicator. Comparing the correlation coefficients of the remaining indicators with the reference indicator, the larger the value the more it is to be excluded, vice versa, it is retained. After calculation, the results of the complex correlation coefficient of each indicator are obtained as shown in Figure 2.
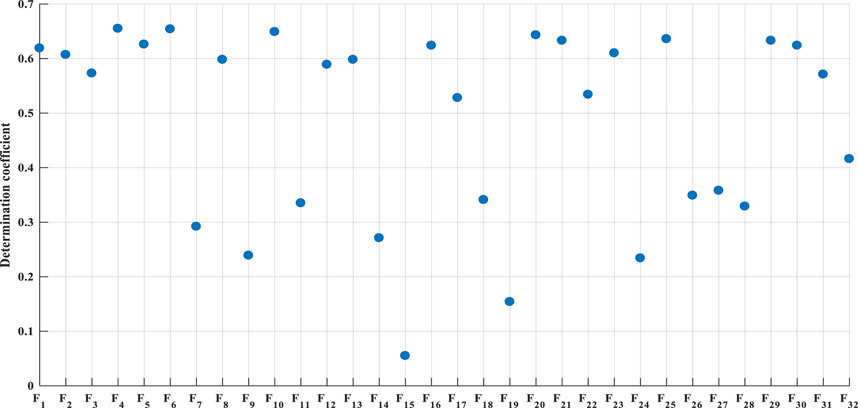
FIGURE 2. The determination coefficient of 32 indicators for Technology and Finance.
As can be seen from Figure 2, the coefficient of determination of F4 is large, followed by F6, therefore, Indicator 4 and Indicator 6, i.e., the number of invention patent applications and sales profit of high-tech industry, occupy an important position in the evaluation system and should be retained, and using Indicator 4 and Indicator 6 as reference indicators, compare the size of the remaining indicators with their correlation coefficients respectively. Conversely, they should be retained. Finally, using the number of invention patent applications and the sales profit of high-tech industries as control variables, the partial correlation coefficients are calculated.
The partial correlation coefficients of F4 & F6 and F1, F2, F21 and F23 are 0.627, 1, 0.646 and 0.626 respectively, which exceed the cut-off line of 0.5 and cover too many overlapping multiples and should be eliminated. The elimination of the number of Full-time Equivalent of R&D Personnel of Industrial Enterprises above Designated Size (F1), R&D Expenditure of Industrial Enterprises above Designated Size (F2), Number of Technology Incubation Enterprises (F21), and Employees of Technology Incubation Enterprises (F23) not only ensure the comprehensiveness of the indicators, but also avoid the redundancy of the indicators.
3.2.2 Second screening: Based on the coefficient of variation method
Based on the coefficient of variation method for re-sorting, the degree of dispersion of information is judged, unrepresentative indicators are deleted and those with a high impact on the evaluation results are screened out. The criteria for screening indicators based on the coefficient of variation are as follows: when the coefficient of variation of an indicator is less than the average value of the coefficients of variation of all indicators, it should be deleted in order to screen out more representative indicators.
The coefficient of variation (ratio of standard deviation to mean) for each indicator is calculated from the data table and the mean of the coefficient of variation for all indicators is found to be 1.36. Thirteen indicators that are less than the mean are removed: F4 (1.33), F7 (0.89), F11 (1.31), F12 (1.00), F13 (0.86), F15 (0.82), F18 (0.51), F19 (0.95), F20 (0.88), F24 (0.77), F26 (0.57), F27 (1.08), F28 (0.90).
3.3 Analysis of inter-level adaptation relationships
Through the global principal component analysis of the panel data of 30 provinces from 2011 to 2020, the analysis finds that: KMO = 0.911, with a companion probability value of 0.000, passing the Bartlett’s spherical test at a significance level of 0.05; extracting factors with characteristic roots greater than 1, the cumulative contribution of variance when extracting two principal factors reached 86.653%, which reflect the overall situation.
According to the criteria for the division of the aptitude relationship between the layers (Fiss, 2011; Greckhamer, 2016), the threshold value of the loading coefficient is taken as M = 85%, and according to the meaning of the selected underlying indicators, the two main components are classified as science and technology innovation and financial support subsystems, and the aptitude relationship is improved and optimized by combining with the expert method, so as to finally obtain an evaluation index system for the coordinated development of science and technology finance, with the specific aptitude relationship and weights shown in Table 1.
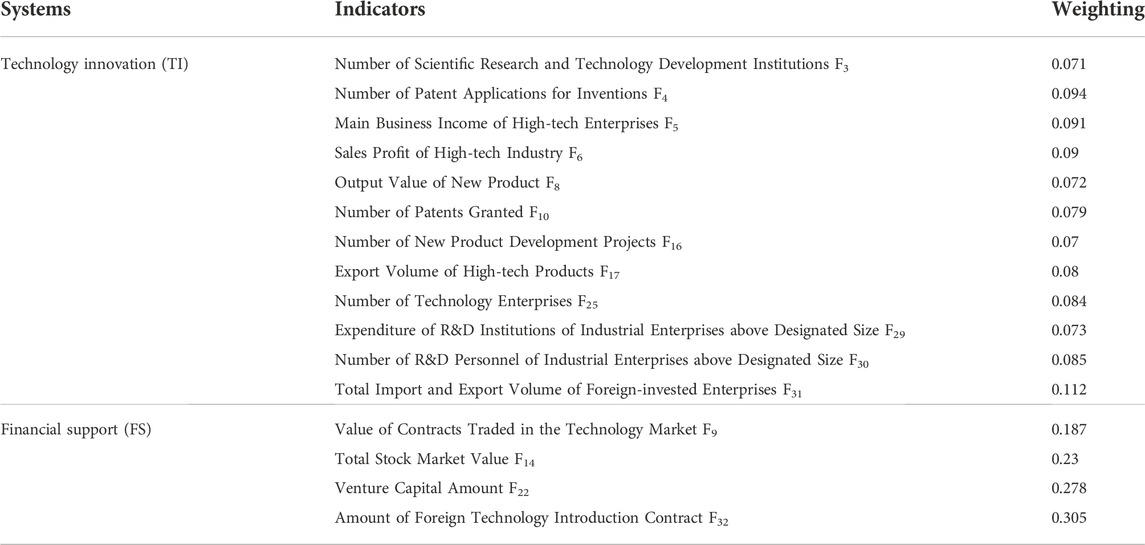
TABLE 1. Adaptation relationships and weights of subsystems and underlying indicators.
4 Empirical analysis
4.1 Analysis of coupling coordinated development based on time-series evolution
According to the principal component dimensionality reduction analysis, the weights of the two subsystems of Technology Innovation and Financial Support are obtained after standardizing the variance contribution of the principal components as W1 = 0.8649 and W2 = 0.1351 respectively, which in turn leads to the results of the coupling coordinated development index of technology innovation and financial support systems in 30 provinces across China, as shown in Table 2.
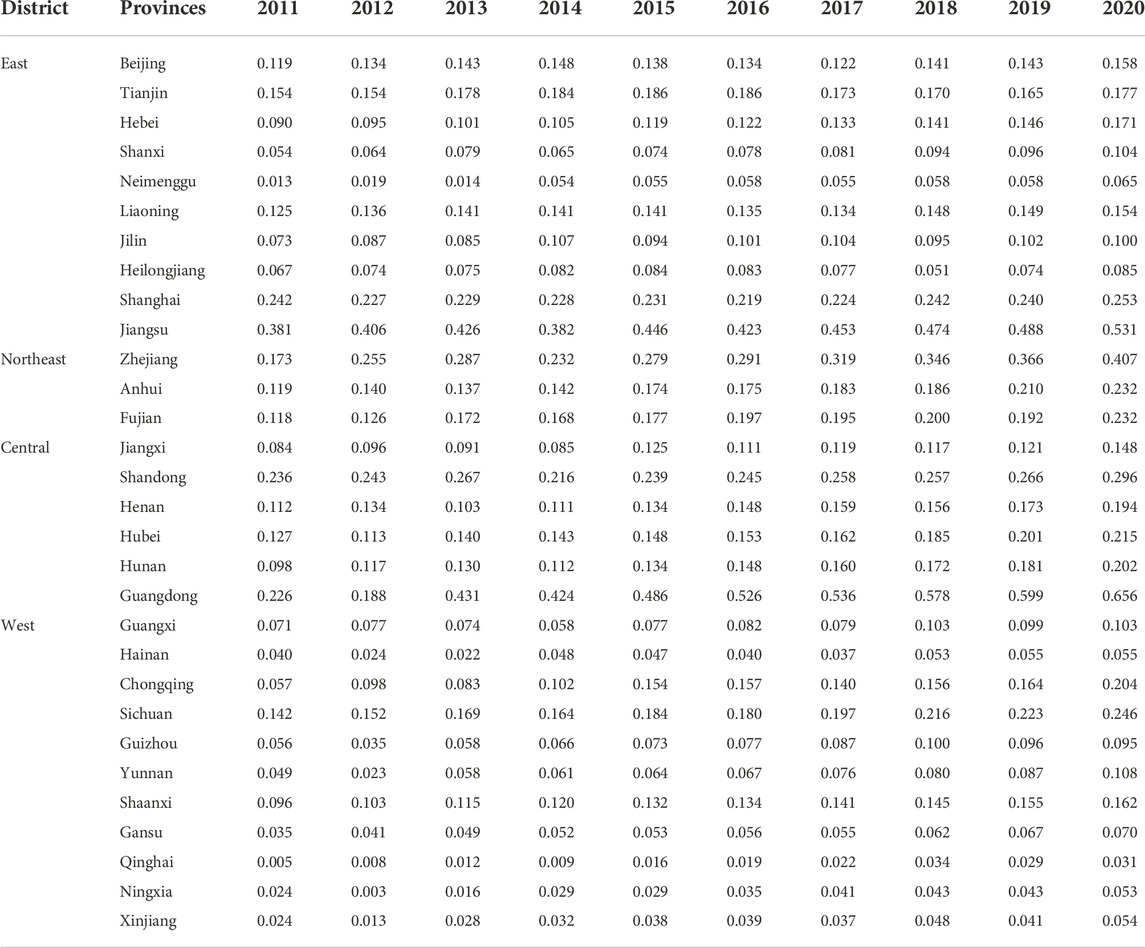
TABLE 2. Coupling coordinated development index.
4.1.1 Technology and innovation are insufficient in development, adequate in coordination
The level of development of our country in terms of Financial Support, Technology Innovation needs to be perceived in general, and the average level of development of all provinces in each year is shown in Figure 3.
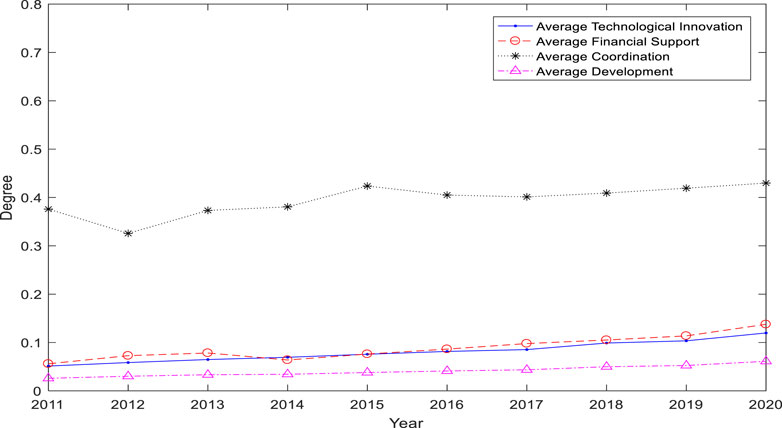
FIGURE 3. Summary on Average Evaluation value of Technology, Finance and Coordination and Development.
Since 2011, the evolution of the level of Technology Innovation and the level of Financial Support has remained highly consistent across the country, both at a low level, but the coupling coordinated degree is at an intermediate level, which shows that there may be an imbalance in the development of technology and finance in some regions of the country. The level of Technology Innovation remains at a slightly higher level compared to the other. However, both are at a low level. The national composite index of technology and financial development shows a steady growth trend, however the range of growth is very narrow. The coupling coordination between technology and finance maintains a high level compared to the other indices, but the evolutionary trend is not smooth and there are fluctuations, with little change in the initial and final values. It is evident that the development of the integration of technology and finance has been historically explored and may be closely related to the policy push for financial support and business development of technology innovation, however there is some potential for recurring fluctuations in the policy push.
4.1.2 Insufficient coupling coordination, space for integration to be expanded
The level of development of technology innovation and financial support in China is at a low level and needs to be analyzed by region to uncover the differences among provinces from 2011 to 2020, as shown in Figure 4.
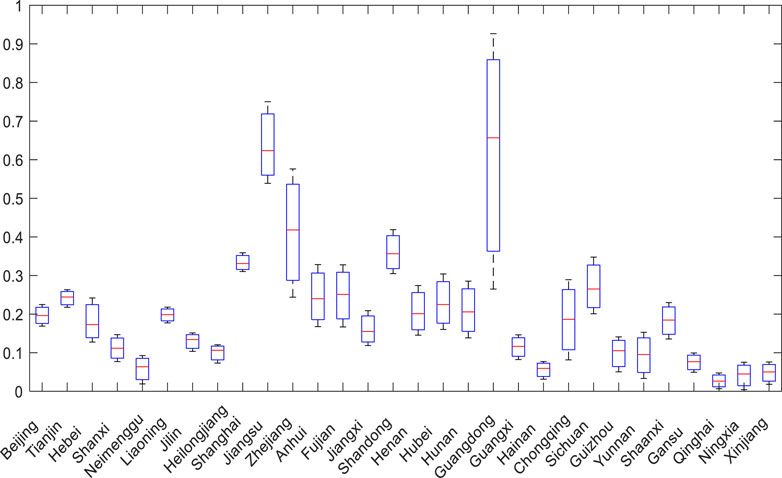
FIGURE 4. Regional scope of coupling coordination.
Between 2011 and 2020, the distribution of the coupling coordinated development index covers the stages of dysfunctional development, low coordinated development, moderate coordinated development, high coordinated development, extremely coordinated development and fully coordinated development. The average value of the coupling coordinated development index of technology and finance in China is low, with only a small number of regions in extremely coordinated or fully coordinated development and most below highly coordinated development. Some regions are at the stage of dysfunctional development, the integration of technology and financial development is still far from taking off, the existence of regional culture, economic base, industrial distribution has a close relationship. For the regions with high coupled coordinated development index of technology and finance, the minimum and maximum values also have a large difference, which shows that the integration space and the level of coupled coordination have a certain correlation, especially in Guangdong, Jiangsu and Zhejiang.
4.1.3 Clear regional differences, with the eastern part dominating and the central part rising steadily
The comparative analysis between regions is carried out by East, West, Central and North-East, and the color temperature matrix makes it possible to visualize the level of regional development, as shown in Figure 5.
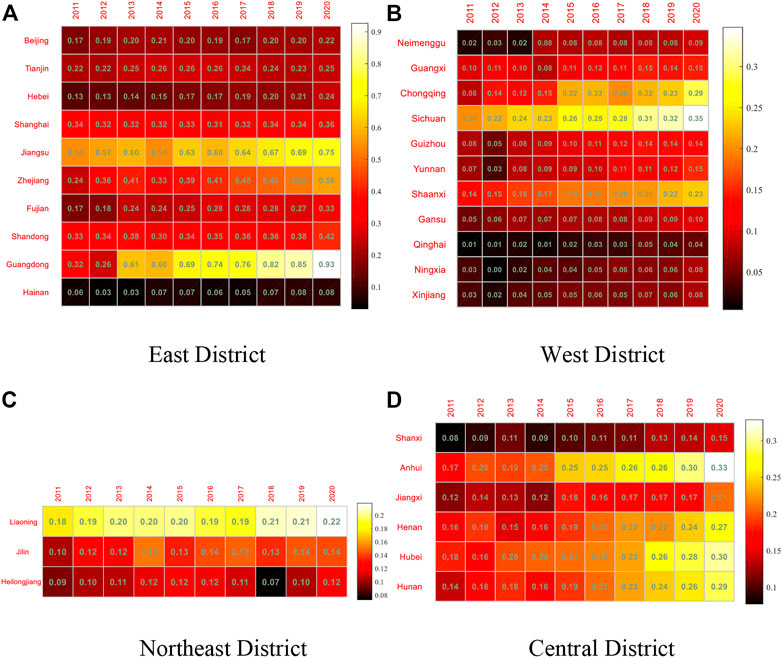
FIGURE 5. Regional coupling coordination. (A) East District, (B) West District, (C) Northeast District, (D) Central District.
There is significant regional differentiation in the coupling coordinated development of Technology Innovation and Financial Support in China. It can be seen through colorbar that the degree of coupling coordinated development in the eastern region is better than the national average, while the development in the northeast, central and western regions all lag behind the national average, but basically show a steady upward trend. Guangdong and Jiangsu in the eastern region are in an obvious upward trend in the coupling coordinated development of technology and finance, and are in the dominant eastern region, followed by Zhejiang and Shandong. Hainan Province lacks the support of technology resources and policies, and its high-tech industry lags behind, so its coupling coordinated development is slow and at the bottom of the eastern region, with a significant gap with other regions.
The western region is led by Chongqing, Sichuan and Shaanxi. Geographically, these regions are closer to the Central Plains and have a more convenient transportation location. The uneven resources, geographical location and policies of the western region, the more homogeneous industrial structure and the scarcity of human resources in technology directly affect the level of coordinated development of technology and finance. With the in-depth promotion of the Western Development Strategy, especially the poverty alleviation policy, the national security strategy and the Belt and Road Strategy, science, technology and finance in the west will face significant opportunities.
The coordination of technology and finance coupling in the Northeast is all at a low level. The Northeast is a historical heavy industrial base in China and has a northern geographic location and more arid climatic characteristics, and the activity of technology and finance requires the flow of talent, and transportation and climatic conditions have traditionally been important influencing factors for the flow of talent. The coupling of technology and finance is mostly focused on emerging technologies, green economy, energy saving and emission reduction industries, etc. The Northeast, which is supported by equipment manufacturing and metal smelting as traditional industries, is tied to the historical path in the integration of technology and finance. In contrast, the Liaoning region, with its good port and coastline economic zone, has a higher degree of technology and finance development.
The development of technology and finance in the central region is a relatively balanced region, both at an intermediate level and steadily improving. Hubei has certain advantages of coupling coordinated of technology and finance, and its advantages of being a transportation hub and a technology talent are extremely obvious. Shanxi, on the other hand, continues to be out of balance, with Financial Support development relatively lagging behind Technology Innovation, both developing slowly, and a more serious reliance on resource-based and energy-consuming industrial development paths.
4.2 KGM-NSGAIII-based prediction and optimisation of coupled technology and finance coordination
The development trend of Technology Innovation and Financial Support in China is an important guide for technology finance policy. This paper has applied the KGM (1, n) grey prediction model to dynamically simulate the data from 2021 to 2025 based on the bi-system statistics of Technology Innovation and Financial Support in each province from 2011 to 2020, and tested the accuracy of the model, and the small error probability p-value and the posteriori difference ratio values are within a reasonable range. And this paper uses the predicted data on the evolution of the technology and financial systems as the optimisation boundary to calculate the optimal state of science and technology finance for each region during 2021–2025, making a scientific framework for policy reference. The maximum minimum and average values of financial support and science and technology innovation predicted by KGM for each region are shown in Figure 6.
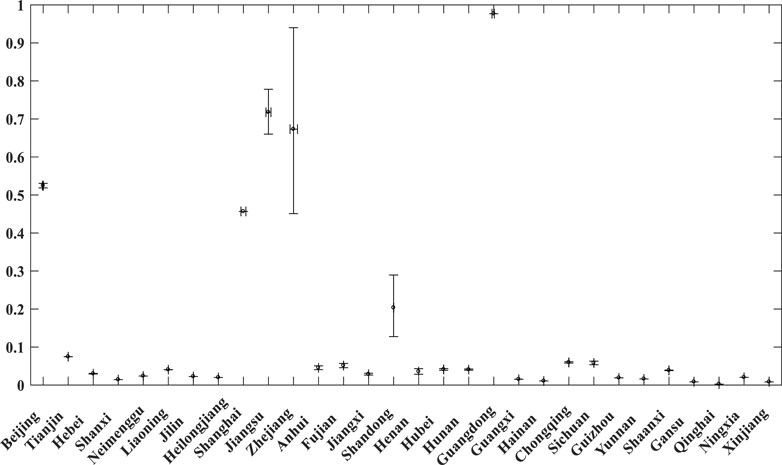
FIGURE 6. Prediction of KGM range for technology and finance by regions.
In Figure 6, the vertical interval line segments indicate the predicted maximum and minimum values for Technology Innovation and the horizontal interval line segments indicate the predicted maximum and minimum values for Financial Support. The circles indicate the mean of the forecasts.
Figure 6 shows that the prediction space for the coupling coordinated development of technology and finance is mostly at the “short” level. Beijing, Shanghai and Guangdong have a “narrow and high” prediction space for coupling coordination and development degree. Jiangsu, Zhejiang and Shandong have large prediction intervals, especially in Zhejiang, where the prediction interval for science and technology finance varies greatly and there is much room for optimization.
Targets are set as follows.
where
The prediction of the optimal coupling development of technology and finance for each region can be obtained by calculation. Financial Support, Technology Innovation, Z (Coupling Coordinated Development Index), Prediction Interval are presented in parallel coordinates as shown in Figure 7.
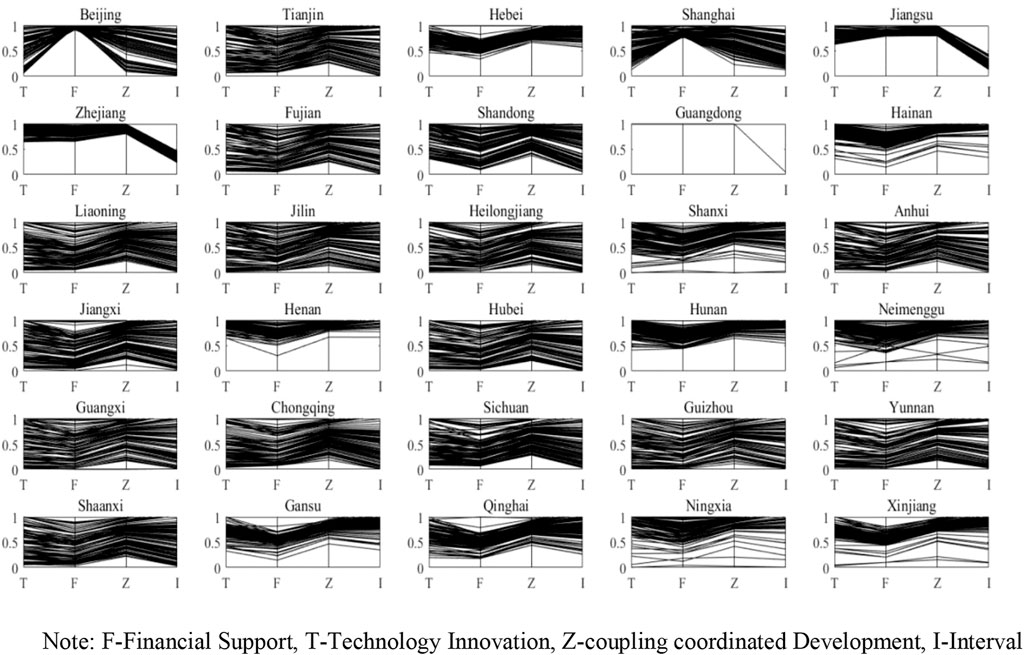
FIGURE 7. Optimization prediction for technology and finance. Note: F, Financial Support; T, Technology Innovation; Z, coupling coordinated Development; I, Interval.
In this paper, 30 regions are classified and analyzed according to the width of the indicators F and T, the height of the Z value and the size of the I value.
(1) Robust and high growth type: This category has a narrow range of values for F and T and is at a higher position, showing high growth in technology and finance, and has a higher Z value and a lower I value, showing the robustness and synergy of technology and finance. For example, Guangdong, Jiangsu and Zhejiang, the three regions are predicted to enter a period of deep integration of technology and finance and occupy the high ground of development.
(2) Broad multi-possibility type: This type has a wide range of F or T values, reflecting the broad prospects for the development of technology and finance, while the Z value and I value have a certain linear relationship, mainly a positive proportional relationship, reflecting the existence of multiple possibilities for the coupling coordinated development of technology and finance, with a high Z value, the I value is also high, indicating that the possibility of achieving a high Z value is reduced. This category includes most regions, such as Beijing, Tianjin, Shanghai, Zhejiang, Fujian, Shandong, Liaoning, Jilin, Heilongjiang, Anhui, Hubei, Hunan, Inner Mongolia, Guangxi, Henan, Guizhou, Yunnan, Chongqing, Sichuan and Shaanxi. Most of these regions have already carried out technology and finance pilot work under the impetus of national policies, with varying degrees of success and a preference for future possibilities.
(3) Leapfrogging High Expectation Type: This type of F, T, Z and I values are in the medium-high region, showing that technology and finance may develop in leaps and bounds and are worthy of expectation. Examples include Hainan, Shanxi, Gansu, Qinghai, Hebei, Xinjiang and Jiangxi. This type of region can be based on the regional economic development trend turning stable and improving, the driving force of the integration development policy of technology and finance (location, technology, transportation, resources, etc.) can play a huge role in promoting the leapfrog development of the region in the field of technology and finance.
The forecast results show that although the development trend of the coupling coordinated development of Technology Innovation and Financial Support in China has improved in the next few years, the trend of coupled and coordinated evolution and growth is relatively slow, the imbalance of development between regions still exists, and it still takes a long time for provinces to reach the state of deep integration and synergistic development of the two systems of Technology Innovation and Financial Support. Therefore, in the future development, it is necessary for each province to focus on its own shortcomings and weaknesses, break through itself, and at the same time strengthen intra-regional and inter-regional linkage and mutual cooperation to achieve the coordinated and sustainable development of both Technology Innovation and Financial Support nationwide.
5 Conclusion and suggestions
5.1 Conclusion
(1) The industrial connotation of the technology financial indicators is outstanding. The number of new product development projects, the export value of high-tech products, the main business income of high-tech enterprises, the number of high-tech enterprises, the sales profit of high-tech industries, the output value of new products, the number of personnel in R&D institutions of industrial enterprises above a certain size, the contract value of technology market transactions, the total import and export value of foreign-invested enterprises and the contract value of foreign technology introduction are all indicators related to the transformation of technological achievements, reflecting that the deep integration of technology and finance ultimately comes down to products, sectors, industries and other specific businesses. At the same time, the relationship between the role of the capital market has been reduced with the improvement of the financial market, and the closely related indicators are now only the total value of the market value of stocks and the amount of venture capital investment. The capital market is a category of accumulative indicators, and when the total amount reaches a certain scale, its radiation spillover effect is significant.
(2) There are differences in the levels of integration of technology and finance across the country. The comprehensive capacity of Technology Innovation and Financial Support in the east is far superior to that of the central, western and northeastern regions, and its Technology Innovation and Financial Support have great room for synergistic development, but there is also the possibility of a leapfrog breakthrough in coupling coordinated development in the western and central regions. In terms of coupling degree, the coupling degree of Technology Innovation and Financial Support in China shows a fluctuating upward trend, especially in the central region where there is a clear trend of coupling coordinated development driven by the central region. The western region can promote the rapid development of technology and finance under certain driving forces (mostly policies). The industrial structure and location of the northeast has a strong shortcoming effect on the development of science and technology and finance.
(3) The coupling coordinated development drive of technology and finance is limited. Through assessment, prediction and optimization, it is found that the regions with piloted technology finance have certain advantages in coupling coordination, but the overall level is still at a medium level and maintains a more consistent trend, indicating that the sustainability of policy drivers for science and technology finance is not strong. At the same time, some of the regions with weak development in science and technology finance can be rapidly enhanced by a shift in some of the drivers, such as policy support and capital flows. The good performance of technology finance in Guangdong and Jiangsu shows that the integration of technology and finance still requires long-term autonomous development of the market in order to promote the high-quality development of science and technology finance.
5.2 Recommendations
Based on the findings of the above study, the following countermeasures are recommended.
(1) There is regional heterogeneity in the impact of technology finance on high-quality economic development and financial stability, and the formulation of development policies and regulatory policies related to technology finance should reflect differentiation. Design an institutional framework that matches the development of technology finance, and adhere to the complementarity of government guidance and market operation to provide institutional safeguards for the development of technology finance.
(2) In order to realize the deep integration of Technology Innovation and Financial Support, we should vigorously implement the innovation-driven development strategy, improve the top-level design of the integration system such as preferential support policies, the government and enterprises should increase funding for scientific research, attach importance to the introduction of technology-based and technical high-end talents, build a good platform, and better promote the transformation of scientific and technological achievements through market mechanisms, so as to enhance the ability of technology innovation and implement the coordinated development of technological innovation and financial support.
(3) The level of coupling coordinated development varies significantly from region to region in China, and the shortcomings and weaknesses of the uncoordinated Technology Innovation and Financial Support system should be tapped according to their resources, policies, geographical location and transportation, etc., and precise policies should be formulated according to local conditions, so as to formulate differentiated policies on Technology Innovation and Financial Support in line with the development of each region and optimize the institutional mechanism for deep integration.
(4) For regions with a high degree of coordinated development, it should give play to the radiation-driven effect on neighboring provinces, adopt a regional linkage and mutual assistance development model, break down regional barriers, and realize the free flow of financial, talent and technological resources. For provinces at the stage of dysfunctional development, the government should implement one policy for each region according to the actual development needs, and increase policy tilt and capital investment in a targeted manner to promote the efficient development of Technology Innovation and Financial Support systems and narrow the differences with developed regions.
Data availability statement
The original contributions presented in the study are included in the article/Supplementary Material, further inquiries can be directed to the corresponding author.
Author contributions
Conceptualization, QY; methodology, LC; software, LC; validation, QY; formal analysis, XWa; investigation, XWa; resources, QY; data curation, QY; writing—original draft preparation, XWu; writing—review and editing, QY; visualization, XG; All authors have read and agreed to the published version of the manuscript.
Conflict of interest
The authors declare that the research was conducted in the absence of any commercial or financial relationships that could be construed as a potential conflict of interest.
Publisher’s note
All claims expressed in this article are solely those of the authors and do not necessarily represent those of their affiliated organizations, or those of the publisher, the editors and the reviewers. Any product that may be evaluated in this article, or claim that may be made by its manufacturer, is not guaranteed or endorsed by the publisher.
References
Abdallah, Wajih, Mnasri, Sami, and Val, Thierry (2022). Alexandria, Egypt, 16–22.Genetic-voronoi algorithm for coverage of IoT data collection networks[C].Proceedings of the 30th international conference on computer theory and applications (ICCTA)
Abdallah, Wajih, Sami, M. N. A. S. R. I., Nejah, N. A. S. R. I., and val, Thierry Emergent IoT Wireless Technologies beyond the year 2020: A Comprehensive Comparative Analysis[C].Proceedings of the 2020 International Conference on Computing and Information Technology, ICCIT- 1441. University of Tabuk, Tabuk, Kingdom of Saudi Arabia, 2020, 174–178.
Alexandra, G., and Liu, P. (2014). To what extent do financing constraints affect Chinese firms' innovation activities. Int. Rev. Financial Analysis 36, 223–240. doi:10.1016/j.irfa.2014.01.005
Ang, J. B. (2010). Research technological change and financial liberalization in South Korea. J. Macroecon. 32 (1), 457–468. doi:10.1016/j.jmacro.2009.06.002
Audretsch, D., and Fritsch, M. (2003). Linking entrepreneurship to growth: The case of west Germany. Ind. Innov. 10 (1), 65–73. doi:10.1080/1366271032000068104
Badunenko, O., and Kumbhakar, S. C. (2017). Economies of scale, technical change, and persistent and time⁃varying cost efficiency in Indian banking: Do ownership, regulation, and heterogeneity matter? [J]. Eur. J. Operational Res. 260 (2), 789–803. doi:10.1016/j.ejor.2017.01.025
Beck, T., De Jonghe, O., and Schepens, G. (2013). Bank competition and stability: Cross-country heterogeneity. J. Financial Intermediation 22 (02), 218–244. doi:10.1016/j.jfi.2012.07.001
Bertoni, F., and Tykvová, T., (2015). Does governmental venture capital spur invention and innovation? Evidence from young European biotech companies[J]. Res. Policy 44 (4), 925–935. doi:10.1016/j.respol.2015.02.002
Browne, M. W. (2001). An overview of analytic rotation in exploratory factor analysis. Multivar. Behav. Res. 36 (36), 111–150. doi:10.1207/s15327906mbr3601_05
Cheng, Xiang, Yang, Xiaojuan, and Zhang, Feng (2020). Research on the coordination degree between high quality development of regional economy and science and technology financial policy. China Soft Sci. (S1), 115–124.
Chowdhury, R. H., and Maung, M. (2012). Financial market development and the effectiveness of R&D investment: Evidence from developed and emerging countries. Res. Int. Bus. Finance 26 (2), 258–272. doi:10.1016/j.ribaf.2011.12.003
Clausen, T. H. (2009). Do subsidies have positive impacts on R&D and innovation activities at the firm level. Struct. Change Econ. Dyn. 20 (4), 239–253. doi:10.1016/j.strueco.2009.09.004
Consoli, D. (2005). The dynamics of technological change in UK retail banking services: An evolutionary perspective. Res. Policy 34 (34), 461–480. doi:10.1016/j.respol.2005.02.001
Deb, K., and Jain, H. (2014). An evolutionary many-objective optimization algorithm using reference-point-based nondominated sorting approach, Part I: Solving problems with box constraints. IEEE Trans. Evol. Comput. 18 (4), 577–601. doi:10.1109/tevc.2013.2281535
Deb, K., Mohan, M., and Mishra, S. “Toward a quick computation of well spread Pareto-optimal solutions,” in Proceedings of the International Conference on Evolutionary Multi-Criterion Optimization. 2003, EMO-03.Berlin, Heidelberg LNCS 2632. 222–236.
Deng, Ju-Long (1982). Control problems of grey systems. Syst. Control Lett. 1 (5), 288–294. doi:10.1016/s0167-6911(82)80025-x
Fiss, P. C. (2011). Building better causal theories: A fuzzy set approach to typologies in organization research. Acad. Manage. J. 54 (2), 393–420. doi:10.5465/amj.2011.60263120
Foster, L., Haltiwanger, J., and Syverson, C. (2008). Reallocation, firm turnover, and efficiency: Selection on productivity or profitability? Am. Econ. Rev. 98 (1), 394–425. doi:10.1257/aer.98.1.394
Geddes, A., and Schmidt, T. S. (2020). Integrating finance into the multi-level perspective: Technology niche-finance regime interactions and financial policy interventions. Res. Policy 49 (06), 103985. doi:10.1016/j.respol.2020.103985
Giannetti, C. (2012). Relationship lending and firm innovativeness. J. Empir. Finance 19 (5), 762–781. doi:10.1016/j.jempfin.2012.08.005
Greckhamer, T. (2016). CEO compensation in relation to worker compensation across countries: The configurational impact of country-level institutions. Strateg. Manag. J. 37 (4), 793–815. doi:10.1002/smj.2370
Guellec, D., and Potterie, B. (2003). The impact of public R&D expenditure on business R&D. Econ. Innovation New Technol. 12 (3), 225–243. doi:10.1080/10438590290004555
Hsu, P. H., Xu, Y., and Tian, X. (2014). Financial development and innovation: Cross-country evidence. J. Financial Econ. 112 (112), 116–135. doi:10.1016/j.jfineco.2013.12.002
Kelly, R., and Kim, H. (2018). Venture capital as a catalyst for commercialization and high growth. J. Technol. Transf. 43 (6), 1466–1492. doi:10.1007/s10961-016-9540-1
King, R. G., and Levine, R. (1993). Finance and growth: Schumpeter might Be RightSchumpeter might be right. Q. J. Econ. 60 (108), 717–737. doi:10.2307/2118406
Knowles, J. D., and Corne, D. W. (2007). Quantifying the effects of objective space dimension in evolutionary multiobjective optimization, ” Proceedings of the International Conference on Evolutionary Multi-Criterion Optimization, Berlin, Heidelberg, 757–771.
Kumbhakar, S., Lien, G. D., and Hardaker, J. B. (2014). Technical efficiency in competing panel data models: A study of Norwegian grain farming. J. Product. Anal. 41 (2), 321–337. doi:10.1007/s11123-012-0303-1
Lawton, P., Murphy, E., and Redmond, D. (2013). Residential preferences of the 'creative class. Cities 31 (31), 47–56. doi:10.1016/j.cities.2012.04.002
Li, Y. N., Yang, Y., and Zhao, X. (2019). Evaluating financial support efficiency for innovation: A comparative study of the coastal and non-coastal regions of China. J. Coast. Res. 94 (9), 971. doi:10.2112/si94-191.1
Liu, Gang, and Jun-lin, Li. Coupling measurement analysis of scientific and technological innovation and financial development in China. Statistics Consult. 2021 (05), 30–32.
Luo, X., Huang, F., Tang, X., and Li, J. (2021). Government subsidies and firm performance: Evidence from high-tech start-ups in China. Emerg. Mark. Rev. 49, 100756. doi:10.1016/j.ememar.2020.100756
Martinez-Iranzo, M., Herrero, J. M., Sanchis, J., Blasco, X., and Garcia-Nieto, S. (2009). Applied Pareto multi-objective optimization by stochastic solvers. Eng. Appl. Artif. Intell. 22 (3), 455–465. doi:10.1016/j.engappai.2008.10.018
Sahin, F. D. (2000). Manufacturing competitiveness: Different systems to achieve the same results. Prod. Inventory Manag. J. 41 (1), 56–65.
Schertler, A. (2007). Knowledge capital and venture capital investments: New evidence from European panel data. Ger. Econ. Rev. 8 (8), 64–88. doi:10.1111/j.1468-0475.2007.00134.x
Vom Fachbereich InformatikScholkopf, Bernhard (2008). Support vector learning. Neural Netw. Official J. Int. Neural Netw. Soc. 27, 204–210.
Schumpeter, J. A. (1991). The theory of economics development. Cambridge: Harvard University Press, 129–131.
Smola, Alex J., and Scholkopf, Bernhard (2004). A tutorial on support vector regression. Statistics Comput. 14 (3), 199–222. doi:10.1023/b:stco.0000035301.49549.88
Soderblom, A., Samuelsson, M., Wiklund, J., and Sandberg, R. (2015). Inside the black box of outcome additionality: Effects of early-stage government subsidies on resource accumulation and new venture performance. Res. Policy 44 (8), 1501–1512. doi:10.1016/j.respol.2015.05.009
Wang, H., and Yu lian, X. U. (2012). A measure model for synergy degree between sci-tech innovation and sci-tech finance and its application. China Soft Sci. (06), 129–138.-qi
Wang, R., and Yang, M. (2018). Spatial agglomeration and dynamic evolution of the coupling efficiency of technology and finance system in China. Econ. Geogr. 38 (2), 104–112.
Xie, Si-xin, and Hu, Wei (2021). Coupling and coordination of high-quality economic development and scientific and technological innovation: Taking the beijing-tianjin-hebei region as an example. Stat. Decision 37 (14), 93–96.
Xin, M., and Liu, Z. B. (2018). The kernel-based nonlinear multivariate grey model. Appl. Math. Model. 56, 217–238. doi:10.1016/j.apm.2017.12.010
Yang, Qing, He, Ling, Liu, Xingxing, Pan, An′e., and Chen, Ruiqing (2020). A research on the temporal and spatial differentiation of coordinated development of the “Five in One” subsystems of urban TREES. Sci. Res. Manag. 41 (7), 11.
Zhang, Jiangpeng, Qiu, Tian, and Zhang, Pu (2019). Mechanism of synergetic development between science and technology finance and regional innovation system: An empirical analysis based on spatial metrology model. Sci. Technol. Manag. Res. 39 (7), 14–24.
Zhang, Ling, Guo, Ying-yuan, Zhang, Sheng, and Pan, Ying-wen (2019). Research on the supporting path of venture capital to technological enterprise innovation in the perspective of risk tolerance. Sci. Manag. Res. 37 (1), 86–89.
Zhang, Q., and Hui, L. (2008). MOEA/D: A multiobjective evolutionary algorithm based on decomposition. IEEE Trans. Evol. Comput. 11 (6), 712–731. doi:10.1109/tevc.2007.892759
Zhang, Zhiruo, and Gu, Guofeng (2020). The coupling relationship between sci-tech finance and regional economic development in China. Sci. Geogr. Sin. 40 (5), 751–759.
Zheng, Lei, and Zhang, Wei-ke (2018). The non-linear influence of tech-finance on tech-innovation—a U-shaped relationship. Soft Sci. 32 (7), 5.
Zhou, Detian, and Chaocai, Feng (2020). The coupling interaction between technology finance and high-quality economic development: Empirical analysis based on coupling degree and PVAR model. J. Technol. Econ. 39 (05), 107–115+141.
Keywords: technology finance, coupling coordination, grey prediction, objective optimization, index system
Citation: Yang Q, Cao L, Wang X, Wu X and Guo X (2022) Research on the coupling coordinated development evaluation of China’s provincial technological innovation and financial support based on KGM-MOP. Front. Environ. Sci. 10:1067772. doi: 10.3389/fenvs.2022.1067772
Received: 12 October 2022; Accepted: 21 November 2022;
Published: 02 December 2022.
Edited by:
Gul Jabeen, Harbin Institute of Technology, Shenzhen, ChinaReviewed by:
Sami Mnasri, University of Tabuk, Saudi ArabiaZhenkun Liu, Dongbei University of Finance and Economics, China
Copyright © 2022 Yang, Cao, Wang, Wu and Guo. This is an open-access article distributed under the terms of the Creative Commons Attribution License (CC BY). The use, distribution or reproduction in other forums is permitted, provided the original author(s) and the copyright owner(s) are credited and that the original publication in this journal is cited, in accordance with accepted academic practice. No use, distribution or reproduction is permitted which does not comply with these terms.
*Correspondence: Xiaohua Wang, wxh3707@whut.edu.cn; Xiuhui Guo, 1669065666@qq.com