Revealing effectiveness and heterogeneity of the impact of China’s coal consumption control policy on air quality
 Wenjuan Zhao
 Miao Chang1*
 - 1School of Environment, Tsinghua University, Beijing, China
- 2School of International Trade and Economics, University of International Business and Economics, Beijing, China
- 3China Petroleum Planning and Engineering Institute, CPPEI, Beijing, China
Whether China’s coal consumption control policy (CCCP) improves air quality is controversial. This study used city-level panel data and applied a DID model to identify it. We found that 1) The CCCP has a positive effect on AQI and PM25, which decrease by 7.6327 µg/m3 and 8.4293 µg/m3, respectively, but fails to reduce O3 concentration. 2) The effect of CCCP has regional heterogeneity. The CCCP has not significantly reduced PM2.5 emissions or improved air quality in the PRD region as in the BTHS and YRD regions. Additionally, in the YRD and PRD regions, CCCP can reduce O3 significantly. But the BTHS region failed to reduce the O3, and the introduction of CCCP made the O3 in pilot cities even higher by 4.1539 µg/m3. This study recognized the effects of the CCCP and its regional heterogeneity, which were supportive for policymakers to optimize coal-related policies to ensure environmental sustainability. We suggested that policymakers should differentiate policies according to regional differences and pay attention to reducing O3 pollution to establish sustainable ecosystems.
1 Introduction
The adoption of information and communication technologies (ICT) has progressively been known as crucial for economic affluence, over the last few decades, the rapid growth of China’s population and economy has made China the world’s largest energy consumer and producer (O'Meara, 2020; EIA, 2020; Jin et al., 2017; Mahfooz et al., 2017, Rasool, Jundong et al., 2017, Sohail, Mahfooz et al., 2017, Yen, Wang et al., 2017). Coal, the most polluting source (Barreira et al., 2017), has remained the dominant energy source in China over the past 20 years (see Figure 1). While the coal-based energy framework has contributed to the economic boom, it also poses significant challenges to China’s long-term development, i.e., aggravating environmental pollution (Yang & Teng, 2018; Sohail et al., 2022b; Sohail M. et al., 2022; Yang, Zhou et al., 2022; Zhao, Huangfu et al., 2022), causing substantial health damage (Yang et al., 2013; Sun et al., 2018), and accelerating climate change (Edwards, 2019). Among those problems, air pollution has developed into a major economic and social concern in China (Sohail et al., 2021a; Sohail et al., 2021b; Chen et al., 2022; Fami and Sohail 2022; Lan et al., 2022; Liu N. et al., 2022). According to the Global Burden of Diseases study, air pollution is one of the top five disease-related risk factors, affecting between 4 and 9 million deaths annually (Burnett et al., 2018; Christopher and Murray, 2019; Sohail et al., 2021a; Chai et al., 2021; Sohail et al., 2021c; Jian et al., 2021; Vohra et al., 2021; Lan et al., 2022). In response to these multiple challenges, China has identified coal control as a crucial measure for environmentally balanced development. In 2016, the National Development and Reform Commission (NDRC) released the 1Notice on Coal Consumption Reduction and Substitution, proposing a two-pronged initiative to control coal—“Reduction + Substitution”—to promote clean air and implement the goal of “dual control” of total energy consumption and energy intensity in polit city. However, as a command-and-control policy, the cost and effect of the CCCP have fueled debates, and the complexity is compounded by renewable energy subsidies. The core of this debate is whether the CCCP has a positive effect on air quality, as initially expected.
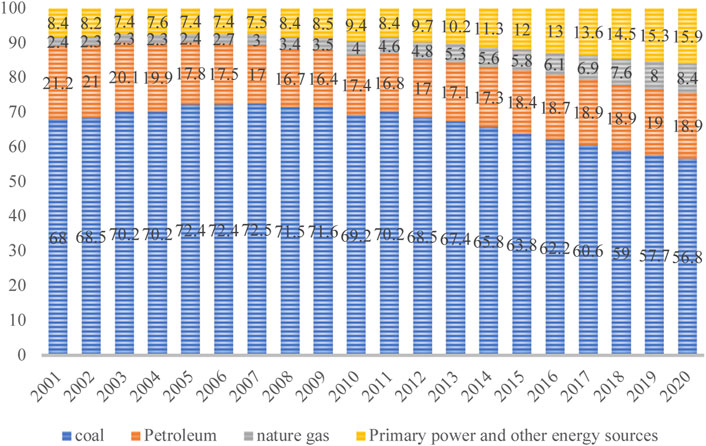
FIGURE 1. China’s total primary energy consumption 2001–2020 (%).
The academics who were confident about the CCCP acknowledged that the CCCP could help control the amount of pollution released. But the increase in air quality comes at the cost of reducing social welfare and economic development. Lin and Jia (2020), Shou et al. (2020) and Yang & Teng (2018) concluded that coal control measures would contribute to pollution reduction and carbon mitigation. While employing the developed CGE model, Xiao et al. (2020) found that coal-cutting policies will promote the environment but reduce residents’ consumption welfare, GDP growth, and employment. Zhang et al. (2021) also employed a scenario analysis model that predicts that the CCCP will inevitably reduce social welfare in the short run.
However, there are also some scholars who argue that CCCP is technically infeasible, which will lead not only to an increase in economic costs significantly (Shi et al., 2018; Mahfooz, Yasar et al., 2019; Sohail, Mahfooz et al., 2019; Zhao, Yen et al., 2019; Arif et al., 2020; Mahfooz et al., 2020; Sohail et al., 2020) but also not reduce air pollutant emissions. Some empirical studies supported this opinion. Using empirical data from the BTH region, Shi et al. (2018) have shown that CCCP fails to reduce SO2 emissions due to cost and technical constraints. Guo et al. (2020) also support the results by using realistic panel data from 289 Chinese cities; they find that only with the help of other supporting policies can CCCP reduce SO2 emissions as expected. According to the analyses shown in Figures 2A,B, the average Air Quality Index (AQI) has improved in almost all Chinese provinces from (2013 to 2015) to (2016 to 2019). Before and after the implementation of the CCCP, the distinction between CCCP pilot provinces and other provinces is insignificant. Therefore, it is unreasonable to attribute the improvement in air quality to CCCP. Whether the CCCP has successfully reduced air pollution is far from obvious.
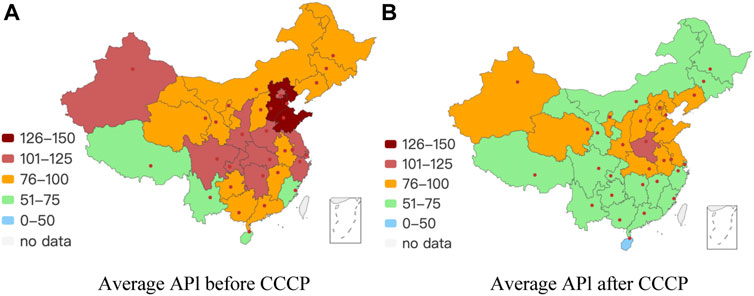
FIGURE 2. China’s provincial API before (2013–2015) and after (2016–2019) the implementation of CCCP.
As the different methodologies and the heterogeneous group of cities in the various studies, some uncertainty remains. With industrialization and urbanization, regional air pollution in China has seriously threatened people’s daily life and health. More than 50% of China’s population is exposed to unsafe air, and one-fifth of all deaths can be attributed to air pollution (Hsu et al., 2016), which kills between 1.2 million and 2 million people yearly (X. Yang et al., 2017). Specifically, the life expectancy of people living in urban areas north of the Huai River in China is about 5.5 years less than that of people living in other regions due to coal-fired heating in winter (Chen et al., 2013). Therefore, whether or not CCCP curbs air quality degradation has become one of the most important issues for environmental sustainability. In light of this debate, we quantitatively evaluate the impact of CCCP on air quality using actual data. The empirical findings would not only provide policymakers with strategies for implementing additional plans to improve air quality. Still, they would also serve as guidance for public health researchers developing interventions to create a healthy environment.
2 Materials and methods
2.1 Data
Data for this research was obtained from urban statistical yearbooks, China city statistical yearbooks, and China Air Quality Online Monitoring and Analysis Platform. Specifically, the data of AQI, PM2.5, and O3 are gathered from the “China Air Quality Online Monitoring and Analysis Platform” website, which provides daily data on air quality conditions in 367 cities across the country, with data sourced from the China Environmental Protection General Station. Additionally, we collect meteorological conditions at the city level, including indicators of temperature and precipitation from “2345 Weather.com,” which is sourced from the China Meteorological Administration. It should be noted that due to the city-level database being limited, few researchers pay attention to total energy consumption issues at the city level. To fill this gap, original data on 24 energy types are collected from the urban statistical yearbooks. The total energy consumption is then calculated by uniformly converting them to standard coal and adding them up. In addition, the 12 coal energies used by the industry are uniformly converted to standard coal and added to determine coal consumption. The remaining data are obtained from the China city statistical yearbooks. We removed cities lost to follow-up and invalid data, and 462 observations from 73 cities were maintained. All cities’ information is reported in Table A1. Table 1 provides descriptive statistics for the variables.
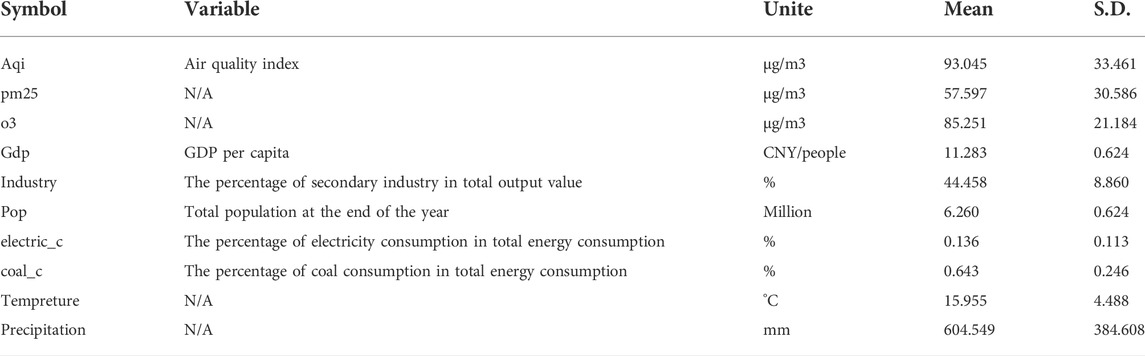
TABLE 1. Summary statistics of the variables.
2.2 Variables
2.2.1 Explanatory variables
The three explanatory variables in this paper are AQI, PM2.5, and O3. We take AQI, PM2.5, and O3 to measure air quality and pollution emissions.
AQI is a comprehensive key indicator of the status of air quality in a city. It is derived from the concentration limits of six individual pollutants (SO2, CO, NO2, O3, PM2.5, and PM10) and takes values from 0 to 500, with higher values representing poorer air quality conditions. The AQI is the main variable used to measure the effectiveness of air quality improvement.
The Global Burden of Disease (GBD) states that O3 and PM2.5 are typically used as indicators to measure the effects of air pollution on human health (Forouzanfar et al., 2016). Thus, in order to test the different effects of the CCCP on the concentrations of various pollutants, PM2.5 as well as O3 were also selected as explanatory variables, all of which are yearly data at the city level. Co-control of PM2.5 and O3 is an important target for environmental protection in the 14th Five-Year Plan period. With the strengthening of air pollution control in China in recent years, PM2.5 and other conventional pollutants have considerably improved. However, O3 concentrations are growing and have become the primary pollutant in many regions (Wang et al., 2017; Sohail et al., 2022a, Sohail et al., 2022b, Sohail and Chen 2022, Sohail et al., 2022c; Muhammad, Zhonghua et al., 2014, Sohail et al., 2014a, Sohail et al., 2014b, Sohail, Delin et al., 2015, Shahab et al., 2016). High near-surface O3 concentrations are major components of photochemical smog, which can damage air quality and adversely affect ecosystems. Controlling O3 has become a hot topic in current research (Liu et al., 2017; Chen et al., 2019; Wang et al., 2020; Hong et al., 2022, Liu Y. et al., 2022, Mustafa et al., 2022, Sohail et al., 2022d). Therefore, we chose PM2.5 as well as O3 as our explanatory variables to represent air quality improvement.
2.2.2 Explanatory variables
Explanatory variables: coal consumption control policy (CCCP), a dummy variable for the indicator selected in the base regression as coal consumption control policy.
2.2.3 Control variables
As air quality is also influenced by other factors, the following control variables have been introduced into the model.
Urban characteristics variables: Urban characteristics variables can reflect the development level, and there is a correlation between urban development level and urban air pollution, so controlling urban characteristics variables can eliminate some of the endogeneity. In the study, three indicators are selected to describe the characteristics of the cities and regions in the sample: total population, per capita gross regional product, and industrial structure.
Meteorological conditions variables: meteorological conditions can have a significant impact on air quality (Liu et al., 2020). We collect temperature and precipitation to represent meteorological conditions. The models all control for yearly average temperatures and precipitation.
Energy consumption characteristics variables: the production and consumption of energy is the principal source of human-caused air pollution (IEA, 2019). In the study, the percentage of electricity consumption in total energy consumption and the percentage of coal consumption in total energy consumption are used to measure the regional energy consumption structure.
2.3 Model
The CCCP, introduced in 2016, is expected to reduce air pollution and improve air quality. Additionally, the variables discussed above also affect both air pollution and air quality. CCCP, such a piloted policy can be regarded as a natural experiment, which enables us to explore CCCP’s relationship with air quality using a difference-in-differences (DID) specification. By partially controlling for trends in city air quality and pollution emissions that are across different regions, the DID can effectively eliminate the influence of unobservable factors and thus identify the net effects of the CCCP. In the study, the DID is employed to compare the difference in air quality between pilot and non-pilot cities before and after the implementation of the CCCP. Following (Beck et al., 2020), we set pilot cities as the treatment group and others as the control group to assess the impact of the CCCP implementation at the prefecture-level. The baseline regression model is set up as follows:
Cities in the treatment group: treat = 1, cities in the control group: treat = 0; When the year comes after the CCCP implements date: time = 1, otherwise time = 0; i and t are city and year, respectively; Y is the explanatory variables, representing the annual average concentrations of the AQI, PM2.5, and O3 at the city level; Xit is a set of control variables including lnpgdp, industry, lnpop, Coal_c, electricity_c, temperature, and precipitation; The core explanatory variable
3 Results and discussion
3.1 Basic estimation results
To comprehensively evaluate the impact of the CCCP on air quality improvement, AQI was first introduced as an explanatory variable in Model 1 for regression. Then regression analysis was conducted separately with the concentrations of PM25 and O3, two individual pollutants, as the explanatory variables. The regression results (as shown in Table 2) demonstrate that the AQI of the CCCP polit cities decreased by 7.6327 μg/m3, and the regression coefficients were significant at the 5% statistical level; the PM25 decreased significantly after the implementation of the CCCP by 8.4293 μg/m3 at the 1% statistical level. However, the O3 fell after the implementation of the policy by 4.3643 μg/m3 but not significant. The regression results verified the hypothesis that the CCCP effectively improved the air quality, but it failed to reduce O3, a new focus of pollution by the public and government.
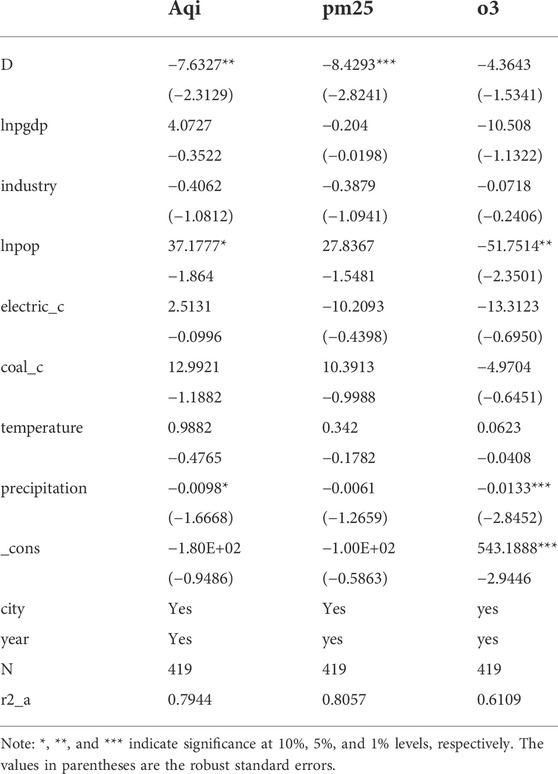
TABLE 2. Estimation results of the effects of CCCP.
Detailed, PM2.5 decreased obviously. PM2.5 is mostly produced by the combustion of fossil fuels and biomass (straw, firewood, etc.), road and construction dust, industrial dust, and other pollution sources directly discharged by particulate matter. The CCCP focuses on regulating the burning of loose coal and fossil fuels, which will undoubtedly lead to effective control of particulate matter emissions from air pollution. However, little is known about O3 pollution due in part to the lack of monitoring of atmospheric O3 and its precursors until recently (Wang et al., 2017).
Therefore, many scholars (Wang et al., 2020; Wang et al., 2021; Xiao et al., 2021) agree that it is urgent for the relevant departments to pay close attention to the O3 pollution problem and work together to decrease it and update policies to synchronous control the O3 and PM2.5.
3.2 Robustness test
3.2.1 Parallel trend
The DID approach is predicated on a series of assumptions. To ensure the robustness of results, our DID still needs a range of tests.
Before constructing the DID, it is necessary to test whether the parallel trend hypothesis is supported. Therefore, in this paper, the event study is employed to test the parallel trend hypothesis and the dynamic impact analysis of the policy. The test results are shown in Figures 3A–C, which highlight two important points: the reduction in AQI and PM2.5 did not occur prior to CCCP, and CCCP has a negative impact on AQI and PM2.5. In more detail, the coefficients of the AQI and PM2.5 for the 2 years before the CCCP are not significantly different from zero and do not show any trends, which suggests that the parallel trend assumption is satisfied. The coefficients of the AQI and PM2.5 are significantly less than 0 after the implementation of the CCCP and show significant decreasing trends, implying that CCCP has a negative effect on AQI and PM2.5. However, the parallel trend assumption of O3 is not satisfied, indicating the CCCP policy has not had a significant impact on O3 in the pilot cities.
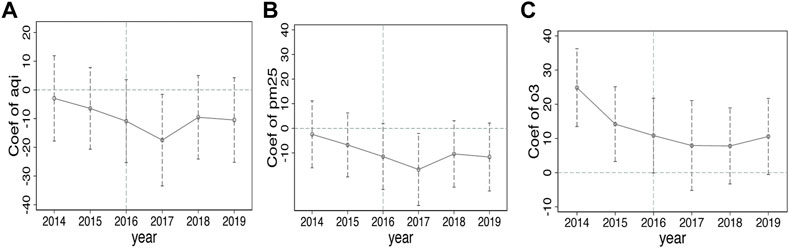
FIGURE 3. Parallel trend hypothesis test.
3.2.2 Placebo test: Re-grouping analysis
To ensure that the conclusions obtained in this paper are induced by CCCP rather than other factors, we randomly selected several virtual experimental groups in the sample and regressed them consistent with the DID basic regression to provide robustness assurance for the original findings. Specifically, we conducted a 1,000 sample among 73 cities, 40 cities were randomly selected as a pseudo-experimental group for each sampling, and for each individual pseudo-experimental group, 1 year was chosen randomly as its policy time.
Figures 4A,B shows the kernel density distribution and p-values of the estimated coefficients (the X-axis denotes the magnitude of the estimated coefficients of the “pseudo-policy dummy variables,” and the Y-axis indicates the magnitude of the density values and p-values). As seen, the estimated coefficients of the dummy pseudo-policies are mostly concentrated around 0. Whereas the true coefficients of the policies are all significant outliers; the p-values of most of the estimates are greater than 0.1 representing the CCCP pilot cities in these 40 samples without any significant effect.
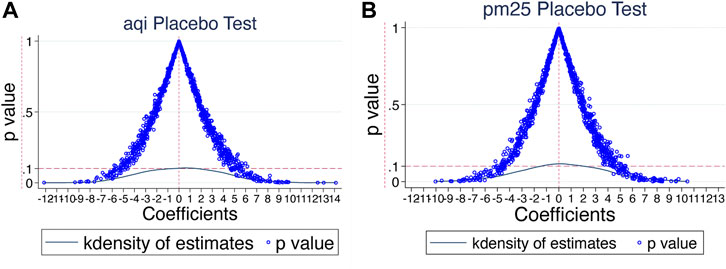
FIGURE 4. Placebo test.
Therefore, the conclusion of DID is again verified by the placebo test, which suggests that the effect of CCCP on AQI and PM25 has no causal relationship with other unknown factors.
4 Regional heterogeneity analysis
In this section, we implemented the estimation of regional heterogeneity. The reasons for implementing this estimation are two: 1) In the process of China’s urbanization, urban agglomerations have become the main spatial organizational form in China, and regionalized environmental management based on urban agglomerations has become a new trend. 2) There were differences in policies implemented between regions due to the inequality of resources, economic development, and geographical location. This study consolidates our study area into three key regions based on the priority areas defined by the CCCP policy and the needs of environmental management during the 14th Five-Year Plan period, namely: 1) The BTH region and surrounding areas(BTHS), including Tianjin, Beijing, Shijiazhuang, Tangshan, Handan, Weifang, Jinan, Qingdao, Jining, Nanyang, Zhengzhou; 2) the Yangtze River Delta region (YRD): Shanghai, Nanjing, Taizhou, Nantong, Jiaxing, Hefei, Suqian, Ningbo, Changzhou, Wenzhou, Wuxi, Yancheng, Huzhou, Suzhou, Shaoxing, Lianyungang, Zhenjiang, Jinhua, Maanshan; and 3) the Pearl River Delta region (PRD): Zhongshan, Foshan, Huizhou, Guangzhou, Shenzhen, Jiangmen, Zhuhai, Zhaoqing. Except for the above cities, the remaining cities are collectively referred to as non-focused cities for regional atmospheric management.
The regression results of the three regions are shown in Table 3. We can see that CCCP significantly reduces PM2.5 emissions and improves air quality in the BTHS region and YRD after controlling for other influencing factors. In contrast, in the PRD, air quality shows the opposite trend that does not decrease but increases.
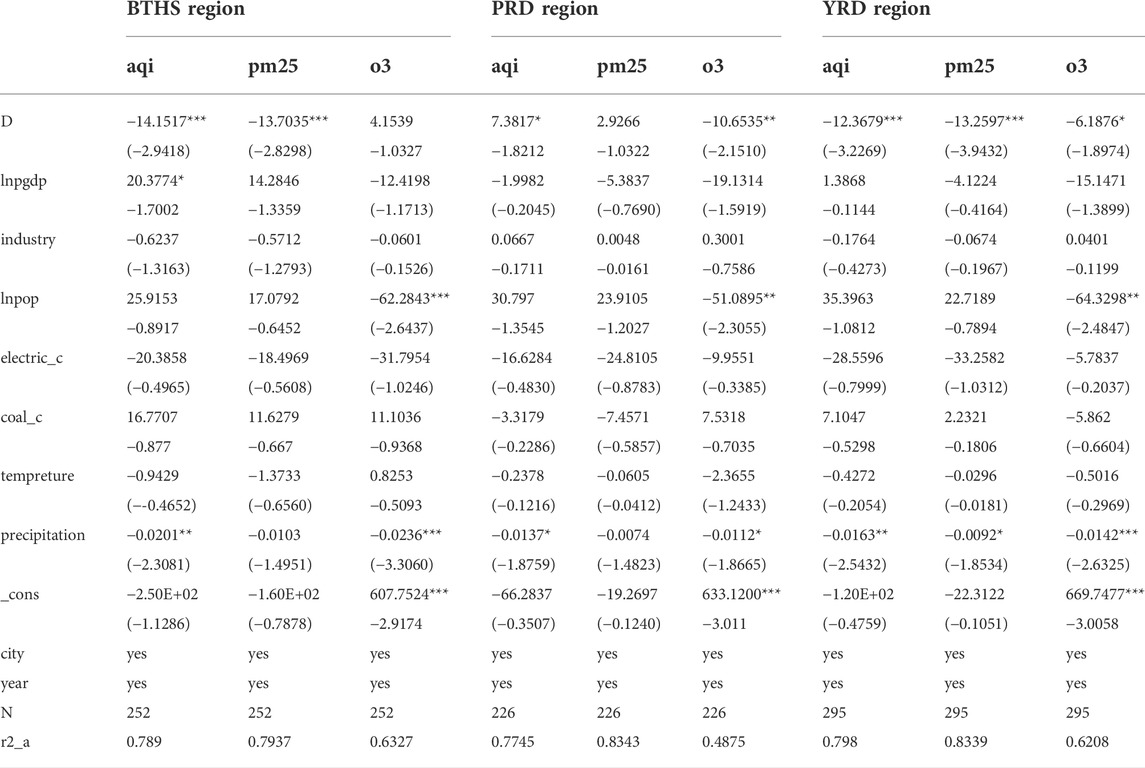
TABLE 3. Estimation results of the heterogeneity effects of CCCP.
Specifically, in the BTHS and YRD regions, CCCP can significantly reduce AQI by 14.1517 µg/m3 and 12.3679 µg/m3, respectively; CCCP can also reduce PM2.5 by 13.7035 µg/m3 and 13.2597 µg/m3, respectively, demonstrating that the introduction of CCCP reduces the emission of PM2.5 and improves the regional air quality significantly. There may be reasons for this result: In April 2014, the State Council put out a notice called “Notice on the Issuance of the Measures to Assess the Implementation of the Action Plan for the Prevention and Control of Air Pollution.” This notice made it clear that the percentage of reduction in PM2.5 and AQI would be the main basis for controlling air pollution, and the assessment measures reflected this. Furthermore, local governments have a strong motivation to increase the control of the pollutants since the public is more sensitive to PM2.5 and AQI in daily life.
CCCP can lower O3 by 6.1876 µg/m3 at the 10% significant level in the YRD region and 10.6535 µg/m3 at the 5% level in the PRD region. However, BTHS has not been able to do so, and the implementation of CCCP made O3 even higher in pilot cities by 4.1539 µg/m3. It might be that in the BTHS region, strong solar radiation and high summertime temperatures favor the development of O3. Especially in the BTHS region, the temperature in spring is lower than in summer; the dryness, low rainfall, and strong solar radiation make the meteorological conditions conducive to ozone production. Additionally, the high winds in springtime in the BTHS area make it easier for O3 to travel long distances, which is also a key reason why O3 levels in the area are higher than in other regions. And in the southern part of Hebei, where the mainstay industries are high emission industries such as iron, steel, oil refining, chemicals, and coal, resulting in higher O3 concentrations in summer in northern Hebei and cities such as Beijing and Tianjin.
What surprised us is that the CCCP has not reduced PM2.5 emissions and also improved the regional AQI in the PRD region. As a leading rapid economic development region in China, the PRD region has suffered from environmental problems such as air pollution earlier. Since 2014, Guangzhou has been the first in China to promote “ultra-clean emissions” from coal-fired power plants from the source of pollution. The environmental quality standards for the six primary pollutants have been met by the PRD for 4 years running as of 2015. It has also performed well in the three major pollution control regions in China, namely BTH, YRD, and PRD regions. Therefore, although the CCCP further adjusted the energy mix of the PRD region, it did not significantly impact the overall air quality due to the fact that the PRD region has already gotten rid of the air problem disturbance.
5 Conclusion and policy implementations
To improve air quality, China introduced the coal capacity cutting policy. Based on the background of such a policy, in this study, we have identified whether CCCP improves the quality using panel data of 73 cities from 2013 to 2019. Compared with previous studies, this paper reconciles the contradiction of the influence of CCCP on air quality by using realistic data. The result was robust, supported by a parallel trend test and re-grouping test.
The main results can be summarized as follows:
(1) This study has identified that the CCCP has reduced AQI and PM2.5 in the pilot cities by 7.6327 µg/m3 and 8.4293 µg/m3, respectively, as compared to other cities. CCCP also had a negative effect on O3, but it was not significant.
(2) The effect of CCCP has regional heterogeneity. The CCCP has not significantly reduced PM2.5 emissions or improved air quality in the PRD region as in the BTHS and YRD regions. Additionally, in the YRD and PRD regions, CCCP can reduce O3 significantly. But the BTHS region failed to reduce the O3, and the introduction of CCCP made the O3 in pilot cities even higher by 4.1539 µg/m3.
The aforementioned conclusions have important policy implications:
From the macro perspective, to comprehensively maintain the environmental effects of coal control-related policies, how to effectively reduce O3 concentration to establish a healthy environment should be focused on a sustainable topic. More work is required to ensure the anticipated effectiveness and lower O3 concentration. Firstly, scientific research is the foundation of pollution control policies. We should attach importance to scientific research on O3 pollution control. Secondly, policymakers should strengthen the construction of O3 monitoring networks to provide timely and comprehensive data support for the adjustment and evaluation of ozone prevention and control policies. Thirdly, focus on regional co-control of ozone pollution. The central government must take action to carry out organizational planning and regional coordination to achieve regional synergy and policy synergy in O3 prevention and control. Fourth, further restructuring the energy structure. Burning fossil fuels like oil and coal is the primary source of O3. To reduce O3 pollution in the long run, China needs to control its use of coal and work hard to develop green energy sources, increase its supply of renewable energy, and optimize its energy mix. From the micro perspective, under the trend of regionalized environmental management, the management of coal consumption control requires differentially implemented related policies according to regional differences. In summary, the effect of CCCP was estimated in this study, and the difference between regions showed that heterogeneity existed in CCCP. The results suggest the role of coal-related policies in environmental sustainability in the age of environmental-concentration prevalence. This study was conducted in China, so results of this study maybe use for China.
Data availability statement
The original contributions presented in the study are included in the article/supplementary material, further inquiries can be directed to the corresponding author.
Author contributions
WZ: Software, validation, data curation, writing—original draft. MC: Formal analysis, conceptualization, supervision, visualization. JH: Methodology, writing—review and editing, project administration, funding acquisition. LY: Conceptualization, writing—review and editing, funding acquisition.
Conflict of interest
The authors declare that the research was conducted in the absence of any commercial or financial relationships that could be construed as a potential conflict of interest.
Publisher’s note
All claims expressed in this article are solely those of the authors and do not necessarily represent those of their affiliated organizations, or those of the publisher, the editors and the reviewers. Any product that may be evaluated in this article, or claim that may be made by its manufacturer, is not guaranteed or endorsed by the publisher.
Footnotes
1Notice on Coal Consumption Reduction and Substitution in year 2016 defined the new group of CCCP pilot areas: the Beijing-Tianjin-Hebei and surrounding Region; the Yangtze River Delta region Area, the Pearl River Delta Area.
Appendix
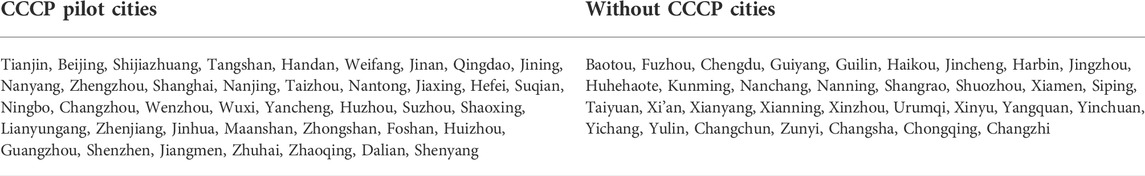
TABLE A1. List of 73 cities.
References
Arif, U., and Sohail, M. T. (2020). Asset pricing with higher Co-moments and CVaR: Evidence from Pakistan stock exchange. Int. J. Econ. Financial Issues 10 (5), 243–255. doi:10.32479/ijefi.10351
Barreira, A., Patierno, M., and Ruiz Bautista, C. (2017). Impacts of pollution on our health and the planet: The case of coal power plants.
Beck, T., Levine, R., and Levkov, A. (2020). Big bad banks? The winners and losers from bank deregulation in the United States. J. Finance 65, 1637–1667. doi:10.1111/j.1540-6261.2010.01589.x
Burnett, R., Chen, H., Szyszkowicz, M., Fann, N., Hubbell, B., Pope, C. A., et al. (2018). Global estimates of mortality associated with long-term exposure to outdoor fine particulate matter. Proc. Natl. Acad. Sci. U. S. A. 115 (38), 9592–9597. doi:10.1073/pnas.1803222115
Chai, M., Deng, Y., and Sohail, M. T. (2021). “Study on synergistic mechanism of water environment governance in dongting lake basin based on evolutionary game,” in E3S Web of Conferences, EDP Sciences.
Chen, S., Sohail, M. T., and Yang, M. (2022). Examining the effects of information and communications technology on green growth and environmental performance, socio-economic and environmental cost of technology generation: A pathway toward environment sustainability. Front. Psychol. 13, 999045. doi:10.3389/fpsyg.2022.999045
Chen, X., Situ, S., Zhang, Q., Wang, X., Sha, C., Zhouc, L., et al. (2019). The synergetic control of NO2 and O3 concentrations in a manufacturing city of southern China. Atmos. Environ. 201, 402–416. doi:10.1016/j.atmosenv.2018.12.021
Chen, Y., Jin, G. Z., Kumar, N., and Shi, G. (2013). The promise of Beijing: Evaluating the impact of the 2008 Olympic Games on air quality. J. Environ. Econ. Manag. 66 (3), 424–443. doi:10.1016/j.jeem.2013.06.005
Christopher, P., Murray, J. L., Zheng, P., Abbafati, C., Abbas, K. M., Abbasi-Kangevari, M., et al. (2019). Global burden of 87 risk factors in 204 countries and territories, 1990-2019: A systematic analysis for the global burden of disease study 2019. Lancet 396, 1223–1249. doi:10.1016/S0140-6736(20)30752-2
Edwards, G. A. S. (2019). Coal and climate change. Wiley interdisciplinary reviews: Climate change. doi:10.1002/wcc.607.Eia.gov.2022
EIA (2020). International - U.S. Energy information administration (EIA). Available at https://www.eia.gov/international/analysis/country/CHN (Accessed July 13, 2022).
Fami, L., and Sohail, M. (2022). Exploring the effects of natural capital depletion and natural disasters on happiness and human wellbeing: A study in China. Front. Psychol. 13, 870623. doi:10.3389/fpsyg.2022.870623
Forouzanfar, M. H., Afshin, A., Alexander, L. T., Anderson, H. R., Bhutta, Z. A., Biryukov, S., et al. (2016). Global, regional, and national comparative risk assessment of 79 behavioural, environmental and occupational, and metabolic risks or clusters of risks, 1990–2015: A systematic analysis for the global burden of disease study 2015. Lancet 388 (10053), 1659–1724. doi:10.1016/s0140-6736(16)31679-8
Guo, S., Xiao, B., and Song, L. (2020). Emission reduction and energy-intensity enhancement: The expected and unexpected consequences of China’s coal consumption constraint policy. J. Clean. Prod. 271, 122691. doi:10.1016/j.jclepro.2020.122691
Hong, Q., Cui, L., and Hong, P. (2022). The impact of carbon emissions trading on energy efficiency: Evidence from quasi-experiment in China’s carbon emissions trading pilot. Energy Econ. 110, 106025.
Hsu, A., Esty, D. C., Levy, M. A., and Sherbinin, A. D. (2016). 2016 environmental performance Index (EPI). doi:10.13140/RG.2.2.19868.90249
IEA (2019). Multiple benefits of energy efficiency. https://www.iea.org/reports/multiple-benefits-of-energy-efficiency.
Jian, L., Sohail, M. T., Ullah, S., and Majeed, M. T. (2021). Examining the role of non-economic factors in energy consumption and CO2 emissions in China: Policy options for the green economy. Environ. Sci. Pollut. Res. 28 (47), 67667–67676. doi:10.1007/s11356-021-15359-3
Jin, Y., Andersson, H., and Zhang, S. (2017). China’s cap on coal and the efficiency of local interventions: A benefit-cost analysis of phasing out coal in power plants and in households in beijing. J. Benefit. Cost. Anal. 8 (2), 147–186. doi:10.1017/bca.2017.10
Lan, H., Cheng, C., and Sohail, M. T. (2022). Asymmetric determinants of CO2 emissions in China: Do government size and economic size matter? Environ. Sci. Pollut. Res. 29, 47225–47232. doi:10.1007/s11356-022-19096-z
Lin, B., and Jia, Z. (2020). Economic, energy and environmental impact of coal-to-electricity policy in China: A dynamic recursive CGE study. Sci. Total Environ. 698, 134241. doi:10.1016/j.scitotenv.2019.134241
Liu, X., Zhang, S., and Bae, J. (2017). The impact of renewable energy and agriculture on carbon dioxide emissions: Investigating the environmental Kuznets curve in four selected ASEAN countries. J. Clean. Prod. 164, 1239–1247.
Liu, N., Hong, C., and Sohail, M. T. (2022). Does financial inclusion and education limit CO2 emissions in China? A new perspective. Environ. Sci. Pollut. Res. 29 (13), 18452–18459. doi:10.1007/s11356-021-17032-1
Liu, Y., Sohail, M. T., Khan, A., and Majeed, M. T. (2022). Environmental benefit of clean energy consumption: Can BRICS economies achieve environmental sustainability through human capital? Environ. Sci. Pollut. Res. 29 (5), 6766–6776. doi:10.1007/s11356-021-16167-5
Liu, Y., Zhou, Y., and Lu, J. (2020). Exploring the relationship between air pollution and meteorological conditions in China under environmental governance. Sci. Rep. 10 (1), 14518. doi:10.1038/s41598-020-71338-7
Mahfooz, Y., Yasar, A., Guijian, L., Yousaf, B., Sohail, M. T., Khan, S., et al. (2020). An assessment of wastewater pollution, treatment efficiency and management in a semi-arid urban area of Pakistan. Desalination Water Treat. 177, 167–175. doi:10.5004/dwt.2020.24949
Mahfooz, Y., Yasar, A., Sohail, M. T., Tabinda, A. B., Rasheed, R., Irshad, S., et al. (2019). Investigating the drinking and surface water quality and associated health risks in a semi-arid multi-industrial metropolis (Faisalabad), Pakistan. Environ. Sci. Pollut. Res. 26 (20), 20853–20865. doi:10.1007/s11356-019-05367-9
Mahfooz, Y., Yasar, A., Tabinda, A. B., Sohail, M. T., Siddiqua, A., and Mahmood, S. (2017). Quantification of the River Ravi pollution load and oxidation pond treatment to improve the drain water quality. Desalin Water Treat. 85, 132–137. doi:10.5004/dwt.2017.21195
Muhammad, A. M., Zhonghua, T., Dawood, A. S., and Sohail, M. T. (2014). A study to investigate and compare groundwater quality in adjacent areas of landfill sites in lahore city. Nat. Environ. Pollut. Technol. 13 (1).
Mustafa, S., Sohail, M. T., Alroobaea, R., Rubaiee, S., Anas, A., Othman, A. M., et al. (2022). Éclaircissement to understand consumers’ decision-making psyche and gender effects, a fuzzy set qualitative comparative analysis. Front. Psychol. 13, 920594. doi:10.3389/fpsyg.2022.920594
O'Meara, S. (2020). China's plan to cut coal and boost green growth. Nature 584, S1–S3. doi:10.1038/d41586-020-02464-5
Rasool, A., Jundong, H., and Sohail, M. T. (2017). Relationship of intrinsic and extrinsic rewards on job motivation and job satisfaction of expatriates in China. J. Appl. Sci. 17 (3), 116–125. doi:10.3923/jas.2017.116.125
Shahab, A., Shihua, Q., Rashid, A., Hasan, F. U., and Sohail, M. T. (2016). Evaluation of water quality for drinking and agricultural suitability in the lower indus plain in sindh province, Pakistan. Pol. J. Environ. Stud. 25 (6), 2563–2574.
Shi, X., Rioux, B., and Galkin, P. (2018). Unintended consequences of China’s coal capacity cut policy. Energy Policy 113, 478–486. doi:10.1016/j.enpol.2017.11.034
Shou, M.-H., Wang, Z.-X., Li, D.-D., and Wang, Y. (2020). Assessment of the air pollution emission reduction effect of the coal substitution policy in China: An improved grey modelling approach. Environ. Sci. Pollut. Res. 27 (27), 34357–34368. doi:10.1007/s11356-020-09435-3
Sohail, M., Elkaeed, E., Irfan, M., Acevedo-Duque, Á., and Mustafa, S. (2022c). Agricultural communities’ risk assessment and the effects of climate change: A pathway toward green productivity and sustainable development. Front. Environ. Sci. 10, 900193. doi:10.3389/fenvs.2022.948016
Sohail, M. T., Aftab, R., Mahfooz, Y., Yasar, A., Yen, Y., Shaikh, S. A., et al. (2019). Estimation of water quality, management and risk assessment in Khyber Pakhtunkhwa and Gilgit-Baltistan, Pakistan. Desalination Water Treat. 171, 105–114. doi:10.5004/dwt.2019.24925
Sohail, M. T., and Chen, S. (2022). A systematic PLS-SEM Approach on assessment of indigenous knowledge in adapting to floods; A way forward to sustainable agriculture. Front. Plant Sci. 13, 990785. doi:10.3389/fpls.2022.990785
Sohail, M. T., Delin, H., Siddiq, A., Idrees, F., and Arshad, S. (2015). Evaluation of historic Indo-Pak relations, water resource issues and its impact on contemporary bilateral affairs. Asia Pac. J. Multidiscip. Res. 3 (1).
Sohail, M. T., Delin, H., and Siddiq, A. (2014a). Indus basin waters a main resource of water in Pakistan: An analytical approach. Curr. World Environ. 9 (3), 670–685. doi:10.12944/cwe.9.3.16
Sohail, M. T., Delin, H., Talib, M. A., Xiaoqing, X., and Akhtar, M. M. (2014b). An analysis of environmental law in Pakistan-policy and conditions of implementation. Res. J. Appl. Sci. Eng. Technol. 8 (5), 644–653. doi:10.19026/rjaset.8.1017
Sohail, M. T., Ehsan, M., Riaz, S., Elkaeed, E. B., Awwad, N. S., and Ibrahium, H. A. (2022a). Investigating the drinking water quality and associated health risks in metropolis area of Pakistan. Front. Mat. 9, 864254. doi:10.3389/fmats.2022.864254
Sohail, M. T., Elkaeed, E. B., Irfan, M., Acevedo-Duque, Á., and Mustafa, S. (2022d). Determining farmers’ awareness about climate change mitigation and wastewater irrigation: A pathway toward green and sustainable development. Front. Environ. Sci. 499.
Sohail, M. T., Mahfooz, Y., Aftab, R., Yen, Y., Talib, M. A., and Rasool, A. (2020). Water quality and health risk of public drinking water sources: A study of filtration plants installed in rawalpindi and islamabad, Pakistan. Desalination Water Treat. 181, 239–250. doi:10.5004/dwt.2020.25119
Sohail, M. T., Mahfooz, Y., Hussain, S., Khan, M. B., and Hadi, N. U. (2017). Abasyn journal of social science, 10.Impacts of landfill sites on groundwater quality in lahore, Pakistan
Sohail, M. T., Majeed, M. T., Shaikh, P. A., and Andlib, Z. (2022b). Environmental costs of political instability in Pakistan: Policy options for clean energy consumption and environment. Environ. Sci. Pollut. Res. 29 (17), 25184–25193. doi:10.1007/s11356-021-17646-5
Sohail, M. T., Ullah, S., Majeed, M. T., Usman, A., and Andlib, Z. (2021b). The shadow economy in south asia: Dynamic effects on clean energy consumption and environmental pollution. Environ. Sci. Pollut. Res. 28 (23), 29265–29275. doi:10.1007/s11356-021-12690-7
Sohail, M. T., Ullah, S., Majeed, M. T., and Usman, A. (2021a). Pakistan management of green transportation and environmental pollution: A nonlinear ARDL analysis. Environ. Sci. Pollut. Res. 28 (23), 29046–29055. doi:10.1007/s11356-021-12654-x
Sohail, M. T., Xiuyuan, Y., Usman, A., Majeed, M. T., and Ullah, S. (2021c). Renewable energy and non-renewable energy consumption: Assessing the asymmetric role of monetary policy uncertainty in energy consumption. Environ. Sci. Pollut. Res. 28 (24), 31575–31584. doi:10.1007/s11356-021-12867-0
Sun, D., Fang, J., and Sun, J. (2018). Health-related benefits of air quality improvement from coal control in China: Evidence from the Jing-Jin-Ji region. Resour. Conservation Recycl. 129, 416–423. doi:10.1016/j.resconrec.2016.09.021
Vohra, K., Vodonos, A., Schwartz, J., Marais, E. A., Sulprizio, M. P., and Mickley, L. J. (2021). Global mortality from outdoor fine particle pollution generated by fossil fuel combustion: Results from GEOS-Chem. Environ. Res. 195, 110754. doi:10.1016/j.envres.2021.110754
Wang, F., Qiu, X., Cao, J., Peng, L., Zhang, N., Yan, Y., et al. (2021). Policy-driven changes in the health risk of PM2.5 and O3 exposure in China during 2013–2018. Sci. Total Environ. 757, 143775. doi:10.1016/j.scitotenv.2020.143775
Wang, M., Chen, W., Zhang, L., Qin, W., Zhang, Y., Zhang, X., et al. (2020). Ozone pollution characteristics and sensitivity analysis using an observation-based model in Nanjing, Yangtze River Delta Region of China. J. Environ. Sci. 93, 13–22. doi:10.1016/j.jes.2020.02.027
Wang, T., Xue, L., Brimblecombe, P., Lam, Y. F., Li, L., and Zhang, L. (2017). Ozone pollution in China: A review of concentrations, meteorological influences, chemical precursors, and effects. Sci. Total Environ. 575, 1582–1596. doi:10.1016/j.scitotenv.2016.10.081
Xiao, K., Li, F., Dong, C., Cai, Y., Li, Y., Ye, P., et al. (2020). Unraveling effects of coal output cut policy on air pollution abatement in China using a CGE model. J. Clean. Prod. 269, 122369. doi:10.1016/j.jclepro.2020.122369
Xiao, Q., Geng, G., Xue, T., Liu, S., Cai, C., He, K., et al. (2021). Tracking PM2.5 and O3 pollution and the related health burden in China 2013–2020. Environ. Sci. Technol. 56, 6922–6932. doi:10.1021/acs.est.1c04548
Yang, A., Zhou, X., Sohail, M. T., Rizwanullah, M., and Dai, B. (2022). Analysis of factors influencing public employees’ work cognition under a public health crisis: A survey of China’s response to covid. Front. Public Health 10, 938402. doi:10.3389/fpubh.2022.938402
Yang, G., Wang, Y., Zeng, Y., Gao, G. F., Liang, X., Zhou, M., et al. (2013). Rapid health transition in China, 1990–2010: Findings from the global burden of disease study 2010. Lancet 381 (9882), 1987–2015. doi:10.1016/s0140-6736(13)61097-1
Yang, X., and Teng, F. (2018). The air quality co-benefit of coal control strategy in China. Resour. Conservation Recycl. 129, 373–382. doi:10.1016/j.resconrec.2016.08.011
Yang, X., Wang, S., Zhang, W., Zhan, D., and Li, J. (2017). The impact of anthropogenic emissions and meteorological conditions on the spatial variation of ambient SO2 concentrations: A panel study of 113 Chinese cities. Sci. Total Environ. 584 (585), 318–328. doi:10.1016/j.scitotenv.2016.12.145
Yen, Y., Wang, Z., Shi, Y., Xu, F., Soeung, B., Sohail, M. T., et al. (2017). The predictors of the behavioral intention to the use of urban green spaces: The perspectives of young residents in Phnom Penh, Cambodia. Habitat Int. 64, 98–108. doi:10.1016/j.habitatint.2017.04.009
Zhang, Y., Shi, X., Qian, X., Chen, S., and Nie, R. (2021). Macroeconomic effect of energy transition to carbon neutrality: Evidence from China’s coal capacity cut policy. Energy Policy 155, 112374. doi:10.1016/j.enpol.2021.112374
Zhao, P., Yen, Y., Bailey, E., and Sohail, M. T. (2019). Analysis of urban drivable and walkable street networks of the ASEAN Smart Cities Network. ISPRS Int. J. Geoinf. 8 (10), 459. doi:10.3390/ijgi8100459
Keywords: environmental sustainability, air quality, economy, coal, GIS, China
Citation: Zhao W, Chang M, Huangfu J and Yu L (2022) Revealing effectiveness and heterogeneity of the impact of China’s coal consumption control policy on air quality. Front. Environ. Sci. 10:1050736. doi: 10.3389/fenvs.2022.1050736
Received: 22 September 2022; Accepted: 07 October 2022;
Published: 01 November 2022.
Edited by:
Muhammad Majeed, Quaid-i-Azam University, PakistanReviewed by:
Muhammad Afaq Haider Jafri, Beijing University of Technology, ChinaMuhsan Ehsan, Bahria University, Pakistan
Copyright © 2022 Zhao, Chang, Huangfu and Yu. This is an open-access article distributed under the terms of the Creative Commons Attribution License (CC BY). The use, distribution or reproduction in other forums is permitted, provided the original author(s) and the copyright owner(s) are credited and that the original publication in this journal is cited, in accordance with accepted academic practice. No use, distribution or reproduction is permitted which does not comply with these terms.
*Correspondence: Miao Chang, changmiao@tsinghua.edu.cn