Tracing carbon emissions convergence along the way to participate in global value chains: A spatial econometric approach for emerging market countries
 Yuting Cai1,2
  Xinze Qian
 Muhammad Nadeem
 Shamsheer Ul Haq
- 1Nanjing University of Aeronautics and Astronautics, Nanjing, China
- 2Wuxi City Vocational and Technical College, Jiangsu, China
- 3Carrol School of Management, Boston College, Chestnut Hill, MA, United States
- 4College of Economics and Management, Nanjing University of Aeronautics and Astronautics, Nanjing, China
- 5School of International Trade and Economics, University of International Business and Economics, Beijing, China
- 6Department of Economics, Division of Management and Administrative Science University of Education, Lahore, Pakistan
The proliferation of trade agreements has offered a viable framework for the economic and trade integration of many nations. Additionally, the growth and expansion of global value chains has increased prospects for knowledge and technological spillovers as well as the potential for production method convergence. This might have possible effects on the environment in both developed and developing nations. The objective of this study is to determine whether participation in global value chains (GVCs) can serve as a foundation for the convergence of carbon emission across nations. Spatial panel data econometrics is used to examine data from 22 emerging economies between 1995 and 2019 in order to provide an answer. The findings support the global value chains-based conditional carbon convergence of the countries and show a spatial link between global value chains participation and CO2 growth. Furthermore, results show that increasing global value chains participation with other variables; both directly and indirectly, via spillover effects, encourages closing the CO2 emission gap across nations. The findings show that global value chains may be able to increase how successful carbon efficiency initiatives are. Therefore, when developing environmental legislation, many aspects of global value chains participation and their advantages should be considered.
1 Introduction
Over the past 3 decades, the effects of trade on the environment and greenhouse gas emissions have been among the contentious issues in the economic literature. Further the global climate change is significantly impacted by industrial upgrading and international production cooperation. It is still challenging to evaluate whether trade is beneficial for the environment or not (Frankel and Rose, 2005). Trade agreements and integrations have increased the likelihood of the eventual convergence of environmental indicators of different countries, aside from how trade affects the environment (Baghdadi et al., 2013; Apergis and Payne, 2020; Shahzad et al., 2022). The advent of global value chains (GVCs) participation and the globalization of production, among other significant changes in trade and globalization processes, have increased chances for trade integration and the expansion of knowledge and technology transfers across nations.
The structure and organization of international trade have been fundamentally altered by the recent rise in the number of trade agreements and the emergence of GVCs participation, which account for more than half of all trade globally. This has sparked the growth of global production networks and massive bilateral trade, especially for intermediate goods. Additionally, this new wave of globalization has altered the relationships between developed and emerging nations while redefining the frontiers of knowledge, production structure, and comparative advantages among various nations (Baldwin, 2017). GVCs have facilitated the transfer of technological innovations, skills, and knowledge from developed countries to developing countries, allowing developing countries to enter international markets and reap potential benefits without having to develop ancillary industries and revert to the local production of all necessary inputs (Rodrik, 2018; Jangam and Rath, 2020).
The objective of this study is to determine if GVCs may serve as a foundation for national carbon convergence and how growing GVC membership impacts carbon convergence development. The answers to these queries can help to partially fill the literature gap that how this new kind of trade can close the carbon emission gap between nations and how increasing GVC participation can be a tactic to slow down environmental deterioration. The solutions might even show that this novel kind of trade is both harmful and advantageous to the environment. Thomakos and Alexopoulos (2016) accept that carbon emission is the Environmental Performance Index’s greatest explanatory variable. These are, in other words, two sides of the same coin. As a result, carbon emission changes can accurately gauge a nation’s environmental performance. If we can determine how GVCs participation influence countries’ carbon emission changes, we can then generalize it to environmental performance, take advantage of GVC capabilities to create environmental protection policies and regulations, and come to multilateral climate change mitigation agreements. Expanding GVCs participation may thereby increase prospects for the participating nations’ environmental performance to converge. However, in order to validate or disprove such assumptions, empirical studies are necessary, which is why this study was conducted.
This article is unique in its novelty to identify and assess the impact of GVCs participation with other variables in CO2 convergence among EMCs and its selection of the countries is based on the Morgan Stanley Capital International Emerging Market Index criteria (the MSCI Index). The interdependence of trade in intermediate goods and foreign direct investment (FDI) has increased as a result of GVCs participation, and the MSCI index asserts that its designation of countries as emerging markets is due to the long-captivated imagination of investors that continued to reshape the global investment and trade landscape to embrace these countries over the past 20 years. (see Appendix 1)
The remainder of this essay is structured as follows: The history of the research and theoretical underpinnings are reviewed in Sections 2 and 3. In Section 4, the data analysis approach is introduced, and Section 5 presents the findings. Section 6 then discusses the findings and presents the conclusions.
2 Literature review
To the best of our knowledge, no research has been done on how GVCs participation can help countries with their environmental performance. However, some research has focused on how trade and foreign direct investment (FDI) affect how energy intensity and carbon emissions are converged. The global value chain (GVC) not only bridges trade gaps among partner nations but also produces multifaceted reciprocal benefits through technological spillover and industrial technology consolidation. The GVC participation produces credible environmental outcomes, and two perspectives exist among researchers on the relationship between the GVC and the environment (Wu et al., 2020). One of the perspectives looked at the “pollution heaven” hypothesis and the possible damage to the environment in developing countries because of trade with developed countries. According to the second perspective, GVC participation positively affects the environment through technology development and transfer, as well as has positive spillover effects on the economy.
As GVCs participation proliferate around the world, developing economies have been able to adopt technical innovations, skills, and knowledge from developed countries (Jangam and Rath, 2020), without the need to establish auxiliary industries, restore production of all necessary inputs, or develop the national value chain (Rodrik, 2018). In this way, developing countries are able to achieve static and dynamic efficiency, which can increase their value addition and per capita income (Kummritz, 2016). The increase in per capita income and the adoption of new technologies as a result of GVC participation encourage economies to reduce environmental threats. Participation in GVCs promotes long-term environmentally friendly economic growth by increasing the per capita real gross domestic product (GDP). However, as more countries participate in GVCs, CO2 emissions rise, but they fall as per capita GDP rises (Wang et al., 2022). Moreover, modern environmental-friendly technologies’ adoption and prevention of environmental deterioration are also associated with GVC participation (Jiang and Liu, 2015; Song and Wang, 2017), so the countries participating in GVC can combat climate change through increasing their carbon efficiency and bridging the carbon intensity gap among countries (Kazem et al., 2021). Therefore, in favor of GVC, it might not be awkward to say that the GVC can help countries protect the environment through the development and spillover of environmentally friendly technologies (Lovely and Popp, 2011; Nemati et al., 2019). GVC promotes the diffusion of technology, the sharing of technical information, and reduces carbon emissions (Javorcik, 2002; De Marchi et al., 2018). Landsperger and Spieth (2011) describe how the embedment in GVC augments the low-carbon innovation competences of global corporations. This low-carbon innovation competency tends to increase long-term competitive advantages as well as low-carbon technology adoption (Uyarra et al., 2016; Sears, 2017; Shahzad et al., 2022). Zhang et al. (2020) reported that a 1% rise in the degree of China’s participation in GVC reduced carbon intensity by 11.7%. Similarly, Liu and Zhao (2021) described the negative relationship of GVC participation with carbon emission intensity based on the analysis of 42 countries. Countries that are part of the GVC must meet international standards for good quality products and environmental certification. This has led them to cut back on their carbon emissions in order to stay in the GVC (Wu et al., 2020).
On the other hand, some scholars have argued that participation in GVC contributes to environmental degradation (Liu et al., 2018), while the expanding participation in GVC enhances the use of energy and CO2 emissions. They are concerned that the great differences in technology and industrial structure of the countries or regions also contributed to the major difference in GVC participation as well as the impact on carbon intensity (Wang et al., 2021a; Zhang et al., 2021). For example, developing countries have the advantages of capital and technology over developing countries, thereby occupying the upstream of the GVC of various industries. Therefore, these countries and regions are responsible for the links of high value addition, such as product development, product design in GVC, and low carbon intensity (Wang et al., 2020; Jin et al., 2022). On the other hand, the developing countries stay at GVC’s downstream end, which prevents them from getting potential benefits from GVC due to their labor and energy-intensive processing and assembling parts (Sun et al., 2019). Similarly, the developing countries at the tail and in the middle of GVC have to make hard efforts to expand their production of GVC while simultaneously addressing the resultant environmental degradation. They also have to focus on the core environmental interests of energy preservation, sustainable growth, and extreme cuts in CO2 (Shahzad et al., 2021). Therefore, GVC results in the transmission of hazardous particles and polluting agents from developed economies to underdeveloped economies. The extensive differences in GVC participation and carbon intensity between developed and developing countries generate environmental threats in developing countries, such as a rise in CO2 intensity. The GVC’s participation degree of developed countries significantly reduces carbon intensity, while that of developing countries actually increases their carbon intensity. In addition, industries in developing countries with low CO2 intensity see a big rise in CO2 intensity (Jin et al., 2022). Elhedji and Merrick (2012) and Bonilla et al. (2015) found that country participation in GVC is linked to the long distances between the nodes in GVC distribution networks. This long distance increases the chance that logistics and transportation will emit grater amount of CO2. Poulsen et al. (2018) say that the logistics and transportation used to move different GVCs from one country to another country or one region to another region is one of the main sources of air pollution. This is why it is important for GVCs to have environmentally friendly logistics and transportation.
3 Theoretical background
In the economic literature, there are various points of view on how trade and the environment are related. Some address the pollution haven hypothesis (PHH) and the possible deterioration of the environment in developing nations through trade with industrialized countries, while others argue the beneficial environmental implications of trade through technological development and transfer and spillover effects. However, some contend that trade harms the environment because it expands economic activities that are already environmentally destructive and motivates polluting nations to engage in more extensive high-polluting activities (Copeland and Taylor, 2013; Weber et al., 2021). The creation and spread of environmentally benign technologies can therefore assist safeguard the environment (Lovely and Popp, 2011; Nemati et al., 2019), but commerce can also contribute to environmental degradation, as stated by the pollution haven hypothesis and the factor endowment theory (Antweiler et al., 2001; Shen, 2008; Cherniwchan et al., 2017).
International trade has long been practiced by nations (e.g., developing countries import parts and technology to produce and supply goods to the domestic market). In contrast to more traditional trade approaches, the new type of commerce has boosted the use of international production networks by the countries, strengthened knowledge information transfers (Taglioni et al., 2016), and facilitated more knowledge spillovers. Because the outsourcer delivers the required knowledge and technology to the input producer firm to ensure the inputs are produced efficiently and in accordance with its production standards, information can move more readily throughout the supply chain (Piermartini and Rubnová, 2014).
GVCs can improve both static efficiency (i.e., altering current processes and capacities) and dynamic efficiency by reallocating scarce resources to the most lucrative activities (i.e., creating new processes and capacities). The growth of GVCs is anticipated to increase per capita income, investment, productivity, and green domestic value-added output, as demonstrated by Kummritz (2016) and Hu et al. (2022). Participation in global supply networks and production networks can also result in learning-by-doing advantages, economies of scale, technological advancements and spillovers, and even speed up the industrialization process and the growth of the nation’s service sector (Bernhardt and Pollak, 2016; Kummritz, 2016; Taglioni et al., 2016; Gunnella et al., 2019; Raei et al., 2019; Pigato et al., 2020). Markusen (1984) also makes the case that the expansion of multinational corporations (a crucial component of GVCs) is connected to the development in global technical efficiency because there is evidence of technology spillovers as a result of their operations (Keller, 2010).
Expanding membership in GVCs has benefits and repercussions that go beyond economic expansion. For instance, the development of GVCs and the exchange of intermediate inputs can both enhance South-South trade (Hanson, 2012). Additionally, growing GVCs may result in changes to international trade policy as well as intensified shock transmission, synchronized global business cycles, and changes to specialization patterns (Wang et al., 2017). The impact of GVCs on national environmental performance and their part in environmental phenomena, however, have not received much attention in the pertinent literature.
The integration of GVCs with technical advancement and transfer will raise the countries’ income level, perhaps facilitating the convergence of some of their economic indicators (Rodrik, 2018), if GVCs promote the convergence of production processes as envisaged (Ignatenko et al., 2019). According to the evidence now available, trade, trade integration, and regional cooperation aid in the convergence of a country’s energy efficiency, energy intensity, and environmental performance (Wang et al., 2015; Han et al., 2018; Qi et al., 2019). To eliminate trade frictions and enhance trade flows, trade integration necessitates adjustments to the nations’ current standards and regulations (including environmental standards and regulations) (Nicoletti et al., 2003) (Holzinger et al. 2008) also demonstrated how strengthening international ties will cause the environmental policies of the participating nations to converge. The development of low-CI production technologies, information transfer, and sustainable management are all aided by the growth of international firms (López et al., 2019).
On the other hand, the new kind of commerce may not only assist nations in convergent growth by balancing the costs of production factors, but also enhance national environmental performance by boosting technology spillovers and environmentally friendly knowledge. The spillover, diffusion, and transfer of cleaner technology to nations with lower energy and environmental efficiency, particularly developing nations, will advance technical advancement and enhance environmental performance (Gerlagh and Kuik, 2014; Huang et al., 2020; Jaffe et al., 2002; LeSage and Fischer, 2008; Wan et al., 2015). According to Jiang et al. (2019), countries with trading partners who are technologically advanced release less carbon because they are permitted to share the resources they create with their main trading partners. Furthermore, the exchange of information among businesses in GVCs might hasten the development of eco-friendly technologies. The growth of GVCs may potentially result in more economical and cost-effective technologies for the production and use of clean, efficient energy sources.
Following the theoretical framework discussed above, we can claim that expanding GVCs may offer more possibilities for the convergence of the environmental performances of the selected countries. However, empirical testing will be necessary to support or reject such hypotheses, and this study’s main goal is to accomplish that objective.
4 Data and methodology
4.1 Spatial autocorrelation
In order to determine whether there is a GVC-based association between nations’ rates of CO2 expansion, this study looks at that first. It then looks into how increased GVC participation affects the countries’ CO2 convergence. Participation in GVCs may have spillover consequences that are also discussed. Therefore, it is essential to use proper statistical approaches that can predict spillover effects as well as take into account the spatial dimensions of the statistical data. The next subsections will go over the geographic statistics that were employed in this study’s data analysis for the variables described in Table 1.
where MI stands for Moran’s I,
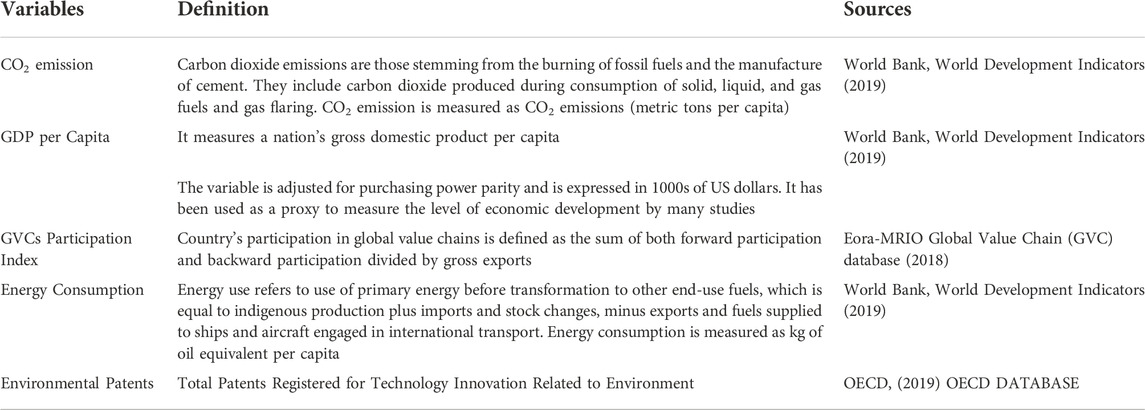
TABLE 1. Variables description and data sources.
In this equation, GC stands for Geary’s GC, which has a value between 0 and 2. Positive autocorrelation is associated with values less than 1, whereas negative autocorrelation is associated with values higher than 1. By assuming spatial randomness under the normal distribution, one can investigate the importance of Geary’s GC and Moran’s MI.
We created the inverse GVCs-based distance spatial matrix for each nation before performing the spatial autocorrelation assessment. Given that the study area contains major emerging economies and that most of the nations are close to one another and have a compact spatial distribution, the inverse GVCs-based distance spatial matrix was deemed adequate for the calculation:
Based on the above discussed analysis of the GVCs-augmented carbon convergence,
4.2 Spatial panel data regression
The potential correlation of CO2 emission growth between countries i and j as a result of their GVC-based relationship is measured by spatial autocorrelation. To determine whether there is a CO2 growth convergence and how growing GVCs impact this convergence, spatial panel data regression is used. Additionally, it points out potential GVC spillover effects. These models are particularly crucial because, according to Anselin (2003a), certain phenomena—such as neighborhood effects and the race to the bottom—are examples of interactions between economic agents, necessitating the employment of interactive and spatial models to study them.
The Spatial Lag Model (SLM), the Spatial Error Model (SEM), and the Spatial Durbin Model (SDM) are the three types of regularly used spatial econometric panel data models (LeSage and Pace, 2009). The SLM model presupposes that the spatial mean weight of the dependent variables of a section’s neighbors as well as external regressors have an impact on the observed value of the dependent variable in that section. Following is the way to present the regression:
(1) Spatial lag model (SAR)
(2) Spatial error model
(3) Spatial Durbin Model
In this equation,
The interactional effects between the error components are also taken into consideration by SEM. When independent factors that were not included in the regression have an impact on the interacting effects of the sections, this model is more significant. The following is a presentation of this model:
The spatial autocorrelation coefficient, which measures the impact of neighboring sections’ residuals on each section’s residual, is denoted by
The SDM model combines the SEM and SLM models. The vector of spatial autocorrelation coefficients of the explanatory variables in this model is denoted by the symbol γ. The model becomes a SAR if γ = 0 and α≠0; otherwise, it becomes a SEM if γ = -βα. As a result, the SDM model, which also contains the SEM and SLM models, is a testable broad specification (LeSage and Pace, 2009).
Due to spatial correlation in spatial regressions, the coefficients of the explanatory variables do not adequately reflect the final effects of the variables. Additionally, due of geographical links and real-time feedback, the model includes both direct and indirect (spillover) impacts. As a result, estimating the direct and indirect impacts is required rather than interpreting point estimate coefficients. According to SDM, we have:
It has the spatial multiplier matrix
With respect to the explanatory variables k in other sections, the matrix of partial derivatives of the dependent variable (GVCs) in various parts at any time t is equal to:
It can also be expressed more succinctly as follows:
As a result, the mean direct effects of a unit of change in the explanatory variables
Total effect:
Direct effect:
Indirect effect:
As a result, by calculating the subsequent SDM, the following effects of GVC involvement and their contribution to carbon convergence can be assessed:
In which, respectively, CO2 emission, GVC, and x stand for carbon intensity, GVC participation, and a vector of other variables describing CO2, such as real per capita income (Y), technological innovations and energy consumption (EC) [other components are the same as Eq. 3]. In order to interpret the regression findings, the direct, indirect (spillover), and total effects are computed for each variable after the aforementioned regression is estimated using the maximum likelihood (ML) approach. Additionally, conditional convergence must be established if the total effect of
4.3 Data
A set of chosen countries’ economic and GVC-based trade data was used to elaborate our objectives. Carbon emissions (CO2) are taken as CO2 emissions (metric tons per capita). Real per capita income (i.e., GDP at constant 2010 USD divided by population), energy consumption as per kilogram equivalent of crude oil, environmental patents is used as environmental friendly technology and innovation measure and its data is taken as number of applications for patens within given time period, are also added to the model as regressors. The World Bank’s WDI Database was used to extract data for 22 EMC countries for the years 1995–2019. Further the selection of the countries is based on the Morgan Stanly Index (MSI) and detail of this index is given in Appendix A.
The GVC participation index, which was developed by Koopman et al. (2010), is the most well-known indicator of a nation’s participation in GVCs. This index is produced by adding the foreign value added in domestic export (backward participation) and the domestic value added in foreign export (forward participation). The range of the value is 0–100. The more the value, the greater the country’s participation in GVC, i.e., the prevalence of trade in intermediate goods in overall trade and the fragmentation of the production process According to this method, country i’s level of GVC participation at time t is equivalent to:
In which
5 Results
We experimentally examined the economic data of 22 emerging market countries from 1995 to 2019 based on the 4 selected indicators. Table 2 displays descriptive data for the variables considered in this analysis.
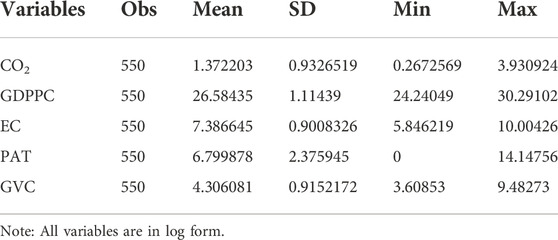
TABLE 2. Descriptive statistics.
In order to assess the GVC-based spatial autocorrelation of the country’s carbon emission growth, Moran’s MI and Geary’s GC are first estimated. The variable whose spatial autocorrelation is evaluated is the carbon emission increase of each nation from 1995 to 2019, and the weight matrix is created using Eq. 3. The study’s primary goal is to find out whether the carbon emission growth of the nations with bilateral value-added trade correlates with one another. The findings of Moran’s MI and Geary’s GC are shown in Table 3. Both coefficients showed the GVC-based positive spatial at a 95% confidence level, the null hypothesis of spatial randomness indicated by autocorrelation of CO2 growth is rejected in both tests.
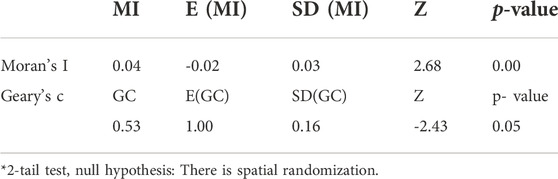
TABLE 3. Spatial autocorrelation of CO2 growth.
As a result, inside GVCs, nations with comparable carbon emission growth rates are nearer to one another. To put it another way, there is a correlation between nations with higher bilateral value-added trade. This is known as spatial clustering in spatial econometrics. This space in this study is GVC-based trade. Biasing is a term used to describe what happens when spatial factors are not taken into account when estimating a regression.
In order to assess the carbon emission growth convergence of the countries, spatial data panel regressions are performed after the spatial autocorrelation is estimated. Table 4 displays the panel unit root results and Table 5 reports SAR, SEM, and SDM outcomes. To compare their coefficients with the spatial regressions, the results of fixed-effects (FE) panel regression are also presented.
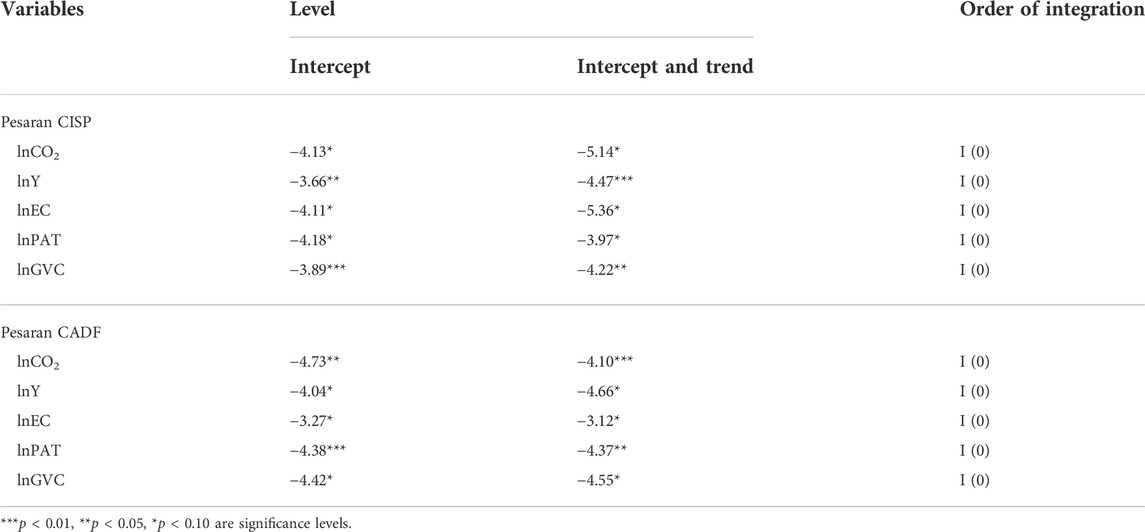
TABLE 4. Pesaran’s (2007) unit root test results.
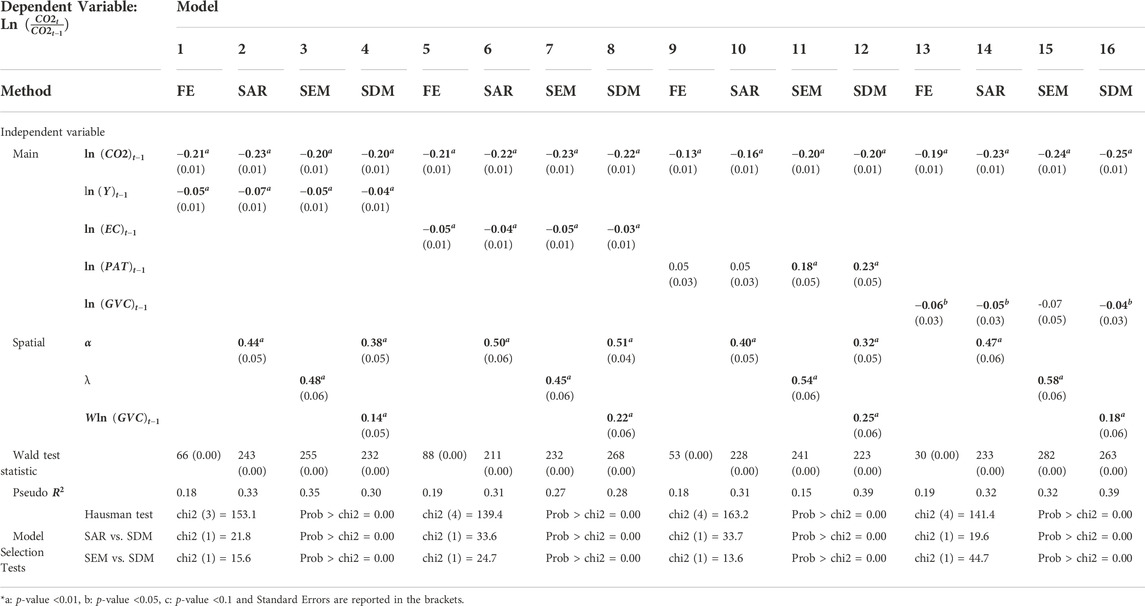
TABLE 5. Estimated spatial panel data regressions.
No matter whether the trend is included or excluded, Table 4 shows the results of the unit root tests for all the selected series at various levels. According to the findings, every variable is stationary at the first difference, or at I (0). Given that all the series are stationary at level or I (0), we can use spatial panel data approach to attain the results of GVCs-augmented CO2 convergence model for emerging market countries.
Before analyzing the findings, specification and model selection tests are evaluated. All regressions’ significance is validated by the Wald test’s findings. According to the Hausman specification test, FE regression is preferable to random effects. The model selection experiments further demonstrate that SDM is favored over SAR and SEM. Further the results suggested that SDM is the best regression model. The α coefficient in regression shows a positive spatial autocorrelation, and the coefficient in SEM demonstrates the same conclusion. Since spatial regression has spillover effects, taking into account Moran’s MI and Geary’s GC, the direct, indirect, and total effects in Table 6 should be determined by using Eqs. 12–15 in order to interpret the coefficients of the variables. Convergence rates in all of the regressions vary from 0 to 1, and conditional convergence is not disregarded. Additionally, as compared to FE regressions, the spatial regression has a far larger explanatory power and a lower conditional convergence rate. This may be a result of the regression models’ exclusion of spillover effects. It follows that the rate of carbon emission conditional convergence is accelerated by GVC-based spatial spillover effects. As a result, the relevant driving factors have a spatial impact on the CO2 convergence in emerging market countries, further showing that if the spatial effect is ignored, it may result in incorrect empirical results. The regression coefficients of independent variables in the spatial panel model are unable to capture the marginal effects of dependent variable. To examine the effect of each variable on the CO2 convergence, the spatial impacts should be split into direct effects, indirect effects, and total effects using partial differential equations.
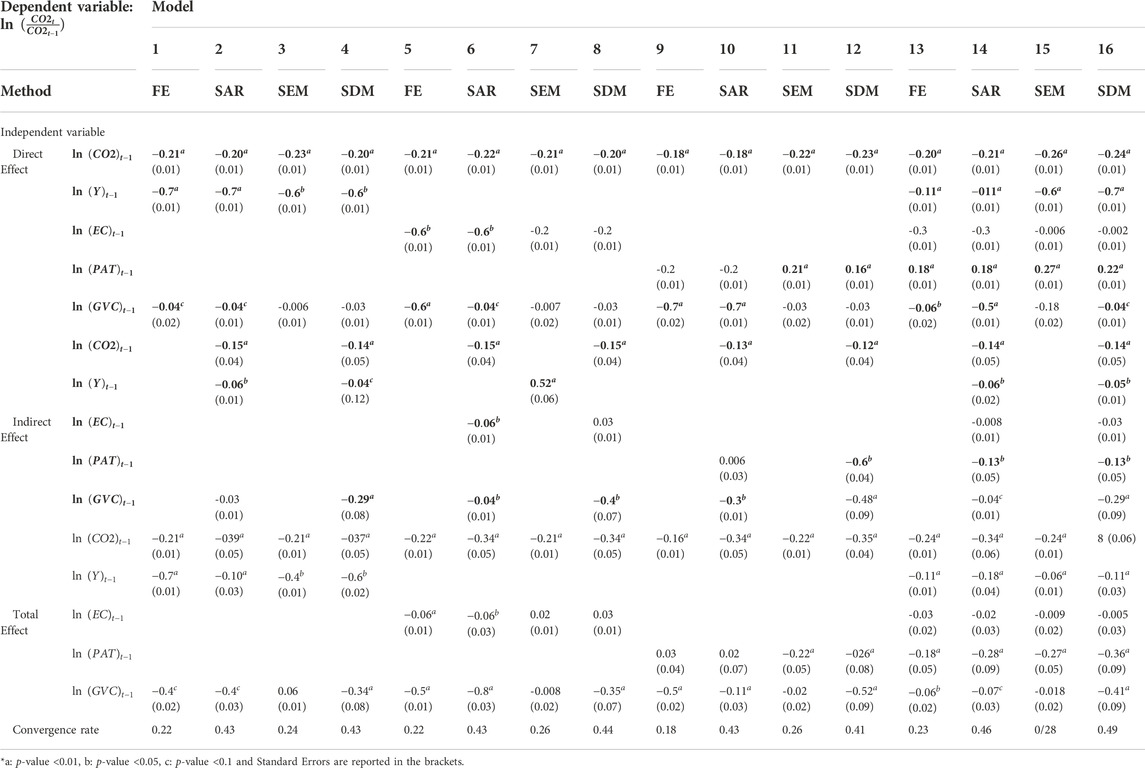
TABLE 6. Estimated direct effects, indirect effects, and total effects; and the conditional convergence of CO2 emission.
According to the direct negative effect of
The outcomes show that the participation in GVCs has considerable direct, indirect, and overall effects on carbon emission convergence. As a result, it may be said that increasing GVC participation can aid in slowing carbon emission expansion and promoting its conditional convergence in emerging market countries (EMCs). When the indirect (spillover) impacts of bilateral value-added trade or GVC-based trade are taken into account, this link becomes more pronounced. This implies that raising and extending involvement in GVCs will slow the carbon emission growth in emerging market countries (EMCs). In actuality, increasing participation in GVCs has an impact on both the countries’ and their trading partners’ carbon emission growth. Expanding engagement in GVCs can result in technological advancements, learning-by-doing, knowledge spillovers, economic growth, and improved wellbeing in countries under analysis. By enhancing technological innovations, promoting the use of cleaner energy sources, and raising demand for environmental protection laws and regulations, these possible advancements can improve carbon emission convergence.
6 Conclusion and policy recommendations
Participation in global value chains (GVCs) offer a new mode of value-added trade that enables nations to take advantage of their comparative advantages in production tasks after transforming the structure and processes of production in emerging nations. The environmental advantages and downsides of GVC-based trade are among the contentious issues in the economic literature, in addition to the economic advantages of increased participation in GVCs. In order to ascertain whether value-added based on GVCs could help in the CO2 convergence of the emerging markets (EMCs); this study examined the role of GVCs in the environmental performance of countries. The study assessed how participation in GVCs affected the countries’ CO2 growth. Modeling and analysis of the data gathered from 22 nations between 1995 and 2019 used spatial econometric approach. Empirical analysis revealed a link between CO2 growth and countries with greater bilateral GVC-based trade. Additionally, the conditional convergence of EMCs in terms of CO2 growth was confirmed when taking into account the GVC-based trade between nations. The findings also show that increasing country participation in GVCs has an impact on the CO2 growth of its trading partners in addition to reducing country CO2 growth through spillover effects. Therefore, emerging market countries’ environmental performance will generally increase if it has GVC-based trading partners who have superior environmental performance.
Additionally, it may be said that this new kind of value-added trade offers different opportunities for EMCs, in particular, to get access to their trading partners’ knowledge and technology for economic and environmental goals. Accordingly, the promotion of production processes and their adaptation to the global production structure can be encouraged by the need to adapt local production processes to global processes within GVCs framework. Further, emerging market countries’ environmental policies are more likely to align in the setting of GVC-based trade. Multinational corporations, for instance, that outsource their production processes within GVCs, are likely to pass technology and knowledge to their partners in partner nations as well as demand that they abide by a number of rules and regulations, including environmental norms. Additionally, GVCs could be a platform for enhancing national environmental performance or at least lowering CO2 growth and bringing environmental convergence together in emerging market countries.
The findings indicate that environmental policies and actions to prevent climate change should take GVC capacities into account in countries under analysis. The findings demonstrated that, notwithstanding the presence of carbon leakage in trade, increasing country’s participation in GVCs increased the carbon efficiency, which is an essential (albeit insufficient) step in attaining environmental goals in EMCs. A good way for EMCs to improve their environmental performance is to increase value-added trade with nations that are moving toward greater carbon efficiency.
By examining the CO2 correlation and conditional convergence of emerging market countries within the setting of GVC-based trade, this study adds to the empirical literature on the relationship between value-added trade and the environment. Another aspect of GVCs trade is that value added trade enables to upgrade regional environmentally sustainable technological infrastructure, but due to industrial isomorphism and a lack of unified dispatch, there is fierce competition among regions, which increases value added trade in one region at the expense of other regions’ participation opportunities. At the same time, the upgrading of industrial structure caused by the increase of value added trade in other regions has led to the outflow of relevant natural resource factors in other regions, thus affecting their environmental sustainability. To better understand the role of GVCs in the convergence of the emerging market countries’ environmental performance; more research must be done on the topic, particularly on the production of greenhouse gases and pollutants like CO2. Future studies should individually evaluate various GVC environmental impact mechanisms in order to better understand the scope, makeup, and technological consequences of expanding GVCs on environmental performance among emerging market countries.
Data availability statement
The datasets presented in this study can be found in online repositories. The names of the repository/repositories and accession number(s) can be found below: https://www.scopus.com/authid/detail.uri?authorId = 57208878403.
Author contributions
Conceptualization, MN, YC and ZW; methodology, MN; software, SH; validation, MN; formal analysis, YC; investigation, YC; resources, YC; data collection, YC; MN writing—original draft preparation, MN; writing—review and editing, YC an MN. The contributions of both newly added authors is the analysis of data and results interpretation of the study All authors have read and agreed to the published version of the manuscript.
Funding
National Social Science Foundation of China (20ZDA092).
Conflict of interest
The authors declare that the research was conducted in the absence of any commercial or financial relationships that could be construed as a potential conflict of interest.
Publisher’s note
All claims expressed in this article are solely those of the authors and do not necessarily represent those of their affiliated organizations, or those of the publisher, the editors and the reviewers. Any product that may be evaluated in this article, or claim that may be made by its manufacturer, is not guaranteed or endorsed by the publisher.
References
Anselin, L. (2001b). Spatial econometrics. A companion Theor. Econ., 310. 330. doi:10.1002/9780470996249.ch15
Anselin, L. (2003a). Spatial externalities, spatial multipliers, and spatial econometrics. Int. regional Sci. Rev. 26 (2), 153–166. doi:10.1177/0160017602250972
Antweiler, W., Copeland, B. R., and Taylor, M. S. (2001). Is free trade good for the environment? Am. Econ. Rev. 91 (4), 877–908. doi:10.1257/aer.91.4.877
Apergis, N., and Payne, J. E. (2020). NAFTA and the convergence of CO2 emissions intensity and its determinants. Int. Econ. 161, 1–9. doi:10.1016/j.inteco.2019.10.002
Awad, A. (2019). Does economic integration damage or benefit the environment? Africa's experience. Energy Policy 132, 991–999. doi:10.1016/j.enpol.2019.06.072
Baghdadi, L., Martinez-Zarzoso, I., and Zitouna, H. (2013). Are RTA agreements with environmental provisions reducing emissions? J. Int. Econ. 90 (2), 378–390. doi:10.1016/j.jinteco.2013.04.001
Baldwin, R. (2018). “The great convergence,” in The great convergence (Harvard University Press). doi:10.17323/1726-3247-2017-5-40-51
Bernhardt, T., and Pollak, R. (2016). Economic and social upgrading dynamics in global manufacturing value chains: A comparative analysis. Environ. Plan. A 48 (7), 1220–1243. doi:10.1177/0308518X15614683
Bonilla, D., Keller, H., and Schmiele, J. (2015). Climate policy and solutions for green supply chains: Europe’s predicament. Supply Chain Manag. Int. J. 20, 249–263. doi:10.1108/scm-05-2014-0171
Casella, B., Bolwijn, R., Moran, D., and Kanemoto, K. (2019). UNCTAD insights: Improving the analysis of global value chains: The UNCTAD-eora Database. Transnatl. Corp. 26 (3), 115–142. doi:10.18356/3aad0f6a-en
Cherniwchan, J., Copeland, B. R., and Taylor, M. S. (2017). Trade and the environment: New methods, measurements, and results. Annu. Rev. Econom. 9, 59–85. doi:10.1146/annurev-economics-063016-103756
Coe, N. M. (2014). Missing links: Logistics, governance and upgrading in a shifting global economy. Rev. Int. Political Econ. 21 (1), 224–256. doi:10.1080/09692290.2013.766230
Conley, T. G., and Topa, G. (2002). Socio-economic distance and spatial patterns in unemployment. J. Appl. Econ. Chichester. Engl. 17 (4), 303–327. doi:10.1002/jae.670
Copeland, B. R., and Taylor, M. S. (2013). Trade and the environment. International trade and the environment. Princeton university press. doi:10.2307/3552527
Cotlier, G. I., and Jimenez, J. C. (2022). The extreme heat wave over western north America in 2021: An assessment by means of land surface temperature. Remote Sens. 14 (3), 561. doi:10.3390/rs14030561
De Marchi, V., Giuliani, E., and Rabellotti, R. (2018). Do global value chains offer developing countries learning and innovation opportunities? Eur. J. Dev. Res. 30 (3), 389–407. doi:10.1057/s41287-017-0126-z
Elhedhli, S., and Merrick, R. (2012). Green supply chain network design to reduce carbon emissions. Transp. Res. Part D Transp. Environ. 17 (5), 370–379. doi:10.1016/j.trd.2012.02.002
Frankel, J. A., and Rose, A. K. (2005). Is trade good or bad for the environment? Sorting out the causality. Rev. Econ. statistics 87 (1), 85–91. doi:10.1162/0034653053327577
Gerlagh, R., and Kuik, O. (2014). Spill or leak? Carbon leakage with international technology spillovers: A cge analysis. Energy Econ. 45, 381–388. doi:10.1016/j.eneco.2014.07.017
Gunnella, V., Al-Haschimi, A., Benkovskis, K., Chiacchio, F., de Soyres, F., Di Lupidio, B., et al. (2019). The impact of global value chains on the euro area economy (No. 221). European Central Bank.
Han, L., Han, B., Shi, X., Su, B., Lv, X., and Lei, X. (2018). Energy efficiency convergence across countries in the context of China’s Belt and Road initiative. Appl. Energy 213, 112–122. doi:10.1016/j.apenergy.2018.01.030
Hanson, G. H. (2012). The rise of middle kingdoms: Emerging economies in global trade. J. Econ. Perspect. 26 (2), 41–64. doi:10.1257/jep.26.2.41
Holzinger, K., Knill, C., and Sommerer, T. (2008). Environmental policy convergence: The impact of international harmonization, transnational communication, and regulatory competition. Int. Organ. 62 (4), 553–587. doi:10.1017/S002081830808020X
Hu, D., Jiao, J., Tang, Y., Xu, Y., and Zha, J. (2022). How global value chain participation affects green technology innovation processes: A moderated mediation model. Technol. Soc. 68, 101916. doi:10.1016/j.techsoc.2022.101916
Huang, R., Chen, G., Lv, G., Malik, A., Shi, X., and Xie, X. (2020). The effect of technology spillover on CO2 emissions embodied in China-Australia trade. Energy Policy 144, 111544. doi:10.1016/j.enpol.2020.111544
Jaffe, A. B., Newell, R. G., and Stavins, R. N. (2002). Environmental policy and technological change. Environ. Resour. Econ. 22 (1), 41–70. doi:10.1023/a:1015519401088
Jangam, B. P., and Rath, B. N. (2020). Cross-country convergence in global value chains: Evidence from club convergence analysis. Int. Econ. 163, 134–146. doi:10.1016/j.inteco.2020.06.002
Javorcik, B. S. (2002). Does foreign direct investment increase the productivity of domestic firms? In search of spillovers through backward linkages, Policy Research Working Papers. doi:10.1596/1813-9450-2923
Jiang, M., An, H., Gao, X., Liu, S., and Xi, X. (2019). Factors driving global carbon emissions: A complex network perspective. Resour. Conservation Recycl. 146, 431–440. doi:10.1016/j.resconrec.2019.04.012
Jiang, X., and Liu, Y. (2015). Global value chain, trade and carbon: Case of information and communication technology manufacturing sector. Energy Sustain. Dev. 25, 1–7. doi:10.1016/j.esd.2014.12.001
Jin, Z., Wang, J., Yang, M., and Tang, Z. (2022). The effects of participation in global value chains on energy intensity: Evidence from international industry-level decomposition. Energy Strategy Reviews 39, 100780.
Kalkhan, M. A. (2011). Spatial statistics: Geospatial information modeling and thematic mapping. CRC Press.
Keller, W. (2010)., 2. North-Holland, 793–829. doi:10.1016/S0169-7218(10)02003-4International trade, foreign direct investment, and technology spilloversHandb. Econ. Innovation
Koopman, R., Wang, Z., and Wei, S. J. (2014). Tracing value-added and double counting in gross exports. Am. Econ. Rev. 104 (2), 459–494. doi:10.1257/aer.104.2.459
Kummritz, V. (2016). Do global value chains cause industrial development? (No. BOOK). The Graduate Institute of International and Development Studies, Centre for Trade and Economic Integration.
Landsperger, J., and Spieth, P. (2011). Managing innovation networks in the industrial goods sector. Int. J. Innov. Mgt. 15, 1209–1241. doi:10.1142/S1363919611003714
LeSage, J., and Pace, R. K. (2009). Introduction to spatial econometrics. Chapman and Hall/CRC. doi:10.1201/9781420064254
LeSage, J. P., and Fischer, M. M. (2008). Spatial growth regressions: Model specification, estimation and interpretation. Spat. Econ. Anal. 3 (3), 275–304. doi:10.1080/17421770802353758
Levin, A., Lin, C. F., and Chu, C. S. J. (2002). Unit root tests in panel data: Asymptotic and finite-sample properties. Journal of Econometrics 108 (1), 1–24.
Liu, C., and Zhao, G. (2021). Can global value chain participation affect embodied carbon emission intensity? J. Clean. Prod. 287, 125069. doi:10.1016/j.jclepro.2020.125069
Liu, H., Li, J., Long, H., Li, Z., and Le, C. (2018). Promoting energy and environmental efficiency within a positive feedback loop: Insights from global value chain. Energy Policy 121, 175–184. doi:10.1016/j.enpol.2018.06.024
López, L. A., Cadarso, M. Á., Zafrilla, J., and Arce, G. (2019). The carbon footprint of the US multinationals’ foreign affiliates. Nat. Commun. 10 (1), 1672–1711. doi:10.1038/s41467-019-09473-7
Lovely, M., and Popp, D. (2011). Trade, technology, and the environment: Does access to technology promote environmental regulation? J. Environ. Econ. Manag. 61 (1), 16–35. doi:10.1016/j.jeem.2010.08.003
Markusen, J. R. (1984). Multinationals, multi-plant economies, and the gains from trade. J. Int. Econ. 16 (3-4), 205–226. doi:10.1016/s0022-1996(84)80001-x
Memedovic, O., Ojala, L., Rodrigue, J. P., and Naula, T. (2008). Fuelling the global value chains: What role for logistics capabilities? Int. J. Technol. Learn. Innovation Dev. 1 (3), 353–374. doi:10.1504/ijtlid.2008.019978
Nemati, M., Hu, W., and Reed, M. (2019). Are free trade agreements good for the environment? A panel data analysis. Rev. Dev. Econ. 23 (1), 435–453. doi:10.1111/rode.12554
Nicoletti, G., Golub, S. S., Hajkova, D., Mirza, D., and Yoo, K. Y. (2003). Policies and international integration: Influences on trade and foreign direct investment. doi:10.1787/062321126487
Pesaran, M. H. (2007). A simple panel unit root test in the presence of cross-section dependence. J. Appl. Econ. Chichester. Engl. 22 (2), 265–312. doi:10.1002/jae.951
Piermartini, R., and Rubínová, S. (2014). Knowledge spillovers through international supply chains (No. BOOK). The Graduate Institute of International and Development Studies. doi:10.1596/978-1-4648-1500-3
M. Pigato (Editor) (2020). “Technology transfer and innovation for low-carbon development,”. doi:10.1596/978-1-4648-1500-3Int. Dev. F
Poulsen, R. T., Ponte, S., and Sornn-Friese, H. (2018). Environmental upgrading in global value chains: The potential and limitations of ports in the greening of maritime transport. Geoforum 89, 83–95. doi:10.1016/j.geoforum.2018.01.011
Qi, S., Peng, H., Zhang, X., and Tan, X. (2019). Is energy efficiency of belt and road initiative countries catching up or falling behind? Evidence from a panel quantile regression approach. Applied Energy 253, 113581.
Raei, M. F., Ignatenko, A., and Mircheva, M. (2019). Global value chains: What are the benefits and why do countries participate? Int. Monet. Fund.
Rodrik, D. (2018). New technologies, global value chains, and developing economies (No. w25164). National Bureau of Economic Research. doi:10.3386/w25164
Sears, J. B. (2017). When are acquired technological capabilities complements rather than substitutes? A study on value creation. J. Bus. Res. 78, 33–42. doi:10.1016/j.jbusres.2017.04.021
Selwyn, B., and Leyden, D. (2022). Oligopoly-driven development: The World Bank’s trading for development in the age of global value chains in perspective. Compet. Change 26 (2), 174–196. doi:10.1177/1024529421995351
Servén, L., and Abate, G. D. (2020). Adding space to the international business cycle. J. Macroecon. 65, 103211. doi:10.1016/j.jmacro.2020.103211
Shahzad, F., Bouri, E., Mokni, K., and Ajmi, A. N. (2021). Energy, agriculture, and precious metals: Evidence from time-varying Granger causal relationships for both return and volatility. Resources Policy 74, 102298.
Shahzad, F., and Fareed, Z. (2022). Examining the relationship between fiscal decentralization, renewable energy intensity, and carbon footprints in Canada by using the newly constructed bootstrap Fourier Granger causality test in quantile. Environmental Science and Pollution Research 1–10.
Shahzad, F., Fareed, Z., Wan, Y., Wang, Y., Zahid, Z., and Irfan, M. (2022). Examining the asymmetric link between clean energy intensity and carbon dioxide emissions: The significance of quantile-on-quantile method. Energy & Environment 0958305X221102049.
Shen, J. (2008). Trade liberalization and environmental degradation in China. Appl. Econ. 40 (8), 997–1004. doi:10.1080/00036840600771148
Song, M., and Wang, S. (2017). Participation in global value chain and green technology progress: Evidence from big data of Chinese enterprises. Environ. Sci. Pollut. Res. 24 (2), 1648–1661. doi:10.1007/s11356-016-7925-1
Sun, C. W., Li, Z., Ma, T. M., He, R., et al. (2019). Carbon efficiency and international specialization position: Evidence from global value chain position index of manufacture. Energy Policy 128, 235–242. doi:10.1016/j.enpol.2018.12.058
Taglioni, D., Winkler, D., and Engel, J. (2017). Making global value chains work for development in the age of automation and globalisation scepticism. Future fragmentation processes: Effectively engaging with the ascendancy of global value chains, 94, 180–193. doi:10.1596/978-1-4648-0157-0
Thomakos, D. D, and Alexopoulos, T. A (2016), Carbon intensity as a proxy for environmental performance and the informational content of the EPI, Energy Policy, 94:179-190. doi:10.1016/j.enpol.2016.03.030
Uyarra, E., Shapira, P., and Harding, A. (2016). Low carbon innovation and enterprise growth in the UK: Challenges of a place-blind policy mix. Technol. Forecast. Soc. Change 103, 264–272. doi:10.1016/j.techfore.2015.10.008
Wang, J. C., Jin, Z. D., Yang, M., and Naqvi, S. (2021). Does strict environmental regulation enhance the global value chains position of China's industrial sector? Petroleum Sci. 18, 1899–1909. doi:10.1016/j.petsci.2021.09.023
Wang, J., Rickman, D. S., and Yu, Y. (2022). Dynamics between global value chain participation, CO2 emissions, and economic growth: Evidence from a panel vector autoregression model. Energy Econ. 109, 105965. doi:10.1016/j.eneco.2022.105965
Wang, K., Gao, H., Xu, X., Jiang, J., and Yue, D. (2015). An energy-efficient reliable data transmission scheme for complex environmental monitoring in underwater acoustic sensor networks. IEEE Sensors Journal 16 (11), 4051–4062.
Wang, L., Yue, Y., Xie, R., and Wang, S. (2020). How global value chain participation affects China's energy intensity. J. Environ. Manag. 260, 110041. doi:10.1016/j.jenvman.2019.110041
Wang, Z., Wei, S. J., Yu, X., and Zhu, K. (2017). Measures of participation in global value chains and global business cycles (No. w23222). Cambridge, United Kingdom: National Bureau of Economic Research.
Weber, S., Gerlagh, R., Mathys, N. A., and Moran, D. (2021). CO2 embodied in trade: Trends and fossil fuel drivers. Environ. Sci. Pollut. Res. 28 (22), 27712–27730. doi:10.1007/s11356-020-12178-w
World Development Indicators (2019). The World Bank Group. Available at: data.worldbank.org/indicator/EN.ATM.CO2E.PC (Accessed September 24, 2022)
Wu, Z., Hou, G., and Xin, B. (2020). The causality between participation in GVCs, renewable energy consumption and CO2 emissions. Sustainability 12 (3), 1237. doi:10.3390/su12031237
Zhang, D., Wang, H., Löschel, A., and Zhou, P. (2021). The changing role of global value chains in CO2 emission intensity in 2000–2014. Energy Econ. 93, 105053. doi:10.1016/j.eneco.2020.105053
Zhang, Z., Meng, J., Zheng, H., Zhu, K., Du, H., and Guan, D. (2020). Production globalization makes China’s exports cleaner. One Earth 2 (5), 468–478. doi:10.1016/j.oneear.2020.04.014
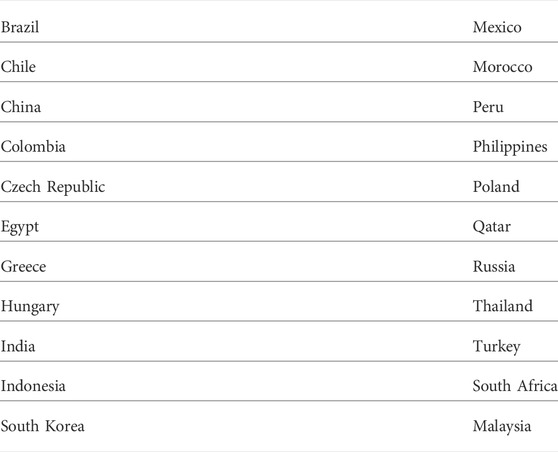
Appendix A: List of emerging market countries (EMCs) under analysis
According to MSCI of 2019, there are 26 emerging market countries (EMCs), but our analysis is focusing on 22 countries due to the non-availability of data of Argentina, Taiwan, Saudi Arabia, and UAE.
Keywords: global value chains (GVCs), carbon emisions, environmental patents, spatial econometric approach, emerging market countries
Citation: Cai Y, Qian X, Nadeem M, Wang Z, Lian T and Haq SU (2022) Tracing carbon emissions convergence along the way to participate in global value chains: A spatial econometric approach for emerging market countries. Front. Environ. Sci. 10:1039620. doi: 10.3389/fenvs.2022.1039620
Received: 08 September 2022; Accepted: 24 October 2022;
Published: 15 November 2022.
Edited by:
Farrukh Shahzad, Guangdong University of Petrochemical Technology, ChinaReviewed by:
Luigi Aldieri, University of Salerno, ItalyJianling Jiao, Hefei University of Technology, China
Copyright © 2022 Cai, Qian, Nadeem, Wang, Lian and Haq. This is an open-access article distributed under the terms of the Creative Commons Attribution License (CC BY). The use, distribution or reproduction in other forums is permitted, provided the original author(s) and the copyright owner(s) are credited and that the original publication in this journal is cited, in accordance with accepted academic practice. No use, distribution or reproduction is permitted which does not comply with these terms.
*Correspondence: Muhammad Nadeem, nadeemqaisrani@yahoo.com