Near-surface heat transfer at two gentle slope sites with differing aspects, Qinghai-Tibet Plateau
 Xingwen Fan
 Zhanju Lin
 Fujun Niu1
  Miaomiao Yao
- 1State Key Laboratory of Frozen Soil Engineering, Northwest Institute of Eco-Environment and Resources, Chinese Academy of Sciences (CAS), Lanzhou, China
- 2School of Engineering Science, University of Chinese Academy of Sciences, Beijing, China
The slope aspect effect is widely distributed on the Qinghai-Tibet Plateau and has an important impact on the permafrost environment. The differences in surface heat exchange characteristics of different slope aspects in the permafrost region of Gu Mountain in the Beiluhe Basin were compared and analyzed based on observations of the south slope (sunny slope) and north slope (shadowy slope) from 2019 to 2021. The air-ground heat transfer process on the slopes was simulated using the Monin-Obukhov similarity theory. Then, the simulation results of the sensible and latent heat fluxes on the slopes were corrected and analyzed using the Bowen ratio correction method. The results show that under the influence of the solar altitude angle and subsurface conditions, the downward shortwave radiation (DR), upward shortwave radiation (UR), and upward longwave radiation (ULR) were higher on the sunny slope than those on the shadowy slope, whereas the downward longwave radiation (DLR) was lower than that on the shadowy slope. Jointly, the net radiation energy on the sunny slope was smaller than that on the shadowy slope, and the annual average net radiation difference reached 16.7 W·m−2. The annual and daily variations in soil heat flux on the sunny slope were higher than those on the shadowy slope. The energy closure rate on the sunny slope was high with a confinement rate of 0.85, whereas that on the shadowy slope was poor with a confinement rate of 0.51. The air-ground energy transfer patterns on the sunny and shadowy slopes showed obvious seasonal differences. Both slopes are dominated by the sensible heat exchange transfer mode in the cold season, whereas the shadowy slope is dominated by latent heat exchange in the warm season. This study improves our understanding of the distribution, development, and environmental effects of permafrost, under the influence of local factors.
1 Introduction
The Qinghai-Tibet Plateau (QTP) is the water tower of Asia, the triple pole of the Earth, and the climate change initiator and amplifier (Immerzeel et al., 2020; Yao, et al.,2022). It has developed the largest global low-latitude, high-altitude alpine permafrost area (Cheng and Wang, 1982; Zhou et al., 2000). The most striking difference in the feature of permafrost compared with that of other ground areas is that it is water, thermal, and mechanical properties are very unstable and easily disturbed by external factors (Niu et al., 2011; Zhang et al., 2021). The QTP topography is complex, with many hilly and mountainous areas and strong solar radiation, so the slope aspect has an important influence on the spatial distribution and hydrothermal state of permafrost regions (Chou et al., 2010).
The redistribution of radiation, moisture, and heat caused by the differences in slope aspect, which in turn leads to differences in the permafrost environment, is known as the slope effect in permafrost areas. This affects moisture and heat exchange in the permafrost, resulting in large differences in the spatial distribution of permafrost, including natural slope direction differences and linear engineering slope aspect differences (Luo et al., 2020; Tai et al., 2020). Studies in the Kunlun Mountains showed that the differences between the annual mean surface temperatures, annual mean temperatures within the active layer (0.5 m depth), and the annual mean temperature of the permafrost table of the northern and southern slopes of the mountains during 2014–2016 were 1.3°C, 0.9°C, and 0.6°C, respectively (Luo et al., 2019). In the Gaize area, the active layer and permafrost thickness on the northern slope of the mountain were larger than those on the southern slope, and the annual mean ground temperature of the permafrost was colder than that on the southern slope (Chen et al., 2016). The hydrothermal differences in different slope directions caused uneven settlement on the roadbed, and the settlement differences increased with an increase in operation time (Zhang et al., 2017). Wu et al. (2011) compared and analyzed the shallow soil temperature of 12 Qinghai-Tibet Railway sections, and found that the maximum temperature difference between sunny and shadowy slopes in winter was approximately 5.7°C, and that the minimum temperature difference in summer can also reach 2.6°C. Constrained by environmental conditions and technical means, most studies were based on qualitative or relatively simple quantitative descriptions of short time scales. However, there is a lack of studies on surface heat exchange characteristics of shadowy and sunny slopes.
In recent years, air-ground surface heat exchange characteristics processes under different surface conditions have been studied on the QTP has been studied, but there are fewer studies involving the differences in surface heat exchange characteristics between different slopes under the influence of slope aspect effects. In this study, we aimed to: 1) understand the differences in heat fluxes between sunny and shadowy slopes in the permafrost area of the Beiluhe Basin and 2) analyze the differences in the heating process on the subsurface of sunny and shadowy slopes in the permafrost area.
2 Study area
The central part of the QTP, with its average elevation greater than 4,500 m, is rich in geomorphological units, and most of its terrain is complex, with interspersed mountains, valleys, basins, and high plains (Zhou et al., 2000). The Beiluhe Basin is located in the central part of the QTP and has an alluvial and wind-plain landscape with open topography and slightly undulating terrain (Lin et al., 2019). Alluvial ditches are developed in the region, depressions and low hills are interspersed, sand dunes and sandy areas are locally distributed (Lin et al., 2020). Secondary landforms in the basin include the Beiluhe River, which has a wide and shallow riverbed. Controlled by high altitudes, the Beiluhe Basin climate is cold and dry, with thin air and strong solar radiation. According to observations from the Beiluhe meteorological station during 2005–2014, the annual mean temperature of Beiluhe Basin ranged from −4.1 to −2.8°C, with a mean value of −3.5°C. The cold season (temperature below 0°C) lasted for 8 months (October to May) (Lin et al., 2019). The average precipitation ranged from 229 to 467 mm, with the occurrence of rain and high temperature at the same period, and precipitation was mainly concentrated from June to August. Evaporation is much greater than precipitation, and the average potential evaporation reached 1,588–1,626 mm in 2012–2014 (Lin et al., 2019). The wind is dominant towards north-west, with a maximum speed of 40 m/s and an annual average wind of 4.1 m/s (Lan et al., 2021). The snowpack in the region is thin, and some areas have no snow cover (Yin et al., 2017).
Ice-rich and ice-saturated permafrost is widely developed in the Beiluhe Basin, with an annual ground temperature of −1.8 to −0.5°C. The upper limit of permafrost is 1.8–3.0 m, and below the upper limit is a soil-ice layer with more than 50% volumetric ice content. The soil-ice layer thickness can reach 3 m. The thickness of the permafrost was 20–90 m (Lin et al., 2020). In recent years, permafrost in the Beiluhe Basin has shown a degradation trend owing to the influence of global warming and human activities. According to the borehole data from 2001 to 2013, the average ground temperature at depth of zero annual amplitude increase rate was approximately 0.13–0.18°C/10a, and the increase in active layer thickness was approximately 3.6 cm/a (Lin et al., 2020). Borehole data from the Beiluhe Basin show that subsurface ice content in the permafrost area of the Beiluhe Basin is unevenly distributed. The volumetric ice content ranged from 1% to 70%, with an average value of approximately 17% (Fan et al., 2021).
The monitoring site on shadowy and sunny slopes was located in the Beiluhe Basin (Figure 1). The Beiluhe Basin has many geomorphological units and good natural conditions for field observation. The two monitoring sites are located on the southern and northern slopes of Gu Mountain, with the sunny slope (34.8367°N, 92.9206°E) having a slope of 7.5° and the shadowy slope (34.8486°N, 92.9268°E) having a slope of 8.1°, with altitudes of 4,634 and 4,638 m, respectively (Lin et al., 2019). The distance between them was less than 4 km.
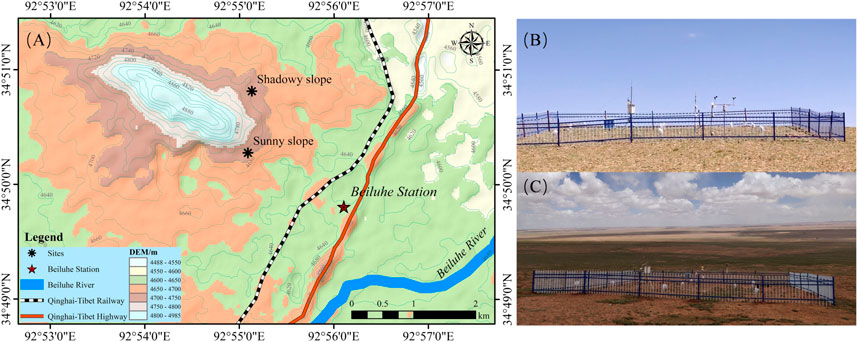
FIGURE 1. Location of sunny (B) and shadowy (C) slopes monitoring sites in the Beiluhe Basin (A).
Vegetation growth and species richness at the monitoring sites on shadowy and sunny slopes were poor. The sunny slope is characterized by the alpine grassland, with a relatively uniform distribution of surface vegetation, coverage of approximately 16%, and plant height of approximately 1.1–15.8 cm. The vegetation on the shadowy slope is a transition zone from alpine meadow to alpine grassland, with a very uneven distribution, coverage of approximately 0%–26%, and plant height of approximately 1.3∼16.9 cm (Figures 1B,C). The observation site on the sunny slope was mainly gravelly soil at the depth of 0–0.5 m, gravelly clay at 0.5–1.2 m, sandstone at 1.2–2.0 m, and sandstone at 2.0–2.2 m. In contrast, the soil of the shadowy slope site was mainly sandy at 0–0.4 m depth and sandy clay at 0.4–1.3 m. The ice-bearing clay layer appeared at a depth of 1.5 m. Additionally, the soil organic matter contents at 0–0.05 m surface depth on both monitoring sites were significantly different under the influence of vegetation. The soil organic matter content of the soil was 21.1 g/kg on the shadowy slope and 10.4 g/kg on the sunny slope, with a difference of 0.5 g/kg (Lan et al., 2021).
3 Methodology and data
3.1 Field monitoring and survey
A field survey was conducted on shadowy and sunny slope monitoring sites to systematically quantify hydrothermal and energy exchanges near the slope surface. A complete observation system was established, which mainly included two parts: overground and underground. The overground observation system included monitoring of temperature, wind speed, humidity, radiation, vegetation, etc., and the subsurface observation included recording of ground temperature, soil moisture, and soil heat flux (Table 1).
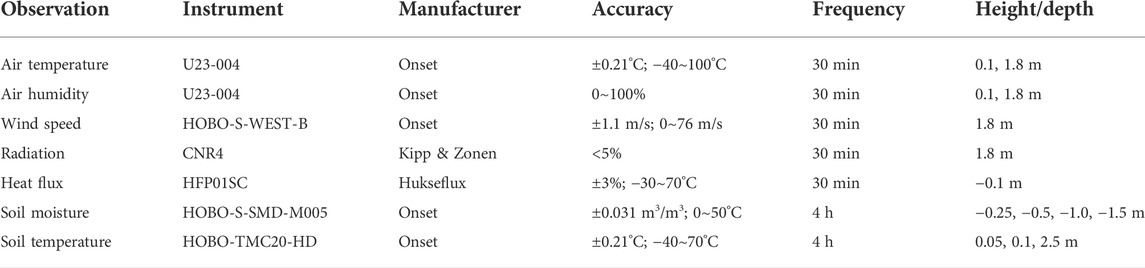
TABLE 1. Observation items and instruments of shadowy and sunny slopes monitoring sites.
Continuous monitoring and regular field observations were carried out for up to 3 years. For the completeness of the data analyzed, the data analyzed in this paper are from October 2019 to October 2021. Air temperature and humidity data are automatically acquired by installing temperature and humidity sensors (U23-004) at a height of 0.1 and 1.8 m, representing ground surface temperature and humidity (0.1 m) and air temperature and humidity (1.8 m), respectively. Soil temperature was automatically acquired by drilling a hole, installing a soil temperature sensor (HOBO-TMC20-HD) and a collector (HOBO-UX120-006M) at installation depths of 0.05, 0.1, and 2.5 m. Soil moisture was automatically acquired by installing a soil moisture sensor (HOBO-S-SMD-M005) and a collector (HOBO-H21-002 Micro Station) automatically at four depths of 0.25, 0.5, 1.0, and 1.5 m. Both temperature and moisture sensor acquisition frequency were 1 time/30 min.
A CNR4 Net Radiometer (Kipp & Zonen, Delft-The Netherlands) was installed at 1.8 m height at each site to measure the energy balance between incoming short-wave and long-wave (Far Infrared, FIR) radiation versus surface-reflected short-wave (Downward Shortwave Radiation, DR; Upward Shortwave Radiation, UR) and outgoing long-wave radiation (Downward Long-wave Radiation, DLR; Upward Long-wave Radiation, ULR). The sensor operating temperature was −40 to 80°C and the collection frequency was 1 time/30 min. And data were collected by connecting a Campbell CR1000 data collector.
Wind speed and direction were collected automatically by installing a wind speed sensor (HOBO-S-WEST-B) at a height of 1.8 m. The measurement accuracy of the wind speed sensor was ±1.1 m/s with a range of 0∼76 m/s, and the measurement accuracy of the wind direction was ±5° with a range of 0∼355°, and the collection frequency was 1 time/30 min wind speed monitoring started in September 2019, and this study data analysis period is from 1 October 2019 to 30 September 2021, a total of 2 years.
The soil heat flux sensor (HFP01SC) is installed in the soil layer at a depth of 0.1 m at the surface to measure the surface heat flux. The heat flux sensor has a measurement accuracy of ±3%, an operating environment temperature of −30 to 70°C, and a collection frequency of 1 time/30 min. The heat flux sensor is also connected to the CR1000 digital collector to collect data. Soil heat flux monitoring started in June 2019, but due to some missing data, the data analysis period is from 15 October 2019 to 14 September 2021, a total of 2 years.
3.2 Data processing
3.2.1 Missing data interpolation
Given the influence of harsh environmental conditions, some data obtained in the field have been missed. Among them, the daily average temperature, radiation and ground temperature (0.1 and 2.5 m depth) comprised less than 10% of the total analyzed data. However, the missing data had a small impact on the overall study and were completed by data interpolation techniques.
3.2.2 Mean and statistical analysis
For the soil temperature (0.1 and 2.5 m depth) and moisture data with a collection frequency every four, the daily average was taken as the average of the data measured at six instances per day. However, for the ground temperature data, because multiple points of observation were used, the data at each measurement instance were estimated as the average of the valid data from nine boreholes (blank data removed). For wind speed, air temperature, radiation, albedo, soil temperature (0.05 m depth), and heat flux data collected every 30 min, the daily average was calculated by averaging the data from 48 measurements moments day. The monthly averages of the above observations are the averages of the valid daily averages for each month, and the annual averages are obtained by averaging the valid daily averages for a year.
Pearson correlation analysis was used to analyze the correlation between surface temperature (0.1 m depth) and upward longwave radiation (ULR) on shadowy and sunny slopes. The sum of the sensible and latent heat fluxes (H + LE) obtained from the simulation and the difference between the net radiation and soil heat fluxes (Rn-G) obtained from observations were subjected to linear regression. The results of the above correlation and regression analyses were tested for significance by calculating the p-values.
3.3 Model simulation
The Monin-Obukhov similarity theory is a semi-empirical function with good stability in the process of surface turbulent flux calculation. It has been shown that the calculation results of this method have the highest correlation with the results obtained by the vorticity correlation method (Pahlow et al., 2001). Additionally, the Monin-Obukhov similarity theory has gradually developed into an important theory for the study of turbulence in the atmospheric boundary layer since its introduction in 1954, and has been applied to the study of energy transport in the near-surface layer (Ma et al., 2002; Su, 2002). Meanwhile, the data used in this theory, such as the atmospheric temperature, humidity, and wind speed data, were relatively easy to obtain. With the complex QTP environmental conditions, this method has been successfully applied to simulate the air-ground energy and near-surface energy variations (Ma et al., 2002).
To investigate the characteristics and differences of air-ground energy transfer, we simulated the sensible and latent heat fluxes on the shadowy and sunny slopes of the Beiluhe Basin using the Monin-Obukhov similarity theory. The data included wind speed, temperature and humidity metrics obtained from field observations. The energy balance equation was used to analyze and verify the degree of energy closure of the two slopes and the model simulation results. Finally, the sensible and latent heat fluxes of the shadowy and sunny slopes were corrected according to the Bowen ratio correction method, and the corrected results were used to analyze and compare the characteristics and differences in the air-ground energy exchange between the two slopes.
Based on the Monin-Obukhov similarity theory (Businger et al., 1971; Högström, 1988) the vertical distribution of wind speed, air temperature and humidity near the surface can be derived from the following three equations (Chen et al., 2013; You et al., 2017).
where:
where
(1) Under atmospheric instability conditions, i.e., when z/L ≤ 0
Where,
(2) Under the atmospheric stability condition. That is, when z/L > 0,
In the above parameters, the wind speed data at 0.1 m height were not observed, thus
Where:
Where:
Using Eqs 1–12 in combination with wind speed, air temperature and relative humidity data observed in the field, the sensible and latent heat fluxes near the surface of the shadowy and sunny slope of the Beiluhe Basin from 1 July 2020 to 30 June 2021 were simulated and calculated. To validate the model simulation results, The Energy Balance Ratio (EBR) of the shadowy and sunny slope was calculated by the energy balance equation. Because the energy closure ratio can not only assess the degree of surface energy closure, but also is one of the criteria to measure the quality of surface flux data obtained from numerical simulations (Yan et al., 2018).
In ecosystem studies, the near-surface energy balance equation is expressed as (Yang and Wang, 2008)
Where: G is the surface soil heat flux (unit: W·m−2), and in the study is the soil heat flux measured by the soil heat flux plate at a depth of 10 cm; S is the vegetation canopy heat storage, and the canopy heat storage is very small due to the relatively sparse vegetation growth and poor growth potential on the observation sites, so S is negligible; Q is the sum of all additional energy terms, and the value is also negligible. Thus, the energy balance equation can be expressed as
Based on the energy balance equation, the energy closure rate is calculated as follows.
The Bowen ratio correction method is based on the energy balance equation and near-surface gradient diffusion theory, and was corrected with the net radiation and soil heat flux data obtained from field observations, and thus can improve the sensible and latent heat flux underestimation problem well (Wilson et al., 2002; Pan et al., 2017).
Where:
4 Results
4.1 Surface radiation characteristics
Some differences exist in the near-surface radiation characteristics between the shadowy and sunny slopes of the Beiluhe Basin due to slope aspect. DR, DLR, and ULR exhibited significant seasonal patterns on both sunny and shadowy slopes (Figure 2). The monthly average DR reaches its maximum around May and were approximately 298.8 and 300.6 W·m−2 on sunny and shadowy slopes, respectively, and drops to the minimum around December, approximately 148.1 and 145.0 W·m−2, respectively. ULR and DLR are influenced by the lag of surface and atmospheric warming, reaching their maximum around August and dropping to a minimum around January. The monthly maximum values of DLR were approximately 301.0 and 300.7 W·m−2 and the minimum values were approximately 167.1 and 163.5 W·m−2 for the sunny and shadowy slopes, respectively. From March to the early- and mid-May, the reflected short-wave radiation on the surface of the shadowy slope gradually increases and reach the highest value of the year, with the northward movement of the sun and increase in the shadowy slope radiation energy. This is attribute to the low coverage, incompletely thawed surface, and high albedo because the vegetation growth would have just started at that time. During the observation period, the values of peak upward shortwave radiation (UR) on the sunny and shadowy slopes were approximately 121.7 and 92.1 W·m−2, respectively. From June to September, under the rainy season influence, the soil on the surface of the shadowy and sunny slopes was relatively wet, and coupled with vegetation growth, the surface albedo was low, which gradually decreased the UR which reached the lowest value of the year. From December to February, the solar radiation energy received by the shadowy slope was the lowest of the year, which also reduced the reflected short-wave radiation on both slopes (Figure 2).
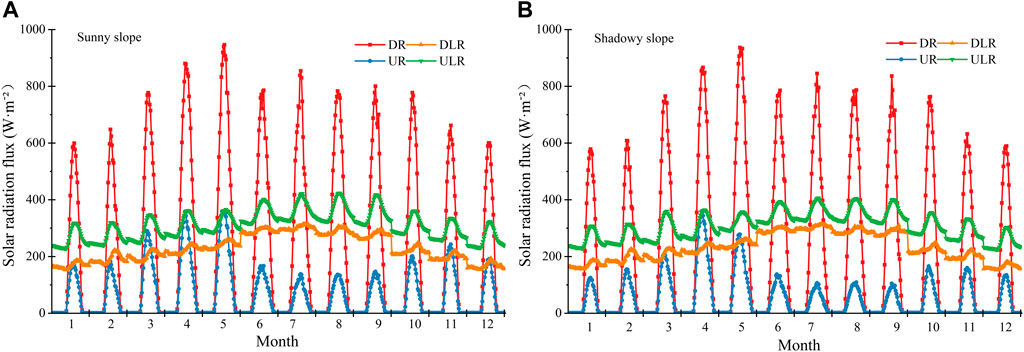
FIGURE 2. Characteristics of monthly mean daily variation of surface radiation flux balance on the sunny (A) and shadowy (B) slopes from October 2019 to October 2021.
The average annual solar short-wave radiation received on the sunny slopes is higher than that on the shadowy slopes due to the higher solar height and relatively longer sunshine hours, and the average annual DR value during the observation period was 2.5 W·m−2 higher than that on the shadowy slopes. For the UR, the annual average difference between the shadowy and sunny slopes reached 14.1 W·m−2 due to the higher surface albedo on the sunny slopes. The ground starts to warm up gradually after receiving solar radiation, and at the same time, it also emits outward longwave radiation. However, as the surface temperature of the sunny slope was higher than that on the shadowy slope, the ULR of the sunny slope was higher than that on the shadowy slope. The annual average ULR of the shadowy and sunny slopes were 306.5 and 310.4 W·m−2, respectively, with a difference of approximately 3.9 W·m−2 (Figure 2).
4.2 Net radiation and soil and heat flux variation characteristics
Figure 3 shows the daily and monthly average soil heat flux variation curves at a depth of 0.1 m. From Figure 3A, the annual variation of soil heat flux is larger on the sunny slope than on the shadowy slope. The maximum amplitude during the observation period reached 40.8 W·m−2 on the sunny slope, whereas it reached 22.0 W·m−2 on the shadowy slope, indicating that the soil heat exchange near the surface on the sunny slope was higher than that on the shadowy slope. The monthly average soil heat flux values were positive from March to September for both shadowy and sunny slopes, and negative from October to February, indicating that heat was mainly transferred from the atmosphere to the soil from March to September, and from the soil to the atmosphere from October to February (Figure 3B). Among them, the soil heat flux on the shadowy slope surface reached the largest value of the year in July, approximately 16.1 W·m−2, and the biggest sunny slope value in August, approximately 18.0 W·m−2, and the minimum value of both slopes in December, −15.0 and −18.7 W·m−2 on the shadowy and sunny slopes, respectively. The soil heat fluxes in January, November and December were lower on the sunny slope than those on the shadowy slope. The annual average soil heat fluxes on the sunny slope surface were slightly higher than those on the shadowy slope during the observation period, 2.0 and 1.5 W·m−2, respectively, with a difference of 0.5 W·m−2.
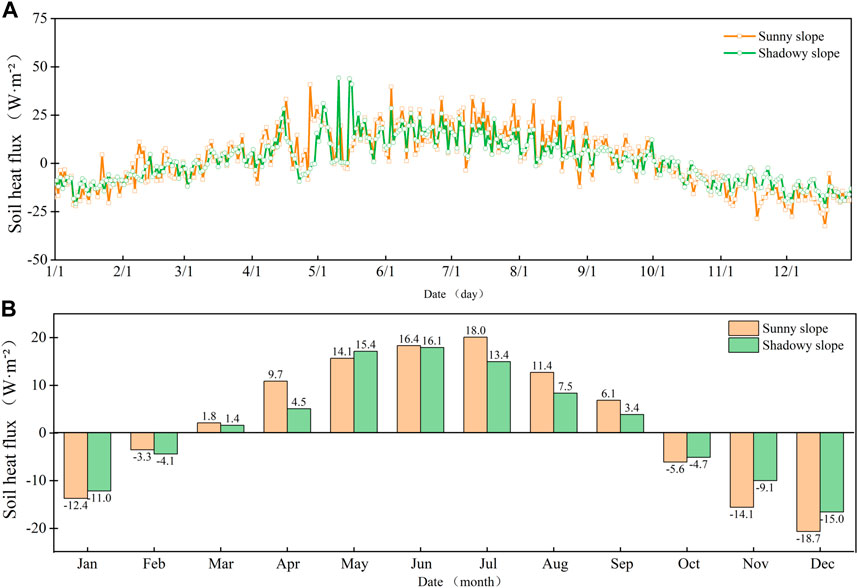
FIGURE 3. Variation of soil heat flux of shadowy and sunny slopes. (A) Daily average soil heat flux of shadowy and sunny slopes; (B) Monthly average soil heat flux of shadowy and sunny slopes.
To further investigate the effect of slope on soil heat fluxes, net radiation and heat flux data for April 2020, July 2020, October 2020, and January 2021 were selected to characterize the monthly average daily variation of soil heat fluxes on shadowy and sunny slopes during the thawing, fully melted, freezing, and fully frozen phases, respectively (Figure 4). The net radiation on the shadowy slope was slightly higher than that on the sunny slope at different phases, because of the higher UR on the sunny slope and roughly equal DR, DLR, and ULR on the shadowy and sunny slopes, but the total difference was 16.7 W·m−2. The daily variation in soil heat flux at different stages was higher on sunny slopes than that on shadowy slopes. Additionally, a comparative analysis of the daily variation of soil heat fluxes at different stages on shadowy and sunny slopes showed that the difference in daily variation of soil heat fluxes between the two slopes at the complete melting stage was the smallest, followed by the complete freezing stage, and the differences in daily variation at the thawing and freezing stages were larger. This may be related to the near-surface properties of shadowy and sunny slopes such as soil properties, soil moisture, and vegetation.
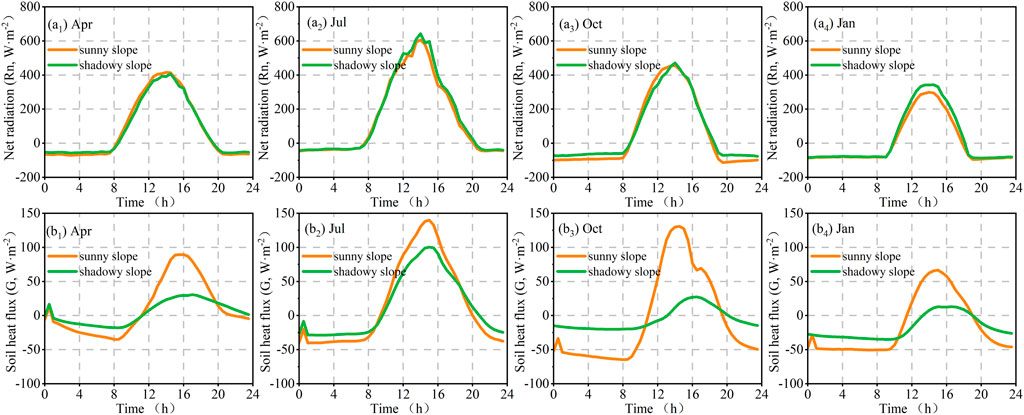
FIGURE 4. Characteristics monthly mean daily variation of net radiation and soil heat flux in different stages on the shadowy and sunny slopes (a1,b1) Thawing stage; (a2,b2) Complete thawing stage; (a3,b3) Freezing stage; (a4,b4) Complete freezing stage.
4.3 Energy closure analysis
The energy closure rates of shadowy and sunny slopes from July 2020 to June 2021 were calculated using Eq. 15 (Figure 5). The degree of energy closure at the surface on the sunny slope was higher, and the energy closure rate reached 0.85, which indicates that the simulation of sensible and latent heat fluxes on the sunny slope was better that on the shadowy slope. For the shadowy slope, the energy closure of the surface was poorer, with a closure rate of 0.51, thus confirming that the simulation of sensible and latent heat fluxes on the shadowy slope was less effective. The energy closure in April 2021 with an energy closure rate of 0.68, was the best for the shadowy slope whereas the energy closure in December 2020 was the worst, with an energy closure rate of 0.20. Additionally, the energy closure in March-May was the highest for both sunny and shadowy slopes, and the closure from December to February was the worst.
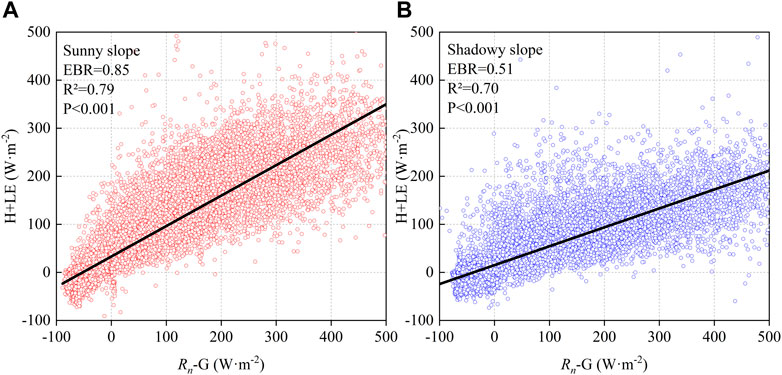
FIGURE 5. (H + LE) and (Rn-G) linear regression analysis of shadowy and sunny slope. (A) Linear regression analysis of sunny slope; (B) Linear regression analysis of shadowy slope.
4.4 Correction of sensible and latent heat fluxes of the shadowy slope
Figure 6 shows the changes of sensible and latent heat fluxes after the correction of the shadowy and sunny slopes in the Beiluhe Basin. There were obvious seasonal changes in the sensible and latent heat exchange on sunny and shadowy slopes. The energy exchange between air and ground during the cold season on the sunny slope is mainly attributed to sensible heat exchange. During the warm season, the surface latent heat flux gradually rises and dominates the heat exchange between the ground and air together with the sensible heat flux with the arrival of the rains. The heat exchange mode between the air and ground in the cold and warm seasons of the shadowy slope shows a opposite trend, that is, the cold season is mainly dominated by sensible heat exchange, and the warm season is mainly dominated by latent heat exchange. As shown in Table 2, the average sensible heat fluxes in the warm season reached 70.25 and 66.89 W·m−2 and the average latent heat fluxes were 168.34 and 111.61 W·m−2 on the sunny and shadowy slopes, respectively. The average sensible heat fluxes were 50.41 and 56.10 W·m−2 and the average latent heat fluxes were 10.59 and 17.34 W·m−2 on the sunny and shadowy slopes in the cold season. Regarding the annual average heat flux, the latent heat flux on the sunny slope is significantly lower than that on the sunny slope. The average annual latent heat fluxes on the shadowy and sunny slopes were 48.49 and 29.89 W·m−2, with a difference of 18.60 W·m−2, and the average annual sensible heat fluxes were 59.67 and 57.04 W·m−2, with a difference of only 2.62 W·m−2, respectively.
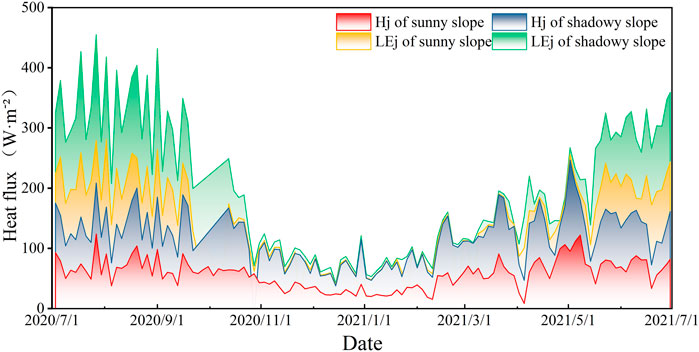
FIGURE 6. Variation characteristics of near surface sensible heat and latent heat fluxes of shadowy and sunny slope (after correction).
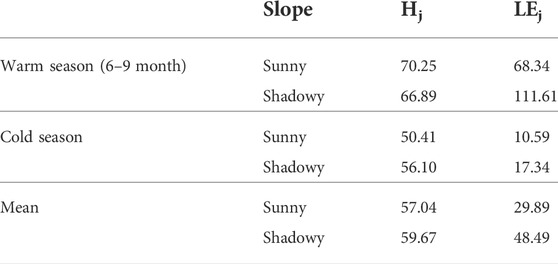
TABLE 2. Average sensible and latent heat fluxes in cold and warm seasons on the shadowy and sunny slopes.
5 Discussion
5.1 Reasons for energy non-closure
The energy balance analysis revealed an energy non-closing phenomenon of near-surface of shadowy and sunny slopes in the Beiluhe Basin, especially the significant energy non-balance phenomenon on the shadowy slope.
First, the air temperature, humidity, and wind speed data used in the simulation should be observed in the vertical direction on the ground surface. In this study, influenced by the slope, the instrument installation is not perpendicular to the slope surface but to the horizontal surface; therefore, the actual observation height (
Third, the underestimation of soil heat flux is one of the key factors that cause energy non-closure on the shadowy slopes (You et al., 2017). The model simulates the sensible and latent heat exchange between the surface and atmosphere of the slopes. The soil heat flux used to calculate the energy balance rate should also be surface heat flux. However, in this study, we used the heat flux calculated at a depth of 10 cm to address underestimation problems (Yang and Wang, 2008). The thermal conductivity of the heat flux plate used for observation was different from that of the soil itself, and coupled with the influence of seasonal soil moisture changes, there must be errors between the measured soil heat flux and the actual value (Wang et al., 2009). Finally, there is a serious energy non-closure phenomenon on the shadowy slopes in the study, which is related to the serious lack of soil heat flux and net radiation data on the shadowy slopes during the observation period. This is because the lack of data on the shadowy slopes was mainly concentrated between October and May of the following year. According to the results of this study, the model simulation from March to May was the best, so the missing data in this period had some influence on the overall energy closure. In contrast, the simulation was less effective from December to February, and the missing data may have deepened this effect.
5.2 Influence of slope effects on near-surface sensible and latent heat fluxes
Surface properties (moisture, temperature, vegetation, etc.) are key environmental factors that affect the energy exchange between the air and ground (Su, 2002; Grachev et al., 2020). Under the influence of the slope aspect, the lower bedding surface on shadowy and sunny slopes in the Beiluhe Basin exhibits significant differences, which makes the heat sensing and fluxes on the two slopes also show significant differences. These findings are similar to those of the study by You et al. (2017) in the alpine meadow area and bare ground in the Beiluhe Basin. The specific reasons for such differences in the sensible and latent heat fluxes on shadowy and sunny slopes are as follows.
First, the cold season is characterized by low precipitation, and the soils on the shadowy and sunny slopes are frozen with low surface water content; thus, the heat exchange between the air and ground on both slopes is mainly sensible. In the warm season, with the increase in precipitation and soil melting, the liquid water content of the surface on the shadowy slope increased and the ground evaporation increased; therefore, the latent heat flux on both slopes increased significantly. However, the latent heat flux on the shadowy slope is significantly higher than that on the sunny slope because the water content is significantly higher than that on the sunny slope. Meanwhile, the sensible heat flux increased with the increase in solar radiation, but the increase in the sensible heat flux was small, such that the difference between sensible and latent heat flux on the sunny slope in the warm season was not significant, whereas the latent heat flux on the shadowy slope was significantly higher than the sensible heat flux.
Secondly, the variation in sensible heat fluxes on slopes is mainly related to the magnitude of the temperature differences between the air and ground. In the warm season, the surface of the sunny slope was relatively dry, and the difference in ground temperature was higher than that on the shadowy slope; therefore, its sensible heat flux was higher than that on the shadowy slope. Soil freezing occurred on both slopes during the cold season. The higher moisture content on the shadowy slope, after freezing into ice, causes surface temperature to drop significantly, increasing the temperature difference between the surface and the atmosphere, and increasing the soil thermal conductivity. The deep soil heat on the shadowy slope is quickly transferred to the atmosphere in the form of sensible heat; thus, the sensible heat flux near the surface on the shadowy slope during the cold season is greater than that on the sunny slope. Additionally, the surface moisture content on the shadowy slope was higher than that on the sunny slope throughout the year; therefore, its latent heat flux was also higher than that on the sunny slope.
5.3 Ecological and environmental effects of slope aspect differences
The alpine ecosystem on the QTP is very sensitive to environmental changes, so the impact of slope aspect induced changes in the nature of the substratum on the plateau ecological environment cannot be ignored. Slope difference is a common phenomenon in permafrost areas of the QTP, and its impact on the permafrost environment is characterized by long-term complexity. The long-term impact is mainly manifested in the fact that the impact of slope difference on permafrost areas is long and continuous. Complexity is mainly manifested in the following: 1) the complexity of environmental elements. In this study, the shadowy and sunny slopes showed obvious differences in near-surface hydrothermal (atmospheric temperature and humidity, soil temperature, and moisture), energy (radiation, sensible heat, latent heat, and soil heat flux), and other environmental factors (wind speed, vegetation, soil texture, etc.) under the effect of slope aspect. 2) The ecological processes and problems caused by the difference between shadowy and sunny slopes are complex. Influenced by the slope direction, the spatial distribution variability of permafrost in the degradation process on the QTP gradually expands, which makes the active layer thickness increase faster in the area relative to the sunny slope. Subsurface ice melts, and the local permafrost degradation is significant, which has an important impact on the air-ground heat exchange and hydrological cycle processes (Wang et al., 2006; Zhao et al., 2019; Zhang et al., 2022), leading to the gradual differentiation of soil freeze-thaw cycle processes in different regions. First, permafrost melting increases the number of soil pores, which is conducive to the downward transfer of surface heat, and water and promotes ground ice melting. This destroys the water-heat equilibrium of the slope surface, resulting in the destabilization of the overlying soil layer under the action of gravity, which is prone to induce disasters such as landslides, slumps and mudflows (Niu et al., 2005; Morino et al., 2021). Second, the permafrost area is an important “carbon sink” with rich carbon reserves, and permafrost degradation contributes to the release of greenhouse gases such as CO2 and CH4, enhancing the greenhouse effect (Mu et al., 2015; Wu et al., 2018; Ding et al., 2019). Additionally, the permafrost area on the QTP is also a “catchment area” for heavy metals such as Hg, Cd, Cr, and Zn (Halnach et al., 2017; Sun et al., 2017; Mu et al., 2019). Moreover, permafrost degradation will lead to the release of heavy metal elements into the soil. Finally, permafrost degradation changes the physical and chemical properties of the soil and reduces the soil moisture content, making the surface vegetation unable to obtain the water and nutrients required for growth and continuously degrading, even leading to soil desertification and desertification (Figure 7) (Wang et al., 2006; Zhou et al., 2022).
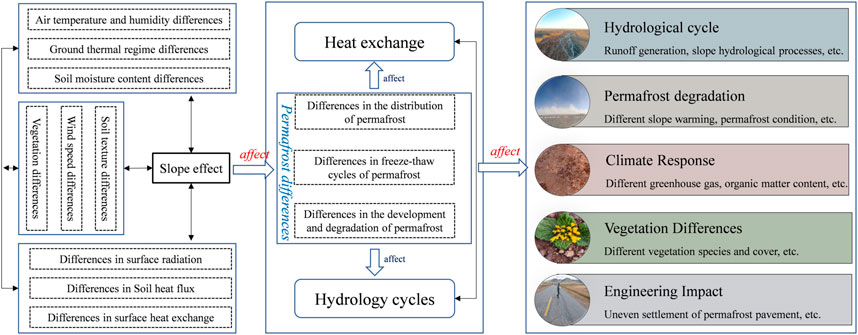
FIGURE 7. Environmental effects of high-altitude permafrost region under slope aspect.
5.4 Engineering effects of slope differences
The QTP Engineering Corridor is a national key infrastructure facility construction area with a total length of 1,140 km, crossing the hinterland of the QTP and spanning a large area of continuous permafrost zone (Ma et al., 2006). The construction and operation of the Qinghai-Tibet project have changed the surface energy income and expenditure processes in the permafrost zone, especially in linear engineering with high embankments (Chou et al., 2010). Most roads along the Qinghai-Tibet Highway are asphalt pavements, which have a stronger heat absorption capacity than the natural ground surface, causing significant slope differences. The thermal difference between the shadowy slope and sunny slope of the roadbed has a significant impact on the underlying permafrost foundation, which intensifies the ground base temperature field asymmetry and causes a freeze-thaw difference of the roadbed (Wu et al., 2011), inducing engineering diseases such as transverse deformation of the roadbed, longitudinal cracking, shoulder tilt, roadbed cracking, and longitudinal wave subsidence (Wang et al., 2004).
Additionally, research has shown that the engineering effect phenomenon caused in the difference of slope aspect on the QTP is also influenced by many factors. First, the linear engineering direction play a decisive role in the size of the difference between the shadowy slope and the sunny slope of the roadbed. This was mainly due to the different solar altitude angles and the difference in the radiation energy received by the slope, which caused a large difference in the internal temperature field asymmetry of the roadbed (Wen et al., 2009; Wu et al., 2011). The difference in radiation energy received by the slope on both sides of the north-south roadbed was the smallest, whereas that of the east-west roadbed was the largest (Hu et al., 2002). Second, the slope effect is more significant in the high-fill roadbed section. The greater the roadbed height, the larger the heat-bearing area of the slope, the stronger the ability to store heat, and the more significant the slope effect. Finally, the frequency of linear engineering diseases in the permafrost area of the QTP is closely related to permafrost temperature and ground ice content (Wen et al., 2009). The high temperature and high ice content permafrost were more sensitive to surface temperature changes, so the slope aspect resulted in more serious diseases.
6 Conclusion
We investigated the influence of the shadowy and sunny slope effects on the near-surface energy balance, and simulated the process of air-ground energy transfer using the Monin-Obukhov similarity theory. The simulation results of the sensible and latent heat fluxes were then corrected and analyzed using the Bowen ratio correction method. The annual and daily variations in soil heat flux on the sunny slope were higher than those on the shadowy slope, and the soil heat exchange on the sunny slope was higher than that on the shadowy slope. The degree of energy closure on the sunny slope was higher, with a closure rate of 0.85, whereas the degree of energy closure on the shadowy slope was poorer, with a closure rate of only 0.51. Under the influence of seasonal changes in ground temperature difference, surface moisture content, and solar radiation, the air-ground energy transfer modes of the shadowy and sunny slopes show obvious seasonal differences. Both slopes were dominated by sensible heat exchange transfer mode in the cold season, whereas shadowy slopes were dominated by latent heat exchange during the warm season. The differences between the sensible and latent heat fluxes of sunny slopes were small, which jointly controls the air-ground heat transfer. The sensible heat flux on the sunny slope was larger than that on the shadowy slope during the warm season, and smaller than that on the shadowy slope during the cold season.
Under the influence of the slope effect, the ecological environment and engineering construction of the QTP showed obvious differences. This study provides boundary conditions and a reference basis for further development of the accurate simulation of descent-scale permafrost distribution in complex terrain on the QTP hills and mountains, as well as a scientific reference for disease control of high embankment section of linear engineering at high-altitude permafrost roadbeds.
Data availability statement
The original contributions presented in the study are included in the article/supplementary material, further inquiries can be directed to the corresponding author.
Author contributions
XF and AL: conceptualization, methodology, validation, writing—review and editing. MY: writing—original draft, formal analysis. WL: data curation, writing. ZL and FN: writing—review and editing, resources, supervision, project administration, funding.
Funding
This work was supported by the National Natural Science Foundation of China (grant 41971089). And the Second Tibetan Plateau Scientific Expedition and Research (STEP) program (Grant No. 2019QZKK0905).
Conflict of interest
The authors declare that the research was conducted in the absence of any commercial or financial relationships that could be construed as a potential conflict of interest.
Publisher’s note
All claims expressed in this article are solely those of the authors and do not necessarily represent those of their affiliated organizations, or those of the publisher, the editors and the reviewers. Any product that may be evaluated in this article, or claim that may be made by its manufacturer, is not guaranteed or endorsed by the publisher.
References
Brutsaert, W. H. (1982). Exchange processes at the earth-atmosphere interface. Eng. Meteorol. 9 102. doi:10.3390/atmos9030102
Businger, J. A., Wyngaard, J. C., Izumi, Y., and Bradley, E. F. (1971). Flux-profile relationships in the atmospheric surface layer. J. Atmos. Sci. 28 (2), 181–189. doi:10.1175/1520-0469(1971)028<0181:FPRITA>2.0.CO;2
Chen, J., Zhao, L., Sheng, Y., Li, J., Wu, X., Du, E., et al. (2016). Some characteristics of permafrost and its distribution in the gaize area on the qinghai—tibet Plateau, China. Arct. Antarct. Alp. Res. 48 (2), 395–409. doi:10.1657/AAAR0014-023
Chen, X., Su, Z., Ma, Y., Yang, K., and Wang, B. (2013). Estimation of surface energy fluxes under complex terrain of Mt. Qomolangma over the Tibetan Plateau. Hydrol. Earth Syst. 17, 1607–2017. doi:10.5194/hessd-9-10411-2012
Cheng, G., and Wang, S. L. (1982). Experimental classification of high-altitude permafrost zone in China. J. Glaciol. Geocryol. 2, 1–17.
Chou, Y., Yu, S., Li, Y., Wei, Z., Zhu, Y., and Li, J. (2010). Sunny–shadowy slope effect on the thermal and deformation stability of the highway embankment in warm permafrost regions. Cold Reg. Sci. Technol. 63, 78–86. doi:10.1016/j.coldregions.2010.05.001
Ding, J., Wang, T., Piao, S., Smith, P., Zhang, G., Yan, Z., et al. (2019). The paleoclimatic footprint in the soil carbon stock of the Tibetan permafrost region. Nat. Commun. 10 (1), 4195–4199. doi:10.1038/s41467-019-12214-5
Dyer, A. J. (1974). A review of flux-profile relationships. Bound. Layer. Meteorol. 7 (3), 363–372. doi:10.1007/BF00240838
Fan, X., Lin, Z., Gao, Z., Meng, X., Niu, F., Luo, J., et al. (2021). Cryostructures and ground ice content in ice-rich permafrost area of the Qinghai-Tibet Plateau with computed tomography scanning. J. Mt. Sci. 18 (5), 1208–1221. doi:10.1007/s11629-020-6197-x
Grachev, A. A., Fairall, C. W., Blomquist, B. W., Fernando, H., Leo, L. S., Otarola-Bustos, S. F., et al. (2020). On the surface energy balance closure at different temporal scales. Agric. For. Meteorol. 281, 107823. doi:10.1016/j.agrformet.2019.107823
Halbach, K., Mikkelsen, O., Berg, T., and Steinnes, E. (2017). The presence of mercury and other trace metals in surface soils in the Norwegian Arctic. Chemosphere 188, 567–574. doi:10.1016/j.chemosphere.2017.09.012
Högström, U. L. F. (1988). Non-dimensional wind and temperature profiles in the atmospheric surface layer: A re-evaluation. Bound. Layer. Meteorol. 42, 55–78. doi:10.1007/BF00119875
Hu, Z., Qian, Z., and Cheng, G. (2002). Influence of solar radiation on embankment surface thermal regime of the qinghai-xizang railway. J. Glaciolgy Geocryol. 24 (2), 121–128. doi:10.1002/mop.10502
Immerzeel, W. W., Lutz, A. F., Andrade, M., Bahl, A., Baillie, J., Bolch, T., et al. (2020). Importance and vulnerability of the world's water towers. Nature 577, 364–369. doi:10.1038/s41586-019-1822-y
Lan, A., Lin, Z., Fan, X., and Yao, M. (2021). Differences of surface energy and shallow soil temperature and humidity at sunny and shadowy slopes in permafrost region, Beiluhe Basin, qinghai-Tibet Plateau. Adv. Earth Sci. 36 (9), 962–979. doi:10.11867/j.issn.1001-8166.2021.081
Lin, Z., Gao, Z., Fan, X., Niu, F., Luo, J., Yin, G., et al. (2020). Factors controlling near surface ground-ice characteristics in a region of warm permafrost, Beiluhe Basin, Qinghai-Tibet Plateau. Geoderma 376, 114540. doi:10.1016/j.geoderma.2020.114540
Lin, Z., Gao, Z., Niu, F., Luo, J., Yin, G., Liu, M., et al. (2019). High spatial density ground thermal measurements in a warming permafrost region, Beiluhe Basin, Qinghai-Tibet Plateau. Geomorphology 340 (SEP.1), 1–14. doi:10.1016/j.geomorph.2019.04.032
Liu, S., Peng, W., Huang, F., and Chi, D. (2002). Effects of turbulent dispersion on the wind speed profile in the surface layer. Adv. Atmos. Sci. 19 (5), 794–806. doi:10.1007/s00376-002-0045-5
Luo, J., Lin, Z., Yin, G., Niu, F., Liu, M., Gao, Z., et al. (2019). The ground thermal regime and permafrost warming at two upland, sloping, and undisturbed sites, Kunlun Mountain, Qinghai-Tibet Plateau. Cold Reg. Sci. Technol. 167, 102862. doi:10.1016/j.coldregions.2019.102862
Luo, X., Yu, Q., Ma, Q., and Guo, L. (2020). Study on the heat and deformation characteristics of an expressway embankment with shady and sunny slopes in warm and ice-rich permafrost regions. Transp. Geotech. 24, 100390. doi:10.1016/j.trgeo.2020.100390
Ma, W., Shi, C., Wu, Q., Zhang, L., and Wu, Z. J. (2006). Monitoring study on technology of the cooling roadbed in permafrost region of Qinghai–Tibet Plateau. Cold Reg. Sci. Technol. 44 (1), 1–11. doi:10.1016/j.coldregions.2005.06.002
Ma, Y., Ma, W., Hu, Z., Li, M., Wang, J., Ishikawa, Y., et al. (2002). Similarity analysis of atmospheric turbulent intensity over grassland surface of Qinghai-Xizang Plateau. Plateau Meteorol. 5, 514–517.
Morino, C., Conway, S. J., Balme, M. R., Helgason, J. K., Smundsson, O., Jordan, C., et al. (2021). The impact of ground-ice thaw on landslide geomorphology and dynamics: Two case studies in northern Iceland. Landslides 18, 2785–2812. doi:10.1007/s10346-021-01661-1
Mu, C., Schuster, P. F., Abbott, B. W., Kang, S., Guo, J., Sun, S., et al. (2019). Permafrost degradation enhances the risk of mercury release on Qinghai-Tibetan Plateau. Sci. Total Environ. 708, 135127. doi:10.1016/j.scitotenv.2019.135127
Mu, C., Zhang, T., Wu, Q., Peng, X., Cao, B., Zhang, X., et al. (2015). Editorial: Organic carbon pools in permafrost regions on the qinghai–xizang (Tibetan) plateau. Cryosphere 99 (22), 479–486. doi:10.5194/tc-9-479-2015
Niu, F., Cheng, G., Ni, W., and Jin, D. (2005). Engineering-related slope failure in permafrost regions of the Qinghai-Tibet plateau. Cold Reg. Sci. Technol. 42 (3), 215–225. doi:10.1016/j.coldregions.2005.02.002
Niu, F., Lin, Z., Liu, H., and Lu, J. (2011). Characteristics of thermokarst lakes and their influence on permafrost in Qinghai–Tibet Plateau. Geomorphology 132, 222–233. doi:10.1016/j.geomorph.2011.05.011
Pahlow, M., Parlange, M. B., and Porté-Agel, F. (2001). On Monin–Obukhov similarity in the stable atmospheric boundary layer. Bound. Layer. Meteorol. 99, 225–248. doi:10.1023/A:1018909000098
Pan, X., Liu, Y., Fan, X., and Gan, G. (2017). Two energy balance closure approaches: Applications and comparisons over an oasis-desert ecotone. J. Arid. Land 9 (001), 51–64. doi:10.1007/s40333-016-0063-2
Paulson, C. A. (1970). The mathematical representation of wind speed and temperature profiles in the unstable atmospheric surface layer. J. Appl. Meteor. 9 (6), 857–861. doi:10.1175/1520-0450(1970)009<0857:tmrows>2.0.co;2
Su, Z. (2002). The surface energy balance system (SEBS) for estimation of turbulent heat fluxes. Hydrol. Earth Syst. Sci. 6 (1), 85–100. doi:10.5194/hess-6-85-2002
Sun, S., Kang, S., Huang, J., Chen, S., Zhang, Q., Guo, J., et al. (2017). Distribution and variation of mercury in frozen soils of a high-altitude permafrost region on the northeastern margin of the Tibetan Plateau. Environ. Sci. Pollut. Res. 24 (17), 15078–15088. doi:10.1007/s11356-017-9088-0
Tai, B., Liu, J., and Chang, D. (2020). Experimental and numerical investigation on the sunny-shady slopes effect of three cooling embankments along an expressway in warm permafrost region, China. Eng. Geol. 269, 105545. doi:10.1016/j.enggeo.2020.105545
Wang, G., Li, Y., Wu, Q., and Wang, Y. (2006). Impacts of permafrost changes on alpine ecosystem in qinghai-tibet plateau. Sci. China Ser. D. 49 (011), 1156–1169. doi:10.1007/s11430-006-1156-0
Wang, J., Wang, W., Liu, S., Ma, M., and Li, X. (2009). The problems of surface energy balance closure—An overview and case study. Adv. Earth Sci. 24 (7), 705–713. doi:10.1016/S1874-8651(10)60080-4
Wang, S., Huo, M., and Zhou, W. (2004). Subgrade failure of Qinghai-Tibet highway in permafrost area. Highway 5, 22–26.
Wen, Z., Sheng, Y., Ma, W., Wu, Q., and Li, H. (2009). Ground temperature and deformation laws of highway embankments in degenerative permafrost regions. Chin. J. Rock Mech. Eng. 28 (7), 1477–1483. doi:10.3321/j.issn:1000-6915.2009.07.022
Wilson, K., Goldstein, A., Falge, E., Aubinet, M., Verma, S., Berbigier, P., et al. (2002). Energy balance closure at fluxnet sites. Agric. For. Meteorol. 113 (1-4), 223–243. doi:10.1016/S0168-1923(02)00109-0
Wu, Q., Liu, Y., and Hu, Z. (2011). The thermal effect of differential solar exposure on embankments along the Qinghai–Tibet railway. Cold Reg. Sci. Technol. 66 (1), 30–38. doi:10.1016/j.coldregions.2011.01.001
Wu, X., Zhao, L., Hu, G., Liu, G., Li, W., and Ding, Y. (2018). Permafrost and land cover as controlling factors for light fraction organic matter on the southern Qinghai-Tibetan plateau. Sci. Total Environ. 613-614, 1165–1174. doi:10.1016/j.scitotenv.2017.09.052
Yan, X., Hu, Z., Sun, G., and Xie, Z. (2018). Comparison of four surface flux calculation methods on alpine grassland in Nagqu[J]. Plateau Meteorol. 37 (02), 358–370.
Yang, K., and Wang, J. (2008). A temperature prediction-correction method for estimating surface soil heat flux from soil temperature and moisture data. Sci. China Ser. D-Earth. Sci. 51, 721–729. doi:10.1007/s11430-008-0036-1
Yao, T., Bolch, T., Chen, D., Gao, J., Immerzeel, W., Piao, S., et al. (2022). The imbalance of the asian water tower. Nat. Rev. Earth Environ 3, 618–632. doi:10.1038/s43017-022-00299-4
Yin, G., Niu, F., Lin, Z., Luo, J., and Liu, M. (2017). Effects of local factors and climate on permafrost conditions and distribution in Beiluhe basin, Qinghai-Tibet Plateau, China. Sci. Total Environ. 581-582, 472–485. doi:10.1016/j.scitotenv.2016.12.155
You, Q., Xue, X., Peng, F., Dong, S., and Gao, Y. (2017). Surface water and heat exchange comparison between alpine meadow and bare land in a permafrost region of the Tibetan Plateau. Agric. For. Meteorol. 232, 48–65. doi:10.1016/j.agrformet.2016.08.004
Yue, P., Zhang, Q., Niu, S., Cheng, H., and Wang, X. (2012). Characters of surface energy balance over a semi-arid grassland and effects of soil heat flux on energy balance closure. Acta Meteorol. Sin. 70 (1), 136–143. doi:10.1007/s11783-011-0280-z
Zhang, G., Nan, Z., Hu, N., Yin, Z., Zhao, L., Cheng, G., et al. (2022). Qinghai-Tibet Plateau permafrost at risk in the late 21st century. Earth's. Future 10 (6), e2022EF002652. doi:10.1029/2022EF002652
Zhang, G., Nan, Z., Zhao, L., Liang, Y., and Cheng, G. (2021). Qinghai-Tibet Plateau wetting reduces permafrost thermal responses to climate warming. Earth Planet. Sci. Lett. 562, 116858. doi:10.1016/j.epsl.2021.116858
Zhang, M., Pei, W., Li, S., Lu, J., and Jin, L. (2017). Experimental and numerical analyses of the thermo-mechanical stability of an embankment with shady and sunny slopes in a permafrost region. Appl. Therm. Eng. 127, 1478–1487. doi:10.1016/j.applthermaleng.2017.08.074
Zhao, L., Hu, G., Zou, D., Wu, X., and Liu, S. (2019). Permafrost changes and its effects on hydrological processes on Qinghai-Tibet Plateau. Bull. Chin. Acad. Sci. 34 (11), 1233–1246. doi:10.16418/j.issn.1000-3045.2019.11.006
Zhou, F., Yao, M., Fan, X., Yin, G., Meng, X., and Lin, Z. (2022). Evidence of warming from long-term records of climate and permafrost in the hinterland of the Qinghai–Tibet Plateau. Front. Environ. Sci. 10, 836085. doi:10.3389/fenvs.2022.836085
Keywords: permafrost, energy balance, soil heat flux, slope effect, slope aspect
Citation: Fan X, Lin Z, Niu F, Lan A, Yao M and Li W (2022) Near-surface heat transfer at two gentle slope sites with differing aspects, Qinghai-Tibet Plateau. Front. Environ. Sci. 10:1037331. doi: 10.3389/fenvs.2022.1037331
Received: 05 September 2022; Accepted: 06 October 2022;
Published: 20 October 2022.
Edited by:
Hong Liao, Nanjing University of Information Science and Technology, ChinaReviewed by:
Huini Wang, Wuhan Institute of Technology, ChinaGuofei Zhang, Lanzhou University, China
Xiaoqing Peng, Lanzhou University, China
Copyright © 2022 Fan, Lin, Niu, Lan, Yao and Li. This is an open-access article distributed under the terms of the Creative Commons Attribution License (CC BY). The use, distribution or reproduction in other forums is permitted, provided the original author(s) and the copyright owner(s) are credited and that the original publication in this journal is cited, in accordance with accepted academic practice. No use, distribution or reproduction is permitted which does not comply with these terms.
*Correspondence: Zhanju Lin, zhanjulin@lzb.ac.cn