Allocation and optimization of carbon emission permits considering fairness and efficiency under the dual-carbon background
 Yong Xiao
  Pinjie Xie
- School of Economics and Management, Shanghai University of Electric Power, Shanghai, China
Reasonable and effective allocation of carbon emission permits is one of the important tasks to achieve the goal of carbon neutrality. Based on the difference in carbon emission reduction contribution and capability of the industries, this paper proposes a carbon emission permits allocation and optimization scheme that take into account fairness and efficiency. First, based on fairness principle, establish a carbon emission quota system of the six industries and determine the index weights, and use the comprehensive index method to realize the initial allocation of carbon emission permits. Then, on the basis of evaluating the initial carbon emission permits allocation efficiency, based on efficiency principle, the zero sum gains data envelopment analysis (ZSG-DEA) model is used to iteratively obtain the optimal allocation scheme of carbon emission permits. Example analysis shows that the carbon permit allocation and optimization model based on fairness and efficiency principles proposed can realize the optimal allocation of industrial carbon emission permits, ensure the optimal efficiency of industrial carbon permit allocation, and provide adequate support for the carbon emission reduction decisions of the six industries.
1 Introduction
With the acceleration of economic development and industrialization, China’s energy demand is constantly increasing, and energy consumption and carbon emissions remain high. In 2021, China’s energy consumption was 157.65 EJ, accounting for 26.5% of the total global energy consumption. At the same time, China’s carbon emissions were 10.52 billion tons, accounting for 31.1% of the world’s carbon emissions. China’s energy consumption and carbon emissions are ranked first in the world (BP, 2022). On the one hand, the massive emission of carbon dioxide causes global warming, which seriously threatens the living environment of human beings. On the other hand, high energy intensity and carbon emission intensity do not meet the requirements of high-quality economic development in China (Shi and Wu, 2018). China pledged at the Paris Climate Conference in 2015 to reduce its carbon emission intensity by 60%–65% by 2030 compared with 2005 and proposed the “dual carbon” goal at the UN General Assembly in 2020, namely carbon peaking and carbon neutrality. China divides all industries into six categories, namely “agriculture, forestry, animal husbandry, fishery and water conservancy”, “the processing and manufacturing industry”, construction, “transportation, warehousing and postal service ", “wholesale, retail, accommodation and catering” and other industries. According to China Statistical Yearbook (National Bureau of Statistics of China, 2021), the six pillar industries account for more than 85% of energy consumption, and are the primary source of carbon emissions in China. In order to fulfill the Chinese commitment to protect the ecological environment and achieve sustainable development, China should take measures to encourage the six pillar industries to actively undertake carbon emission reduction responsibilities and fulfill carbon emission reduction obligations. To achieve this, we need to determine the total carbon emissions of the six pillar industries and allocate them to each industry, urging each industry to use its own carbon emission permits as the baseline to reduce emissions. The key to realizing the rational allocation of carbon emission permits is to fully consider the utilization efficiency of carbon emission permits of all industries under the premise of ensuring fairness. Therefore, it is necessary to predict and allocate the carbon emissions based on the characteristics of the six industries, evaluate the distribution efficiency of carbon emission permits of the industries and put forward the optimization scheme of carbon permit allocation considering the carbon emission efficiency.
2 Literature review
At present, scholars worldwide have conducted much research on carbon permit allocation from different perspectives and using different methods. Kai et al. (2019) adopted the non-radial ZSG-DEA model to allocate carbon emission permits of different provinces in China from the technical efficiency level. On this basis, Zhuang et al. (2016) changed carbon emissions as an input indicator to an undesirable output indicator for research, and the optimized model better reflected the macro production process. Yu et al. (2014) proposed an allocation method of carbon emission reduction based on particle swarm optimization, fuzzy C-means clustering, and Shapley decomposition. According to KAYA identity, the method decomposed the total carbon emissions into the interaction results of 4 components composed of 13 macro influencing factors and divided 30 provinces in China into four categories according to the influencing factors. To determine the burden-sharing of carbon emission reduction among provinces in China, Chu et al. (2012) used the SBM model to estimate the carbon emission reduction potential and marginal emission reduction cost of 29 provinces in China, and the capacity index of carbon emission reduction was constructed based on weighted equity and efficiency indicators. On the premise of historical transfer of carbon emissions, Zhou et al. (2021) calculated the cumulative net carbon emissions of Chinese provinces based on the principle of consumer responsibility and preliminarily allocated the carbon emission permit of Chinese provinces in 2020 according to the principles of fairness, efficiency, and sustainability, and evaluated the carbon emission efficiency of each province under the preliminary allocation scheme. Considering the unbalanced development of different cities, Li et al. (2018) adopted the maximum deviation method to allocate the carbon emission permits in the Pearl River Delta region based on fairness, efficiency, and feasibility principles. In order to solve the problem that most current allocation methods only focused on a single performance goal, which led to conflicts between participants at different levels, Li et al. (2018) proposed a dual-objective programming model that contained two sub-objective functions of emission reduction cost and carbon asset. For evaluating the impact of energy consumption structure on carbon emission performance of Bohai Rim economic Circle, Chang et al. (2020) constructed a directional distance function and assumed two scenarios, and finally established a two-stage allocation model of carbon emission permits.
Most of the above literature focused on the inter-provincial assessment of carbon emission efficiency and allocation of carbon emission permits, and few considered the allocation efficiency of carbon emission permits from the perspective of industries. However, the study on the allocation of carbon emission permits between industries can help enterprises in various industries to clarify their responsibility for emission reduction. Meanwhile, by comparing the efficiency of carbon permit allocation between industries, national and local governments can reasonably guide the adjustment of industrial structure, which is conducive to the realization of carbon peak and carbon neutrality. Rong et al. (2018) and Ru et al. (2020) allocated carbon emission permits from the industry level based on the GDP of six pillar industries, and used the ZSG-DEA model to optimize and adjust the allocation of the carbon permits. However, those studies focused on the optimal secondary allocation of carbon emission permits. They did not consider constructing the index system of the initial allocation of carbon emission permits from multiple perspectives, which could not reasonably reflect the vital role of the fairness principle in the carbon permit allocation. At the same time, in order to study the impact of different scenarios on the carbon permit allocation, most studies used scenario analysis. However, this method has static limitations and cannot measure the probability of the predicted value of the total amount of carbon emission rights, so it is not easy to analyze the most likely scenario.
On account of the above considerations, this paper constructs a carbon emission allocation and optimization scheme based on the principles of fairness and efficiency. First, based on the principle of fairness and considering the emission reduction responsibility of industries, we build a carbon emission indicator system to measure emission reduction capacity, responsibility, and potential. Secondly, the index weights of the carbon permit allocation are determined by the entropy weight method, and the carbon emission permit is initially allocated to each industry under three different scenarios. Finally, we use the ZSG-DEA model to evaluate the efficiency of carbon permit allocation in six industries under three scenarios and then adjust to get the optimal allocation scheme of carbon emission permits. The Monte-Carlo simulation is used to realize the dynamic evaluation of the total amount of carbon emission permits based on scenario analysis.
3 Materials and methods
3.1 Primary allocation
3.1.1 Indicator system
As the carbon emission contribution and emission reduction capacity of different industries are different, the emission reduction responsibilities of different industries are different based on the fairness principle (Wan and Yu, 2020). We adopt the comprehensive index method to realize the primary allocation of carbon emissions between the six industries based on the fairness principle. Therefore, we need to select appropriate indicators to measure the six industries’ emission reduction ability, responsibility, and potential.
The higher the economic development level of industry is, the more capable it is to reduce carbon emissions so that GDP can be a good indicator of the industry’s emission reduction capacity (Kai and Hao, 2016). The industries emit different amounts of carbon dioxide during their development, and according to the polluter pays principle, the industries that have historically emitted more should be more responsible for reducing emissions (Martin et al., 2019). Meanwhile, energy intensity is an effective indicator to measure energy utilization efficiency. The higher the energy intensity of an industry, the greater the carbon reduction potential of the industry (Shahiduzzaman and Alam, 2013). To sum up, based on the principle of fairness, we select GDP, historical carbon emissions, and energy intensity from 2005 to 2019 as indicators to construct an indicator system of carbon permit allocation containing capacity, responsibility, and potential, as shown in Table 1.
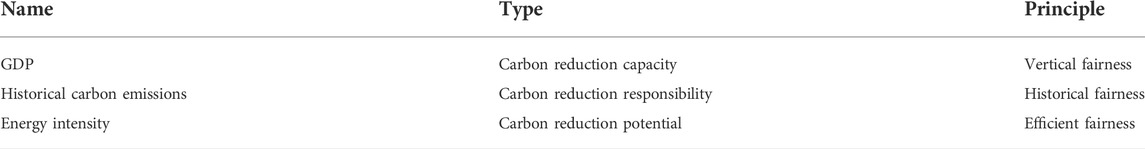
TABLE 1. The index system of carbon permit allocation based on the fairness principle.
3.1.2 Index weight
We used the comprehensive index method to allocate the initial carbon emission permits for six industries, and the index’s weight needed to be calculated. Entropy can be used to quantify the importance of an indicator. The smaller the entropy value of an indicator is, the more information it contains, and the more significant its proportion in the comprehensive evaluation is (Yan et al., 2019). Therefore, the entropy method can be used to calculate the index weight of the comprehensive index method, and the calculation steps are as follows:
Firstly, the dimensionless method is carried out for index data because the types and dimensions of each index are different. The processing Eqs. 1, 2.
Where Eq. 1 is the dimensionless processing formula for high-quality indicators; Eq. 2 is the dimensionless processing formula for low optimal indicators;
Then the normative matrix can be expressed as Eq. 3:
Next, according to (4), we calculate the proportion of
Finally, the information entropy
Based on the above calculation, the weight of the evaluation indicator
3.1.3 Carbon permit allocation
We construct a composite index to allocate carbon emission permits for 2030 based on emission reduction capacity, emission reduction responsibility, and emission reduction potential, represented by industry gross domestic product, historical carbon emissions, and energy intensity. If
Where
In order to make a direct comparative analysis of the industry composite index, we standardize the data and get Eq. 8.
At the 2015 climate conference in Paris, China promised to reduce its carbon emission intensity between 60% and 65% by 2030 compared with 2005, which means that China’s six industries’ carbon emission reduction target in 2030 is 60%–65% on average the basis of 2005. The study uses a 60% reduction in carbon intensity as a reference point, so we get carbon intensity in 2030 at 40% of the 2005 level. The carbon emission intensity in 2030 can be defined as Eq. 9.
Where
According to the relationship of carbon emission intensity between 2030 and 2005, the carbon emission intensity of the industries can be obtained as follows:
Where
The larger
Where
According to GDP forecast and carbon emission permit forecast, the distributable carbon emission amount of six industries in 2030 can be obtained, and the calculation function is
Where
At the same time,
Where
Combining Eqs. 11–13,
Finally, the carbon emission quota of industry
3.2 Optimal allocation
After completing the initial allocation of industrial carbon emission permits based on the principle of fairness, the efficiency of the allocation should be further evaluated. If the allocation scheme is not optimal, it needs to be optimized and adjusted. Since the total amount of carbon emission permits is fixed, the increase and decrease of carbon emission permits in one industry will inevitably lead to the decrease and increase of carbon emission permits in other industries (Guo et al., 2021). ZSG-DEA is a method to evaluate the efficiency of Multiple Input Multiple Output decision-making problems, and the input can be optimized and adjusted to achieve optimal efficiency on the premise that the total amount remains unchanged (Mian et al., 2020).
We use the input-oriented ZSG-DEA to evaluate the initial allocation efficiency of carbon emission permits and conduct optimization iterations to obtain the optimal allocation scheme of carbon emission permits. Referring to Gomes and Lins. (2008) and Cui et al. (2021), the unexpected output (carbon emission permit of six industries) is taken as the input variable, and the GDP and energy consumption of six industries are taken as the output variables.
Where
In this model,
3.3 Data
3.3.1 Carbon emission
There are four methods to measure carbon emissions: field measurement method, life cycle assessment method, carbon emission coefficient method, and input-output method (Fenner et al., 2018; Thomas et al., 2018; Yin et al., 2020; Zhao, 2020). The field measurement method and life cycle assessment method, which mainly measure carbon emissions from a project perspective, depend highly on project data, but these data are often not fully or accurately obtained. The input-output method has high accuracy, but a massive amount of data leads calculation to be error-prone. Meanwhile, the carbon emission coefficient method is convenient for obtaining data, and its calculation process is simple. Therefore, the carbon emission coefficient method is adopted to calculate the total carbon emission.
3.3.2 Indicator data
First, we should note that the data of six industries’ GDP and energy consumption come from China Statistical Yearbook. Taking 2005 as the base period, the constant prices of GDP in each year are obtained. According to the energy consumption and the carbon emission coefficient method, the carbon emissions of the six industries from 2005 to 2019 are calculated respectively. Then we sum the carbon emissions of the same industry from 2005 to 2019 to obtain the industry’s total carbon emissions. The six industries’ energy intensity is calculated by dividing the six industries’ energy consumption by the six industries’ GDP. The data of each indicator are shown in Table 2.
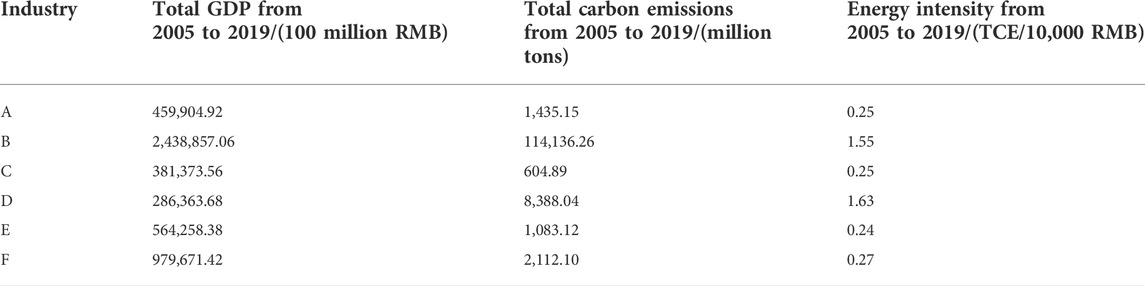
TABLE 2. Indicator data of carbon permit allocation.
In all the tables, A represents “agriculture, forestry, animal husbandry, fishing and water conservancy”; B represents the processing and manufacturing industry; C represents construction; D represents “transportation, storage, and postal service”; E represents “wholesale, retail, accommodation, and catering”; F represents other industries; TCE represents ton of standard coal equivalent.
3.3.3 Carbon intensity
The calculation formula for carbon emission intensity of the six industries is Eq. 18.
Where
The carbon intensity of the six industries in 2005 is shown in Table 3. According to Eq. 9, the total carbon intensity of the six industries is expected to be 1.269 tons/10,000 RMB in 2030.
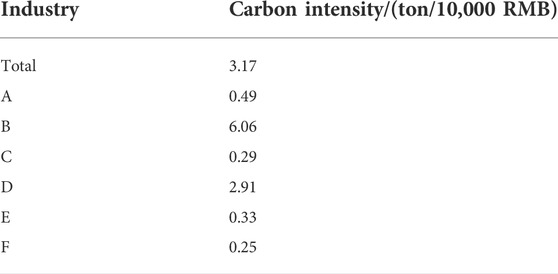
TABLE 3. Carbon intensity of six industries in 2005.
4 Empirical analysis
4.1 Scenario setting
In order to better predict the carbon permit allocation of six industries in 2030, we adopt scenario analysis to analyze the carbon permit allocation of six industries and set up three different scenarios. As GDP and energy consumption are the main influencing factors of carbon emissions (Meng et al., 2018), the scenario analysis indicator system is established based on GDP and energy consumption.
In the basic scenario, the six industries’ GDP in 2030 is predicted based on the GDP data from 2005 to 2020. The GDP growth rate is determined by combining the actual GDP in 2020 and the projected GDP in 2030 of the six industries.
In the basic scenario, the energy consumption prediction formula of the six industries in 2030 is Eq. 19.
Where
Based on the basic scenario, the growth rate of GDP and change rate of energy intensity fluctuate 1% and 0.5%, respectively, to set scenario 1 and scenario 2. The indicators’ values of each scenario are shown in Table 4.
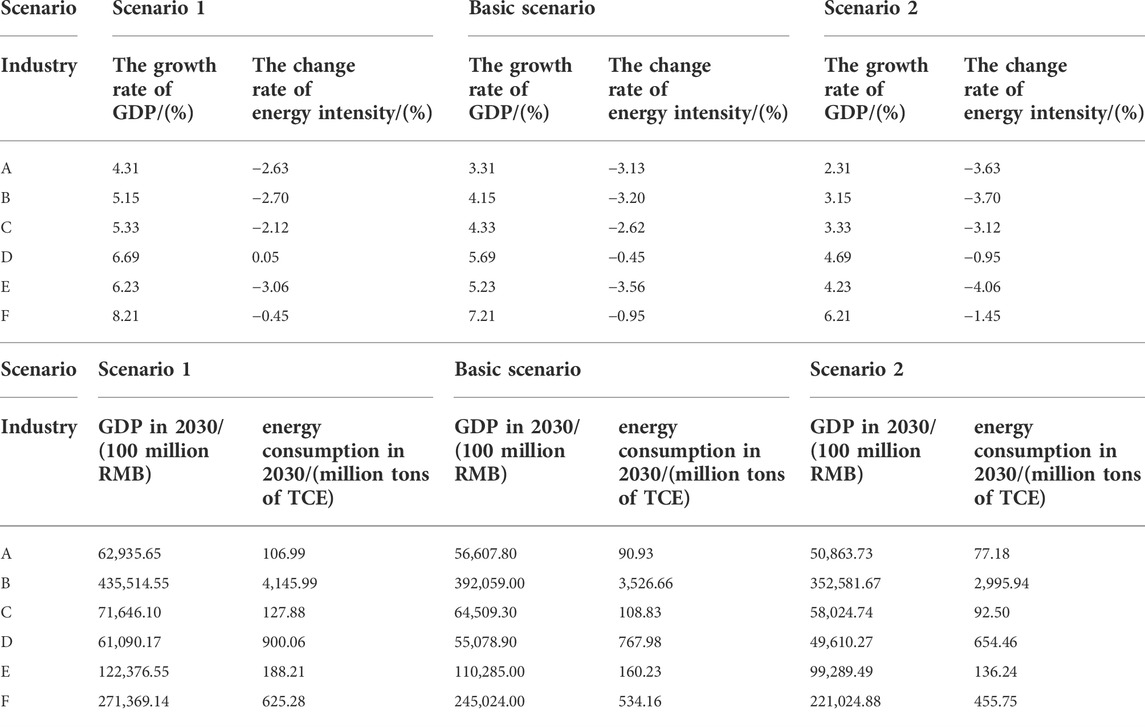
TABLE 4. Parameters of scenario analysis.
4.2 Initial allocation of carbon emission permits
In order to meet Chinese commitment, carbon emission permits need to be distributed among six industries. The comprehensive index method is used to make the initial allocation of carbon emission permits for six industries in 2030, and DEAP 2.1 is used to calculate the initial allocation efficiency of carbon emission permits. It can be seen from Table 5 that the initial allocation efficiency of carbon emission permits varies greatly in all industries under the three scenarios. Only the efficiency of other industries reaches 1, which is an effective decision-making unit. The efficiency of the remaining five industries is relatively low, and the allocation efficiency of the processing and manufacturing industry is only 0.28, which is seriously low. Therefore, it is necessary to optimize the allocation of carbon emission permits for six industries and improve the efficiency of carbon permit allocation.
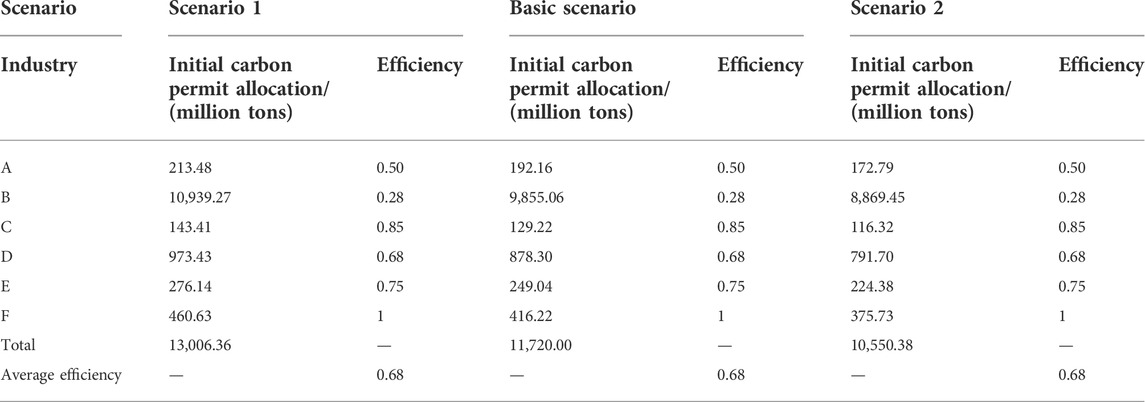
TABLE 5. Initial carbon permit allocation of six industries.
4.3 Optimal allocation of carbon emission permits
In order to achieve an effective allocation of carbon emission permits, we adopt the ZSG-DEA model to optimize the allocation of carbon emission permits for each industry and improve the allocation efficiency of carbon emission permits. As shown in Table 6, the average efficiency of carbon permit allocation shows an upward trend in the iterative process and reaches 1, which means that the efficiency is optimal. It is important to note that the efficiency of carbon permit allocation except the processing and manufacturing industry seriously declines in the first optimization iteration results because many industrial carbon emission permits are transferred from the processing and manufacturing industry to the other industries, resulting in excess carbon emission permits for the other industries. However, in subsequent iterations, the efficiency of all industries continues to rise and reaches optimum.
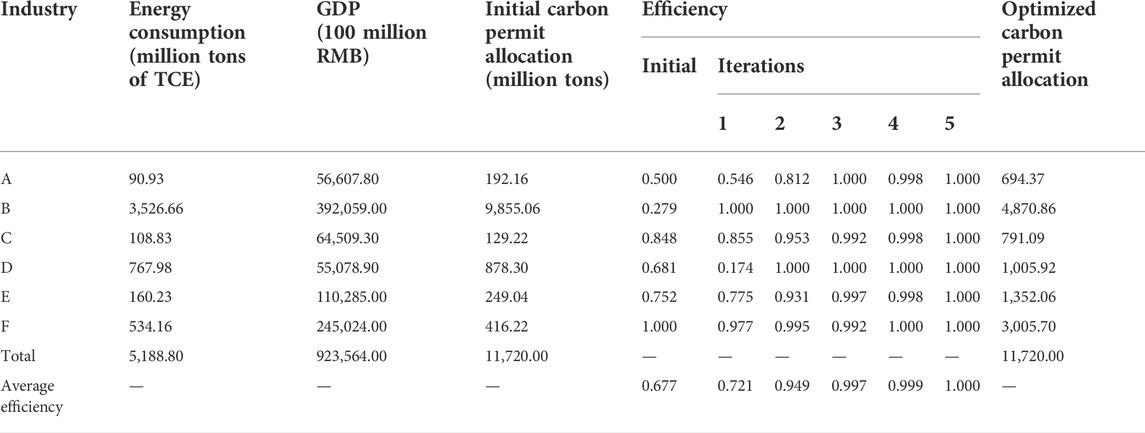
TABLE 6. Optimization of carbon permit allocation in the basic scenario.
It can be seen from Table 7 that, in the three scenarios, the industry where carbon emission permit needs to transfer from are the processing and manufacturing industry, and the other five industries are industries where carbon emission permit needs to transfer into. This is because, compared with the other five industries, the efficiency of the processing and manufacturing industry is seriously low, and the processing and manufacturing industry has tremendous carbon reduction potential.
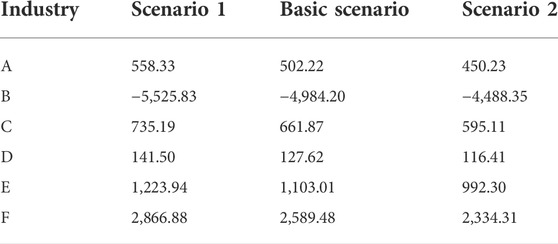
TABLE 7. Transfer amount of carbon emission permit in the three scenarios (unit: million tons).
It should be pointed out that the industries where carbon emission permit needs to transfer do not necessarily need to use increased carbon permit by themselves. They can sell carbon emission permits to the industries that need to purchase carbon emission permits in the carbon trading market and make profits as a reward for efficiently utilizing carbon emission permits. At the same time, the efficiency of carbon emission permits is relative. If the carbon emission intensity of an industry remains unchanged, the efficiency will decrease with the continuous reduction of the carbon intensity of the other industries, and the carbon emission permit will decrease accordingly. Therefore, in addition to the processing and manufacturing industry, the other five industries should also continuously reduce carbon intensity and prevent themselves from becoming the industries where carbon emission permits must transfer from.
4.4 Monte-carlo simulation
Due to the static limitations of scenario analysis, it is impossible to predict various possible scenarios of the total amount of carbon emission rights in 2030, which is not conducive to targeted analysis. In this part, the Monte-Carlo simulation is used to dynamically predict the total amount of carbon emission rights in 2030, and the interval distribution of total carbon emissions is obtained.
Since the carbon intensity in 2030 has been assumed, the dynamic prediction of the total carbon emission permit can be realized by the GDP prediction six industries in 2030. The probability distribution of each variable is shown in Table 8. The value of each variable is based on the scenario analysis method mentioned above. The highest probability value is the same as the basic scenario, and the two values of lowest probability are the same as scenario 1 and scenario 2, respectively.
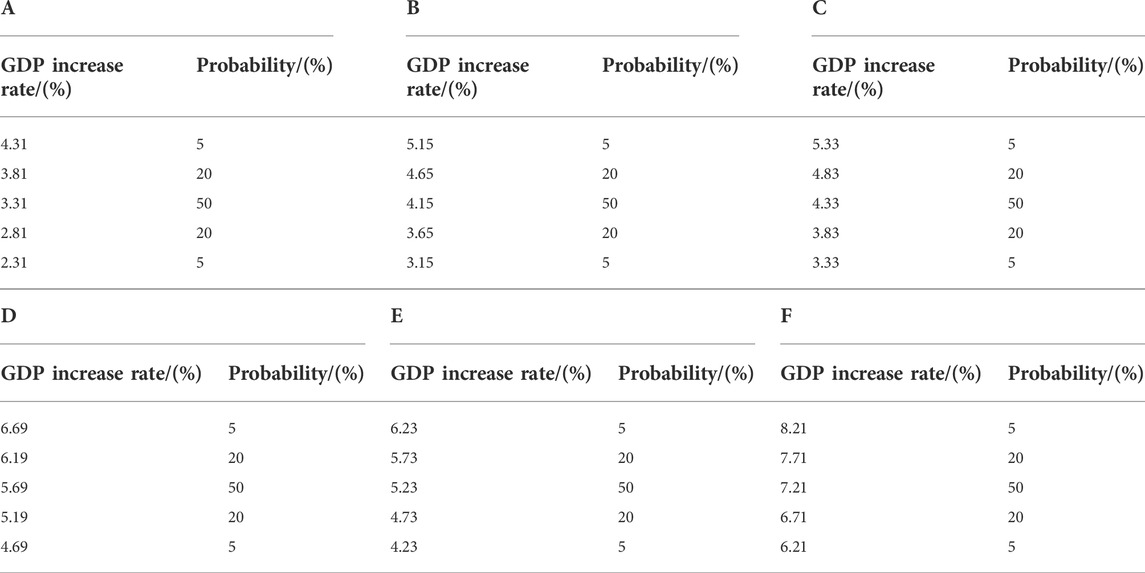
TABLE 8. Parameters of Monte-Carlo simulation.
According to the GDP increase rate and probability distribution of six industries listed in Table 8, 100,000 Monte-Carlo simulations about carbon emissions are run, and ten equal length intervals are divided for data statistics of simulative results. The statistical result is shown in Figure 1, where all the possible scenarios of total carbon permit in 2030 can be seen. Among 100,000 simulations, the times of simulative results fall in the range [11,532.77:11,778.37] are the most. In other words, the total carbon emission permit of six industries is most likely to fall between 11,532.77 million tons and 11,783.37 million tons under the condition of expected economic growth. It should be pointed out that the total carbon emission permit may fall in other small probability range under some exceptional circumstances. For example, the government may reduce the total carbon emission permit to ensure that the industries continue to reduce carbon intensity because slump of economic growth rate, the smooth realization of energy structure adjustment, and technological progress result in substantial reduction of carbon emissions. On the contrary, if the energy structure adjustment is blocked, the severe shortage of carbon emission permits will lead to abnormal development of the industry. The government will increase the total carbon emission permit to maintain the regular operation of the industries.
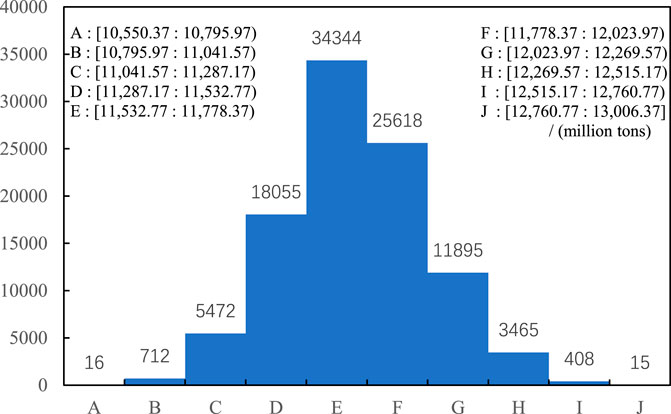
FIGURE 1. Monte-Carlo simulation about carbon emission permits in 2030.
5 Conclusion
This paper discusses the distribution of carbon emission permits in China at the industry level. Based on the principle of fairness, we establish a distribution system of carbon emission permits for six industries, use the entropy weight method to calculate the weight of evaluation indicators, and use the comprehensive index method to realize the initial distribution of carbon emission permits to the industries. The ZSG-DEA model is used to evaluate the initial efficiency of carbon emission permit allocation, and the optimal scheme of carbon permit allocation is obtained through optimization iteration. Numerical analysis of three different scenarios verifies the model’s validity, practicability, and operability. It draws the following conclusions:
(1) Based on the principle of fairness, the initial allocation of carbon emission permits in the six industries is low, and the scheme of carbon permit allocation is required to be optimized. (2) Based on the principle of efficiency, we can optimize the initial allocation of carbon emission permits. After optimization and iteration, the efficiency is optimal. At the same time, it is concluded that the processing and manufacturing industry is the industry with the most emission reduction potential among the six major industries. (3) According to the results of the Monte Carlo simulation experiment, the carbon emissions of the six major industries in China in 2030 are most likely to be between 11,532.77 million tons and 11,778.37 million tons.
Based on the research conclusions, the following suggestions are put forward:
(1) The processing and manufacturing industry has the largest carbon emission volume and the highest carbon emission reduction potential among the six pillar industries, and the government should focus on promoting the implementation of carbon emission reduction in the processing and manufacturing industry. At the same time, the implementation of carbon emission reduction work in the other five industries should be taken into account to prevent the carbon emissions of the other five industries from increasing instead of decreasing. (2) The government should strengthen the responsibility for carbon emission reduction targets in the six pillar industries in light of the various situations that may occur in the carbon emissions of the six pillar industries. According to the different characteristics of the six pillar industries, differentiated emission reduction targets are set, and corresponding industry policies are formulated to promote the optimization and upgrading of the industrial structure and reduce the industry’s energy intensity and carbon emission intensity. (3) The government should speed up the construction of the carbon trading market and establish a scientific and perfect mechanism for the use and trading of carbon emission permits. By increasing carbon costs in production and operation, we will gradually eliminate backward industries with high energy consumption and high carbon emissions, promote industrial restructuring, and improve the efficiency of energy and carbon emission permit utilization.
Data availability statement
The datasets presented in this study can be found in online repositories. The names of the repository/repositories and accession number(s) can be found in the article/Supplementary Material.
Author contributions
All authors contributed to the study conception and design. Material preparation, data collection and analysis were performed by YX, PX, and XP. The first draft of the manuscript was written by LW and all authors commented on previous versions of the manuscript. All authors read and approved the final manuscript.
Conflict of interest
The authors declare that the research was conducted in the absence of any commercial or financial relationships that could be construed as a potential conflict of interest.
Publisher’s note
All claims expressed in this article are solely those of the authors and do not necessarily represent those of their affiliated organizations, or those of the publisher, the editors and the reviewers. Any product that may be evaluated in this article, or claim that may be made by its manufacturer, is not guaranteed or endorsed by the publisher.
References
BP (2022). Statistical review of world energy 2022. IOP Publishing BP. Available at: https://www.bp.com/content/dam/bp/business-sites/en/global/corporate/pdfs/energy-economics/statistical-review/bp-stats-review-2022-full-report.pdf.
Chang, Kai, and Chang, Hao (2016). Cutting CO 2 intensity targets of interprovincial emissions trading in China. Appl. Energy 163, 211–221. doi:10.1016/j.apenergy.2015.10.146
Chang, L, Xuguang, H, Song, M, Wu, J., Feng, Y., Qiao, Y., et al. (2020). Carbon emission performance and quota allocation in the bohai rim economic Circle. J. Clean. Prod. 258, 120722. doi:10.1016/j.jclepro.2020.120722
Chu, W, Ni, J, and Du, L (2012). Regional allocation of carbon dioxide abatement in China. China Econ. Rev. 23 (3), 552–565. doi:10.1016/j.chieco.2011.06.002
Cui, X, Zhao, T, and Wang, J (2021). Allocation of carbon emission quotas in China's provincial power sector based on entropy method and ZSG-DEA. J. Clean. Prod. 284. doi:10.1016/j.jclepro.2020.124683
Fang, K, Zhang, Q, Yin, L, Yoshida, Y., Sun, L., Zhang, H., et al. (2019). How can China achieve its intended nationally determined contributions by 2030? A multi-criteria allocation of China’s carbon emission allowance. Appl. Energy 241, 380–389. doi:10.1016/j.apenergy.2019.03.055
Fenner, A E, Joseph Kibert, C, Woo, J, Morque, S., Razkenari, M., Hakim, H., et al. (2018). The carbon footprint of buildings: A review of methodologies and applications. Renew. Sustain. Energy Rev. 94, 1142–1152. doi:10.1016/j.rser.2018.07.012
Gomes, E. G., and Lins, M. P. E. (2008). Modelling undesirable outputs with zero sum gains data envelopment analysis models. J. Oper. Res. Soc. 59 (5), 616–623. doi:10.1057/palgrave.jors.2602384
Guo, J, Zhao, M, Wu, X, Shi, B, and Santibanez Gonzalez, E. D. (2021). Study on the distribution of PM emission rights in various provinces of China based on a new efficiency and equity two-objective DEA model. Ecol. Econ. 183, 106956. doi:10.1016/J.ECOLECON.2021.106956
Guo, R, Lv, S, and Cao, X (2020). Research on distribution efficiency of carbon emission reduction of six major industries in China based on ZSG-DEA model. Ecol. Econ. 36 (01), 13. https://kns.cnki.net/kcms/detail/detail.aspx?FileName=STJJ202001005andDbName=DKFX2020
Krings, T, Bruno, N, Gerilowski, K, Krautwurst, S., Buchwitz, M., Burrows, J. P., et al. (2018). Airborne remote sensing and in situ measurements of atmospheric CO2 to quantify point source emissions. Atmos. Meas. Tech. 11 (2), 721–739. doi:10.5194/amt-11-721-2018
Li, L, Li, Y, Ye, F, and Zhang, L. (2018). Carbon dioxide emissions quotas allocation in the Pearl River Delta region: Evidence from the maximum deviation method. J. Clean. Prod. 177, 207–217. doi:10.1016/j.jclepro.2017.12.205
Li, L, Ye, F, Li, Y, and Tan, K. H. (2018). A bi-objective programming model for carbon emission quota allocation: Evidence from the Pearl River Delta region. J. Clean. Prod. 205, 163–178. doi:10.1016/j.jclepro.2018.09.069
Meng, Z, Wang, H, and Wang, B (2018). Empirical analysis of carbon emission accounting and influencing factors of energy consumption in China. Int. J. Environ. Res. Public Health 11, 2467. doi:10.3390/ijerph15112467
National Bureau of Statistics of China (2021). China statistical Yearbook. Beijing: China Statistics Press. Available at: http://www.stats.gov.cn/tjsj/ndsj/.
Shahiduzzaman, M., and Alam, K (2013). Changes in energy efficiency in Australia: A decomposition of aggregate energy intensity using logarithmic mean divisia approach. Energy Policy 56, 341–351. doi:10.1016/j.enpol.2012.12.069
Shi, X, and Wu, J (2018). Politicization of global warming and energy restructuring in China. IOP Conf. Ser. Earth Environ. Sci. 1, 012005. doi:10.1088/1755-1315/151/1/012005
Wan, Q, and Yu, Y (2020). Power load pattern recognition algorithm based on characteristic index dimension reduction and improved entropy weight method. Energy Rep. 6 (S9), 797–806. doi:10.1016/J.EGYR.2020.11.129
Yan, F, Yi, F, and Chen, L (2019). Improved entropy weighting model in water quality evaluation. Water Resour. manage. 6, 2049–2056. doi:10.1007/s11269-019-02227-6
Yang, M, Hou, Y, Ji, Q, and Zhang, D (2020). Assessment and optimization of provincial CO 2 emission reduction scheme in China: An improved ZSG-DEA approach. Energy Econ. 91, 104931. doi:10.1016/j.eneco.2020.104931
Yin, L, Yoshida, Y, Liu, Q, Zhang, H., Wang, S., and Fang, K. (2020). Comparison of city-level carbon footprint evaluation by applying single- and multi-regional input-output tables. J. Environ. Manage. 260, 110108. doi:10.1016/j.jenvman.2020.110108
Yu, S, Yi-Ming, W, and Wang, K (2014). Provincial allocation of carbon emission reduction targets in China: An approach based on improved fuzzy cluster and Shapley value decomposition. Energy Policy 66, 630–644. doi:10.1016/j.enpol.2013.11.025
Zapf, M, Hermann, P, and Weindl, C (2019). How to comply with the Paris agreement temperature goal: Global carbon pricing according to carbon budgets. Energies 15, 2983. doi:10.3390/en12152983
Zhao, X (2020). Analysis of factors affecting carbon emissions in Tianjin. IOP Conf. Ser. Earth Environ. Sci. 450, 012014. doi:10.1088/1755-1315/450/1/012014
Zhong, R, Zhang, T, and Xie, X (2018). Analysis of the allocation of carbon allowance between six industries of shanghai based on ZSG-DEA model. Ecol. Econ. 34 (02), 37. https://kns.cnki.net/kcms/detail/detail.aspx?FileName=STJJ201802008andDbName=DKFX2018
Zhou, H, Weiying, P, Wang, Y, and Liu, K. (2021). China's initial allocation of interprovincial carbon emission rights considering historical carbon transfers: Program design and efficiency evaluation. Ecol. Indic. 121, 106918. doi:10.1016/j.ecolind.2020.106918
Keywords: carbon permit allocation, industry perspective, fairness principle, efficiency principle, Monte-Carlo simulation
Citation: Xiao Y, Wu L, Xie P and Pan X (2022) Allocation and optimization of carbon emission permits considering fairness and efficiency under the dual-carbon background. Front. Environ. Sci. 10:1036771. doi: 10.3389/fenvs.2022.1036771
Received: 05 September 2022; Accepted: 28 September 2022;
Published: 10 October 2022.
Edited by:
Hong-Dian Jiang, China University of Geosciences, ChinaReviewed by:
Juntao Du, Anhui University of Finance and Economics, ChinaZhang Jin Liang, North China Electric Power University, China
Copyright © 2022 Xiao, Wu, Xie and Pan. This is an open-access article distributed under the terms of the Creative Commons Attribution License (CC BY). The use, distribution or reproduction in other forums is permitted, provided the original author(s) and the copyright owner(s) are credited and that the original publication in this journal is cited, in accordance with accepted academic practice. No use, distribution or reproduction is permitted which does not comply with these terms.
*Correspondence: Pinjie Xie, yjzxpj@163.com