Inappropriateness of space-for-time and variability-for-time approaches to infer future dryland productivity changes
 Weiwei Zhan
 Xu Lian
 Jiangong Liu
 Pierre Gentine
- Department of Earth and Environmental Engineering, Columbia University, New York, NY, United States
Drylands are among the most susceptible ecosystems to global climate change. It has been suggested that a future surface drying trend would largely reduce gross primary productivity (GPP) in drylands, given that water is the dominant factor controlling the spatial distributions (i.e., space-for-time analogy) and inter-annual fluctuations (i.e., variability-for-time analogy) of dryland GPP. However, whether these approaches using spatial and inter-annual diagnostics are valid to infer long-term dryland GPP remains unknown. In this study, we evaluate whether space-for-time and variability-for-time approaches, which are based on the empirical scaling between GPP and dryness, are able to capture future changes in dryland GPP as simulated by 18 Earth system models (ESMs). Using observational data during 1958–2014, we identify a strong coupling between dryland GPP and the annual aridity index (AI, the ratio of precipitation to potential evapotranspiration) over both spatial and inter-annual scales. This GPP-AI scaling is used to predict future GPP changes throughout the 21st Century based on the future AI changes projected by ESMs. The space-for-time, and variability-for-time approaches predict an overall decrease of dryland GPP by -23.66 ± 10.93 (mean ±1 standard deviation) and -3.86 ± 2.22 gC m−2 yr−1, respectively, in response to future surface drying, however, the ESM projections exhibit a strong dryland GPP increase (+81.42 ± 36.82 gC m−2 yr−1). This inconsistency is because the space- and variability-based approaches, which rely on the spatial or short-term GPP-AI relationships, cannot capture the slowly-evolving but key determinant of dryland GPP changes over multi-decadal or longer timescales, which, in ESMs, is the ecosystem physiological response to rising CO2. Our study questions the validity of “the drier the less productive” hypothesis rooted in the space-for-time and variability-for-time theories, and the implementation of such theories to constrain future ecosystem changes.
Introduction
Global drylands are a pivotal part of the Earth system, occupying about 42% of the global land surface and being home to over 2.5 billion people (Safriel et al., 2005; Reynolds et al., 2007; Mirzabaev et al., 2019). Drylands provide a variety of essential ecosystem functions and services (i.e., crops, timbers and livestock products) to support the existence of local communities. Dryland ecosystems also play a critical role in the global carbon cycle, as they dominate the interannual variability of global terrestrial carbon sinks over the past decades (Poulter et al., 2014; Ahlström et al., 2015). Therefore, a better understanding of the responses of dryland ecosystem productivity to ongoing and future climate change is essential not only for human sustainability, but also for the global carbon budget.
Drylands are one of the most susceptible ecosystems to climate change and human activities (Huang et al., 2017; Lian et al., 2021). With ongoing climate change, particularly the potential for more prolonged, frequent and severe droughts, there is growing concern of a possible exacerbation of dryland water shortages (Reynolds et al., 2007; Huang et al., 2016; Park et al., 2018). Previous studies commonly used the aridity index (AI), defined as the ratio of precipitation (P) to potential evapotranspiration (PET), to assess surface dryness changes over global drylands (Fu and Feng, 2014; Sherwood and Fu, 2014; Huang et al., 2016; Park et al., 2018). They reported a robust decreasing trend of AI as the atmospheric demand for water increases at a faster pace than concurrent precipitation, and therefore a tendency of surface drying and expansion of dryland areas (Fu and Feng, 2014; Sherwood and Fu, 2014; Huang et al., 2016; Park et al., 2018). The rising surface aridity has been widely suggested to propagate to increased moisture deficits in the surface soil (Wang et al., 2018; Zhang et al., 2020), reducing ecosystem productivity and even causing land degradation and desertification (Huang et al., 2016; Mirzabaev et al., 2019)—a hypothesis known as “the drier the less productive”.
The speculation of land degradation is largely grounded upon the idea that water availability would be the primary control of vegetation productivity in dryland ecosystems (Hui and Jackson, 2006; Biederman et al., 2016; Gray et al., 2016; Huang et al., 2016). This is exemplified by the consistent dependence of dryland productivity, in terms of both geographical distributions and inter-annual fluctuations, on the aridity index (AI). Spatially, regions with smaller AI are associated with less available water, less vegetation cover, and reduced productivity (i.e., space-for-time analogy). For example, using a space-for-time approach, a recent study reported a sequential series of AI (the ratio of precipitation to PET) thresholds that control the responses of dryland ecosystems to the increasing aridity (Berdugo et al., 2020). In particular, an AI threshold of 0.46 was defined below which a dramatic loss of ecosystem productivity would occur (Berdugo et al., 2020). Temporally, the inter-annual variability of vegetation productivity depends on climate variability, with dry years (or drought occurrence) coinciding with low productivity (Zhao and Running, 2010; Poulter et al., 2014; Ahlström et al., 2015; Humphrey et al., 2018). This also generates a strong coupling between AI and productivity over inter-annual time scales, and leads to the expectation that an increase in surface aridity (or more droughts) would lower productivity (i.e., variability-for-time analogy).
State-of-the-art Earth system models (ESMs) generally project a persistence of the observed surface drying trend over global drylands towards the end of the 21st Century (Huang et al., 2016). Based on the space-for-time or variability-for-time analogies, continuing drying would further exacerbate plant water stress and reduce ecosystem productivity (Huang et al., 2016; Berdugo et al., 2020). Nevertheless, whether theses analogies established across space or inter-annual timescales can apply to long-term prediction of dryland productivity, remains an open question. For example, despite multiple lines of evidence showing atmospheric drying under global warming, both satellite observations and ESM simulations of dryland have demonstrated a greening trend and enhanced vegetation productivity (Andela et al., 2013; Donohue et al., 2013; Mankin et al., 2017; Yao et al., 2020; Gonsamo et al., 2021; Lian et al., 2021; Fawcett et al., 2022) which is primarily due to elevated atmospheric CO2. Specifically, rising CO2 can both directly stimulate photosynthesis (CO2 fertilization) as well as indirectly alleviate vegetation water stress by decreasing stomatal conductance and plant transpiration (Mankin et al., 2017; Stocker et al., 2018; Gonsamo et al., 2021). Precipitation increases and land management also play an important role in enhancing productivity at regional scales (Chen et al., 2019; Gherardi and Sala, 2019; Hou et al., 2021). Those greening trends do not support the fact that climatic drying would reduce productivity. Although regional browning trends are also detected, these are mostly limited to areas with intense human interventions (i.e., overgrazing, deforestation) (Lian et al., 2021). In this sense, it is necessary to re-evaluate whether “the drier the less productive” hypothesis, which is the key assumption of the space-for-time and variability-for-time approaches, can be successfully applied to predict the long-term trajectories of dryland productivity.
The purpose of this study is to evaluate whether the space-for-time or variability-for-time approaches can accurately predict future changes of dryland gross primary productivity (GPP), which is an important indicator of ecosystem health and also the ecosystem attribute used in previous studies supporting the theory of “the drier the less productive” (Huang et al., 2016; Berdugo et al., 2020). To this end, we first established empirical models between AI and GPP over drylands using observed information of spatial and interannual variations during 1958–2014. Next, using long-term climate predictions by 18 ESMs from the Coupled model intercomparison project phase 6 (CMIP6) under SSP2-RCP4.5 (a scenario of intermediate emission and continuing historical socio-economic activities) (Eyring et al., 2016), we predicted the AI-driven changes of GPP throughout the 21st Century. We made comparisons between the space- and variability-based estimates and the actual ESM-projected changes of dryland GPP. Last, we took advantage of factorial simulations from CMIP6 to understand the radiative and physiological mechanisms underlying the difference among the three estimates.
Materials and methods
Definition of global dryland extent
Following previous studies (Lian et al., 2021), we identified the areas of global drylands based on AI, which represents the balance between atmospheric water supply to the land (precipitation) and atmospheric water demand from the land (PET). Here, PET was calculated using the Penman-Monteith equation (Eq. 1) (Allen et al., 1998). Compared to other formulations (e.g., the Thornthwaite algorithm), this physically-based algorithm leverages more meteorological variables as inputs, and is now widely used due to its comprehensiveness and the increasing data availability.
where
According to the dryland definition from the United Nations Environment Programme (Middleton and Thomas, 1997), we identified global drylands as areas defined by a multi-year average AI ≤ 0.65, and we further divided drylands into four subcategories including dry sub-humid (0.5 ≤ AI < 0.65), semi-arid (0.2 ≤ AI < 0.5), arid (0.05 ≤ AI < 0.2) and hyper-arid (AI < 0.05) (Middleton and Thomas, 1997; Huang et al., 2016).
ESM simulations from CMIP6
To examine the past and future changes in dryland aridity and productivity, we used simulations of 18 CMIP6 ESMs under the “historical” (1958–2014) and “SSP2-RCP4.5” (2015–2100) scenarios. SSP2-RCP4.5 is a scenario of intermediate emission and continuing historical socio-economic activities, which ranges between the high-end scenario (SSP5-RCP8.5) and the stringent scenario (SSP1-RCP2.6). All selected ESMs provide outputs of GPP, as well as meteorological variables needed for the AI calculation (humidity, wind speed, temperature and net radiation). Detailed information regarding the used ESMs is summarized in Table 1. Note that the outputs of these ESMs have different spatial resolutions, and they were unified to 1 ° × 1 ° based on a first-order conservative resampling method.
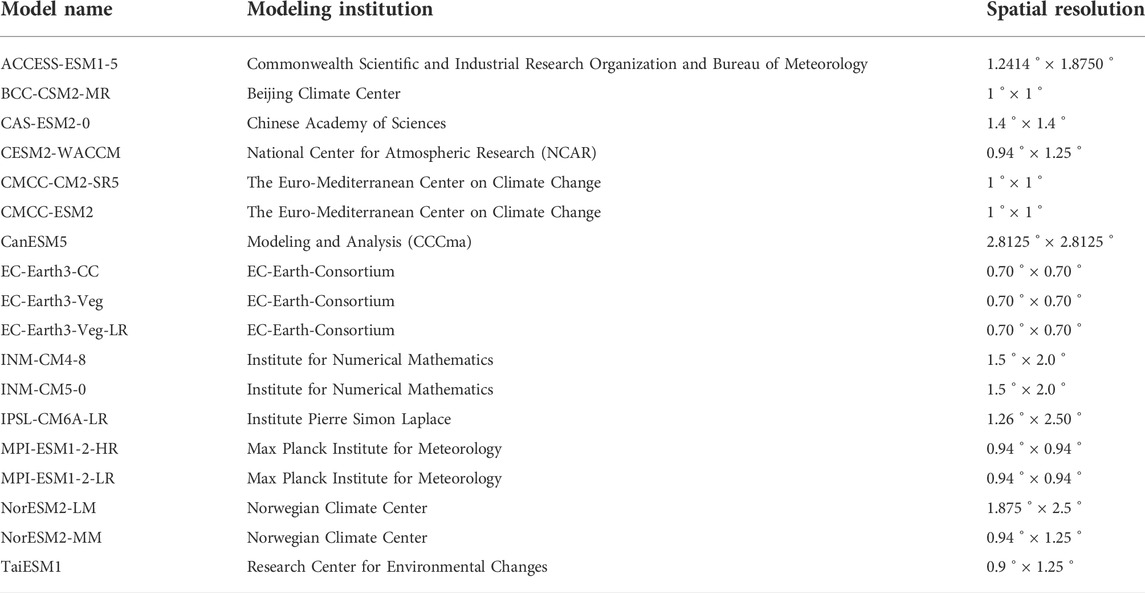
TABLE 1. The detailed information of 18 CMIP6 ESMs that are used for historical and future (SSP2-RCP4.5) analyses.
In addition, we also used factorial simulations from CMIP6 to isolate the physiological and radiative responses to rising atmospheric CO2, in order to understand the modelled dryland ecosystem responses to AI changes. The factorial simulations are idealized single-forcing experiments where the atmospheric CO2 rises at a rate of 1% per year continuously over a 140-year time period, from its pre-industrial level (∼285 ppm) to a quadrupling of pre-industrial conditions (∼1,140 ppm). Three configurations for factorial simulations were used here: biogeochemically coupled, radiatively coupled, and fully coupled (i.e., both biogeochemically and radiatively coupled) simulations. In the biogeochemically coupled simulation (i.e., 1pctCO2-bgc simulation), the biogeochemical processes in the land component (e.g., plant physiology) respond to rising CO2, while the radiative processes in the atmosphere component only see a fixed CO2 concentration of the pre-industrial level. In the radiatively coupled simulation (i.e., 1pctCO2-rad simulation), the atmosphere component directly responds to the rising CO2 concentration while the land component uses a constant CO2 concentration of the pre-industrial level. In the fully coupled simulation (i.e., 1pctCO2 simulation), both biogeochemical and radiative processes respond to CO2 rise. There are 7 CMIP6 ESMs that provide all three factorial simulations, and more detailed information can be found in Table 2.
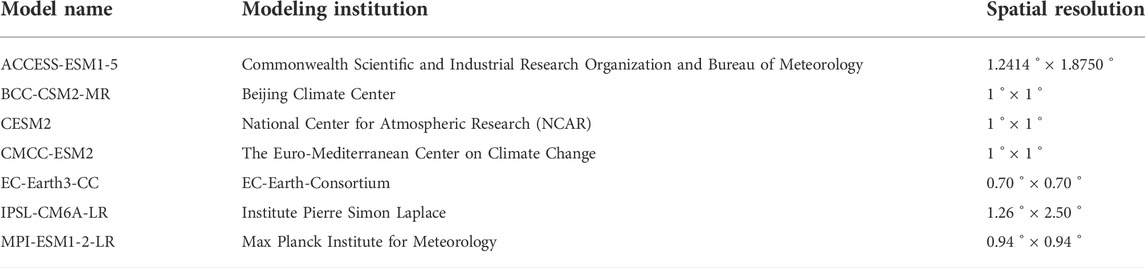
TABLE 2. The detailed information of 7 CMIP6 ESMs that are used for the factorial analysis.
Space-for-time and variability-for-time approaches
Here, we evaluate the performance of space-for-time and variability-for-time approaches in predicting future long-term trajectories of dryland GPP. Both space- and variability-based approaches are based on empirical GPP-AI relationships that are established using observational datasets over the historical baseline period (1958–2014). Here, we obtained AI from the TerraClimate dataset, and for GPP, we used two independent products to ensure the robustness of our conclusion. These are FLUXCOM that upscales flux measurements to the globe using machine learning algorithms (Jung et al., 2019), and one recent observation-based GPP product generated based on an improved light use efficiency model (Zheng et al., 2020). Note that for the GPP product of Zheng et al. (2020), we used the data during 1982–2014 to build the empirical GPP-AI relationships since the earliest year covered by this GPP product was 1982.
To implement the space-for-time approach, we first established an empirical relationship between GPP and AI for all pixels across global drylands over the historical baseline period. We found that dryland GPP variations along AI gradients generally follow a linear relationship (Figure 1), so a linear regression model was used here. We separately fitted one linear model for each continent to account for the effect of local characteristics (e.g., dominant vegetation species and weather patterns) on the empirical GPP-AI relationship. Then, using climate projections under SSP2-RCP4.5 from 18 CMIP6 ESMs, we calculated, for each ESM and year, the long-term changes of AI (
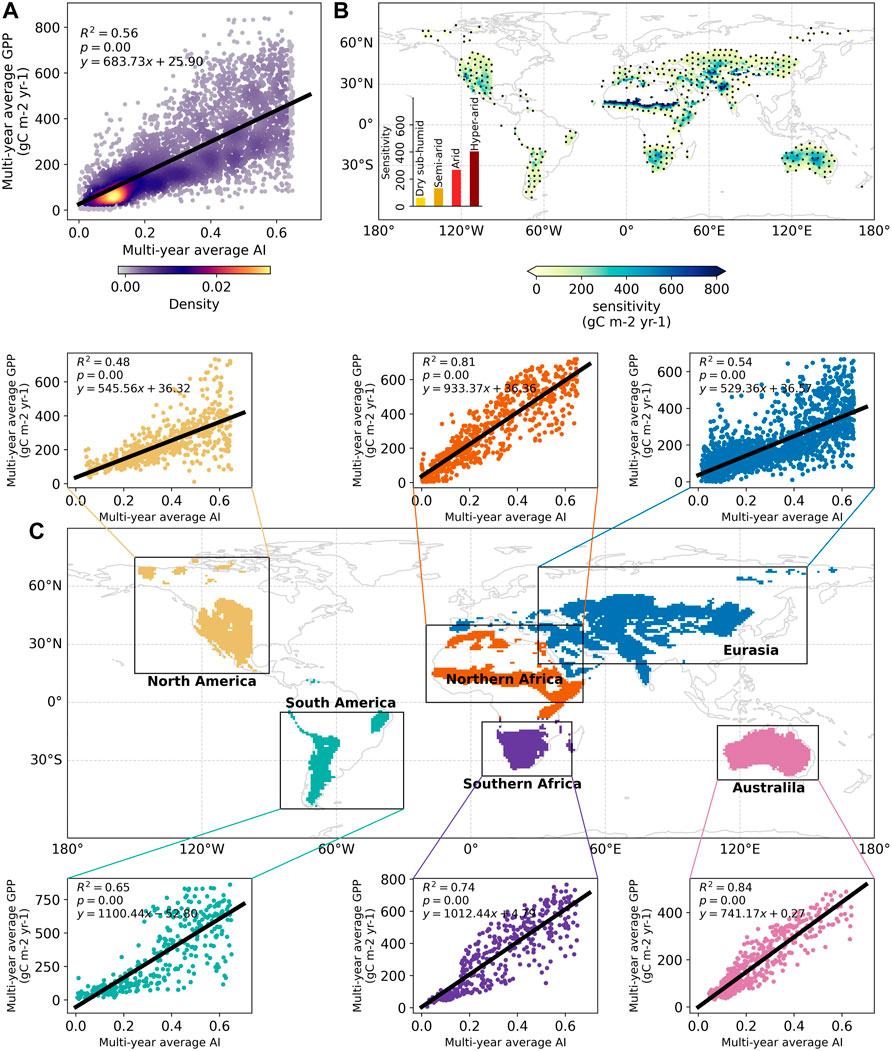
FIGURE 1. Observation-based relationship between GPP and AI across spatial (A,C) and temporal (B) scales during the baseline period (1958–2014). GPP is obtained from the FLUXCOM dataset and AI is calculated using the TerraClimate product. (A) The spatial relationship between multi-year average GPP and AI across all grid points over global drylands. (B) The slope of a linear regression model established between inter-annual variability of GPP and AI, as used by the variability-for-time approach. The slope of the fitted model represents the sensitivity of GPP to AI. The black dots indicate regions with a statistically significant relationship (p < 0.05). The inset bar plot shows the aggregated sensitivity values for the four dryland subcategories. (C) The spatial relationship between multi-year average GPP and AI across six continents of global drylands. The black solid lines denote the continent-specific linear regression models used by the space-for-time approach.
As for the variability-for-time approach, we built a pixel-wise linear model across global drylands. Specifically, for each pixel, we established a linear regression model using the original time series of observational GPP and AI during the historical period. We then computed the future inter-annual changes of AI (
Note that all the above analyses used GPP during the peak growing season, which was defined as the three consecutive months with the highest multi-year average productivity. For AI calculation, we used the whole year precipitation and PET data, considering that aridity conditions during the non-growing season could also affect the growing season GPP due to the memory effect of soil moisture. In addition, before applying space-for-time and variability-for-time approaches to future ESM projections, we validated ESM simulations against observations by comparing the historical GPP changes inferred from these two independent data sources. We found that for both space- and variability-based approaches, ESM simulations and observations show qualitatively similar results in the inferred historical GPP changes for all dryland subcategories (Supplementary Figure S3). This suggests a generally good agreement between ESM simulations and observations during the historical period (1958–2014), and supports our extrapolation of the GPP-AI relationship to the future period.
Results
Observation-based GPP-AI relationship over spatial and temporal scales
During the historical baseline period (1958–2014), observation-based data show a strong coupling between GPP and AI at the spatial scale over global drylands (Figures 1A,C). The multi-year average GPP from all dryland pixels shows a significant linear correlation with AI (R2 = 0.56, p < 0.05), with a slope of 683.73 gC m−2 yr−1 that measures the sensitivity of GPP to AI across space. Significant GPP-AI correlations also exist over each continent of global drylands, with R2 higher than 0.7 in northern Africa, southern Africa and Australia. The slope values across different continents range from 529.36 gC m−2 yr−1 to 1,100.44 gC m−2 yr−1. These strong positive correlations demonstrate that the background aridity level strongly controls the spatial distribution of dryland GPP, i.e., to be less productive in drier areas, which is in agreement with previous studies (Biederman et al., 2016; Gray et al., 2016; Huang et al., 2016) and also implies the potential feasibility of a space-for-time approach in predicting GPP changes.
For the variability-for-time approach, we similarly found a strong GPP-AI coupling based on observational datasets during the past decades (1958–2014) (Figure 1B). Statistically significant positive correlations (p < 0.05) between the inter-annual time series of GPP and AI can be detected for almost all dryland regions. The correlation is especially strong over central Eurasia, central and western USA and southern Africa, all having a correlation coefficient greater than 0.7 (Supplementary Figure S1). Correspondingly, the GPP-AI sensitivity generally increases with the climatological aridity level, with the highest value occurring in the hyper-arid region (>400 gC m−2 yr−1) while the lowest one is found in the dry subhumid regions (<100 gC m−2 yr−1). The lower GPP-AI sensitivity inferred from the temporal-scale analysis than that from the spatial-scale analysis (683.73 gC m−2 yr−1) indicates that different processes underly the temporal and spatial variations. Overall, this temporal coupling between GPP and AI reflects that the year-to-year fluctuations of dryland productivity are also largely determined by the aridity changes, and drier years typically coincide with reduced productivity. This finding also agrees with the concept that a drying climate likely tends to lower the dryland ecosystem productivity.
Comparisons of future GPP variations estimated by different approaches
By combining the GPP-AI relationship established over the baseline period (1958–2014) and the future AI variations predicted by ESMs, we predicted the future GPP changes in response to AI changes using both space-for-time and variability-for-time approaches. The associated estimated projections were compared against the actual projections from the CMIP6 ESMs, which are all represented as the GPP estimation during 2081–2100 relative to that of the baseline period (1958–2014) (Figure 2).
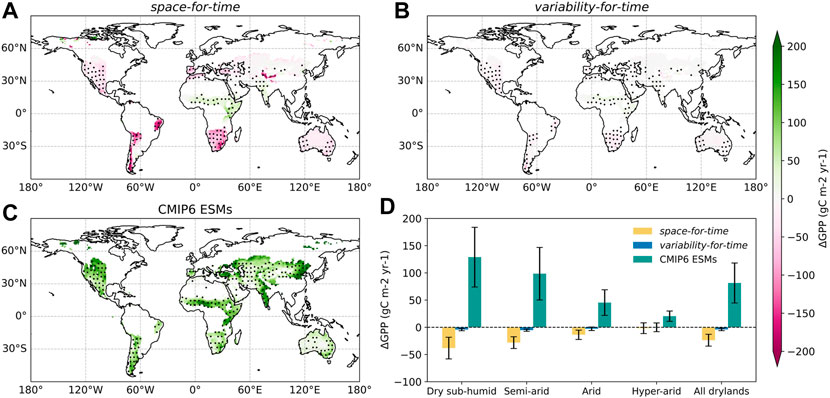
FIGURE 2. The spatial distribution of future GPP changes based on the space-for-time approach, the variability-for-time approach, and actual projections from CMIP6 ESMs. The GPP changes are calculated by subtracting the historical GPP during 1958–2014 from the projected GPP over the last 2 decades of the 21st Century. (A) GPP changes predicted by the space-for-time approach. (B) GPP changes predicted by the variability-for-time approach. (C) GPP changes predicted by the original CMIP6 ESMs. In subplots (A–C), the colorbar represents the ensemble average of estimates by 18 CMIP6 ESMs, and the black dots denote regions where more than 80% ESMs show the same sign as the multi-model ensemble mean. (D) GPP changes aggregated over different dryland subcategories. The error bars represent the ±1 standard deviation among ESMs.
Overall, the GPP changes predicted by the three approaches show remarkable differences in terms of magnitude, spatial distribution and even in sign (Figure 2, Supplementary Figure S2). As for the space-for-time approach, global drylands overall exhibit a total estimated decrease in GPP of -23.66 ± 10.93 gC m−2 yr−1 among the 18 CMIP6 ESMs (Figure 2D). Most global drylands experience noticeable decreases in GPP towards the end of the 21st Century, especially for South Africa and North America where more than 80% of all models agree on the decreasing sign (Figure 2A). A small portion of dryland areas shows a GPP increase, e.g., the Sahel region, eastern Africa and India, implying a future wetting trend and enhanced productivity over these regions. After aggregating into different dryland subcategories, there is a clear shift from the largest GPP decrease in dry subhumid region to a slight GPP increase in the hyper-arid region (Figure 2D). The variability-for-time approach also projects an overall GPP decrease (-3.86 ± 2.22 gC m−2 yr−1) in global drylands towards the end of 21st Century, yet with much smaller magnitude compared to the space-based estimates (Figure 2D). With regard to the spatial pattern, the variability-for-time approach shows a qualitatively similar but notably smaller GPP changes than the space-for-time approach (Figure 2B). Nevertheless, and importantly, compared to both the space- and variability-based estimates, the original simulations obtained from CMIP6 ESMs show opposite signs of GPP changes. The GPP increase by original ESM projections (81.42 ± 36.82 gC m−2 yr−1) is even an order greater than the GPP decrease from the other two approaches (Figure 2D). In ESMs, a consistent increasing trend of GPP is projected across all dryland regions, with especially large increases found in northeastern China and India (Figure 2C). Among the four dryland subcategories, the dry subhumid region shows the highest increase in GPP (128.96 ± 54.93 gC m−2 yr−1), which contributes the most to the total GPP increase over global drylands. Also, we found that this GPP increase dwindles with increasing levels of aridity (Figure 2D).
The direct comparisons among the two estimates and the actual projections further corroborate the incapacity of both space- and variability-based approaches for inferring ESM-projected GPP changes (Figure 3). Compared to the original CMIP6 ESM simulations, both space- and variability-for-time approaches predict noticeably lower GPP across almost all dryland areas, with the strongest underestimation found in central Eurasia, northeastern China, and western USA (Figures 3A,B). Overall, the total underestimation over global drylands can reach to -105.07 ± 35.65 gC m−2 yr−1 for space-based estimates and -85.28 ± 36.27 gC m−2 yr−1 for variability-based estimates, with the largest contribution from the dry subhumid region (Figure 3D). The space- and variability-for-time approaches also exhibit striking differences between each other, despite a much smaller magnitude than their difference with original CMIP6 projections (Figure 3D). Specifically, the space-for-time approach predicts relatively lower GPP over most global drylands, although it generates slightly higher estimates in the Sahel, eastern Africa and India (Figure 3C).
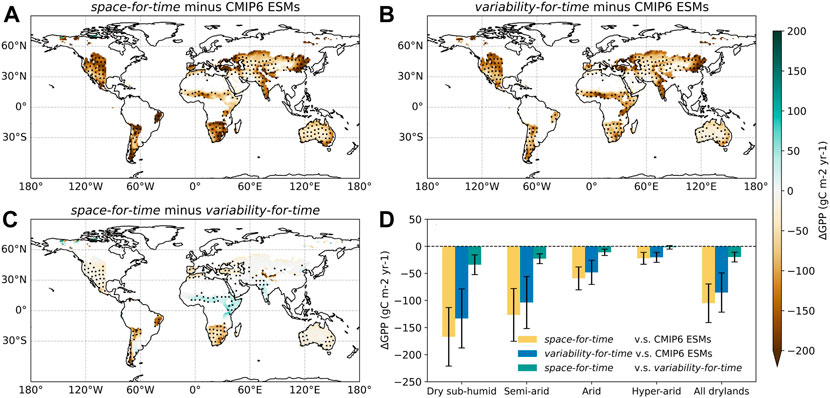
FIGURE 3. The differences in projected future GPP changes (during 2081–2100) among the three approaches. (A) The difference between the space-for-time approach and original CMIP6 ESM projections. (B) The difference between the variability-for-time approach and original CMIP6 ESM projections. (C) The difference between the space-for-time approach and variability-for-time approach. The black dots in (A–C) denote regions where more than 80% ESMs show the same sign as the multi-model ensemble mean. (D) the differences in GPP estimates aggregated over different dryland subcategories, with error bars denoting the ±1 standard deviation among ESMs.
By examining the long-term trajectories of future GPP changes estimated by the two approaches and the actual projections of CMIP6 ESMs, we again found apparent divergence among them. Both space- and variability-for-time approaches cannot capture the long-term increasing trend of GPP projected by the CMIP6 ESMs. According to the original simulations of CMIP6 ESMs, the dryland mean GPP first maintains an increasing trend and then flattens out around the year 2080 (Figure 4A). By contrast, the space-for-time approach shows a slight decreasing, rather than increasing, trend over the course of the 21st Century, with relatively strong inter-annual fluctuations. For the variability-for-time approach, its long-term GPP dynamics is even more stable with almost no discernable trends (Figure 4A). Such divergence among different approaches, that is, substantial increasing trend in original CMIP6 simulations while almost no increase for both space- and variability-based predictions, is consistently detected in the dry subhumid, semiarid, and arid regions (Figures 4B–D). Note that for the hyper-arid regions, the increasing trend simulated by the ESMs is relatively weak, and all three approaches show strong inter-annual fluctuations but almost no detectable long-term trends (Figure 4E).
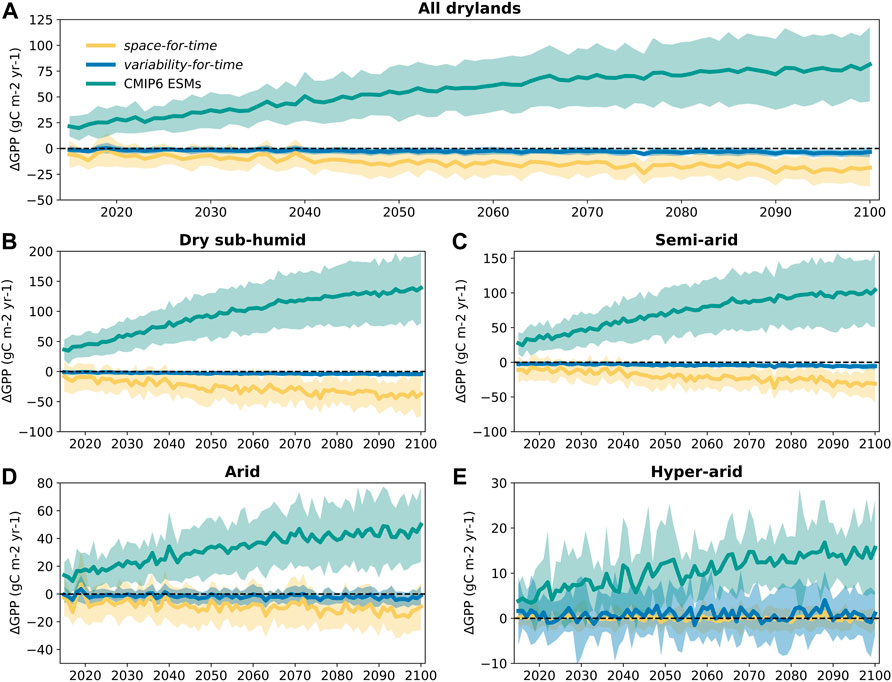
FIGURE 4. The future trajectory of GPP changes estimated by different approaches. The GPP changes (
Mechanisms underlying the divergent GPP projections among approaches
To understand the deficiencies of the space-for-time and variability-for-time GPP estimates, we leveraged the factorial simulations of seven CMIP6 ESMs to elucidate the contribution of radiative and physiological processes to future GPP changes. In the fully coupled simulation, AI decreases and GPP increases are consistently found across all ESMs, and models with relatively stronger drying trend (more negative
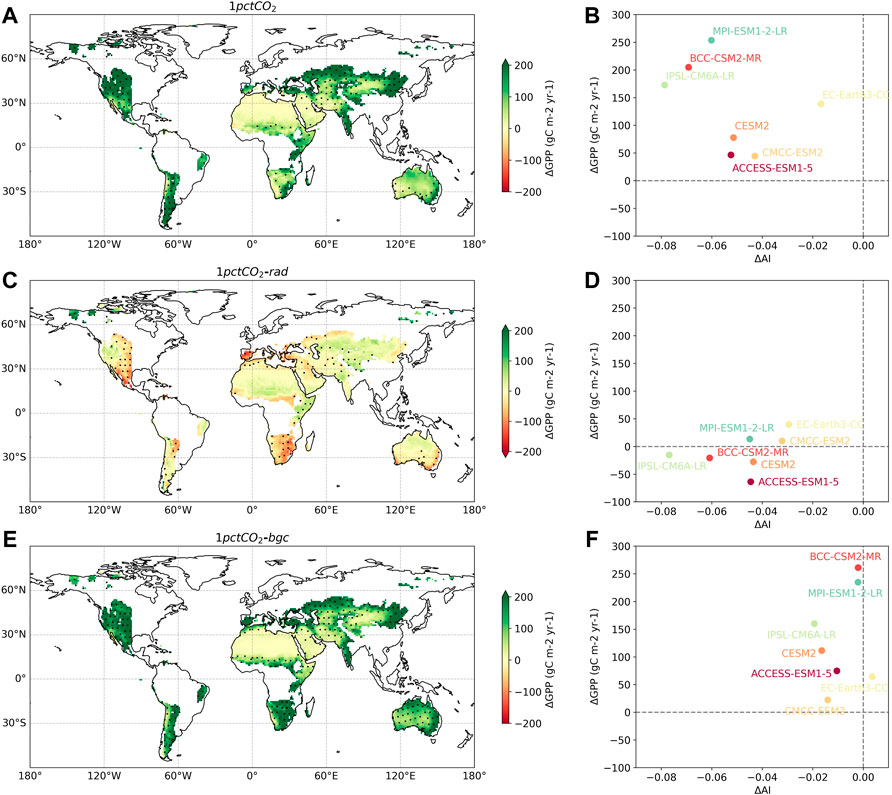
FIGURE 5. GPP and AI changes produced by the fully (A,B), biogeochemically (C,D), and radiatively (E,F) coupled simulations of CMIP6 ESMs. (A,C,E) The spatial distribution of GPP changes from the three simulations, calculated as the difference between the average GPP in the last 20 years of the 140-year simulation period and that in the first 20 years. The black dots in (A,C,E) denote regions where more than 80% of ESMs have the same sign as the multi-model mean. (B,D,F) Scatterplot of GPP changes against AI changes aggregated over all global drylands, across the seven ESMs. Both
Discussion
In this study, we illustrate that the space- or variability-for-time approaches, or other emergent constraints based on historical variability, might be questionable when used to predict the long-term GPP changes across global drylands. Over the past few decades (1958–2014), a tight coupling between dryland GPP and AI is detected with regard to spatial gradients and inter-annual variations (Figure 1). Nevertheless, the GPP-AI relationship built over spatial and short-term scales cannot be successfully applied to predict future GPP trajectories over multi-decadal or longer timescales. We show that an empirical scaling from AI to GPP fails to reproduce the future greening trends as simulated by CMIP6 ESMs (Figures 2, 4). In the CMIP6 original simulations, despite a persistent drying trend throughout the 21st Century, there is still an extensive and continuous increasing trend of GPP in dryland ecosystems (Figures 2, 4), which can be interpreted as a “drier yet more productive” phenomenon due to the CO2 physiological effect. This modelling phenomenon is also in agreement with some previous observation-based studies that reported greening drylands despite the atmospheric drying trend due to global warming (Fensholt et al., 2012; Andela et al., 2013; Donohue et al., 2013; Ahlström et al., 2015). This finding is contradictory to “the drier the less productive” hypothesis inherently adopted by the space- and variability-for-time approaches.
Physiological responses of dryland vegetation to the rising CO2 can help explain the above “drier yet more productive” phenomenon, as exemplified by CMIP6 factorial simulations. In the radiatively coupled experiment where all biogeochemical processes do not respond to rising CO2, the increasing trend of GPP is dramatically weakened or even disappears (Figure 5), indicating the critical role of plant physiological changes in determining future greening trends. Specifically, enhanced atmospheric CO2 will decrease leaf stomatal conductance, which could reduce the plant water loss via transpiration by increasing water use efficiency (the ratio of photosynthesis to transpiration) (Ceulemans and Mousseau, 1994; Ainsworth and Rogers, 2007). Although this leaf-level stomatal effect is partly counteracted by the plant structural effect due to rising CO2, as the CO2-enhanced vegetation coverage causes extra water loss through transpiration and canopy interception (Zeng et al., 2018; Piao et al., 2020), ESM projections generally agree on a net decrease of the total canopy transpiration after considering both stomatal and morphological effects (Betts et al., 2007; Lemordant et al., 2018; Yang et al., 2019). The CO2-driven increase of plant water use efficiency can effectively offset the higher atmospheric water demand driven by the increasing temperature, alleviate water stress of dryland biomes and thus stimulate vegetation productivity (Stocker et al., 2018; Liu et al., 2020). This CO2-induced water saving, combined with the direct fertilization effect of higher CO2, can optimize the carbon sequestration of dryland vegetation and explain the co-occurrence of ecosystem greening and atmospheric drying as simulated in CMIP6 ESMs (Ukkola et al., 2016; Mankin et al., 2017).
The neglect of the above CO2 physiological effects is the main reason for the biases of space- and variability-for-time approaches. The rationale of these two approaches, i.e., “the drier the less productive” hypothesis, can be successfully applied to both spatial and short-term temporal scales for the GPP prediction. This is because across these scales, aridity level is the dominant factor governing dryland GPP variations, while the changes of atmospheric CO2 are limited and thus have relatively weak impacts on GPP. However, for multi-decadal or longer timescales, the continuous rising CO2 can impose remarkable physiological effects on plant water use efficiency and thus drives GPP increases even under the drying trend, leading to the invalidity of “the drier the less productive” hypothesis. Under this circumstance, both space- and variability-for-time approaches, which do not account for the CO2 physiological effect, are not able to capture the long-term increasing trend of GPP and cannot well predict the responses of dryland productivity to future climate changes.
Although ESMs provide a useful tool to test the validity of space- and variability-for-time approaches, we should be aware that considerable uncertainties exist in ESM projections, as it is still challenging to realistically simulate all ecosystem processes, especially those regarding extremes, disturbances (e.g., wildfires), and nutrient regulation of CO2 fertilization effects (Whitley et al., 2017; Macbean et al., 2021; Teckentrup et al., 2021). Under future warming trend, climate extremes, particularly droughts, are expected to become more frequent and extensive (Prudhomme et al., 2014; Ault, 2020), which can impose damaging impacts on the fragile dryland ecosystems and further increase the likelihood of disturbance events such as fires (Reichstein et al., 2013; Bowman et al., 2020). However, it still remains unknown how dryland productivity would be impacted by future extreme events, how dryland ecosystems would be disturbed or recover from future wildfires, as well as to what extent the positive physiological effect of CO2 could be counteracted by those negative effects (Whitley et al., 2016; Obermeier et al., 2017; Macbean et al., 2021; Teckentrup et al., 2021). Therefore, future investigations are urgently needed to better understand the potential nonlinear behaviors and tipping points in the dryland responses to global warming, which can further optimize the ESM parameterization and help us better predict future changes of drylands in a changing climate.
Conclusion
This study suggests that it is inappropriate to apply space-for-time and variability-for-time approaches to predict future long-term changes of dryland GPP. Based on historical observations, we find a strong linear coupling between GPP and AI across both spatial and inter-annual time scales. However, when applying such GPP-AI scaling to predict future long-term GPP trajectories, both space- and variability-for-time approaches show large deviations from the original ESM simulations, and they fail to predict the future increasing GPP trend produced by ESMs. Such deviations can be mainly attributed to the fact that the dominant driver of dryland GPP is actually different across scales. For spatial and short-term temporal scales, the aridity level is the primary driver of dryland GPP, while for long-term temporal scales, the continuously rising CO2 has important effects on plant physiology, which drives the increases in GPP despite the atmospheric drying trend. The different driving processes across scales results in the failure of space- and variability-for-time approaches that solely rely on the GPP-AI scaling to infer future changes of dryland productivity.
Data availability statement
The FLUXCOM product used in this study can be found in https://www.fluxcom.org/CF-Download/. The TerraClimate product is available at https://www.climatologylab.org/terraclimate.html. The CMIP6 ESM simulations can be downloaded from https://esgf-node.llnl.gov/projects/cmip6/.
Author contributions
XL conceived the idea of the study. WZ performed the data analysis and drafted the figures. All authors discussed the results and participated in the writing and editing of the manuscript.
Funding
This study is supported by the Land Ecosystem Models based On New Theory, obseRvations and ExperimEnts project (LEMONTREE, grant P-1-00381).
Acknowledgments
The authors acknowledge the funding from the VESRI LEMONTREE project.
Conflict of interest
The authors declare that the research was conducted in the absence of any commercial or financial relationships that could be construed as a potential conflict of interest.
Publisher’s note
All claims expressed in this article are solely those of the authors and do not necessarily represent those of their affiliated organizations, or those of the publisher, the editors and the reviewers. Any product that may be evaluated in this article, or claim that may be made by its manufacturer, is not guaranteed or endorsed by the publisher.
Supplementary material
The Supplementary Material for this article can be found online at: https://www.frontiersin.org/articles/10.3389/fenvs.2022.1010269/full#supplementary-material
References
Abatzoglou, J. T., Dobrowski, S. Z., Parks, S. A., and Hegewisch, K. C. (2018). TerraClimate, a high-resolution global dataset of monthly climate and climatic water balance from 1958–2015. Sci. Data 5, 170191. doi:10.1038/sdata.2017.191
Ahlstrom, A., Raupach, M. R., Schurgers, G., Smith, B., Arneth, A., Jung, M., et al. (2015). The dominant role of semi-arid ecosystems in the trend and variability of the land CO2 sink. Science 348, 895–899. doi:10.1126/science.aaa1668
Ainsworth, E. A., and Rogers, A. (2007). The response of photosynthesis and stomatal conductance to rising [CO2]: Mechanisms and environmental interactions. Plant, Cell & Environ. 30, 258–270. doi:10.1111/j.1365-3040.2007.01641.x
Allen, R. G., Pereira, L. S., Raes, D., and Smith, M. (1998). Crop evapotranspiration-Guidelines for computing crop water requirements-FAO Irrigation and drainage paper 56. Rome: Fao. 300, D05109.
Andela, N., Liu, Y., Van Dijk, A., De Jeu, R., and Mcvicar, T. (2013). Global changes in dryland vegetation dynamics (1988–2008) assessed by satellite remote sensing: Comparing a new passive microwave vegetation density record with reflective greenness data. Biogeosciences 10, 6657–6676. doi:10.5194/bg-10-6657-2013
Ault, T. R. (2020). On the essentials of drought in a changing climate. Science 368, 256–260. doi:10.1126/science.aaz5492
Berdugo, M., Delgado-Baquerizo, M., Soliveres, S., Hernández-Clemente, R., Zhao, Y., Gaitán, J. J., et al. (2020). Global ecosystem thresholds driven by aridity. Science 367, 787–790. doi:10.1126/science.aay5958
Betts, R. A., Boucher, O., Collins, M., Cox, P. M., Falloon, P. D., Gedney, N., et al. (2007). Projected increase in continental runoff due to plant responses to increasing carbon dioxide. Nature 448, 1037–1041. doi:10.1038/nature06045
Biederman, J. A., Scott, R. L., Goulden, M. L., Vargas, R., Litvak, M. E., Kolb, T. E., et al. (2016). Terrestrial carbon balance in a drier world: The effects of water availability in southwestern North America. Glob. Chang. Biol. 22, 1867–1879. doi:10.1111/gcb.13222
Bowman, D. M., Kolden, C. A., Abatzoglou, J. T., Johnston, F. H., Van Der Werf, G. R., and Flannigan, M. (2020). Vegetation fires in the anthropocene. Nat. Rev. Earth Environ. 1, 500–515. doi:10.1038/s43017-020-0085-3
Ceulemans, R., and Mousseau, M. (1994). Tansley review no. 71 effects of elevated atmospheric co2on woody plants. New phytol. 127, 425–446. doi:10.1111/j.1469-8137.1994.tb03961.x
Chen, C., Park, T., Wang, X., Piao, S., Xu, B., Chaturvedi, R. K., et al. (2019). China and India lead in greening of the world through land-use management. Nat. Sustain. 2, 122–129. doi:10.1038/s41893-019-0220-7
Donohue, R. J., Roderick, M. L., Mcvicar, T. R., and Farquhar, G. D. (2013). Impact of CO2 fertilization on maximum foliage cover across the globe's warm, arid environments. Geophys. Res. Lett. 40, 3031–3035. doi:10.1002/grl.50563
Eyring, V., Bony, S., Meehl, G. A., Senior, C. A., Stevens, B., Stouffer, R. J., et al. (2016). Overview of the coupled model intercomparison project phase 6 (CMIP6) experimental design and organization. Geosci. Model Dev. 9, 1937–1958. doi:10.5194/gmd-9-1937-2016
Fawcett, D., Cunliffe, A. M., Sitch, S., O’Sullivan, M., Anderson, K., Brazier, R. E., et al. (2022). Assessing model predictions of carbon dynamics in global drylands. Front. Environ. Sci. 465, 790200. doi:10.3389/fenvs.2022.790200
Fensholt, R., Langanke, T., Rasmussen, K., Reenberg, A., Prince, S. D., Tucker, C., et al. (2012). Greenness in semi-arid areas across the globe 1981–2007—An Earth observing satellite based analysis of trends and drivers. Remote Sens. Environ. 121, 144–158. doi:10.1016/j.rse.2012.01.017
Fu, Q., and Feng, S. (2014). Responses of terrestrial aridity to global warming. J. Geophys. Res. Atmos. 119, 7863–7875. doi:10.1002/2014jd021608
Gherardi, L. A., and Sala, O. E. (2019). Effect of interannual precipitation variability on dryland productivity: A global synthesis. Glob. Chang. Biol. 25, 269–276. doi:10.1111/gcb.14480
Gonsamo, A., Ciais, P., Miralles, D. G., Sitch, S., Dorigo, W., Lombardozzi, D., et al. (2021). Greening drylands despite warming consistent with carbon dioxide fertilization effect. Glob. Chang. Biol. 27, 3336–3349. doi:10.1111/gcb.15658
Gray, S. B., Dermody, O., Klein, S. P., Locke, A. M., Mcgrath, J. M., Paul, R. E., et al. (2016). Intensifying drought eliminates the expected benefits of elevated carbon dioxide for soybean. Nat. Plants 2, 16132. doi:10.1038/nplants.2016.132
Hou, E., Litvak, M. E., Rudgers, J. A., Jiang, L., Collins, S. L., Pockman, W. T., et al. (2021). Divergent responses of primary production to increasing precipitation variability in global drylands. Glob. Chang. Biol. 27, 5225–5237. doi:10.1111/gcb.15801
Huang, J., Yu, H., Guan, X., Wang, G., and Guo, R. (2016). Accelerated dryland expansion under climate change. Nat. Clim. Chang. 6, 166–171. doi:10.1038/nclimate2837
Huang, J., Li, Y., Fu, C., Chen, F., Fu, Q., Dai, A., et al. (2017). Dryland climate change: Recent progress and challenges. Rev. Geophys. 55, 719–778. doi:10.1002/2016rg000550
Hui, D., and Jackson, R. B. (2006). Geographical and interannual variability in biomass partitioning in grassland ecosystems: A synthesis of field data. New phytol. 169, 85–93. doi:10.1111/j.1469-8137.2005.01569.x
Humphrey, V., Zscheischler, J., Ciais, P., Gudmundsson, L., Sitch, S., and Seneviratne, S. I. (2018). Sensitivity of atmospheric CO2 growth rate to observed changes in terrestrial water storage. Nature 560, 628–631. doi:10.1038/s41586-018-0424-4
Jung, M., Koirala, S., Weber, U., Ichii, K., Gans, F., Camps-Valls, G., et al. (2019). The FLUXCOM ensemble of global land-atmosphere energy fluxes. Sci. Data 6, 74–14. doi:10.1038/s41597-019-0076-8
Lemordant, L., Gentine, P., Swann, A. S., Cook, B. I., and Scheff, J. (2018). Critical impact of vegetation physiology on the continental hydrologic cycle in response to increasing CO2. Proc. Natl. Acad. Sci. U. S. A. 115, 4093–4098. doi:10.1073/pnas.1720712115
Lian, X., Piao, S., Chen, A., Huntingford, C., Fu, B., Li, L. Z., et al. (2021). Multifaceted characteristics of dryland aridity changes in a warming world. Nat. Rev. Earth Environ. 2, 232–250. doi:10.1038/s43017-021-00144-0
Liu, L., Gudmundsson, L., Hauser, M., Qin, D., Li, S., and Seneviratne, S. I. (2020). Soil moisture dominates dryness stress on ecosystem production globally. Nat. Commun. 11, 4892–4899. doi:10.1038/s41467-020-18631-1
Macbean, N., Scott, R. L., Biederman, J. A., Peylin, P., Kolb, T., Litvak, M. E., et al. (2021). Dynamic global vegetation models underestimate net CO2 flux mean and inter-annual variability in dryland ecosystems. Environ. Res. Lett. 16, 094023. doi:10.1088/1748-9326/ac1a38
Mankin, J. S., Smerdon, J. E., Cook, B. I., Williams, A. P., and Seager, R. (2017). The curious case of projected twenty-first-century drying but greening in the American West. J. Clim. 30, 8689–8710. doi:10.1175/jcli-d-17-0213.1
Middleton, N., and Thomas, D. (1997). World atlas of desertification. Hodder Headline, PLC: Arnold, 2.
Mirzabaev, A., Wu, J., Evans, J., Garcia-Oliva, F., Hussein, I., Iqbal, M., et al. (2019). “Desertification,” in Climate change and land: An IPCC special report on climate change, desertification, land degradation, sustainable land management, food security, and greenhouse gas fluxes in terrestrial ecosystems (IPCC SRCCL) (Cambridge: Cambridge University Press).
Obermeier, W. A., Lehnert, L. W., Kammann, C., Müller, C., Grünhage, L., Luterbacher, J., et al. (2017). Reduced CO2 fertilization effect in temperate C3 grasslands under more extreme weather conditions. Nat. Clim. Chang. 7, 137–141. doi:10.1038/nclimate3191
Park, C.-E., Jeong, S.-J., Joshi, M., Osborn, T. J., Ho, C.-H., Piao, S., et al. (2018). Keeping global warming within 1.5 °C constrains emergence of aridification. Nat. Clim. Chang. 8, 70–74. doi:10.1038/s41558-017-0034-4
Piao, S., Wang, X., Park, T., Chen, C., Lian, X., He, Y., et al. (2020). Characteristics, drivers and feedbacks of global greening. Nat. Rev. Earth Environ. 1, 14–27. doi:10.1038/s43017-019-0001-x
Poulter, B., Frank, D., Ciais, P., Myneni, R. B., Andela, N., Bi, J., et al. (2014). Contribution of semi-arid ecosystems to interannual variability of the global carbon cycle. Nature 509, 600–603. doi:10.1038/nature13376
Prudhomme, C., Giuntoli, I., Robinson, E. L., Clark, D. B., Arnell, N. W., Dankers, R., et al. (2014). Hydrological droughts in the 21st century, hotspots and uncertainties from a global multimodel ensemble experiment. Proc. Natl. Acad. Sci. U. S. A. 111, 3262–3267. doi:10.1073/pnas.1222473110
Reichstein, M., Bahn, M., Ciais, P., Frank, D., Mahecha, M. D., Seneviratne, S. I., et al. (2013). Climate extremes and the carbon cycle. Nature 500, 287–295. doi:10.1038/nature12350
Reynolds, J. F., Smith, D. M., Lambin, E. F., Turner, B. L., 2Nd, Mortimore, M., Batterbury, S. P., et al. (2007). Global desertification: Building a science for dryland development. Science 316, 847–851. doi:10.1126/science.1131634
Safriel, U., Adeel, Z., Niemeijer, D., Puigdefabregas, J., White, R., White, R., et al. (2005). Chapter 22: Dryland systems. Ecosystems and human well-being: Desertification synthesis. A report of the millennium ecosystem assessment. Washington DC: World Resources Institute.
Stocker, B. D., Zscheischler, J., Keenan, T. F., Prentice, I. C., Peñuelas, J., and Seneviratne, S. I. (2018). Quantifying soil moisture impacts on light use efficiency across biomes. New Phytol. 218, 1430–1449. doi:10.1111/nph.15123
Teckentrup, L., De Kauwe, M. G., Pitman, A. J., Goll, D. S., Haverd, V., Jain, A. K., et al. (2021). Assessing the representation of the Australian carbon cycle in global vegetation models. Biogeosciences 18, 5639–5668. doi:10.5194/bg-18-5639-2021
Ukkola, A., Keenan, T., Kelley, D. I., and Prentice, D. I. (2016). Vegetation plays an important role in mediating future water resources. Environ. Res. Lett. 11, 094022. doi:10.1088/1748-9326/11/9/094022
Wang, J., Song, C., Reager, J. T., Yao, F., Famiglietti, J. S., Sheng, Y., et al. (2018). Recent global decline in endorheic basin water storages. Nat. Geosci. 11, 926–932. doi:10.1038/s41561-018-0265-7
Whitley, R., Beringer, J., Hutley, L. B., Abramowitz, G., De Kauwe, M. G., Duursma, R., et al. (2016). A model inter-comparison study to examine limiting factors in modelling Australian tropical savannas. Biogeosciences 13, 3245–3265. doi:10.5194/bg-13-3245-2016
Whitley, R., Beringer, J., Hutley, L. B., Abramowitz, G., De Kauwe, M. G., Evans, B., et al. (2017). Challenges and opportunities in land surface modelling of savanna ecosystems. Biogeosciences 14, 4711–4732. doi:10.5194/bg-14-4711-2017
Yang, Y., Roderick, M. L., Zhang, S., Mcvicar, T. R., and Donohue, R. J. (2019). Hydrologic implications of vegetation response to elevated CO2 in climate projections. Nat. Clim. Chang. 9, 44–48. doi:10.1038/s41558-018-0361-0
Yao, J., Liu, H., Huang, J., Gao, Z., Wang, G., Li, D., et al. (2020). Accelerated dryland expansion regulates future variability in dryland gross primary production. Nat. Commun. 11, 1665. doi:10.1038/s41467-020-15515-2
Zeng, Z., Piao, S., Li, L. Z., Wang, T., Ciais, P., Lian, X., et al. (2018). Impact of Earth greening on the terrestrial water cycle. J. Clim. 31, 2633–2650. doi:10.1175/jcli-d-17-0236.1
Zhang, P., Jeong, J.-H., Yoon, J.-H., Kim, H., Wang, S.-Y. S., Linderholm, H. W., et al. (2020). Abrupt shift to hotter and drier climate over inner East Asia beyond the tipping point. Science 370, 1095–1099. doi:10.1126/science.abb3368
Zhao, M., and Running, S. W. (2010). Drought-induced reduction in global terrestrial net primary production from 2000 through 2009. science 329, 940–943. doi:10.1126/science.1192666
Keywords: drylands, gross primary productivity, climate change, CMIP6, space-for-time, variability-for-time
Citation: Zhan W, Lian X, Liu J and Gentine P (2022) Inappropriateness of space-for-time and variability-for-time approaches to infer future dryland productivity changes. Front. Environ. Sci. 10:1010269. doi: 10.3389/fenvs.2022.1010269
Received: 02 August 2022; Accepted: 22 September 2022;
Published: 10 October 2022.
Edited by:
Heping Liu, Washington State University, United StatesReviewed by:
Jiafu Mao, Oak Ridge National Laboratory (DOE), United StatesDafeng Hui, Tennessee State University, United States
Copyright © 2022 Zhan, Lian, Liu and Gentine. This is an open-access article distributed under the terms of the Creative Commons Attribution License (CC BY). The use, distribution or reproduction in other forums is permitted, provided the original author(s) and the copyright owner(s) are credited and that the original publication in this journal is cited, in accordance with accepted academic practice. No use, distribution or reproduction is permitted which does not comply with these terms.
*Correspondence: Xu Lian, xl3179@columbia.edu