Analysis of the coupling coordinated development and evolutionary trend of digital economy and ecological environment
 Lianyan Fu1†
  Bo Liu
 Jianhong Cao
- 1School of Mathematics and Statistics, Liaoning University, Shenyang, Liaoning, China
- 2School of Economics, Liaoning University, Shenyang, Liaoning, China
- 3School of Business and Economics, University Putra Malaysia, Seri Kembangan, Selangor, Malaysia
- 4School of Environment, Liaoning University, Shenyang, Liaoning, China
In order to clarify the coordinated development status between the digital economy and the ecological environment in the context of rapid development of the digital economy and frequent ecological environment problems, we constructed an evaluation system using data related to the digital economy and the ecological environment in China from 2011 to 2019. And the level of coordinated development is calculated with the help of entropy method and the Coupling Coordinated Development (CCD) model. Further, we analyzed the spatial and temporal evolutionary trends of their coordinated development levels with the kernel density analysis and the Dagum Gini coefficient decomposition. The results of the entropy method and CCD show that both the level of digital economy, the level of ecological environment and the level of coupling coordination between the two have increased. And the level of coordinated development shows regional heterogeneity, with the highest in the eastern region, followed by the central region, and the lowest in the western region. The results of the kernel density analysis show that there is heterogeneity in the development process of CCD scores over time across regions. The results of the Dagum Gini coefficient decomposition show that the overall inter-regional differences, as well as intra-regional differences, are fluctuating and decreasing. And the overall imbalance mainly comes from the differences in development levels between regions. The analysis of the above methods provides a basis for understanding the spatial and temporal evolution characteristics of the coordinated development of China’s digital economy and ecological environment. And it also provides relevant policy recommendations for promoting coordinated and sustainable development among regions.
1 Introduction
With the global outbreak and spread of COVID-19, the economic system has suffered a serious blow all over the world. Based on this background, the rapid expansion of online activities such as online trade, online office, and online education during the epidemic period has been extremely effective in alleviating the heavy impact of the rampant epidemic on economic development. And it has solved the problem of production and life stoppage to a certain extent while ensuring effective control of the epidemic. In addition, this form of Information and Communications Technology (ICT)-based economy has also played an important role in the growth of the world economy. 2019 China Academy of Information and Communication Research estimates show that the value added of the digital economy in 47 countries reached USD 31.8 trillion, an increase of USD 1.6 trillion over last year. And the digital economy in China alone has reached $5.2 trillion, becoming a key component of GDP (Park et al., 2018). The growth of the digital economy is a testament to its potential to drive economic development. In addition, as of March 2020, the number of Chinese Internet users reached 904 million, ranking first in the world, and the Internet penetration rate reached 64.5% (Ren et al., 2021). The digital economy has become the most inseparable part of the social life of Chinese residents. However, the impact of economic development on the environment is evident. The results of previous studies showed that along with the continuous growth of economic scale, a series of environmental problems such as environmental pollution, over-exploitation of resources, and excessive greenhouse gas emissions (Yang X. et al., 2021; Wu et al., 2021; Ren et al., 2022) cannot be ignored as well. The conflict between economic development and environment conditions has intensified, despite the increased awareness of environmental protection and the introduction of relevant environmental policies in various countries, environmental problems are still prevalent around the world (Fan et al., 2019). The sloppy and rapid growth pattern of the traditional economy relies on the massive input of production factors (Li and Yi, 2020), and the economic growth brought by this pattern is at the cost of the deterioration of the ecological environment, without achieving a harmonious development between the economy and the environment. However, the effective combination of digital technologies and traditional industrial production activities, which the digital economy relies on, has led to significant improvements in production efficiency and higher levels of energy resource use (Melville, 2010; Chun et al., 2015). And it has an important role in achieving sustainable development (Kunkel and Matthess, 2020; Wen et al., 2021). In addition, the emergence of social platforms has enabled the public to provide better feedback on environmental conditions and alleviate information asymmetry. Various digital technologies have also been widely adopted by governments to address environmental regulation problems (Li Z. et al., 2021). However, the digital economy can also lead to more energy consumption and therefore more pollution (Li Y. et al., 2021). And If we take into account the embodied carbon emissions of the digital economy, its negative impact on the ecological environment is even greater. Therefore, clarifying the relationship between the digital economy and ecological environment is an important issue that we should address now. Whether the growth of the digital economy and the ecological environment is contrary to each other or complementary? How to maintain the coordinated growth of the digital economy and the ecological environment to achieve sustainable development? The answers to the above questions not only help to understand the relationship between the digital economy and ecological environment and promote the coordinated development of both, but also make effective use of digital economy to alleviate environmental problems and achieve sustainable development.
The marginal contributions of this paper are as follows. First, the coupling coordinated development (CCD) of the digital economy and ecological environment is measured in the context of the increasing global digitalization trend. It enriches the content related to the study of the digital economy and ecological environment. Second, we expanded the measurement perspective of the digital economy and the ecological environment, making the evaluation results more accurate and reliable. Third, the spatial and temporal differences in the CCD of the two are analyzed by the Dagum Gini coefficient method and the Kernel density method. The above in-depth analysis provides a full understanding of the coordinated development status and regional heterogeneity of the digital economy and ecological environment in China. And it also provides relevant policy recommendations for promoting the overall and inter-regional coordinated and sustainable development in China.
The rest of the study is organized as follows. A review of the relevant literature is presented in Section 2. Section 3 provides a description of the research area overview, indicator construction, research methods, and data sources. Section 4 analyzes and discusses the empirical results. Section 5 provides conclusions and proposes relevant policy implications.
2 Literature review
The concept of the digital economy first emerged in the 1990s with the publication of The Digital Economy: Promise and Peril in the Age of Networked Intelligence by Don Tapscott (1996). Since then, the term digital economy which has been frequently mentioned by governments and scholars has been studied and interpreted extensively, producing a wealth of results. In terms of the scope of the digital economy, Moulton (1999) argues that the digital economy encompasses not only e-commerce but also the information technology on which it is based. Kling and Lamb (1999) expands this further by arguing that the digital economy includes information and communication infrastructure, the IT industry, and the wholesale and retail of goods based on digital transmission and information technology. Bukht and Heeks (2018) considers any economic output based on digital goods or digital services, whether they are wholly or partially dependent on digital technology, to be part of the digital economy. He defines this as the broadest and most real digital economy. Miao (2021) views digital as a factor of production from a value chain perspective and argues that the digital economy is a value chain innovation formed based on data as a factor of production and that each value-added link in the value chain of the digital economy creates new value. In summary, scholars do not fully agree with the definition of the digital economy due to the different perspectives and ways of perceiving it. In the determination of digital economy measurement indicators, international standards have not yet been unified either. Among them, the European Union has proposed the Digital Economy and Economic Society Index, or DESI for short; the United Nations International Telecommunication Union (ITU) has proposed the ICT Development Index; the Digital Economy Index of the China Academy of Information and Communication Research; the Global Digital Competitiveness Index of the Shanghai Academy of Social Sciences and the Internet Plus Digital Economy Index published by Tencent, etc. Although there is no consensus on the definition of the digital economy and its measurement index, most of the literature on ecological environment measurement adopts the pressure-state-response (PSR) model proposed by OECD in 1994 to measure the state of the ecological environment from three perspectives. And this model has good results in exploring the relationship between ecological environment and socioeconomic development (Yuan et al., 2014).
Our study is related to two streams in the literature. The first stream pertains to the effect of the digital economy on the environment. And previous scholars have conducted in-depth studies about this. Some of the findings suggest that the digital economy has a positive effect on the improvement of environmental quality. First, the adoption of various advanced digital technologies has led to a significant increase in the production capacity of enterprises, which in turn reduces pollution emissions (Li Z. et al., 2021; Zhu et al., 2022). Secondly, the application of digital technology also improves the level of environmental regulation, broadens the channels of environmental regulation (Granell et al., 2016), and enables effective maintenance of ecological and environmental quality. Moreover, the digital economy can improve environmental quality by encouraging the digital transformation of enterprises and promoting financial development as well as industrial structure upgrading (Kunkel and Matthess, 2020; Wen et al., 2021). However, due to the rebound effect, the development of the digital economy can reduce environmental quality if energy prices are not regulated. In addition, the ICT sector can produce large amounts of carbon emissions through its requirement for carbon-intensive intermediate inputs from non-ICT sectors (Zhou et al., 2019). Therefore, the indirect effects of the digital economy will also lead to the deterioration of the ecological environment. Some scholars have also found that the relationship between the digital economy and the ecological environment is non-linear. Krueger (Grossman and Krueger, 1992) found an inverted U-shaped curve between the ecological environment and economic development, i.e., the environmental Kuznets curve. Subsequent scholars have also confirmed this hypothesis by empirical analysis. They found that at the beginning of economic growth, the quality of the ecological environment decreases due to disorderly and crude development (Yueting et al., 2019) until an inflection point is reached, and then the quality of the ecological environment gradually improves as the level of economic development increases (Yongda and Boqiang, 2019). In general, different conclusions have been drawn about the relationship between the digital economy and environmental performance due to different research methods as well as research regions and research periods. And the second stream pertains to the coordinated development. In terms of coordinated development, the most applied is the CCD model, which is originally a concept belonging to physics and is mainly used to represent the phenomenon of interaction and mutual influence between multiple subsystems belonging to the same parent system (Fan et al., 2019). Since the coupling coordination degree is a good measure of the degree of synergistic and consistent development among the subsystems under the parent system (Dijkema and Basson, 2009), most related studies have used this method to measure the level of coordinated development among different systems. And then some scholars have also used this model to study the multi-system coordinated coupling relationship within the social science field. Among them, Fan (Fan et al., 2019) selected Chinese provincial capitals as the subject of study and explored the degree of CCD of social economy and ecological environment in these cities in the context of rapid urbanization. Subsequently, more factors were introduced into a system and explored the trend of CCD of resources, environment, and economy (Dongjie et al., 2011); urban and rural areas (Zhu and Tong, 2009); rural resources and environment (Lu and Guo, 2017); energy and economy (Qingguo and Yang, 2010); urbanization and ecology (He, 2012); population, society, economy, resource, ecology, and environment (Zhang et al., 2021; Elahi et al., 2022; Ji et al., 2021). However, both streams of related literature have certain limitations and shortcomings. The limitation of the first stream literature is that they only analyzed the impact of the digital economy on the ecological environment through econometric models. And it can not give a solution to promote the coordinated development of ecological environment and digital economy without measuring the coupled and coordinated development between the two. In terms of coordinated development, the limitions of existing studies is that most studies related to the economy subsystem only take into account the traditional economy and ignored the importance of the digital economy in the context of rapid digitalization. The scope of the study is usually limited to a certain city clusters, (Zhao and Jin, 2018), a certain province (Lei et al., 2015), or a specific region (Wang and Xiang, 2018). Compared to the existing literature, our contribution is that we measured and analyzed the degree of coupled and coordinated development of the digital economy and the ecological environment in the context of rapid digitalization. Moreover, we choose China as the study area, and the findings are representative. It provides some reference for understanding the current status of coordinated development of the digital economy and the ecological environment as well as promoting the coordinated development between them.
3 Indicator construction, research methods, research area and data sources
3.1 Indicator system construction
By summarizing and organizing previous literature, the indicators selected in this paper are shown in Table 1. The Digital Inclusive Finance Index published by Peking University is often adopted as a proxy variable for the digital economy or digital finance (Li et al., 2020). However, as a part of the digital economy, it can only measure the extent to which the development of digital finance benefits people, and cannot reflect the development status of the digital economy comprehensively. Therefore, we summarize the research perspectives of previous scholars (Li Y. et al., 2021; Li and Liu, 2021) and measure the development level of the digital economy from four perspectives. The infrastructure development on which the digital economy relies is the most fundamental factor in its development and reflects its growth potential. The degree of integration of industry and digital technology, as well as the degree of digital industry development, represent the scale of the digital economy. How the development of the digital economy benefits more people represents the level of participation of the general public in the digital economy. So we selected the foundation of the digital economy, digital industrialization, the digitalization of industry, and the digital economy penetration as the measurement perspective of the digital economy. Compared with the Digital Inclusive Index, the measurement perspective is richer and the indicators are more comprehensive. As for the ecological environment, the PSR model is a classical framework for studying environmental issues, which is developed by OECD and UNEP in the 1980s and 1990s (Zhang et al., 2014). Three first-level indicators of ecological stress, state, and response were selected with reference to the PSR model. But the influence of government actions on the ecological environment should be taken into account. Therefore, the indicator of ecological policy support was added to reflect the current situation of the ecological environment and the degree of local protection of the ecological environment in an objective and comprehensive way. A total of 33 indicators were selected for the digital economy and ecological environment, of which 19 were selected for the digital economy and 14 for the ecological environment. The selection of indicators is based on the principles of scientificity, hierarchy, accuracy, and accessibility to reflect the status of the digital economy and ecological environment comprehensively and scientifically. The selected indicators are shown in Table 1.
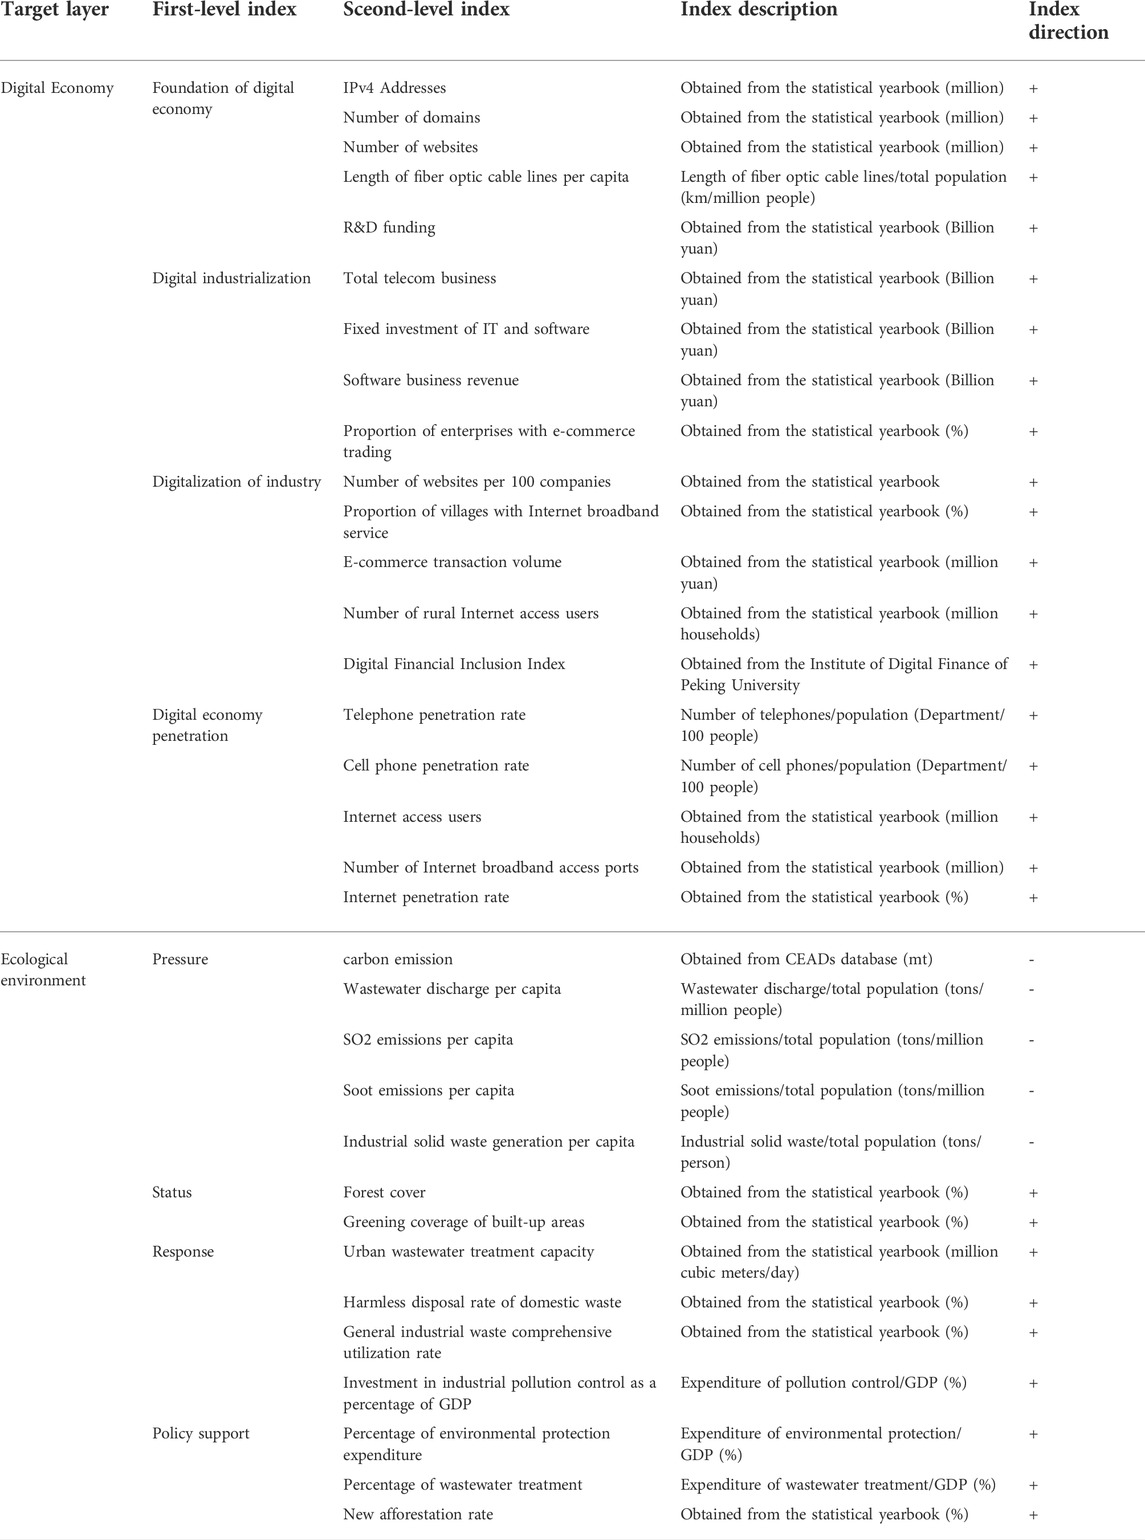
TABLE 1. Measurement system of the digital economy and ecological environment.
3.2 Research methodology and data sources
3.2.1 Measurement of the digital economy and ecological environment
Commonly used methods for determining indicator weights are divided into two categories: subjective and objective. The entropy method is based on information theory, and the weights of indicators are assigned by measuring the entropy value. This property of entropy is used to determine the degree of randomness and disorder of events by calculating the entropy value, and also the degree of dispersion of indicators. The greater the dispersion of an indicator, the greater its influence (weight) on the comprehensive evaluation and the smaller the entropy value (Yang Y. et al., 2021). Using the entropy method to determine the weights can fully utilize the objective information contained in the data and avoid the subjective factors carried by the artificial subjective assignment of weights. Therefore, in this paper, the entropy method is used to determine the weights of each index of the digital economy and ecological environment.
3.2.1.1 Data dimensionless treatment
Let
If the indicator is negative, the treatment formula is as follows:
where
3.2.1.2 Calculate the entropy value and weight
Let
3.2.1.3 Calculation of the overall score level based on the weights
In order to obtain the comprehensive development index of the digital economy and ecological environment, the scores of each level index are first calculated by combining the weights of each evaluation index obtained above according to the entropy weight method. And the formula is as follows:
where
3.2.2 Measuring the coupling coordinated development
In order to assess the degree of coordinated development of the digital economy and ecological environment, this paper adopts the CCD model to calculate the degree of coordinated development between them by referring to previous literature (Wang et al., 2014; Fang et al., 2016). The specific calculation formula is as follows:
C is the coupling degree, T is the coordination degree, and D is the coupling coordination degree. λ and η indicate the respective weight of each, and since the digital economy and the ecological environment are equally important,
3.2.3 Kernel density model
Kernel density estimation is used to estimate an unknown probability density function and belongs to nonparametric statistical methods (Silverman, 1986; Brunsdon, 1995; Shi, 2010). It has the advantages of low model dependence and high stability. The main idea is to use a smoothing function to fit the sample distribution data so as to estimate the true sample probability distribution curve. The use of kernel density estimation is able to change the kernel density curve by adjusting the bandwidth, which enables it to reflect the characteristics of the sample data itself and avoid the discontinuity of the histogram. The specific formula is as follows:
Suppose
Where
3.2.4 Dagum Gini coefficient decomposition
The Dagum Gini coefficient decomposition is a method proposed by Dagum (Dagum, 1997) in 1997 to decompose inter-regional imbalances by subgroups. Compared with traditional methods such as the Gini coefficient and the Theil index, it performs better and more accurately in dealing with sub-regional disequilibrium. Moreover, the traditional decomposition methods have strict requirements for the data between groups. The data in any group must be completely smaller or larger than the data in the rest of the groups, and no overlapping values are allowed in different groups. The Dagum Gini coefficient, however, solves this problem by not requiring restrictions on the data between groups. This decomposition method has been used widely to analyze differences (Zhang and Wang, 2021; Zhang and Xing, 2021). In this paper, the Dagum Gini coefficient method can effectively measure the development inequality between regions, and the total difference can be decomposed into three parts: intra-regional difference, inter-regional difference, and super-variable density. The specific calculation and decomposition formula is as follows:
Where
3.2.5 Research area and data sources
China is the largest developing country in the world, with a vast land area of 9.63 million square kilometers and a population of 1.41 billion in 2020, accounting for 18% of the world’s total population. Mainland China includes 31 provinces, each province has a great difference in terms of geographical location, resource endowment, and development status. And the 30 provinces in mainland China are subdivided into three parts: East, Central, and West according to their geographical locations and economic development degrees for analysis and comparison. The eastern region includes Beijing, Tianjin, Hebei, Shanghai, Shandong, Jiangsu, Zhejiang, Fujian, Guangdong, Hainan, and Liaoning, the central region includes Henan, Shanxi, Hubei, Anhui, Hunan, Jiangxi, Jilin, and Heilongjiang, and the western region includes Inner Mongolia, Guangxi, Chongqing, Sichuan, Guizhou, Yunnan, Shaanxi, Gansu, Ningxia, Qinghai, and Xinjiang. Because of the serious missing data in the Tibetan province, we selected 30 provinces, cities, and autonomous regions in mainland China as the research object. China’s digital economy-related indicators have almost no statistical data before 2011, and the data after 2019 are not yet publicly available; considering the data availability, the research period selected in this work is 2011–2019. The data come from the China Statistical Yearbook, the statistical yearbooks of each province as well as the CEE database and CEADs database. Missing data for some provinces are supplemented by interpolation.
4 Empirical results and analysis
4.1 Analysis of the digital economy and ecological environment score
As can be seen in Figure 1, the level of the digital economy has grown significantly over time in all provinces, almost all provinces increased by more than 100% compared to 2011. Our empirical results further augment the findings of Zhu et al. (2022). This is mainly due to the Chinese government’s policy support for the digital economy and its strong infrastructure capacity. Given the role of the digital economy in driving economic growth, China’s central government launched the “Broadband China” strategy as early as 2012 with the goal of making broadband a strategic national public infrastructure, and the implementation of this strategy has greatly improved the digital infrastructure and laid a solid foundation for the development of China’s digital economy. In addition, China’s opening-up policy has introduced a large number of digital technologies, and the emerging technologies have been improved and perfected in the development of China’s vast digital economy market, making the overall digital economy level develop greatly in recent years. However, at the same time, the uneven development of the digital economy in China is also particularly prominent. The eastern coastal provinces such as Beijing, Zhejiang, Guangdong, and Shandong have a digital economy score of more than 0.4 and are far ahead, while the western regions such as Xinjiang, Gansu, and Qinghai are far below the rest of the provinces. The main causes of this unbalanced development phenomenon are as follows. First, the western region is geographically inferior to the eastern coastal region, the difficulty of infrastructure construction, the degree of investment in related resources, and the ease of technology introduction are far behind the rest of the region. This geographical location brings the inherent disadvantage that makes the digital economy development level lower. Second, because the digital economy has a significant effect of increasing marginal rewards, once the information infrastructure and trading platforms and mechanisms are perfected, subsequent economic behavior based on them no longer requires large inputs to obtain a higher marginal output and thus further enhance the digital economy, which in turn exacerbates this imbalance.
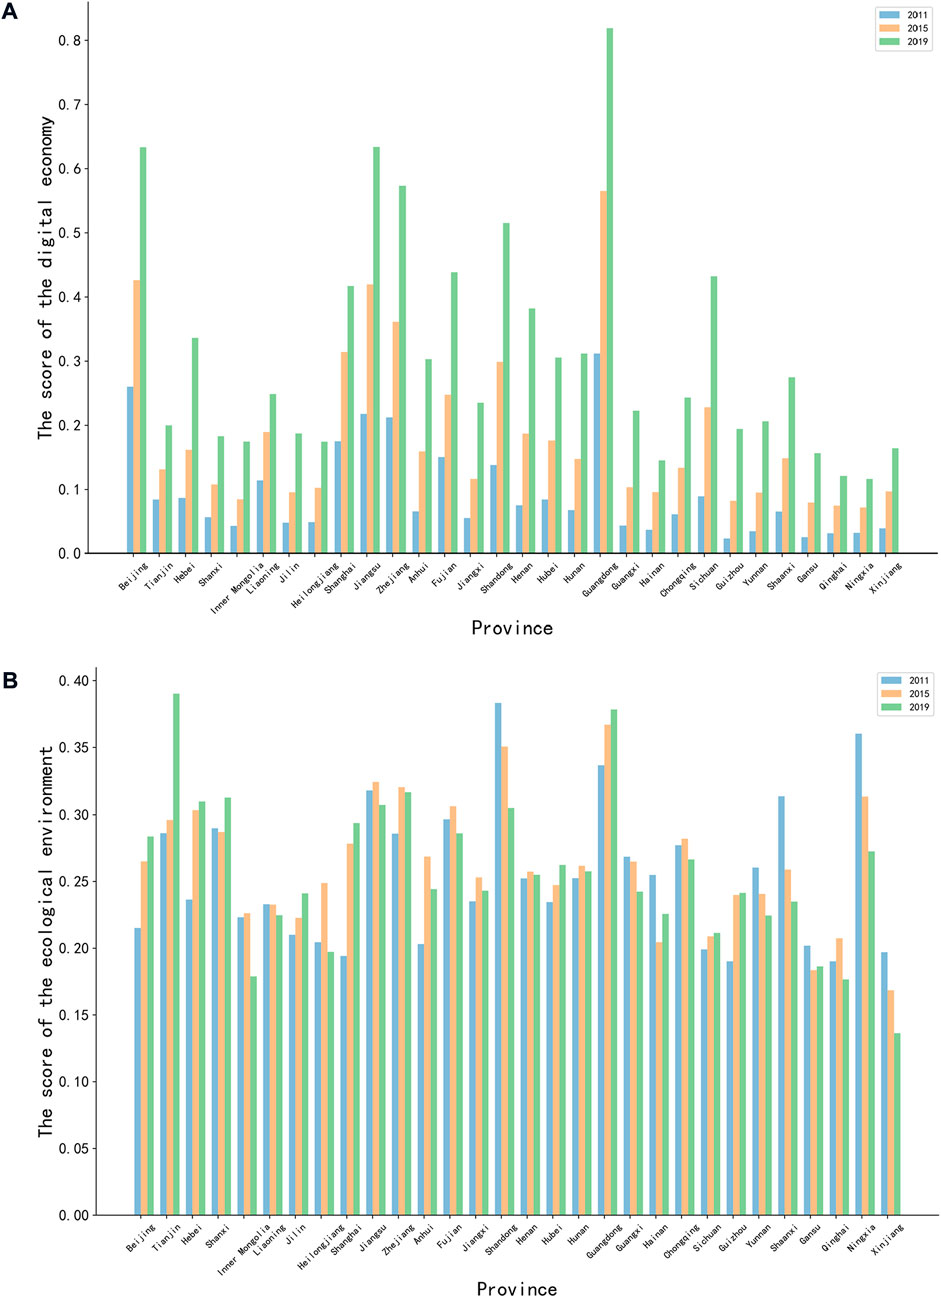
FIGURE 1. The score of the digital economy and ecological environment. (A) The score of the digital economy; (B) The score of ecological environment.
In terms of the ecological environment development, there are some differences in the performance of provinces. Except for some eastern coastal provinces such as Beijing, Guangdong, Tianjin, and Zhejiang, where the quality of the ecological environment has improved, most regions maintain small fluctuations in the ecological environment level or show a decline in development level. The reason for this phenomenon is that the eastern coastal regions have a higher level of economic development and their residents and governments have a higher demand for ecological environment quality, so these provinces have the will and ability to invest relevant resources to improve the ecological environment level. The rest of the provinces, such as Liaoning and Jiangxi, have a limited economic level and the local government places more emphasis on economic development. Therefore, the resources invested in environmental management are limited, and the ecological score shows some fluctuations with economic development. Finally, some central and western provinces such as Inner Mongolia, Xinjiang, and Heilongjiang are relatively backward in terms of economic development level and have taken on some of the highly polluting but local economic growth-driving enterprises brought about by the transfer of industries from the eastern coastal provinces, so the short-sighted behavior of local governments has led to a gradual decline in the ecological environment level of these provinces along with economic development.
4.2 Analysis of the coupling coordinated development
From the heat map of the CCD level in 2011, 2015, and 2019 in Figure 2, it can be found that the overall level of CCD between the digital economy and ecological environment has increased. This is consistent with the results of Li (Li Z. et al., 2021). As can be seen from Table 2, the degree of coordinated development of the digital economy and ecological environment in most provinces has steadily increased with the year, while individual provinces, such as Xinjiang and Qinghai, have fluctuated in individual years, but still maintain an upward trend. Among them, the coordination level score is greater than 0.6 mainly in the five eastern coastal provinces of Guangdong, Jiangsu, Zhejiang, Beijing, and Shandong. These regions have a high level of economic development and a good foundation for digital economy development. The introduction and application of advanced digital technologies can be well popularized among local enterprises and residents. Moreover, the overall environmental awareness of the residents is higher, and the high standard of the environmental level also forces the local government to focus on the management and improvement of the ecological environment. So the coordinated development of the ecological environment and digital economy is far ahead. The four western provinces of Xinjiang, Qinghai, Ningxia, and Gansu all have a coordinated development score of less than 0.45, which is much lower than that of the eastern region. The main reason for this is that the western region generally has a large administrative area and requires more human resources and capital investment for ecological and environmental management. And due to the sparse population, the average cost of environmental management is higher. The level of fiscal revenue in these provinces is not sufficient to cover the corresponding public expenditure. At the same time, these regions have benefited from the sinking of digital technology and the improvement of digital infrastructure, and the level of digital economy has increased instead. Therefore, the coordination between the two has not grown as much as in the east.
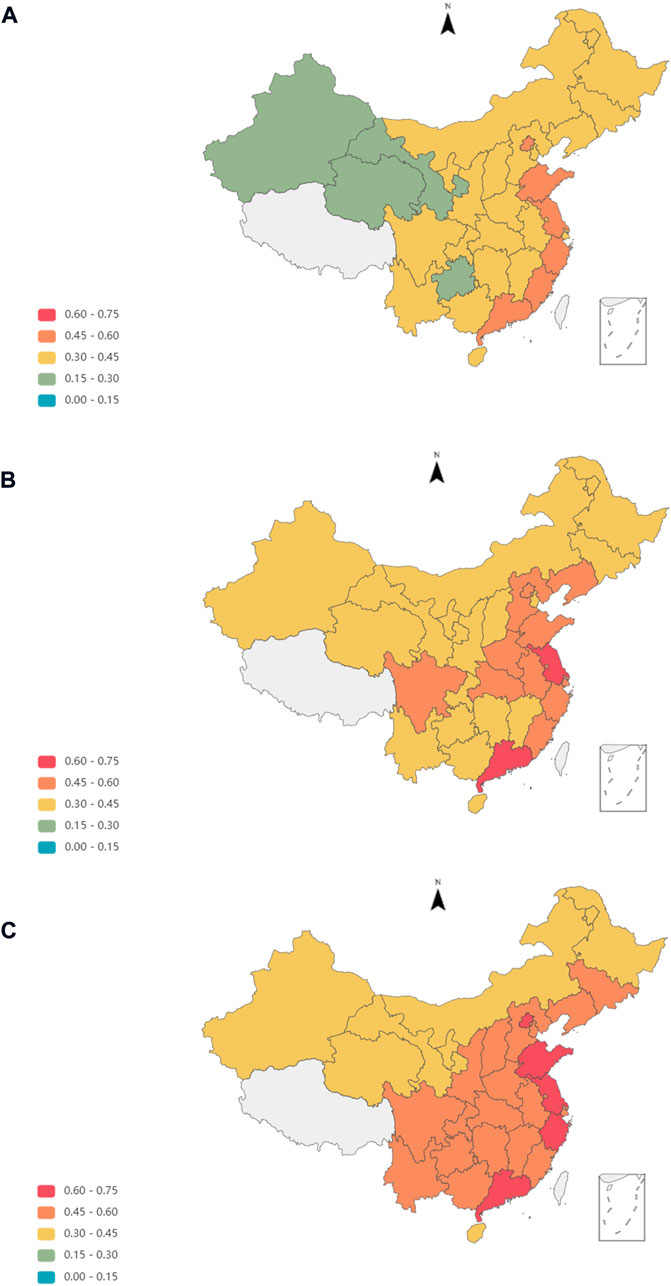
FIGURE 2. The heat map of CCD scores by province. (A–C) indicate the heat map of 2011, 2015, and 2019, respectively
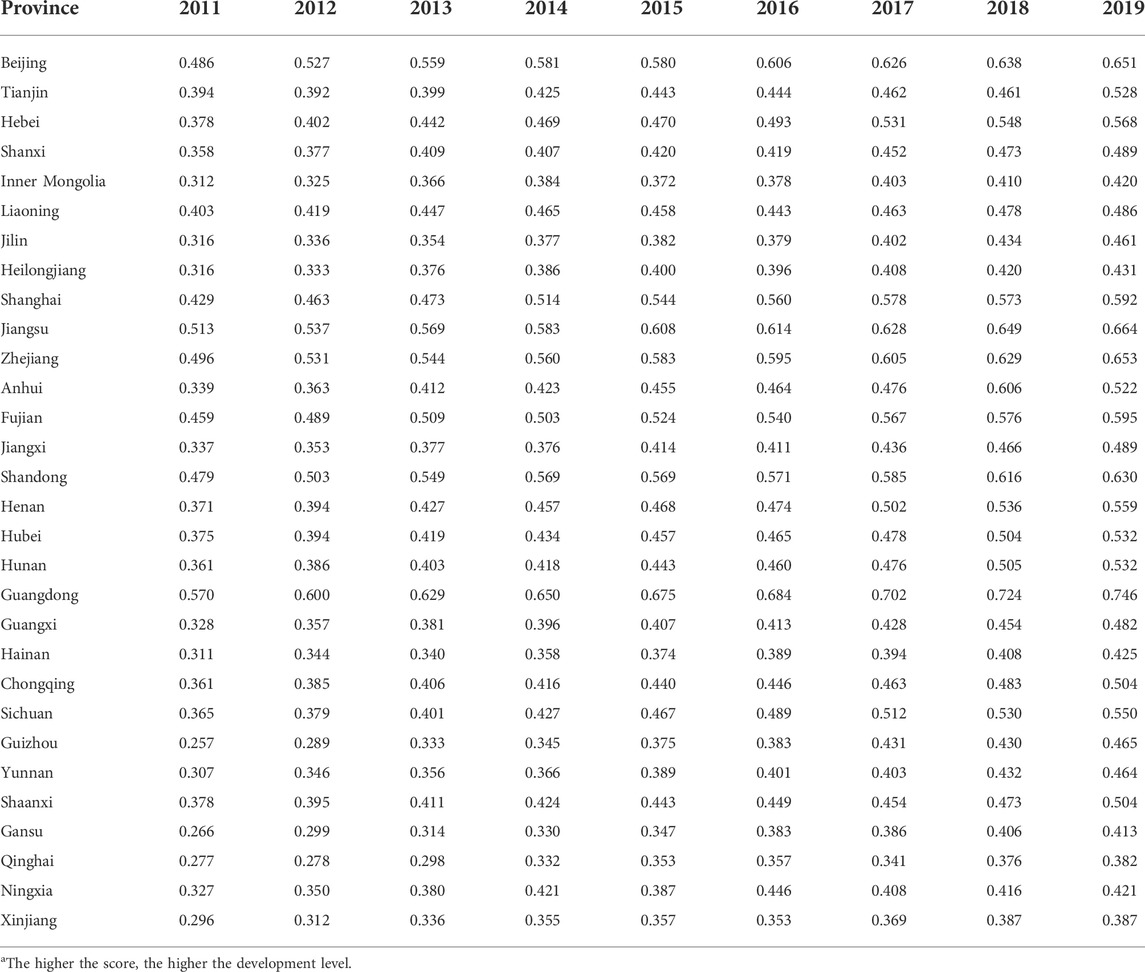
TABLE 2. The score of coupling coordinated development.
4.3 Kernel density curve analysis
To further explore the dynamic characteristics of China’s CCD level, this paper adopts the kernel density estimation method to analyze the specific characteristics of four aspects of the distribution location, morphological changes, extensibility, and polarization of China’s overall and different regional integrated development levels.
Figure 3A shows the dynamic evolution trend of the CCD of the digital economy and ecological environment in China as a whole during the sample period. It can be found that the center and interval of the overall distribution curve gradually shift to the right, which indicates that the level of coordinated development between the two shows an increasing trend. The height of the main peak of the curve gradually decreases, the width of the curve remains almost constant, and the right trailing phenomenon of the distribution curve eases over time, which indicates that the absolute difference in the overall coordinated development level of digital economy and ecological environment among Chinese provinces gradually decreases. This phenomenon is consistent with the results of the above analysis. Inter-provincial differences decrease with the development of the lagging provinces. The distribution curve gradually evolves from a multi-peak state to a single-peak state, and the change of the waveform state indicates that the absolute difference in the level of coordinated development among the provinces has decreased and the development level is more evenly distributed. The main reason is that at the beginning of the sample observation, the digital infrastructure in some lagging provinces is not sound, the digital application scenarios were scarce, and the ecological pollution problem was prominent due to the weak awareness of ecological protection, so the absolute difference in the level of coordinated development among provinces was relatively larger. And then the backward provinces further improved their digital layout and developed digital application scenarios by virtue of policy inclination, which solved the problem of waste of resources and excess capacity to a certain extent. The digital economy has also improved the ecological environment by reducing information asymmetry and transforming the original rough development method into a refined development. Moreover, the improvement of economic level also makes people pay more attention to environmental issues, so the development of digital economy and ecological environmental protection promote each other and complement each other. Although there is still a certain gap with the developed regions, the coordinated development level of some backward regions has been greatly improved, and the absolute difference with the developed regions has decreased.
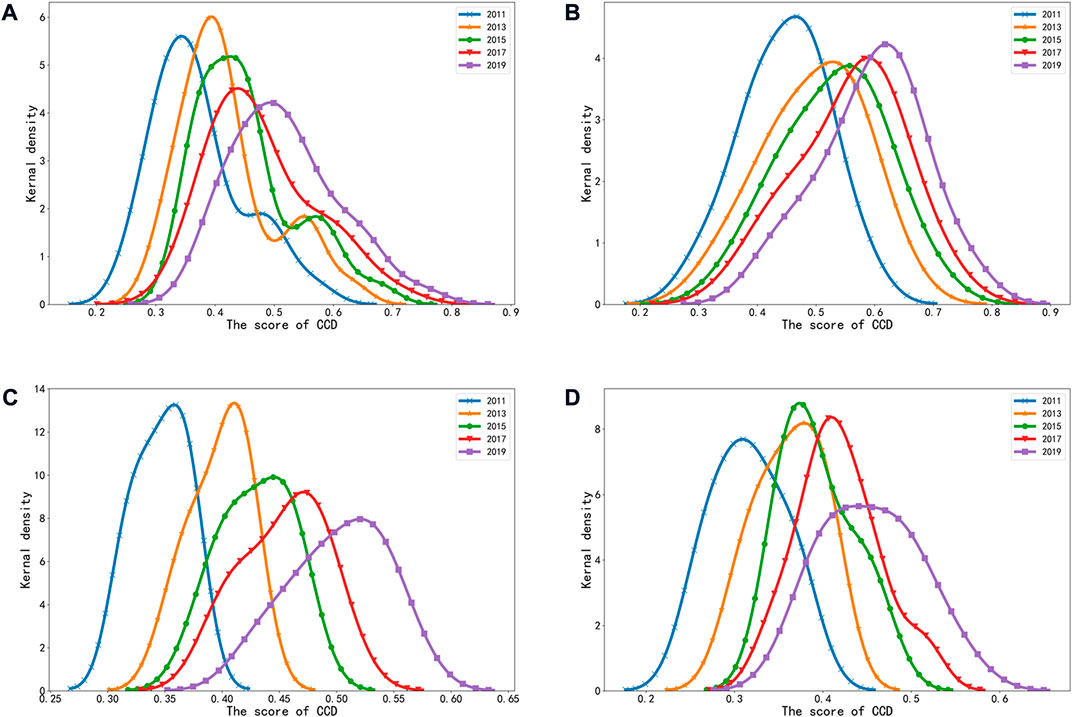
FIGURE 3. CCD kernel density of national and regional. (A) Kernel density of China; (B) Kernel Densityof eastern region; (C) Kernel Density of central region; (D) Kernel Density of western region.
Due to the large number of provinces in China, there are significant differences in resource endowments and development levels among provinces. Therefore, in order to have a comprehensive and detailed understanding of China’s CCD level, this paper further analyzes the CCD level of the three major regions in East, West and Central China. From Figures 3B–D, we can find that the centers and intervals of the distribution curves of the three regions are also gradually shifted to the right, which is consistent with the overall situation of China, indicating that the CCD in each region also shows an upward trend. From the extension of the distribution curve, the eastern and central regions show a more obvious left trailing phenomenon, which indicates that the difference in the level of coordinated development among the provinces in the eastern and central regions is gradually expanding and the unbalanced phenomenon is prominent. And the left trailing indicates that the gap of coordinated development within the region mainly comes from some provinces with faster growth rates, while the rest of the provinces in the region do not fully catch up with these faster development provinces, so there is a phenomenon of gradually expanding difference between provinces within the region. This is mainly due to the path dependence of development in some provinces, for example, the development of some resource-heavy provinces such as Shanxi relies on the exploitation of natural resources such as coal mines, and it is difficult to take into account the quality of the ecological environment while developing, so the level of coordinated development is at a backward stage. However, from the overall distribution interval changes, the level of coordinated development of the two regions is still growing. In terms of the polarization of the distribution curve, the eastern, central and western regions have all remained single-peaked, indicating that the level of coordinated development in each province within the three regions is not polarized despite the trend of expansion. In terms of the distribution pattern, the height of the crest in the eastern region decreases sharply and then increases slowly. And the width of the curve increases and then converges, indicating that the level of coordinated development in the eastern provinces is diverging at the beginning but then converges gradually, and the level of coordinated development in each province tends to be consistent. This is inextricably related to the improvement of infrastructure construction among provinces in the eastern region, and the provinces rely on convenient transportation and digital technology to enable the effective dissemination of other information such as emerging technologies and development concepts among the regions, and the spillover effect and demonstration effect also drive the development of surrounding provinces, so that the level of coordinated development in the eastern region is converging. The height of the wave in the central region gradually decreases and the width of the wave gradually increases. This indicates that the difference in the level of coordinated development between provinces within the central region is gradually increasing, as the level of coordinated development in the central region is low at the beginning of the research phase, the difference is small and therefore the development level is more concentrated. With the development of time, some provinces, such as Anhui, have succeeded in getting rid of the development path dependence, introducing high-tech industries such as BOE, etc., so that their digital economy development level has been significantly improved and the development mode has shifted from rough to intensive, and the quality of ecological environment has been improved. However, the rest of the provinces have not explored their own development paths, so the level of coordinated development is becoming more and more different among the provinces, with a trend of dispersion. The height of the curve crest gradually increases in the western region, but decreases in the last year, and the width of the curve also increases. This indicates that the level of coordinated development of the digital economy and ecological environment in the western region first converges and then diverges. The difference between the digital economy and the ecological environment also indicates that the western region should take into account the maintenance and improvement of the ecological environment while focusing on the improvement of the digital economy, and should not trade the ecological environment quality for the development of the digital economy.
4.4 Dagum Gini coefficient decomposition
In order to further reveal the differences in China’s coordinated development and their sources, this paper adopts the Dagum Gini coefficient decomposition method to measure and decompose the differences in their coordinated development.
4.4.1 Overall and intra-regional variation analysis
The dynamic evolution of the Gini coefficient for the country as a whole and for the three main regions of coordinated development is shown in Figure 4, which shows that the overall level of coordinated development in China is fluctuating and decreasing. Although the Gini coefficient increased slightly in 2017, but continued to decrease in the following years and was always lower than 2011. The main reason for the fluctuations in 2017 is the inconsistency of CCD growth between regions. The total CCD growth in 2017 was 0.200, 0.161, and 0.099 for east, central, and west, respectively. The increase in the absolute difference between the western region and the other regions increases the inter-regional Gini coefficient and therefore leads to an increase in the overall Gini coefficient. This can also be verified in Figures 5, 6. It can be seen in Figure 5 that the Gini coefficient of east-west and west-central have increased in 2017. And the contribution of inter-regional differences to the overall Gini coefficient has increased in 2017 in Figure 6.
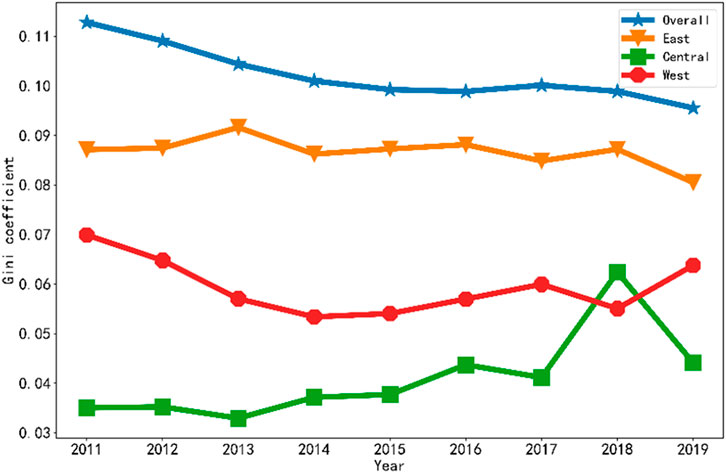
FIGURE 4. National and regional Gini coefficients.
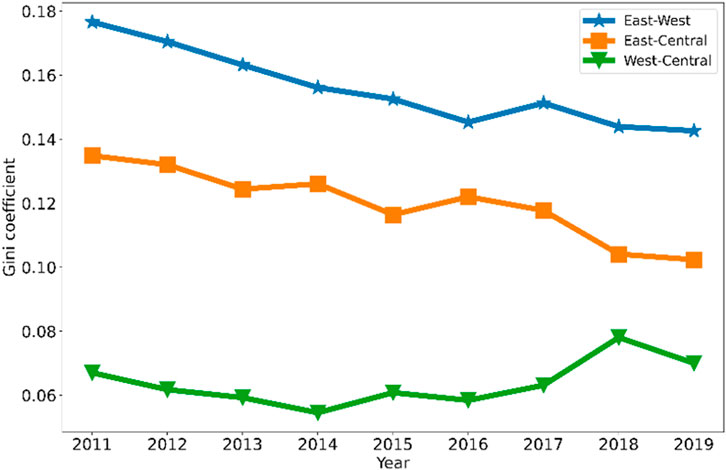
FIGURE 5. Gini coefficient values by region.
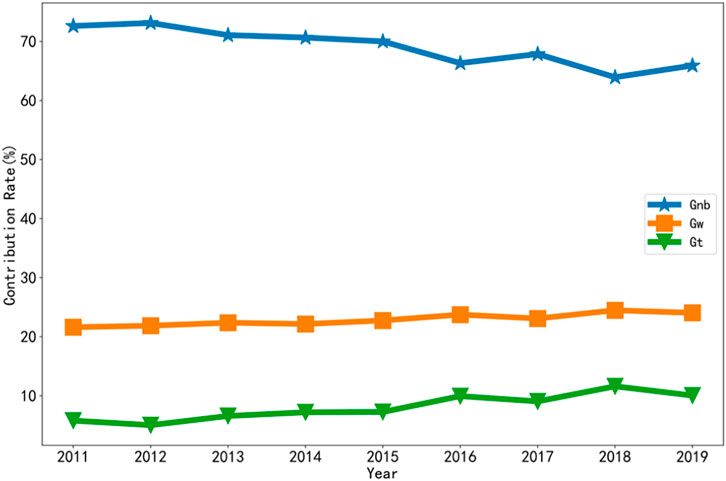
FIGURE 6. Decomposition of Gini coefficient differences and their contribution rates.
By region, the Gini coefficient of the eastern region is declining. The provinces in the eastern region are more closely connected, with the development of the Beijing-Tianjin-Hebei city cluster effectively driving the level of the local digital economy and improving the quality of the ecological environment. The Pearl River Delta city cluster has successfully nurtured high-tech digital technology companies such as Huawei, Tencent, and DJI with its superior geographical location and policy support, and therefore has a higher level of digital economy. The improvement in the level of digital economy and ecological environment makes the degree of synergistic development between the two also gradually tends to converge, so the degree of difference in coordinated development between provinces in the eastern region steadily decreases. The difference in the coordination of the central region is on the rise. The central region includes provinces with serious development path dependence, such as Shanxi and Inner Mongolia, which rely on rich mineral resources to develop their economy while the quality of ecological environment inevitably declines. The remaining provinces that do not have such path dependence can develop their digital economy and improve the quality of ecological environment at the same time, so the absolute difference in the CCD between provinces gradually increases over time. But at the same time, because the CCD is relatively more balanced in the central region as a whole, it is still lower than that in the eastern and western regions, although it has improved. The inter-province differences in the western region gradually decreased until 2014 and then increased. The main reason is that the level of coordinated development in the western region was at a low level before 2014, and the development speed was relatively slow, so the inter-regional differences decreased as the level of coordination increased. Subsequently, there were large differences in the growth rate and absolute level of coordination level among the provinces in the western region, so the degree of difference increased. However, it is worth noting that the degree of difference in coordination level in 2019 is still lower than that in 2011. This indicates that the gains from the increase in the level of digital economy and ecological environment in the western region outweigh the imbalance caused by the inter-regional development.
4.4.2 Trends in the evolution of inter-regional differences
As can be seen from Figure 5, the differences in the degree of coordinated development between regions are increasing and decreasing. Specifically, the difference between the eastern and western regions is the largest, and the curve position is always higher than the Gini coefficient curve between the east-central and central-western regions in the whole sample interval. The main reason is that there are large differences between the east and west regions, both in terms of resource endowment and geographic location, which are inherent conditions, and in terms of socio-economic development patterns, population quality, population density, and infrastructure development, which are acquired environments. Subject to these conditions, the digital economy and ecological environment differ greatly between the two regions, so there is a large gap in the level of CCD. However, at the same time, the level of difference between the two regions is fluctuating and decreasing, thus indicating that the degree of coupling and coordination in the western region is gradually approaching that in the eastern region. The central region is at an intermediate level in terms of digital economy and ecological environment development levels, so the differences between both the east-central regions and the central-western regions are smaller than the differences between the east-west regions. It is noteworthy that the difference in the CCD between the central and western regions gradually increases after 2014, a finding that overlaps with the phenomenon of increasing intra-regional differences above, suggesting that the increase in differences between the two major regions stems mainly from the increase in differences within the western regions, which is exacerbated by the differences between the central and western provinces. Although the overall Gini coefficient is smaller between the central and western regions, the increase is larger. This also reveals that the Chinese government should focus more on inter-regional coordination in its development.
4.4.3 Sources of differences and their contributions
Figure 6 shows the sources of variation in the level of coordinated development of digital economy and ecological environment in China and their contributions. The dynamic evolution of the sources of variation shows that the variation in the level of coordinated development mainly comes from the contribution of inter-regional variation, and the proportion of its contribution far exceeds that of intra-regional disparity and hyper-variance density. Specifically, the inter-regional and hypervariance density curves wax and wane, with symmetric changes around the intra-regional Gini coefficient curve, while intra-regional differences fluctuate slightly and remain largely unchanged. The hypervariance density represents the contribution of the cross-overlap component present in different regions to the overall disparity, which increases gradually over time. This set of characteristics indicates that the overall disparity mainly originates from inter-regional differences, but the contribution of inter-regional differences decreases as time grows. The contribution of hypervariance density gradually increases, but the contribution rate remains at a low level. And the contribution rate of intra-regional variation is basically maintained at 20%.
5 Conclusion and policy recommendations
Based on the panel data of 30 provinces and cities in China from 2011 to 2019, this paper measures the development level of digital economy and ecological environment using the entropy method, and measures the degree of coordinated development between digital economy and ecological environment based on the CCD model. On this basis, the kernel density model and the Dagum Gini coefficient model are conducted to analyze and discuss the distribution dynamics, evolutionary trends, and regional differences of the coordinated development in China. The results of the study are as follows: 1) China’s digital economy and ecological environment have made some progress in recent years, with the eastern region developing the fastest, followed by the central region, and the western region lagging behind. And the status of the digital economy development is better than ecological environment. However, there is still much room for improvement in both the ecological environment and the digital economy in each region. 2) The level of coordination between the digital economy and ecological environment has improved in all provinces, but the level of coordinated development shows significant regional heterogeneity, with the highest level of coordination in the eastern region, followed by the central region and the lowest in the western region. 3) The overall level of coordinated development in China shows a slight divergence, with the absolute difference between provinces increasing over time. 4) By region, the Gini coefficient of coordinated development between regions shows a fluctuating downward trend, with the largest Gini coefficient value between the east and west, followed by the east-central region, and the smallest in the central-western region. Moreover, the differences in overall coordinated development in China mainly originate from inter-regional differences, followed by intra-regional differences and hypervariable density.
Based on the above findings, this paper puts forward the following policy recommendations. 1) Continue to expand the depth and breadth of digital technology applications, further enhance the scale of the digital economy, and make the digital economy a sustainable driver of economic growth. Strengthen ecological environmental protection and restoration efforts, set strict environmental standards, actively eliminate backward production capacity, and improve energy and resource utilization efficiency to enhance the ecological environment. 2) Improve the level of digital economy and improve the level of ecological environment in a parallel manner. While developing the economy, it should consider its impact on the ecological environment, avoid the phenomenon of pollution before treatment, and promote the coordinated, integrated, and sustainable development of ecological environment and digital economy. 3) The government should pay attention to the fairness of coordinated development among regions to avoid the undesirable phenomenon of polarization. Strengthen communication and learning efforts between high-level regions and low-level regions, and promote the inter-regional flow of digital technology and ecological environment governance technology. 4) There are certain differences among regions and provinces in terms of resource endowment and development status, and their heterogeneity should be fully taken into account when understanding the status of coordinated development, as well as when setting development targets. Criteria should be set strictly for the eastern region to avoid a fallback in the level of coordinated development. The standards for the provinces in the central and western regions should be appropriately lowered, and on the basis of stabilizing the status then steadily seeking progress. Efforts should be made to improve the level of digital economy and ecological environment to achieve coordinated and sustainable development.
Given the availability of data, the research period of this paper is relatively short, and the development status of developing countries may be different from that of developed countries. Subsequent studies can be further expanded in terms of study period as well as study area to enrich the relevant studies.
Data availability statement
The raw data supporting the conclusion of this article will be made available by the authors, without undue reservation.
Author contributions
Conceptualization, BL, ZY, and ZZ; methodology, CS, JC, and LF; software, BL, JC, and LF; writing—review and editing, LF and BL.
Funding
This research was funded by the National Natural Science Foundation of China (12126333, 11301245, 11871141); National Social Science Foundation of China (20BTJ056, 21BTJ043).
Conflict of interest
The authors declare that the research was conducted in the absence of any commercial or financial relationships that could be construed as a potential conflict of interest.
Publisher’s note
All claims expressed in this article are solely those of the authors and do not necessarily represent those of their affiliated organizations, or those of the publisher, the editors and the reviewers. Any product that may be evaluated in this article, or claim that may be made by its manufacturer, is not guaranteed or endorsed by the publisher.
References
Brunsdon, C. (1995). Estimating probability surfaces for geographical point data: An adaptive kernel algorithm. Comput. Geosciences 21 (7), 877–894. doi:10.1016/0098-3004(95)00020-9
Bukht, R., and Heeks, R. (2018). Defining, conceptualising and measuring the digital economy. Iorj 13 (2), 143–172. doi:10.2139/ssrn.343173210.17323/1996-7845-2018-02-07
Chun, H., Kim, J.-W., and Lee, J. (2015). How does information technology improve aggregate productivity? A new channel of productivity dispersion and reallocation. Res. Policy 44 (5), 999–1016. doi:10.1016/j.respol.2014.11.007
Dagum, C. (1997). A new approach to the decomposition of the Gini income inequality ratio. Empir. Econ. 22 (4), 515–531. doi:10.1007/BF01205777
Dijkema, G., and Basson, L. (2009). Complexity and industrial ecology. J. Industrial Ecol. 13 (2), 157–164. doi:10.1111/j.1530-9290.2009.00124.x
Ding, D., Zhang, Z., Chen, C., Wang, W., and Nie, N. (2019). The environmental Kuznets curve for PM2.5 pollution in beijing-Tianjin-hebei region of China: A spatial panel data approach. J. Clean. Prod. 220, 984–994. doi:10.1016/j.jclepro.2019.02.229
Elahi, E., Khalid, Z., and Zhang, Z. (2022). Understanding farmers' intention and willingness to install renewable energy technology: A solution to reduce the environmental emissions of agriculture. Appl. Energy 309, 118459. doi:10.1016/j.apenergy.2021.118459
Fan, Y., Fang, C., and Zhang, Q. (2019). Coupling coordinated development between social economy and ecological environment in Chinese provincial capital cities-assessment and policy implications. J. Clean. Prod. 229, 289–298. doi:10.1016/j.jclepro.2019.05.027
Fang, C., Liu, H., and Li, G. (2016). International progress and evaluation on interactive coupling effects between urbanization and the eco-environment. J. Geogr. Sci. 26 (8), 1081–1116. doi:10.1007/s11442-016-1317-9
Granell, C., Havlik, D., Schade, S., Sabeur, Z., Delaney, C., Pielorz, J., et al. (2016). Future Internet technologies for environmental applications. Environ. Model. Softw. 78, 1–15. doi:10.1016/j.envsoft.2015.12.015
Grossman, G. M., and Krueger, A. B. (1992). Environmental impacts of a north American free trade agreement. CEPR Discuss. Pap. 8 (2), 223–250.
Guan, G., Gao, G., Su, S., Li, L., and Hokao, H. (2011). Modeling and dynamic assessment of urban economy-resource-environment system with a coupled system dynamics - geographic information system model. Ecol. Indic. 11 (5), 1333–1344. doi:10.1016/j.ecolind.2011.02.007
He, C. (2012). Analysis on coordination between urbanization and environment of human settlement in urnmqi. Anhui Agric. Sci. Bull. 18 (09), 125–128+148.
He, H., and Lin, L. (2019). Investigating environmental Kuznets curve from an energy intensity perspective: Empirical evidence from China. J. Clean. Prod. 234, 1013–1022. doi:10.1016/j.jclepro.2019.06.121
Ji, J., Wang, S., Zhou, Y., Liu, W., and Wang, L. (2021). Spatiotemporal change and coordinated development analysis of "Population-Society-Economy-Resource-Ecology-Environment" in the jing-jin-ji urban agglomeration from 2000 to 2015. Sustainability 13 (7), 4075. doi:10.3390/su13074075
Kling, R., and Lamb, R. (1999). IT and organizational change in digital economies. SIGCAS Comput. Soc. 29 (3), 17–25. doi:10.1145/572183.572189
Kunkel, S., and Matthess, M. (2020). Digital transformation and environmental sustainability in industry: Putting expectations in Asian and African policies into perspective. Environ. Sci. Policy 112, 318–329. doi:10.1016/j.envsci.2020.06.022
Lei, D., Weituo, Z., Yalin, H., Shenggao, C., and Chao, L. (2015). Research on the coupling coordination relationship between urbanization and the air environment: A case study of the area of wuhan. Atmosphere 6 (10), 1539–1558. doi:10.3390/atmos6101539
Li, J., Wu, Y., and Xiao, J. J. (2020). The impact of digital finance on household consumption: Evidence from China. Econ. Model. 86, 317–326. doi:10.1016/j.econmod.2019.09.027
Li, W., and Yi, P. (2020). Assessment of city sustainability-Coupling coordinated development among economy, society and environment. J. Clean. Prod. 256, 120453. doi:10.1016/j.jclepro.2020.120453
Li, Y., Yang, X., Ran, Q., Wu, H., Irfan, M., and Ahmad, M. (2021a). Energy structure, digital economy, and carbon emissions: Evidence from China. Environ. Sci. Pollut. Res. 28 (45), 64606–64629. doi:10.1007/s11356-021-15304-4
Li, Z., Li, N., and Wen, H. (2021b). Digital economy and environmental quality: Evidence from 217 cities in China. Sustainability 13 (14), 8058–8120. doi:10.3390/su13148058
Li, Z., and Liu, Y. (2021). Research on the spatial distribution pattern and influencing factors of digital economy development in China. IEEE Access 9, 63094–63106. doi:10.1109/access.2021.3075249
Liu, Z. (2011). Systematic dynamics analysis of coal city coordination development. Energy Procedia 5 (1), 2486–2493. doi:10.1016/j.egypro.2011.03.427
Lu, M., and Guo, Y. (2017). Coordinated development of rural resource environment and economy. Agro Food Ind. Hi Tech. 28 (1), 3393–3397.
Melville, N. P. (2010). Information systems innovation for environmental sustainability. MIS Q. 34 (1), 1–21. doi:10.2307/20721412
Miao, Z. (2021). Digital economy value chain: Concept, model structure, and mechanism. Appl. Econ. 53 (37), 4342–4357. doi:10.1080/00036846.2021.1899121
Moulton, B. R. (1999). GDP and the digital economy: Keeping up with the changes. understanding the digital economy data. Cambridge: MIT Press.
Park, Y., Meng, F., and Baloch, M. A. (2018). The effect of ICT, financial development, growth, and trade openness on CO2 emissions: An empirical analysis. Environ. Sci. Pollut. Res. 25 (30), 30708–30719. doi:10.1007/s11356-018-3108-6
Qingguo, M. U., and Yang, Y. (2010). Discussion on coordinated development of economy and energy resources. Int. Conf. Technol. innovation industry Dev. 769, 94–98. doi:10.1088/1755-1315/769/2/022027
Ren, S., Hao, Y., and Wu, H. (2022). How does green investment affect environmental pollution? Evidence from China. Environ. Resour. Econ. 81, 25–51. doi:10.1007/s10640-021-00615-4
Ren, S., Hao, Y., Xu, L., Wu, H., and Ba, N. (2021). Digitalization and energy: How does internet development affect China's energy consumption? Energy Econ. 98, 105220. doi:10.1016/j.eneco.2021.105220
Shi, X. (2010). Selection of bandwidth type and adjustment side in kernel density estimation over inhomogeneous backgrounds. Int. J. Geogr. Inf. Sci. 24 (5), 643–660. doi:10.1080/13658810902950625
Silverman, B. W. (1986). Density estimation for statistics and data analysis (1st ed.). New York: Routledge. doi:10.1201/9781315140919
Tapscott, D., (1996). The digital economy: Promise and peril in the age of networked intelligence. Choice Rev. Online 33, 33–5199. doi:10.5860/choice.33-5199
Wang, S. J., Ma, H., and Zhao, Y. B. (2014). Exploring the relationship between urbanization and the eco-environment-A case study of Beijing-Tianjin-Hebei region. Ecol. Indic. 45, 171–183. doi:10.1016/j.ecolind.2014.04.006
Wang, Y., and Xiang, P. (2018). Urban sprawl sustainability of mountainous cities in the context of climate change adaptability using a coupled coordination model: A case study of chongqing, China. Sustainability 11, 20. doi:10.3390/su11010020
Wen, H., Lee, C.-C., and Song, Z. (2021). Digitalization and environment: How does ICT affect enterprise environmental performance? Environ. Sci. Pollut. Res. 28 (39), 54826–54841. doi:10.1007/s11356-021-14474-5
Wu, H., Xue, Y., Hao, Y., and Ren, S. (2021). How does internet development affect energy-saving and emission reduction? Evidence from China. Energy Econ. 103, 105577. doi:10.1016/j.eneco.2021.105577
Yang, X., Wang, J., Cao, J., Ren, S., Ran, Q., and Wu, H. (2021a). The spatial spillover effect of urban sprawl and fiscal decentralization on air pollution: Evidence from 269 cities in China. Empir. Econ. 63, 847–875. doi:10.1007/s00181-021-02151-y
Yang, Y., Fang, S., Wu, H., Du, J., Tu, H., and He, W. (2021b). Spatiotemporal trends and driving factors of urban livability in the yangtze River Delta agglomeration. Sustainability 13 (23), 13152. doi:10.3390/su132313152
Yuan, Y., Jin, M., Ren, J., Hu, M., and Ren, P. (2014). The dynamic coordinated development of a regional environment-Tourism-economy system: A case study from western hunan province, China. Sustainability 6 (8), 5231–5251. doi:10.3390/su6085231
Zhang, D., Wu, L., Huang, S., Zhang, Z., Ahmad, F., Zhang, G., et al. (2021). Ecology and environment of the belt and road under global climate change: A systematic review of spatial patterns, cost efficiency, and ecological footprints. Ecol. Indic. 131, 108237. doi:10.1016/j.ecolind.2021.108237
Zhang, H., Cheng, J., Chen, J., and Ni, L. (2014). Difference analysis on the ecological civilization construction of China's provinces. China Population,Resources Environ. 24 (06), 22–29. doi:10.3969/j.issn.1002-2104.2014.06.004
Zhang, L., and Xing, Z. (2021). Distribution dynamics, regional differences and convergence of digital inclusive finance development in rural China. J. Quantitative Tech. Econ. 38 (03), 23–42. doi:10.13653/j.cnki.jqte.20210201.001
Zhang, W., and Wang, Y. (2021). Regional differences, dynamic evolution and structural decomposition of China's welfare from the perspective of feasible capability. J. Quantitative Tech. Econ. 38 (12), 45–66. doi:10.13653/j.cnki.jqte.2021.12.004
Zhao, J., and Jin, Z. (2018). Predict coordinated development degree of county eco-environment system using GA-SVM. J. Glob. Inf. Manag. 26 (3), 1–10. doi:10.4018/JGIM.2018070101
Zhou, X., Zhou, D., Wang, Q., and Su, B. (2019). How information and communication technology drives carbon emissions: A sector-level analysis for China. Energy Econ. 81, 380–392. doi:10.1016/j.eneco.2019.04.014
Zhu, G., and Tong, G. (2009). Study on the evaluation and stage arrangements of rural-urban coordinated development. Int. Conf. Manag. Sci. Eng., 2150–2157. doi:10.1109/ICMSE.2009.5317665
Keywords: digital economy, ecological environment, coupling coordinated development, Kernel density, Dagum Gini decomposition, sustainable development
Citation: Fu L, Liu B, Zhu Z, Cao J, Sun C and Yu Z (2022) Analysis of the coupling coordinated development and evolutionary trend of digital economy and ecological environment. Front. Environ. Sci. 10:1006354. doi: 10.3389/fenvs.2022.1006354
Received: 29 July 2022; Accepted: 12 September 2022;
Published: 29 September 2022.
Edited by:
Usama Awan, Lappeenranta University of Technology, FinlandReviewed by:
Ehsan Elahi, Shandong University of Technology, ChinaRu-Yu Xu, Ocean University of China, China
Copyright © 2022 Fu, Liu, Zhu, Cao, Sun and Yu. This is an open-access article distributed under the terms of the Creative Commons Attribution License (CC BY). The use, distribution or reproduction in other forums is permitted, provided the original author(s) and the copyright owner(s) are credited and that the original publication in this journal is cited, in accordance with accepted academic practice. No use, distribution or reproduction is permitted which does not comply with these terms.
*Correspondence: Bo Liu, liubolnu@126.com; Congting Sun, congtingsun@lnu.edu.cn
†These authors have contributed equally to this work and share first authorship