SustainGraph: A knowledge graph for tracking the progress and the interlinking among the sustainable development goals’ targets
 Eleni Fotopoulou1
  Ioanna Mandilara1
  Anastasios Zafeiropoulos1*
  Chrysi Laspidou2
  Giannis Adamos2
  Phoebe Koundouri3,4,5,6
  Symeon Papavassiliou1
- 1Institute of Communication and Computer Systems, National Technical University of Athens, Athens, Greece
- 2Department of Civil Engineering, University of Thessaly, Volos, Greece
- 3School of Economics and ReSEES, Athens University of Economics and Business, Athens, Greece
- 4Department of Technology Management and Economics, Denmark Technical University, Copenhagen, Denmark
- 5Sustainable Development Unit and EIT Climate-KIC, Athena Research and Innovation Centre, Marousi, Greece
- 6UN SDSN Europe, Paris, France
The development of solutions to manage or mitigate climate change impacts is very challenging, given the complexity and dynamicity of the socio-environmental and socio-ecological systems that have to be modeled and analyzed, and the need to include qualitative variables that are not easily quantifiable. The existence of qualitative, interoperable and well-interlinked data is considered a requirement rather than a desire in order to support this objective, since scientists from different disciplines will have no option but to collaborate and co-design solutions, overcoming barriers related to the semantic misalignment of the plethora of available data, the existence of multiple data silos that cannot be easily and jointly processed, and the lack of data quality in many of the produced datasets. In the current work, we present the SustainGraph, as a Knowledge Graph that is developed to track information related to the progress towards the achievement of targets defined in the United Nations Sustainable Development Goals (SDGs) at national and regional levels. The SustainGraph aims to act as a unified source of knowledge around information related to the SDGs, by taking advantage of the power provided by the development of graph databases and the exploitation of Machine Learning (ML) techniques for data population, knowledge production and analysis. The main concepts represented in the SustainGraph are detailed, while indicative usage scenarios are provided. A set of opportunities to take advantage of the SustainGraph and open research areas are identified and presented.
Introduction
The development of effective climate change mitigation and adaptation solutions is one of the most crucial challenges that we face towards the transition to a sustainable and carbon-neutral economy. To address this challenge and adopt sustainable development paths, various policies and associated targets have been specified at international and national levels (e.g., Paris Agreement (Horowitz, 2016), 2030 Agenda for Sustainable Development (Lee et al., 2016) detailing 17 Sustainable Development Goals (SDGs) and their associated 169 targets).
Following the specification of a wide set of policies, relevant monitoring frameworks have been designed and become operational to keep track of their implementation and assessment. A wealth of data is made available (e.g., UN SDG repository (UN Statistics, 2022), EU SDG and Green Deal targets tracking (Koundouri et al., 2021), Nationally Determined Contributions monitoring (United Nations Climate Action, 2022)), centered mainly around the need to monitor and track the values of indicators to assess the progress made towards the achievement of the SDG targets at national and regional levels. Given that these data are collected by various organizations worldwide, semantic consistency and data interoperability among them cannot be considered as granted. Furthermore, such data are made available in many cases as data silos, while specialized software or Application Programming Interfaces (APIs) may be required for getting access to them. Lack of data quality is also a barrier, since data processing (e.g., removal of outliers, tackling of diverse assumptions during data production, use of different semantics for data description) is required in most cases to manage the transformation of data to formats and structure that can be considered homogeneous. Thus, the proper management of the wealth of collected information is not straightforward. There is a need for information models and information management techniques able to capture the volatility of the data, manage semantic misalignment of the denoted concepts, and facilitate the identification of hidden patterns and relationships among them. In this way, a solid, open and interoperable data infrastructure can be made available, enabling the development of innovative solutions to produce systemic changes and make economies socially, economically and environmentally sustainable.
Under this perspective, we present the SustainGraph as a Knowledge Graph (KG) that has been conceptualized and developed to track the progress towards the SDG targets, the evolution of the defined indicators across time and their inter-connectedness with policies and targets defined at European Union (EU) and at national levels. KGs are based on the principle of applying a graph-based abstraction to data. The usage of graphs to represent data is accompanied with some way to explicitly represent knowledge, based on the usage of semantics. Data are coming from diverse sources and domains, where alignment and semantic consistency of terms and concepts may be required across scientific disciplines (Hogan et al., 2021). KGs can operate without a strict definition of a schema, allowing the data–and its scope–to evolve in a more flexible manner than typically possible in a relational setting. This characteristic makes KGs suitable for managing information that is provided within a complex socio-environmental system. Tracking of relationships among the detailed concepts can take place, considering their temporal evolution (e.g., dynamicity in the relationships across time in a complex system) (Hogan et al., 2021).
A systemic nexus approach has been considered for supporting the data population processes of the KG, while taking advantage of participatory system mapping processes (Matti et al., 2020; Midgley and Lindhult, 2021). By the term systemic nexus, we refer to the interconnection of resource management concepts, considering resources such as energy, water, food, land and climate. In the context of the SDGs, a nexus approach can facilitate the advancement of multiple SDGs simultaneously, while reducing the risk that contributions to one SDG undermine progress on another (van Zanten and van Tulder, 2021). To take advantage of the wealth of available data, openness and interoperability of the SustainGraph with existing databases and Application Programming Interfaces (APIs) is promoted to automate -as much as possible-the supported data population processes. Over the SustainGraph, socio-environmental and socio-ecological systems participatory modeling and analysis processes can take place, aligned with the main mechanics of a Systems Innovation Approach (Matti et al., 2020; Midgley and Lindhult, 2021). Specifically, the effective fusion of the collected data and their transformation to systematized nexus-coherent knowledge, can lead to novel insights (Laspidou et al., 2020), significant improvement of the participatory processes (Matti et al., 2020) and the development of collective environmental intelligence (Zafeiropoulos et al., 2021) among the engaged stakeholders and communities.
In short, it can be claimed that the main contribution of this work is twofold. On one hand, we provide the conceptualization and semantic description of the SustainGraph that, as far as we know, is the first KG that considers in a holistic way the tracking of the progress towards the SDG targets and the evolution of indicators at national and regional levels, along with their relationship with specified policies and the implementation of case studies across Europe. This conceptualization is considered as the basis for the systemic representation of knowledge related to the SDGs, enabling the collection and homogeneous representation of data along with their semantics and overcoming the aforementioned data management barriers. On the second hand, by considering the mechanisms specified in a Systems Innovation Approach (Matti et al., 2020; Midgley and Lindhult, 2021), we detail the implementation of the SustainGraph and the set of data population mechanisms from a plethora of open data sources and data providers. Data population to the KG and data analysis over the KG are assisted through the exploitation of Machine Learning (ML) techniques. In this way, participatory modeling and analysis processes can be designed and implemented, taking advantage of the semantic alignment of the represented terms and the knowledge produced through the analysis of the information that is made available in the SustainGraph.
Background information
Climate change related policies
In this section we provide a short overview of the existing policies for addressing and mitigating the climate change impacts. We focus on highlighting the existence of multiple policy frameworks and initiatives worldwide and the need to keep track of their relationships with the targets and indicators defined in the SDGs. To properly represent these policies within a knowledge repository, we are considering the specifications provided by each framework, the applied temporal resolution and their applicability area (worldwide, national, regional level).
As shortly stated in Climate change related policies, the Paris Agreement regards an international treaty on climate change that has been adopted by 196 parties and put into force since 2016 (Horowitz, 2016). To implement the Paris Agreement, participating countries are preparing their plans to reduce greenhouse gas emissions, as reported in climate action documents, called as nationally determined contributions (NDCs). In each NDC, a set of targets is posed for mitigating GHG emissions and adapting to climate change (United Nations Climate Action, 2022; den Elzen et al., 2019). In parallel, within the 2030 Agenda for Sustainable Development, the United Nations have specified the 17 Sustainable Development Goals (SDGs) that have to be achieved (Lee et al., 2016). The 17 SDGs are monitored based on the specification of 169 targets along with indicators to measure progress toward each target. Each goal has 8 to 12 targets, while each target can be assessed based on one to four indicators. The SDGs integrate the three dimensions of sustainable development (economic, environmental and social) and are highly related with the tracking of indicators related to the impact of climate change (Morton et al., 2019).
At European Union (EU) level, various policies are specified that are related to the achievement of the SDG targets, in accordance with the 2030 Agenda for Sustainable Development (European Commission, 2016; Sachs et al., 2021). For instance, the policy areas defined in the European Green Deal and documented in terms of goals in the European Climate Law -for the implementation of actions in accordance to the Paris Agreement aiming at a carbon-neutral Europe by 2050- are also related to specific SDG indicators. The relationship between the European Union’s policies established since 2020 in support of the implementation of the European Green Deal and the SDGs is also tracked in (Koundouri et al., 2021; Koundouri et al., 2022). EU looks at the aspects of the SDGs that are relevant from an EU perspective and therefore does not aim at exhaustively assessing the progress towards the 169 targets of the 2030 Agenda (Eurostat, 2022). To track the progress of the SDG indicators in EU countries, Eurostat is tracking 101 indicators (31 of which are multipurpose, i.e., are used to monitor more than one SDG). EU policy targets are considered for assessing indicator trends (Eurostat, 2022). It should be noted that the EU SDG indicator set is open to annual reviews, aiming at the alignment of the proposed targets with the priorities set by the European Commission and the consideration of indicators coming from new or updated data sources (Malagó et al., 2021). Country-specific directives for promoting sustainable development are also provided at the Country Specific Recommendations (CSRs) for EU countries. Such recommendations come into play in the specification of targets that have to be achieved per country and the formulation or adaptation of national-level sustainable development policies (Rainone, 2020). The EU taxonomy has also been developed as a classification system for environmentally sustainable economic activities (Dusík and Bond, 2022). The objective is to promote sustainable investments across Europe with substantial contribution to climate change mitigation and the implementation of the European Green Deal. It has defined six environmental objectives, namely climate change mitigation; climate change adaptation; protection of water and marine resources; transition to a circular economy; pollution control; and protection of ecosystems.
To promote a joint understanding of the classification of the set of deep transformations required in each country to achieve the SDGs, six SDG transformations are introduced as modular building-blocks of the SDG achievement (Sachs et al., 2019; Sachs et al., 2021). These regard Education, Gender, and Inequality; Health, Well-being, and Demography; Energy Decolonization and Sustainable Industry; Sustainable Food, Land, Water, and Oceans; Sustainable Cities and Communities; and Digital Revolution for Sustainable Development (Sachs et al., 2019). Each transformation is associated with specific SDGs, while targeted to suggested interventions with planned outputs.
Finally, it should be noted that various initiatives are also active on the specification of Key Performance Indicators (KPIs) for smart sustainable cities, such as the study realized by the United for Smart Sustainable Cities (U4SSC) initiative. The objective is to provide consistent and standardized methodology for cities to measure performance and progress towards the achievement of the SDGs taking advance of digital technologies (U4SSC, 2021). An overview of the relationships between the aforementioned policies and initiatives is provided in Figure 1.
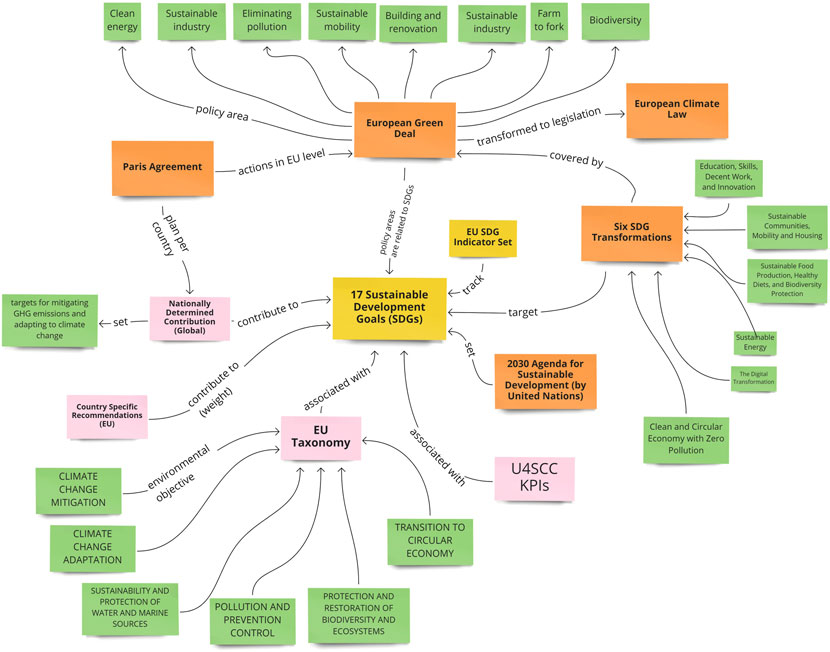
FIGURE 1. High level view of climate change related policies and initiatives.
Knowledge management based on a systems innovation approach
Systems innovation refers to the development of novel participatory technological solutions and breakthroughs that can lead to major transformation in national and regional economies (De Vicente Lopez and Matti, 2016). The formulation of a system is a basic concept in the systems innovation approach, where a system is formed by several elements and their relationships that can be dynamic across time. The variability of a system can be attributed to changes in internal or external parameters and the influence posed to the individual elements (Matti et al., 2020). Knowledge management is a fundamental part of the systems innovation approach, since a collective understanding of the system is crucial to develop transformative solutions.
The adoption of a systems innovation approach can be considered as an enabler for the participatory formulation and development of a KG. On the other hand, the usage of a KG can be considered as an enabler for supporting knowledge management processes within a team working based on a systems innovation approach. The overall information flow in a systems innovation approach is covering the various parts of the DIKW (Data, Information, Knowledge, Wisdom) pyramid (Rowley, 2007) (see Figure 2). The first part of the flow (Data and Information parts in the pyramid) is associated with the population of the data in the KG. Through participatory processes, data collection and/or generation is taking place, considering data coming from various stakeholders. Such data can be introduced -upon processing-to the KG and populate it, creating a unique point of information management. By considering the interlinking between the denoted concepts based on the provided information, knowledge is produced.
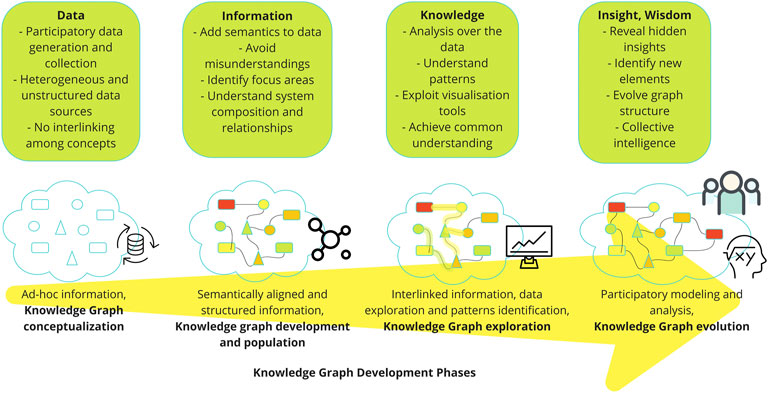
FIGURE 2. Knowledge Graph Development Phases aligned with a Systems Innovation Approach.
The second part of the flow (Knowledge and Wisdom parts in the pyramid) regards the extraction of data from the KG to support participatory modeling processes. By getting access to semantically aligned and interlinked data, a participatory modeling process can be facilitated. Interdisciplinary scientists can collaborate more easily and co-create their models, given the alignment of terms coming from different scientific domains. Such modeling processes can be based on the adoption of modeling tools, such as System Dynamics Modeling, to better understand complex systems and lead to the creation of new knowledge by revealing feedback loops as well as interlinkages and cascading effects that propagate through the system (Laspidou et al., 2020). Resource nexus systems have such complexity and systemic approaches that incorporate biophysical, socio-economic and policy layers, which can promote knowledge elicitation and production (Laspidou et al., 2019; Papadopoulou et al., 2022; Ramos et al., 2022). Resilience can be assessed successfully only through such systemic analyses (Ioannou and Laspidou, 2022). Along these lines, a KG can support the provision of input data to such models and supplement the produced intelligence through the identification of hidden relationships and/or patterns. Through the exchange and adaptation of existing information, practice-based knowledge can be co-created and applied in new contexts (Matti et al., 2020).
It should be noted that, nowadays, there are limited methods for modeling systemic changes, where there is also lack of knowledge for the processes that lead to systemic shifts in social systems (Elsawah et al., 2020). By capturing systemic changes of socio-environmental systems in the KG, such a challenge can be tackled. By getting access to visualization and analysis results, data interpretation becomes simpler while opportunities for innovation can be identified. For instance, social network analysis and network maps can be used to analyze the system dynamics and the role of each stakeholder within a case study.
Knowledge graphs for information management
Knowledge Graphs (KGs) are emerging, since they are considered suitable to manage challenges that have arisen in modern data practices. The main challenge has to do with the existence of silos of data or dedicated software and Application Programming Interfaces (APIs) for managing such data (Sequeda and Lassila, 2021). Industry-specific data representation schemas are defined and adopted that -in many cases-may differ, even for the management of the same types of data. In parallel, dedicated software and APIs are being developed for data management in specific sectors, where the data semantics are hidden from the end users and are tackled by the internal software components. This make the software usable only for the purpose that has been initially designed and hinders its adoption, re-usability and interoperability with other data management tools (Sequeda and Lassila, 2021).
KGs are considered suitable for bridging data silos, by interlinking the concepts represented in the graphs with well-defined semantics (see Figure 3). In this way, the interconnected datasets in the KG can be enriched with meaning, misalignment of terminologies of the same concepts under different data schemas can be tackled, while relationships among concepts can be made explicit. Thus, the main motivation for the development of a KG is the usage of graphs to represent data -that can be interconnected and enriched with meaning-to explicitly represent knowledge (Noy et al., 2019; Hogan et al., 2021). Data volatility is managed, since relationships among nodes in a KG can be dynamic, making them suitable for representation of complex and dynamic systems (e.g., socio-environmental systems (Zafeiropoulos et al., 2021)). Keeping a high standard of data quality in a KG is challenging and is related mostly with the data quality of the input data. Quality management processes have to be applied to identify data quality issues (e.g., data inconsistency, data redundancy, missing values) and proceed to improvements (e.g., outliers removal) (Xue and Zou, 2022). By developing and maintaining a KG, data re-usability, extensibility and interoperability can be considered as granted, relaxing a lot the constraints posed to data scientists in existing data management practices.
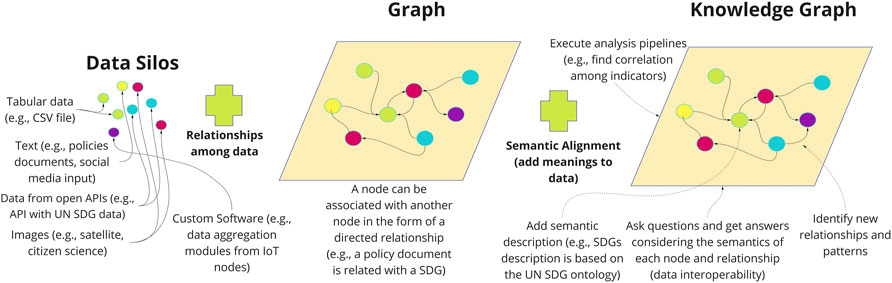
FIGURE 3. Information Management from data silos to a Knowledge Graph.
Moving one step further, KGs facilitate reasoning over the available data and support analysis and complex decision-making (see Figure 3). Reasoning over KGs is required to obtain new knowledge, extract insights and conclusions from existing data (Chen X. et al., 2020). Through reasoning, KG completion and evolution can be supported via the identification and prediction of new relationships among entities (Chen Z. et al., 2020; Issa et al., 2021). As already mentioned, KGs can also act as an enabler for participatory analysis of dynamic and complex systems by interdisciplinary scientists. A data scientist is able to take advantage of the interlinked data in the KG to identify transformative patterns and extract new knowledge and insights. The existence of semantically aware and up-to-date data within a graph database enables the co-design of data management and analysis processes that can be integrated within dynamic modeling systems.
The role of Artificial Intelligence (AI) is highlighted since Machine Learning (ML) pipelines can be developed for supporting both data population and data analysis in the KG. The existence of a KG can act as a catalyst for the incorporation of a set of ML processes over a unified knowledge repository. The exploitation of ML techniques has to be carefully considered, taking into account a study that details the implications that AI may have on the delivery of all 17 SDG goals and the associated 169 targets (Vinuesa et al., 2020). It is stated that AI can act as an enabler for 134 targets, while it may also introduce negative impact on 59 targets (Vinuesa et al., 2020). With regards to the negative impact of AI, this is mostly related with the existence of biases in the data, the need for examination of the long-term impact of the applied algorithms in terms of equity and fairness due to bias introduced in the training data (e.g., non proper representation of groups based on culture, gender, ethnicity) and the unequal distribution of educational and computing resources throughout the world. To -at least partially-tackle these aspects, emerging technologies applied over KGs can be considered. For instance, the areas of explainable and responsible AI are emerging that can take advantage of semantic layers of knowledge provided through a KG to suggest explainable and ethically-aligned actions (Hitzler et al., 2020). Explainable AI solutions can increase the transparency and explainability of the recommendations provided by AI algorithms and make them more easily understandable and adoptable by humans. The adoption of open-source and open-access policies can also reduce the barriers for the usage of the produced software by a wide community.
Methods
SustainGraph conceptualization and walkthrough
The SustainGraph is specified and developed in the form of a labeled property graph (LPG) model. In this model, a graph consists of a set of nodes (discrete objects) and relationships. Relationships are directional while both nodes and relationships can have properties to describe their characteristics. The main advantage of the LPG model is that it can achieve high performance in data management functionalities (storage, fast graph traversal, fast querying). Furthermore, the adoption of an LPG model helps to uniquely identify instances of relationships, allowing the representation of repeatable events and of entities that have dynamic properties (Purohit et al., 2021). The latter is very helpful towards the modeling of real environments in dynamic and complex systems.
However, the LPG model does not support a formal language representation that can be used for automated knowledge reasoning. To achieve this, the semantics of the data have to be introduced and managed, as it happens in the case of development of an ontology. To properly detail the semantic information associated with each node and relationship, a SustainGraph ontology has been made available (Mandilara et al., 2022). The ontological description of the main concepts introduced in the SustainGraph can be considered as accompanying information of the structure introduced in the LPG model. By having access to the ontological description, better semantic alignment of terms with emerging ontological specifications can be achieved, while integration of the semantics in the LPG model can be supported in the future (Purohit et al., 2021). Following, we focus on the description of the labeled property graph (LPG) model of the SustainGraph. A high-level view of the SustainGraph structure is provided in Figure 4.
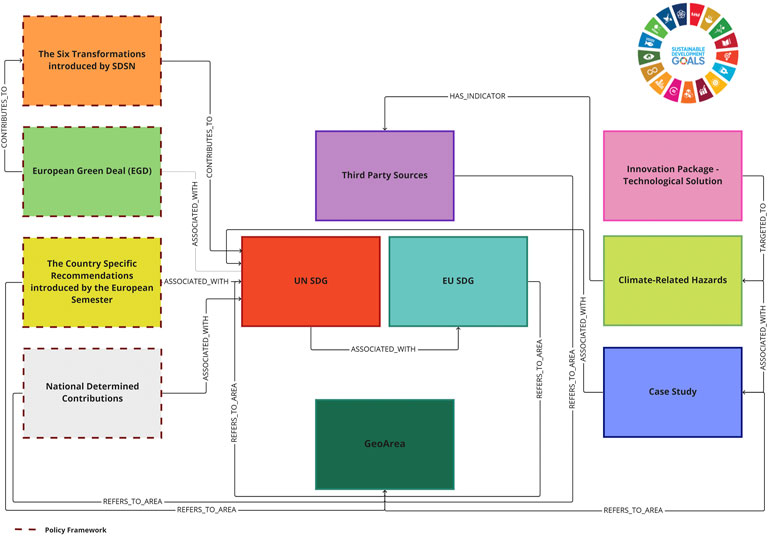
FIGURE 4. High level view of the SustainGraph.
The main set of entities in the SustainGraph has to do with the description of the structure of the UN Sustainable Development Goals (SDGs), building upon an existing formal knowledge organization system for this purpose (Joshi et al., 2021). According to this system, within the SustainGraph, a Sustainable Development Goal has a set of Targets, where each Target is associated with one or more Indicators (UN SDG, 2022). Each Indicator is measured based on Series of data (time series data). Each data Series is accompanied by SeriesMetadata where details for the metric that is measured is provided, while it includes a set of Observations. To support geolocation characteristics, each Observation refers to a specific geographical Area (GeoArea).
The aforementioned UN SDG indicators regard a subset of the indicators that can be represented in the SustainGraph. Further indicators along with the data series that are associated with them can be introduced. Specifically, the aforementioned structure for the representation of the UN SDGs has been generalized to support the measurement of similar indicators in the EU level, as well as indicators provided from third party sources. At the EU level, the EU SDG indicators are provided by Eurostat and can be associated with the UN SDG indicators (EU SDG, 2022). Multi-purpose indicators are defined, where one EU SDG indicator may contribute to more than one goal. Data coming from third party sources are also represented. Such data regard indicators that do not belong to defined UN SDG or EU SDG indicators, but can be required for realizing a socio-environmental analysis (e.g., indicators like the development status in a country, the corruption perception index, environmental metrics, demographics). The objective is to help interdisciplinary scientists to realize analysis over a combined set of data, considering both SDG and third-party indicators. This is mainly applicable in the envisaged analysis within case studies, especially in cases where, in addition to the SDG indicators, further indicators are required to properly feed the developed models for the considered socio-environmental or socio-ecological systems. The Source of the Indicator (e.g., coming from UN SDG, EU SDG or a third-party source) is specified in the homonymous entity.
The SustainGraph emphasizes the capability to declare relationships among Indicators. For instance, this is applicable in the case of EU SDG indicators, where an EU SDG indicator may be similar to, part of or identical to an UN SDG indicator. Similar relationships can be declared among UN or EU SDG indicators and indicators coming from third-party sources. In this way, the relationships among indicators tracked by different monitoring frameworks are represented, enabling data interlinking and interoperability. Furthermore, a relationship is added where each EU SDG Indicator can contribute to a specific Policy Target defined at the EU level. A view of this part of the specification within SustainGraph is depicted in Figure 5.
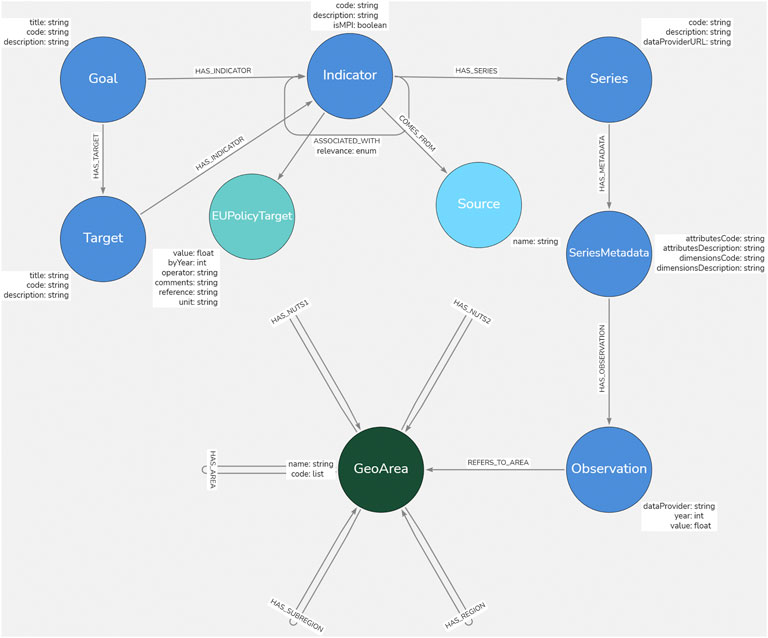
FIGURE 5. Sustainable development goals, targets and indicators in the SustainGraph.
By having conceptualized the way that time series data from various indicators can be represented in the SustainGraph, we moved on with the representation of concepts coming from policy frameworks and directives to adapt policy frameworks. As detailed in Section 2.1, various policies are emerging at global, national and regional levels. Keeping track of the targets posed on policy documents and their status of achievement (or not) across time is important. With the current version of the SustainGraph, focus is given on the representation of concepts coming from the European Green Deal (EGD), the Nationally Determined Contributions (NDCs), the Country Specific Recommendations (CSRs) and the six SDG Transformations proposed as modular building-blocks of the SDG achievement (Sachs et al., 2019; Sachs et al., 2021). For the EGD, the supported entities regard the defined Ambitions of the EGD and their implementation through specific Policy Areas, where each Policy Area can be associated with one or more SDGs. Various EGD Policy Documents are produced to implement the EGD, where each EGD Policy Document can contribute towards the six SDG Transformations detailed at (Sachs et al., 2019).
In the case of the CSRs, the Recommendations issued per country can be associated with one or more SDGs. These Recommendations are usually provided annually, thus it is important to keep track of the focus given on the various SDGs by each CSR across time. Regarding the NDCs, they provide action plans to cut emissions and adapt to climate impacts. An action plan is associated with specific SDG Targets and Indicators and specifies a set of targets that have to be achieved at national level by a specific point of time along with their current status, the main application sectors (e.g., health, water, agriculture, energy efficiency) and the type of the considered climate response (e.g., mitigation, adaptation). With regards to the six SDG Transformations, per Transformation, in the SustainGraph we consider the suggested Interventions that may take place through the associated ministries, as well as the expected Intermediate Output from each transformation. A view of this part of the specification within the SustainGraph is depicted in Figure 6.
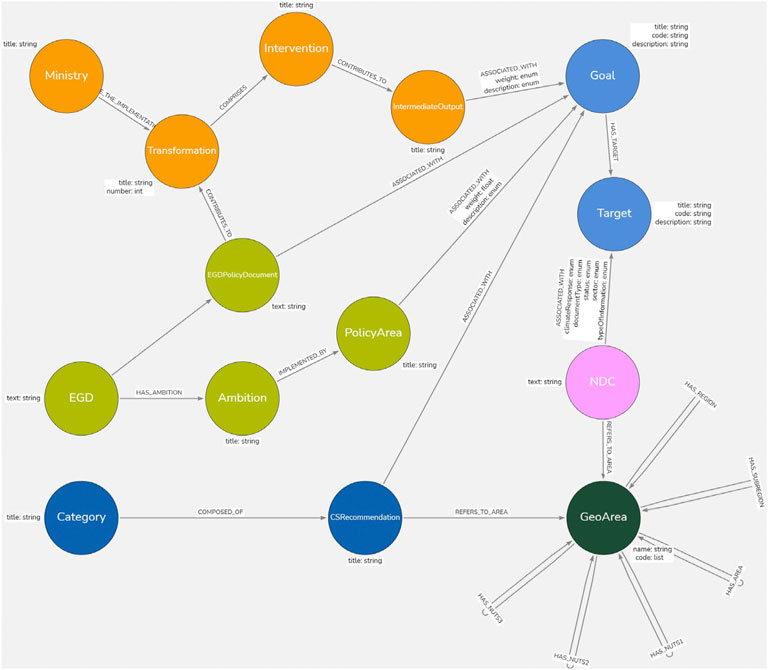
FIGURE 6. Sustainable development policy frameworks in the SustainGraph.
Another important set of entities represented in the SustainGraph is related to the implementation of Case Studies across Europe to develop climate-resilient regions through the adoption of systemic solutions and innovations. These entities regard the Case Studies, the Climate-related Hazards that aim to tackle and the Innovations that can be adopted and applied within each case study. For each Case Study we consider information related to a short description of the main challenges, actions and envisaged impact, the set of Stakeholders involved in the Case Study and the application geographical area (GeoArea). Each Case Study is associated with the SDG Goals, Targets and Indicators, while it also includes information for Indicators defined by third-party data sources. Such information may be provided by monitoring infrastructure provided within the case study (e.g., Internet of Things (IoT) nodes, satellite images, data coming from citizen science platforms) or made available from other initiatives or monitoring frameworks (e.g., happiness index, corruption perception index). For the Climate-related Hazards, we have adopted the classification of hazards provided by the European Environmental Agency for tracking the Europe’s changing climate hazards (Crespi et al., 2020). 32 climate hazard Indicators are made available, organized according to 16 hazard categories, grouped into six main types (heat and cold, wet and dry, wind, snow and ice, coastal, open ocean) (Crespi et al., 2020). The Innovation entity is introduced to represent innovative solutions that are developed to support adaptation and mitigation measures for climate change, based on the description of such innovations in the Climate Innovation Window developed by the BRIGAID project (van Loon-Steensma, 2018). Each Innovation is associated with specific Climate-related Hazards and is applicable to specific application domains. Information related to the owner of the Innovation and its Technology Readiness Level (TRL) (Olechowski et al., 2020) is made available. TRLs are a method for estimating the maturity of technologies. Their values range from 1 to 9, where the first level stands for a system where basic principles are observed, while the ninth level stands for an actual system proven in operational environment. A view of this part of the specification within the SustainGraph is depicted in Figure 7.
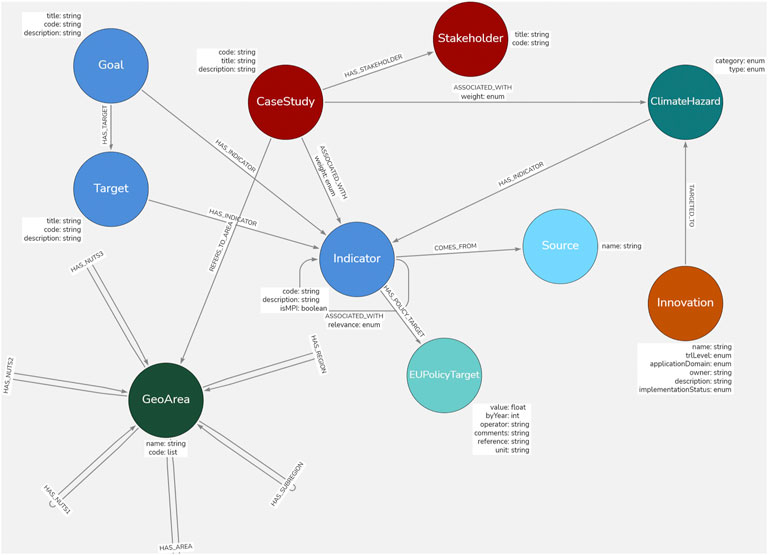
FIGURE 7. Case Studies, Climate related Hazards and Innovations in the SustainGraph.
Finally, attention is given to the proper representation of spatial information in the SustainGraph under the entity GeoArea that refers to a specific geographical area (e.g., continent, country, city, region). Spatial information is applicable to almost all the entities that are conceptualized in the SustainGraph, given the importance to support high spatial resolution of the collected data. To achieve this, we follow a hierarchical way of declaring information related to the location of the various entities. Following the division provided in the M49 standard by the Statistics Division of the United Nations Secretariat, geographic regions are based on continental regions that are further subdivided into sub-regions. Each sub-region can refer to one or more geoAreas, where each geoArea refers to a specific country. Country codes are supported based on both the International Standard ISO 3166–1 for the representation of names of countries and their subdivisions, as well as the M49 standard country or area codes for statistical use by the Statistics Division of the United Nations Secretariat. Furthermore, for EU countries, the Nomenclature of territorial units for statistics (NUTS) classification provided by Eurostat is introduced. Based on the NUTS classification, a geoArea can be divided in smaller areas in NUTS 1, two and three levels. NUTS one level refers to major socio-economic regions, NUTS two level to basic regions for the application of regional policies, and NUTS three level to small regions for specific diagnoses.
SustainGraph data population
Based on the conceptualization of the SustainGraph, a set of data population mechanisms are implemented to support knowledge acquisition processes. Through the data population mechanisms, existing data provided by various sources and different formats can be transformed to knowledge within the SustainGraph. The data population process is a dynamic process, where fresh data is continuously fed into the KG, enriching the available information and enabling further knowledge production and management, as detailed in SustainGraph data population. The main challenge faced here has to do with the development of custom scripts for automating or semi-automating the data ingestion to the KG. By making available such scripts, new releases of the considered datasets can be easily incorporated in the KG, reducing significantly the overhead posed to data scientists for continuously processing the available data to bring them into a homogeneous and interoperable format.
A wide set of data sources is considered. This set includes open data provided by international organizations, statistics authorities and public bodies in the form of tabular datasets (e.g., files in csv format) or through open Application Programming Interfaces (APIs), data coming from the monitoring infrastructure that is implemented within case studies in various regions, and data coming from the processing of policy documents and reports. For the latter, machine learning (ML) techniques are applied to support the knowledge acquisition process. The main considered ML technique is related to Natural Language Processing (NLP) mechanisms that helps understanding the content of the documents and extract information and insights from them. NLP can be used for detecting key words and phrases relevant to the SDGs, quantify overlaps and relationships between texts (Smith et al., 2021). Various NLP methods can be used, including latent semantic analysis for analyzing relationships between a set of documents and the terms they contain (Smith et al., 2021) and multi-label classification of texts using Bidirectional Encoder Representations from Transformers (BERT) (Matsui et al., 2022).
Data quality assurance for the data that is introduced in the SustainGraph is challenging. Each dataset that is coming from an external source is prepared based on a set of assumptions and different processes in terms of data quality management. Even data from the same data provider may be made available following a different structure in different time periods, while the existence of outliers and null values is often noticed. Bias may be also introduced in the provided data, based on the applied data collection and management processes and the representative inclusion (or not) of the associated groups. To improve data quality, a set of data quality assurance mechanisms are under development. Data cleaning mechanisms are applied for improving data quality, while considering bias detection in terms of fairness. Data cleaning may regard -among others-removal of outliers, removal or completion of entries with missing values, and deletion of content that is not considered for inclusion in the KG. Bias detection in the data may regard the non-proper representation of sub-groups within the datasets or the presence of systematic differences between groups, while fairness can be assessed based on the alignment of the data with the FAIR (data that can be easily findable, accessible, interoperable and reusable) principles (Wilkinson et al., 2016). It should be noted that in the SustainGraph version that is presented in this manuscript, data is introduced by well-known and reliable data providers and, thus, simple data cleaning mechanisms are applied (outliers’ removal, missing values management). Data provenance is supported, since the origin of the data is always made available in the properties of the associated Series entity instance in the SustainGraph.
A list of the main data sources used for populating with data the SustainGraph is provided in Table 1. As already mentioned, this list should be considered as indicative, since the list of data sources is continuously evolving given the availability of further data and the emergence of new concepts within the SustainGraph.
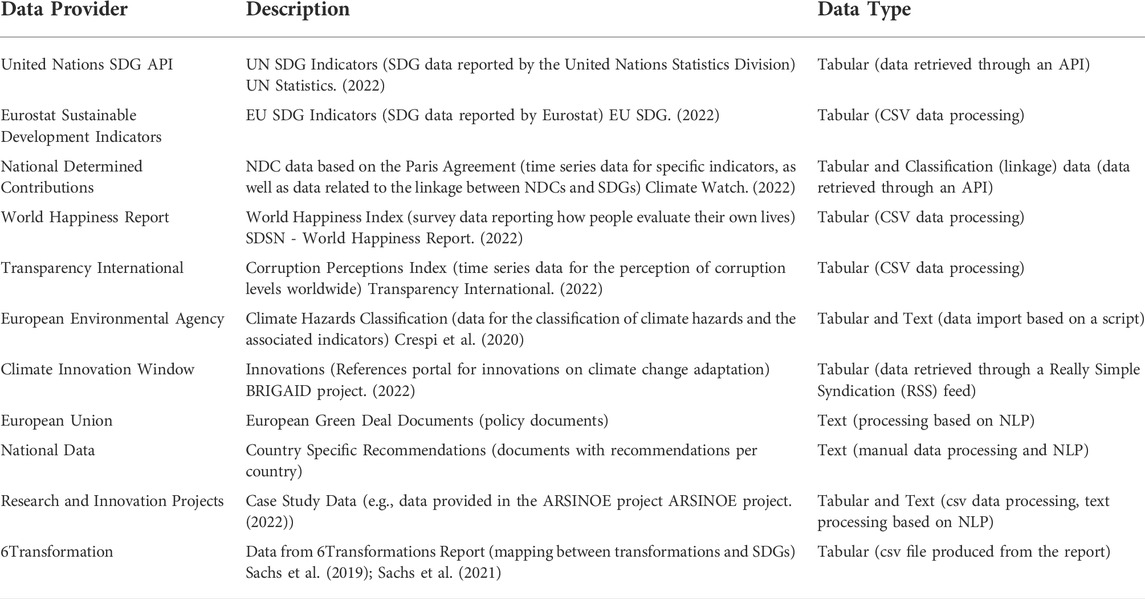
TABLE 1. Indicative Data sources for the SustainGraph data population.
SustainGraph knowledge production, exploration and evolution
By having access to a data-populated version of the SustainGraph, a set of services can be offered upon it. These services include data exploration and visualization, data analysis, participatory modeling and analysis, knowledge production and KG completion. Following, we provide a short description of these services, while usage examples are provided in SustainGraph knowledge production, exploration and evolution.
As already stated, the SustainGraph can be considered as a knowledge repository related to the evolution of the SDG indicators at national and regional levels. Data exploration can take place through the submission of queries by end users. Each query is related with an open question, while the query result may provide an answer. Data exploration can be provided also through web-based navigation in the entities and relationships of the SustainGraph. Various visualizations can be produced for depicting trends in the available data, comparing metrics based on their temporal and/or spatial resolution, and highlighting the weight of the existing relationships in the graph. In this way, end users are able to explore the existing knowledge in the KG, achieve common understanding, get answers to specific questions and easily grasp trends and insights through visualizations.
Moving one step further, through the submission of queries to the SustainGraph, the retrieved data can be fed as input to analysis pipelines. Such analysis pipelines may regard algorithms applied over tabular data or graph algorithms applied over the SustainGraph or a part of the SustainGraph. In the case of tabular data, algorithms such as correlation analysis, regression, descriptive statistics and classification may be applied. Tabular data can be also fed as input to developed participatory socio-environmental systems’ models (e.g., based on agent-based modeling, system dynamics modeling) (Zafeiropoulos et al., 2021). Graph algorithms can be applied to support pattern identification within the KG and to evaluate the structure of the KG (e.g., examine the graph density, identify clusters, community detection). Graph ML techniques can be adopted to support link prediction and to evolve the KG with the introduction of new relationships, similarity analysis based on node embeddings, and classification analysis based on the application of node classification models. The outcomes produced by analysis pipelines can be used for the development of recommendation engines, providing insights for the design of efficient solutions (e.g., to improve the climate resilience of the considered areas within a case study).
It should be noted that the analysis results may be also fed back as information to the KG. In this way, further knowledge may be produced and made available, while results produced by different models can be compared.
Results
Use cases and analysis results
To demonstrate the applicability of the SustainGraph to guide the co-design of innovative solutions for managing the impact of climate change, we detail a set of short and simple use cases. Knowledge exploration for these use cases takes place in the form of providing answers to questions, or through navigation in the information visually depicted in the SustainGraph. Given the conceptualization of the SustainGraph in Use cases and analysis results, the objective is to provide some highlights on its potential usage. The provided examples can be considered as the basis for the development of advanced analysis processes in the future, coupled with the development and validation of socio-environmental or socio-ecological models. Following, we briefly describe these use cases, where we consider simple usage examples for the examination of the relationship among various socio-economic and environmental SDG indicators and the importance given to them in policy documents.
Use case #1: For a specific UN SDG indicator, compare its evolution per country in the last 20 years for countries in the Mediterranean.
In this use case, we examine the evolution of the UN SDG indicator 1.1.1 in a number of the Mediterranean countries. The indicator depicts the proportion of the population living below the international poverty line and is used for evaluation of the progress towards achieving Target 1.1 (by 2030, eradicate extreme poverty for all people everywhere, currently measured as people living on less than $1.25 a day) of the SDG #1. A query is submitted to the SustainGraph to get time series data for this indicator for a set of countries. The produced output is visualized in Figure 8.
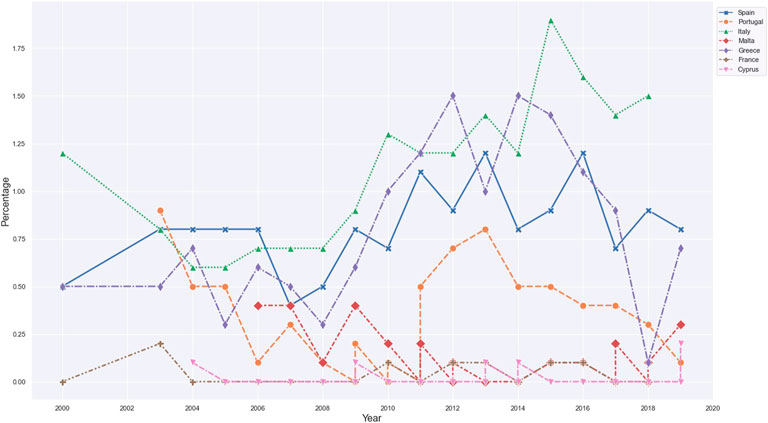
FIGURE 8. Monitoring of an UN SDG indicator across countries in the Mediterranean.
Use case #2: For a specific EU SDG indicator, compare the current status of the indicator across countries in Europe, considering also the EU policy target to be achieved by 2030.
In this use case, we examine the current status of a specific EU SDG indicator, namely sdg_04_70 that tracks the “Share of individuals having at least basic digital skills” across countries in Europe for the year 2021. The status of the indicator is compared to the posed target at the EU level for 2030 that is 80%. Upon getting the relevant data through a query in the SustainGraph, the visualization depicted in Figure 9 is produced. A digital gap is noticed among countries in Europe, since the indicator values range from 24% (e.g., countries in Southeastern Europe) to 81% (e.g., Scandinavian countries).
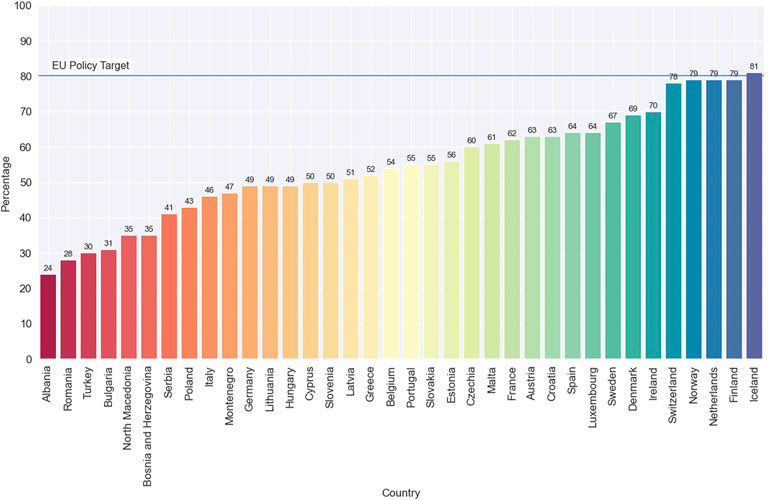
FIGURE 9. Monitoring of an EU SDG indicator across countries in Europe for 2021.
Use case #3: Which SDG targets are mostly considered in the plans for the Nationally Determined Contributions (NDCs)?
In this use case, we consider the G8 countries and we examine the importance posed in their Nationally Determined Contributions (NDCs) towards the achievement of the SDGs. The objective is to get a high level view of the priorities set by these countries, as well as identifying any differences. Through a query in the SustainGraph, the produced visualization is depicted in Figure 10. For the EU countries (Italy, Germany and France) the produced distribution is identical, since the NDCs of these countries are based on the overall direction provided by the EU. The most considered SDGs are SDGs # 7, 12 and 15. SDGs # 7 and 15 seem to be considered in the NDCs of all G8 countries with rates varying from 8–50% for SDG #7 and 13–50% for SDG #15. In the case of Russia, only these two SDGs are considered with rate of 50% each. The most prioritized SDG is SDG #12 (with rate 23%) for Japan, SDG #7 (with rate 31%) for Canada, SDG #12 (with rate 17%) for United Kingdom, and SDGs #2 and 7 (with rate 19% each) for United States of America.
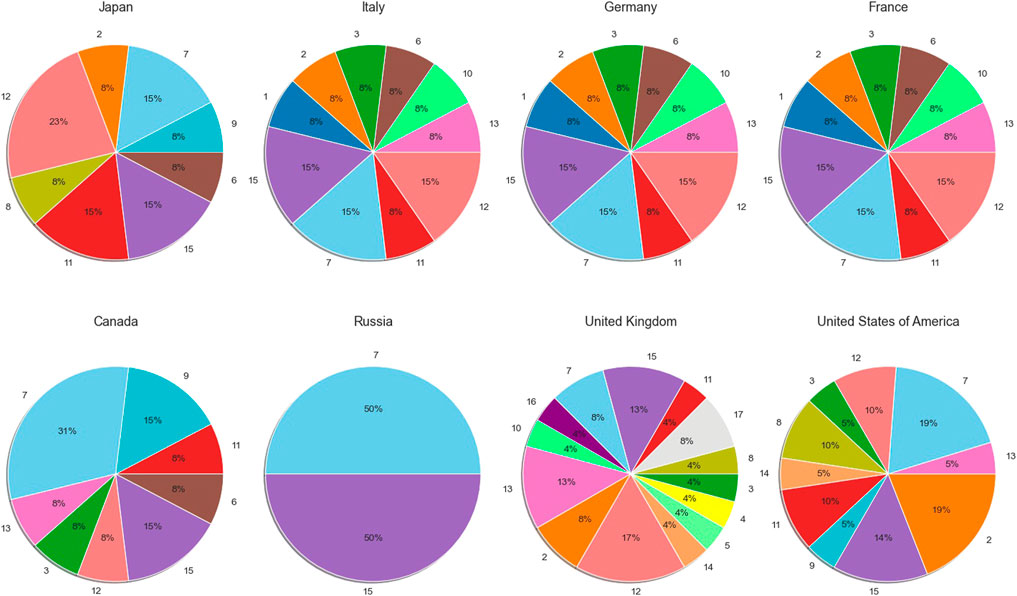
FIGURE 10. Association between the NDCs and the SDGs for the G8 countries.
Use case #4: What is the relationship between the Outputs expected from a specific Transformation with the SDG goals?
In this use case, we examine the association between a specific Transformation and the SDG goals, given that the Transformations are considered as modular building blocks for the SDGs achievement. We have selected the “Health, Wellbeing, and Demography” Transformation (Sachs et al., 2019). By navigating in the SustainGraph (see Figure 11), it is noticed that this Transformation is mainly implemented by the Ministries of Health, while it comprises of two Interventions (development of healthy behaviors and social determinants of healing, support of universal health coverage). These interventions contribute to the Intermediate Output of providing Public Health Services that is associated with a set of SDGs (SDGs # 1, 2, 3, 4, 5, 8, 9, 10, 11, 12, 16).
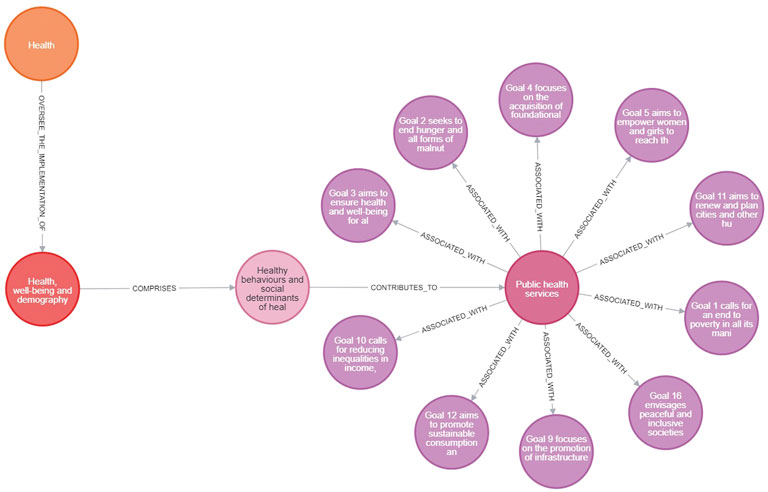
FIGURE 11. Association between a specific Transformation and the SDGs.
Use case #5: For a specific case study, what are the associated climate hazards that are tackled within the considered geographical areas? Are there any innovations that can be adopted to tackle these hazards?
In this use case, we focus on a specific case study developed within the ARSINOE H2020 project (ARSINOE project, 2022). The case study focuses on greening the Athens metropolitan area and tackling the impact of heat waves in the area of Attica in Greece. Specifically, ARSINOE aims at providing Athens with the foundation of a public consensus towards climate resilience, targeting the key community systems of the environment, biodiversity, clean energy, primarily, and transportation secondarily. As an initial examination of the case study, we want to identify what are the main climate hazards considered in the case study and if there are available existing technological solutions to help to mitigate their impact. By navigating through the SustainGraph, we can see that “Heat and cold” is the main hazard category considered, while the associated hazard types regard the “Extreme heat” and the “Mean temperature” increase (see Figure 12). For tackling these hazard types, four innovations are made available through the “Climate Innovation Window” platform with Technology Readiness Level (TRL) levels ranging from four to 7. These innovations refer to heatwave management through a blockchain-based system in urban areas, modeling solutions for assessing vulnerability indexes for heatwaves, and nature-based solutions for development of vertical garden and efficient water management systems.
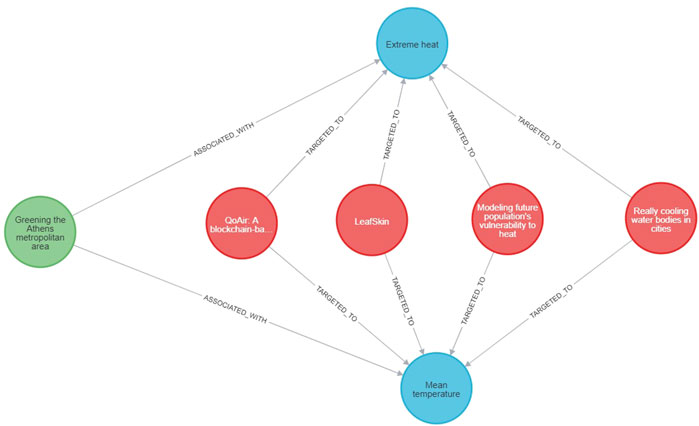
FIGURE 12. Climate hazards and innovation for a specific case study.
Use case #6: Examine the relationship between the corruption levels in a country with the economic development status and the classification regarding the freedom of press.
Well-established links exist between corruption levels, human rights abuses and decline in the quality of democracy within a country. Such links are considered within the SDGs and especially SDG #16 that focuses on peace, justice and inclusion. By navigating in the SDG targets of SDG #16 in the SustainGraph, four ambitious anti-corruption targets are defined, namely targets 16.4 (reduce illicit financial and arms flows and combat all forms of organized crime), 16.5 (reduce corruption and bribery in all its forms), 16.6 (develop effective, accountable and transparent institutions) and 16.10 (ensure public access to information and protect fundamental freedoms). By examining the indicators per target, it can be seen that qualitative data exist for a part of these indicators, including indicator 16.5.1 (proportion of persons engaged in bribery actions) and indicator 16.5.2 (proportion of businesses engaged in bribery actions). It should be noted that these indicators are provided by the UN SDG monitoring framework, however, are not directly traceable by the EU SDG monitoring framework. Both indicators are associated with the EU SDG indicator sdg_16_50 that regards the tracking of the Corruption Perception Index (CPI), as it is provided by Transparency International.
In this use case, we examine the relationship among corruption, freedom of press and economic development indicators in EU countries. To achieve this, there is a need to analyze data coming from third-party sources, data coming from the UN SDG and the EU SDG monitoring frameworks and data provided through the NDCs per country. The NDCs are included in the analysis to check the level of importance given per country towards the tackling of challenges related to SDG #16, including the fight against corruption. Following, a correlation matrix is produced based on correlation analysis over data for the indicators Gross Domestic Product (GDP) per capita, corruption and freedom of press for the time period from 2013 to 2021. It should be noted that, in case of corruption, the provided values are given on a scale of 0 (highly corrupt) to 100 (very clean). To properly depict this rating, we are using the term anti-corruption in our analysis. The produced correlation matrix is depicted in Figure 13, where all the presented values are statistically significant (p-value less than 0.001). High correlation values are noticed between the anti-corruption levels and the quality of the freedom of press (0.81), as well as the anti-corruption levels and the GDP per capita (0.77). A smaller correlation value is noticed between the quality of the freedom of press and the GDP per capita (0.6). Such results are reasonable and indicate the positive impact of the fight against corruption to the freedom of press, the improvement of the economic development status of countries and, thus, the rule of law and the quality of life of people.
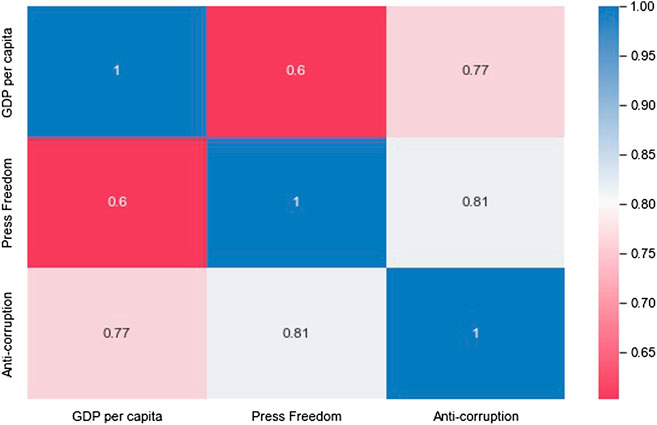
FIGURE 13. Correlation matrix.
Following, we examine the relationship between the Corruption Perception Index (CPI) and the UN SDG indicators 16.5.1 and 16.5.2. The objective is to check the intensiveness of the associations between these indicators, considering their similarity. Moving one step further, we examine the relationship between the CPI and the happiness index, focusing on the part of the happiness that is explained by corruption. Indeed, a strong correlation is identified between the CPI and indicator 16.5.1 (-0.8) and a medium correlation between the CPI and indicator 16.5.2 (-0.62). The stronger correlation in the case of the CPI and 16.5.1 indicators can be attributed to the kind of reporting for these indicators, where in both cases is based on the perception and the experiences of the individuals. The correlation between the CPI and the happiness score explained by the CPI is also high (0.88). The latter contributes to the overall happiness score calculated per country.
As a final step of the analysis in this use case, we examine the importance given on SDG #16 by countries across Europe in their NDCs. The objective was to check whether countries that are far from achieving the defined targets for the SDG #16 are considering the achievement of such targets in their policy agenda. However, by checking the NDCs of all countries across Europe, it is noticed that the only country that includes some references to SDG #16 is the United Kingdom. Such a result is not encouraging for achieving the SDG #16 targets across countries in Europe and should be considered by policy makers to adjust their policy recommendations in the future.
Use case #7: Examine the relationship between the SDG indicators defined by the UN and EU for a specific Goal for a case study that is implemented in the area of Athens in Greece.
The EU has fully committed itself to delivering on the 2030 Agenda and its implementation. To achieve this objective, regular monitoring of the progress towards the SDGs within the EU is taking place. As detailed in Use cases and analysis results, EU is not exhaustively assessing the progress towards the 169 targets of the 2030 Agenda, but considers a set of 101 indicators as an EU SDG indicator set. In this use case, we examine the relationship between the UN and SDG indicators that are considered in the implementation of the aforementioned case study for greening the Athens metropolitan area, within the framework of the ARSINOE project (ARSINOE project, 2022).
To examine the association of the work in the case study with the progress towards the achievement of specific SDGs at regional level, we have detailed the set of related UN SDG targets and indicators that are considered for monitoring. Data for these indicators can be provided through global, national and regional data providers. Given that part of such data is provided by Eurostat, we would like to have a view of the relationship between the selected UN SDG indicators with indicators coming from the EU SDG indicator set. This information can be easily retrieved through the SustainGraph, since the mapping of the association among indicators is already tracked. The outcome of this association for SDG #15 (Life on Land) is depicted in Figure 14, where the list of indicators is provided without any significance order. In the left part of the figure, the UN SDG #15 indicators are noted, while, in the right part, information is provided for the associated EU SDG indicators.
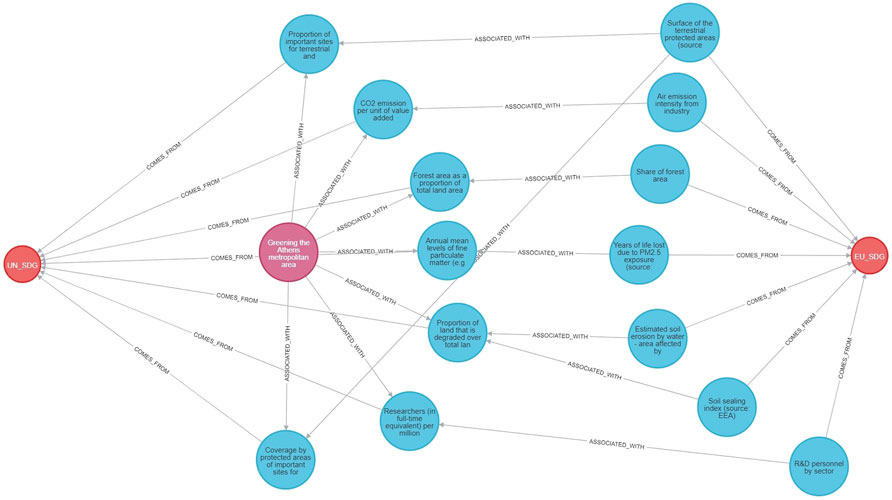
FIGURE 14. Interlinking of the UN and the EU SDG indicators for a specific Goal in a case study in Athens.
Implementation details
The SustainGraph is developed based on the Neo4j graph data platform. It is conceptualized in the form of a labeled property graph (LPG) model (Fotopoulou et al., 2022), as well as in the form of an ontology (Mandilara et al., 2022). The data population mechanisms are implemented through Python scripts by using the Py2neo client library and toolkit that is supported by Neo4j. For the data analysis pipelines, the Neo4j Graph Data Science data analytics and machine learning platform is used. Visualizations are produced based on the usage of the NeoDash dashboard builder for the Neo4j graph database, the Neo4j Bloom visualization tool and SemSpect as a scalable graphical exploration interface for knowledge graphs. The SustainGraph is released as an open-source KG that can be adopted and used by the scientific community. It is made openly available in a GitLab repository (Fotopoulou et al., 2022) under an Eclipse Public License 2.0.
A continuous development and integration approach is followed for the maintenance and update of the SustainGraph. This includes both the extension of the represented entities and relationships, and the development of data population mechanisms for integrating data from further data sources and providers. A periodical update (e.g., in a bimonthly basis) of the documentation part (available in English) in the GitLab repository (Fotopoulou et al., 2022) is planned to facilitate the ease adoption, usage and extension of the SustainGraph.
Discussion
In the current work, we have presented the SustainGraph, as the first -up to our knowledge- Knowledge Graph that tries to holistically represent information associated with the set of goals, targets and indicators specified by the United Nations in the 2030 Agenda for Sustainable Development. the SustainGraph is conceptualized by having in mind the need to track the progress towards the SDGs targets based on the assessment of indicators provided by different data providers, considering the need to represent their association based on their exact definition (e.g., the UN SDG and the EU SDG indicators are not identical). The information collected in the SustainGraph includes data related to the association between the emerging policies and the SDGs, the implementation of case studies and the release of innovative solutions for climate change impact mitigation and adaptation. The conceptualization and development of the SustainGraph is the first and basic step to serve a wide set of end users, including the scientific community, policy makers and educational organizations. Following, we refer to a set of limitations that exist in the release of the SustainGraph, as it is detailed in this manuscript, along with suggested ways to overcome such limitations in the future.
The existing user interface for submitting queries to the SustainGraph is mostly targeted to data scientists and application developers that have some experience on preparing questions in the form of descriptive queries (e.g., by using the Cypher language supported by Neo4j). Upon submission of a query, access to the results is provided in a visual way as well as in formats that can be easily used as input for further analysis (e.g., tabular data). There is a need to develop user-friendly interfaces to make the SustainGraph easily adoptable by end users without expertise in computer science. To achieve this, a set of visualization tools are considered that simplify the interaction with the SustainGraph, while work is in progress towards the development of user-friendly querying interfaces for submission of questions by end users.
Another crucial need has to do with the development of mature solutions to easily populate the SustainGraph with data. As already mentioned, data quality issues along with the need for harmonization of the provided datasets by different data providers hinder the ease adoption and usage of such data. A set of data population mechanisms are already into place to support the population of the SustainGraph with qualitative data, however, further mechanisms have to be developed in the future, considering the volatility of the structure of the produced data and the inclusion of further data sources (e.g., data coming from initiatives related to the development of sustainable cities, data associated with the classification of activities according to the EU Taxonomy). Periodical review of the applicable data protection regulation has to be considered to ensure data management in accordance with the legislative framework. Changes in the definition of indicators per SDG have to be considered, as it may happen in the case of the EU SDG indicator set that is under an annual review process. The flexibility provided in the SustainGraph to appropriately extend the data representation schema can help us to incorporate such changes.
Semantic alignment of the introduced data is also crucial to support interoperability with existing semantically aware data as well as enable reasoning functionalities over the populated KG. To achieve this, the integration of semantics into the existing LPG model of the SustainGraph has to take place, taking advantage of the specification of the SustainGraph ontology for validating the proper description of entities in the LPG model. Representation of geometry types is also under consideration within the SustainGraph to support the realization of spatial analysis.
Furthermore, special attention has to be given on the applicability of the SustainGraph for the development of solutions for climate change impact mitigation and adaptation at global level. As detailed in the manuscript, a significant part of the SustainGraph is dedicated to EU countries. This includes both the consideration of EU SDG indicators and a set of policies targeted to EU countries under the umbrella of the European Green Deal. However, this specialization should not be considered restrictive for the tracking of the status of the SDG indicators and targets and the support of socio-environmental analyses for other countries or regions across the globe. Data series for the UN SDG and third-party indicators are collected for all the countries, while part of the considered policy frameworks have also a global range (e.g., Nationally Determined Contributions based on the Paris Agreement, six SDG Transformations). Furthermore, openness and extensibility are two of the core principles considered by design for the SustainGraph. Further policy frameworks that are applicable in different areas can be introduced and interlinked with the existing concepts in the SustainGraph.
Importance has also to be given on the effortless support of participatory modeling approaches throughout the SustainGraph, taking advantage of the harmonization of the represented concepts and the provision of access to data that are accompanied by their meaning and can be understood by end users. Interoperability of the SustainGraph with tools that support the execution of analysis pipelines and modeling environments (e.g., multi-agent programmable modeling environments) has to be supported, since it is going to further boost its usability by scientists. Furthermore, ways for ingesting the analysis results to the KG have to be considered (e.g., the forecasting of the evolution of specific indicators can be available in the KG).
Special mention has to be given to the exploitation potential provided by the emergence of ML techniques and toolkits. Further ML techniques can be applied in the SustainGraph for supporting both data population and data analysis mechanisms. Natural Language Processing (NLP) techniques are very helpful to analyze policy documents and extract information that can be embedded in the KG. In a similar way, computer vision techniques can be applied to images (e.g., from satellite infrastructure or citizen science platforms) to populate the KG with data. In the analysis part of the KG, various ML pipelines can be developed to support KG evolution and completion processes, considering graph ML algorithms. Focus has also to be given to the development of explainable Artificial Intelligence (AI) solutions over the SustainGraph, providing accurate and easily interpretable recommendations to assist decision making, and facilitating the adoption of such solutions by scientists (Tiddi and Schlobach, 2022).
Conclusion
The first release of the SustainGraph constitutes a basic step to support scientists from interdisciplinary domains to collaborate and develop innovative solutions to tackle climate change impacts. The existence of a well-founded representation of entities and relationships around the SDGs and the capability to store data that are aligned with this representation relaxes significantly the burden for data collection, semantic alignment and analysis and provides new ways for the development of participatory modeling and analysis processes. The application of a Systems Innovation Approach guarantees the proper observation of complex systems and the better understanding of interrelations among the represented concepts by taking into account the feedback provided by various stakeholders and their involvement in a co-design process.
Even by having performed a basic conceptualization step, a great deal of work is still ahead to make the SustainGraph easily adoptable and exploitable by end users coming from various disciplines and perspectives (e.g., socio-environmental scientists, policy makers, data scientists, citizen observatories). A set of extensions have to be developed by considering the aforementioned limitations and opportunities for exploitation of novel technologies. To be able to support further developments, openness and interoperability are considered by design in the conceptualization and development of the SustainGraph. An open-source release of the SustainGraph is available (Fotopoulou et al., 2022), while consumption of open APIs is considered -where applicable-in the development of data population mechanisms.
Data availability statement
The original contributions presented in the study are included in the article/Supplementary Material, further inquiries can be directed to the corresponding author.
Author contributions
EF, IM, AZ, and SP contributed to conception and design of the SustainGraph. EF and IM developed the SustainGraph and the set of data population mechanisms. AZ, CL, GA, and PK contributed to documentation and interlinking of policy frameworks with the SDGs and the revision of the concepts and relationships detailed in the SustainGraph. CL, GA, and PK contributed to the description of the Systems Innovation Approach and the description of the interaction of the SustainGraph with participatory modeling processes. AZ, EF, IM, and SP wrote the first draft of the manuscript. All authors contributed to manuscript revision, read, and approved the submitted version.
Funding
This project has received funding from the European Union’s Horizon 2020 research and innovation programme under grant agreement No 101037424.
Acknowledgments
The authors would like to thank Michael Hunger from the Neo4j community for his valuable feedback and support for the deployment of the SustainGraph.
Conflict of interest
The authors declare that the research was conducted in the absence of any commercial or financial relationships that could be construed as a potential conflict of interest.
Publisher’s note
All claims expressed in this article are solely those of the authors and do not necessarily represent those of their affiliated organizations, or those of the publisher, the editors and the reviewers. Any product that may be evaluated in this article, or claim that may be made by its manufacturer, is not guaranteed or endorsed by the publisher.
References
ARSINOE project (2022). ARSINOE H2020 project: Climate resilient regions through systemic solutions and innovations. Available at: https://arsinoe-project.eu/. (Accessed April 22, 2022).
BRIGAID project (2022). Climate innovation Window. Available at: https://climateinnovationwindow.eu/(Accessed September 10, 2022).
Chen, X., Jia, S., and Xiang, Y. (2020a). A review: Knowledge reasoning over knowledge graph. Expert Syst. Appl. 141, 112948. doi:10.1016/j.eswa.2019.112948
Chen, Z., Wang, Y., Zhao, B., Cheng, J., Zhao, X., and Duan, Z. (2020b). Knowledge graph completion: A review. IEEE Access 8, 192435–192456. doi:10.1109/ACCESS.2020.3030076
Climate Watch (2022). NDC data explorer. Available at: https://www.climatewatchdata.org/data-explorer/ndc-content. (Accessed September 10, 2022).
Crespi, A., Terzi, S., Cocuccioni, S., Zebisch, M., Berckmans, J., and Fussel, H.-M. (2020).Climate-related hazard indices for Europe. ETC-CCA Technical Paper 1/2020. Available at: https://www.eionet.europa.eu/etcs/etc-cca/products/etc-cca-reports/climate-related-hazard-indices-for-europe. (Accessed November 12, 2020).
De Vicente Lopez, J., and Matti, C. (2016). Visual toolbox for system innovation. A resource book for practitioners to map, analyse and facilitate sustainability transitions. Brussels: Transition Hub Series. EIT Climate KIC.
den Elzen, M., Kuramochi, T., Höhne, N., Cantzler, J., Esmeijer, K., Fekete, H., et al. (2019). Are the g20 economies making enough progress to meet their ndc targets? Energy Policy 126, 238–250. doi:10.1016/j.enpol.2018.11.027
Dusík, J., and Bond, A. (2022). Environmental assessments and sustainable finance frameworks: Will the eu taxonomy change the mindset over the contribution of eia to sustainable development? Impact Assess. Proj. Apprais. 40, 90–98. doi:10.1080/14615517.2022.2027609
Elsawah, S., Filatova, T., Jakeman, A. J., Kettner, A. J., Zellner, M. L., Athanasiadis, I. N., et al. (2020). Eight grand challenges in socio-environmental systems modeling. Socio-Environmental Syst. Model. 2, 16226. doi:10.18174/sesmo.2020a16226
EU SDG (2022). EU sustainable development indicators. Available at: https://ec.europa.eu/eurostat/web/sdi/indicators.
European Commission (2016). Communication from the commission to the European parliament, the council, the European economic and social committee and the committee of the regions next steps for A sustainable European future European action for sustainability. Available at: https://eur-lex.europa.eu/legal-content/EN/TXT/?qid=1582887642463&uri=CELEX:52016DC0739.
Eurostat (2022). Sustainable development in the European Union — monitoring report on progress towards the SDGs in an EU context — 2022 edition. Available at: https://ec.europa.eu/eurostat/web/products-statistical-books/-/ks-09-22-019.
Fotopoulou, E., Mandilara, I., Zafeiropoulos, A., and Papavassiliou, S. (2022). Sustaingraph knowledge graph repository. Available at: https://gitlab.com/netmode/sustaingraph.
Hitzler, P., Janowicz, K., and Lecue, F. (2020). On the role of knowledge graphs in explainable ai. Semant. Web 11, 41–51. doi:10.3233/SW-190374
Hogan, A., Blomqvist, E., Cochez, M., d’Amato, C., de Melo, G., Gutiérrez, C., et al. (2021). Synthesis lectures on data, semantics, and knowledge. Berlin, Germany: Morgan & Claypool. doi:10.2200/S01125ED1V01Y202109DSK022
Ioannou, A. E., and Laspidou, C. S. (2022). Resilience analysis framework for a water–energy–food nexus system under climate change. Front. Environ. Sci. 10, 820125. doi:10.3389/fenvs.2022.820125
Issa, S., Adekunle, O., Hamdi, F., Cherfi, S. S.-S., Dumontier, M., and Zaveri, A. (2021). Knowledge graph completeness: A systematic literature review. IEEE Access 9, 31322–31339. doi:10.1109/ACCESS.2021.3056622
Joshi, A., Morales, L. G., Klarman, S., Stellato, A., Helton, A., Lovell, S., et al. (2021). “A knowledge organization system for the united nations sustainable development goals,” in The semantic web. Editors R. Verborgh, K. Hose, H. Paulheim, P.-A. Champin, M. Maleshkova, O. Corchoet al. (Cham: Springer International Publishing), 548–564.
Koundouri, P., Devves, S., and Plataniotis, A. (2021). Alignment of the European green deal, the sustainable development goals and the European semester process: Method and application. Theor. Econ. Lett. 11, 743–770. doi:10.4236/tel.2021.114049
Koundouri, P., Tessari, F., Spani, R. C., Romani, I. G., Patel, K., Hansmeyer, C., et al. (2022). Financing the joint implementation of the SDGs and the European green deal. Available at: https://egd-report.unsdsn.org/.
Laspidou, C. S., Mellios, N., and Kofinas, D. (2019). Towards ranking the water–energy–food–land use–climate nexus interlinkages for building a nexus conceptual model with a heuristic algorithm. Water 11, 306. doi:10.3390/w11020306
Laspidou, C. S., Mellios, N. K., Spyropoulou, A. E., Kofinas, D. T., and Papadopoulou, M. P. (2020). Systems thinking on the resource nexus: Modeling and visualisation tools to identify critical interlinkages for resilient and sustainable societies and institutions. Sci. Total Environ. 717, 137264. doi:10.1016/j.scitotenv.2020.137264
Lee, B., Kjaerulf, F., Turner, S., Cohen, L., Donnelly, P., Muggah, R., et al. (2016). Transforming our world: Implementing the 2030 agenda through sustainable development goal indicators. J. Public Health Policy 37, 13–31. doi:10.1057/s41271-016-0002-7
Malagó, A., Comero, S., Bouraoui, F., Kazezyılmaz-Alhan, C. M., Gawlik, B. M., Easton, P., et al. (2021). An analytical framework to assess sdg targets within the context of wefe nexus in the mediterranean region. Resour. Conservation Recycl. 164, 105205. doi:10.1016/j.resconrec.2020.105205
Mandilara, I., Fotopoulou, E., Zafeiropoulos, A., and Papavassiliou, S. (2022). Sustaingraph ontology documentation. Available at: https://netmode.gitlab.io/sustaingraph-ontology/.
Matsui, T., Suzuki, K., Ando, K., Kitai, Y., Haga, C., Masuhara, N., et al. (2022). A Natural Language processing model for supporting sustainable development goals: Translating semantics, visualizing nexus, and connecting stakeholders. Sustain. Sci. 17, 969–985. doi:10.1007/s11625-022-01093-3
Matti, C., dCorvillo, J. M. M., Lalinde, I. V., Agulló, B. J., Stamate, E., Avella, G., et al. (2020). Challenge-led system mapping, A knowledge management approach. Transitions Hub series. Europe: EIT Climate-KIC.
Midgley, G., and Lindhult, E. (2021). A systems perspective on systemic innovation. Syst. Res. Behav. Sci. 38, 635–670. doi:10.1002/sres.2819
Morton, S., Pencheon, D., and Bickler, G. (2019). The sustainable development goals provide an important framework for addressing dangerous climate change and achieving wider public health benefits. Public Health 174, 65–68. doi:10.1016/j.puhe.2019.05.018
Noy, N., Gao, Y., Jain, A., Narayanan, A., Patterson, A., and Taylor, J. (2019). Industry-scale knowledge graphs: Lessons and challenges. Commun. ACM 62, 36–43. doi:10.1145/3331166
Olechowski, A. L., Eppinger, S. D., Joglekar, N., and Tomaschek, K. (2020). Technology readiness levels: Shortcomings and improvement opportunities. Syst. Eng. 23, 395–408. doi:10.1002/sys.21533
Papadopoulou, C.-A., Papadopoulou, M. P., and Laspidou, C. (2022). Implementing water-energy-land-food-climate nexus approach to achieve the sustainable development goals in Greece: Indicators and policy recommendations. Sustainability 14, 4100. doi:10.3390/su14074100
Purohit, S., Van, N., and Chin, G. (2021). “Semantic property graph for scalable knowledge graph analytics,” in 2021 IEEE International Conference on Big Data (Big Data), Orlando, FL, USA, 15-18 December 2021 (Piscataway, New Jersey, United States: IEEE), 2672–2677. doi:10.1109/BigData52589.2021.9671547
Rainone, S. (2020). An overview of the 2020-2021 country-specific recommendations (csrs) in the social field. Brussels, Belgium: ETUI, The European Trade Union Institute.
Ramos, E. P., Kofinas, D., Sundin, C., Brouwer, F., and Laspidou, C. (2022). Operationalizing the nexus approach: Insights from the sim4nexus project. Front. Environ. Sci. 10, 787415. doi:10.3389/fenvs.2022.787415
Rowley, J. (2007). The wisdom hierarchy: Representations of the dikw hierarchy. J. Inf. Sci. 33, 163–180. doi:10.1177/0165551506070706
Sachs, J. D., Schmidt-Traub, G., Mazzucato, M., Messner, D., Nakicenovic, N., and Rockström, J. (2019). Six transformations to achieve the sustainable development goals. Nat. Sustain. 2, 805–814. doi:10.1038/s41893-019-0352-9
Sachs, J., Koundouri, P., Papa, C., Armiento, M., Sartori, N., Carnevale, P., et al. (2021). Transformations for the joint implementation of agenda 2030 for sustainable development and the European green deal. Available at: https://resources.unsdsn.org/.
SDSN - World Happiness Report (2022). World happiness report. Available at: https://worldhappiness.report/.
Sequeda, J., and Lassila, O. (2021). Designing and building enterprise knowledge graphs. San Rafael: Morgan & Claypool.
Smith, T. B., Vacca, R., Mantegazza, L., and Capua, I. (2021). Natural language processing and network analysis provide novel insights on policy and scientific discourse around Sustainable Development Goals. Sci. Rep. 11, 22427. doi:10.1038/s41598-021-01801-6
Tiddi, I., and Schlobach, S. (2022). Knowledge graphs as tools for explainable machine learning: A survey. Artif. Intell. 302, 103627. doi:10.1016/j.artint.2021.103627
Transparency International (2022). Corruption perception index. Available at: https://www.transparency.org/en/cpi.
U4SSC (2021). U4SSC - key performance indicators: A key element for cities wishing to achieve the sustainable development goals. Available at: https://www.itu.int/en/publications/Documents/tsb/2020-U4SSC-Concept-Note/index.html#p=1.
UN SDG (2022). UN sustainable development indicators. Available at: https://unstats.un.org/sdgs/indicators/indicators-list/.
UN Statistics (2022). United nations statistics division sdg api. Available at: https://unstats.un.org/sdgapi/swagger/.
United Nations Climate Action (2022). United nations, all about the NDCs. Available at: https://www.un.org/en/climatechange/all-about-ndcs.
van Loon-Steensma, J. (2018). “The potential of BRIGAID’s testing and implementation framework (TIF) as a tool to promote nature based solutions,” in EGU General Assembly Conference Abstracts, Vienna, Austria, 4-13 April, 2018 (Europe: EGU General Assembly), 10374.
van Zanten, J. A., and van Tulder, R. (2021). Improving companies’ impacts on sustainable development: A nexus approach to the sdgs. Bus. Strategy Environ. 30, 3703–3720. doi:10.1002/bse.2835
Vinuesa, R., Azizpour, H., Leite, I., Balaam, M., Dignum, V., Domisch, S., et al. (2020). The role of artificial intelligence in achieving the Sustainable Development Goals. Nat. Commun. 11, 233. doi:10.1038/s41467-019-14108-y
Wilkinson, M., Dumontier, M., Aalbersberg, I. J., Appleton, G., Axton, M., Baak, A., et al. (2016). The fair guiding principles for scientific data management and stewardship. Sci. Data 3, 160018. doi:10.1038/sdata.2016.18
Xue, B., and Zou, L. (2022). Knowledge graph quality management: A comprehensive survey. IEEE Trans. Knowl. Data Eng., 3, 1. doi:10.1109/TKDE.2022.3150080
Zafeiropoulos, A., Fotopoulou, E., and Papavassiliou, S. (2021). “Participatory socio-environmental systems modeling over knowledge graphs,” in 2021 IEEE Globecom Workshops (GC Wkshps), Madrid, Spain, 07-11 December 2021 (Piscataway, New Jersey, United States: IEEE), 1–6. doi:10.1109/GCWkshps52748.2021.9682047
Keywords: knowledge graph, sustainable development goal (SDG), systems innovation approach, climate change impact, participatory modeling, graph database, ontology
Citation: Fotopoulou E, Mandilara I, Zafeiropoulos A, Laspidou C, Adamos G, Koundouri P and Papavassiliou S (2022) SustainGraph: A knowledge graph for tracking the progress and the interlinking among the sustainable development goals’ targets. Front. Environ. Sci. 10:1003599. doi: 10.3389/fenvs.2022.1003599
Received: 26 July 2022; Accepted: 18 October 2022;
Published: 26 October 2022.
Edited by:
Jill A. Engel-Cox, National Renewable Energy Laboratory (DOE), United StatesReviewed by:
Richard Lawford, Morgan State University, United StatesCogan Shimizu, Wright State University, United States
Felice Addeo, University of Salerno, Italy
Copyright © 2022 Fotopoulou, Mandilara, Zafeiropoulos, Laspidou, Adamos, Koundouri and Papavassiliou. This is an open-access article distributed under the terms of the Creative Commons Attribution License (CC BY). The use, distribution or reproduction in other forums is permitted, provided the original author(s) and the copyright owner(s) are credited and that the original publication in this journal is cited, in accordance with accepted academic practice. No use, distribution or reproduction is permitted which does not comply with these terms.
*Correspondence: Anastasios Zafeiropoulos, tzafeir@cn.ntua.gr