National accounting scheme for biodiversity loss: An international trade perspective
 Xuemei Li
 Lu Xing1
  Zhe Zhang
- 1School of Economics, Ocean University of China, Qingdao, China
- 2Institute of Marine Development, Ocean University of China, Qingdao, China
- 3School of Business, Qingdao University, Qingdao, China
International trade has emerged as a threat to biodiversity. Identifying the biodiversity loss in countries/regions driven by international trade is a prerequisite for effective protection. Considering the lack of existing research, it is urgently necessary to construct an equitable and reasonable accounting scheme for biodiversity loss. Therefore, based on the multi-regional input–output model framework, this study uses the International Union for Conservation of Nature Red List of Threatened Species data to evaluate and compare the biodiversity footprints of 188 countries/regions between 2006 and 2015. We find that the world’s biodiversity footprint is characterized by a significant spatial non-equilibrium driven by developed countries and developing countries with large economies. Financial intermediation and business activities, education, health, and other services, and construction and agriculture sectors play an important role in the accounting scheme for biodiversity and hence must be strictly controlled. This study will help construct a biodiversity conservation framework in the 2020s.
1 Introduction
Biodiversity is the material basis for human survival and development (Hugé et al., 2020) and is closely related to the well-being of human social life (Xu et al., 2021). It plays a key role in material cycling and energy flow in the ecosystem, which is directly related to the stability and sustainability of ecological and social systems (Blicharska et al., 2019). The self-regulation ability (Rahman et al., 2018), ecological service function, and various material resources derived from biodiversity (Girardello et al., 2019) are crucial to the sustainable development of human society, especially sustainable economic development. However, with the increasing scope and intensity of human economic activities, the global ecological carrying capacity is reaching its limit. The sharp global decline in the number of biological species is resulting in serious threats to biodiversity security worldwide. The Red List of Threatened Species compiled by the International Union for Conservation of Nature (IUCN) in 2021 emphasizes that the proportion of endangered species in the assessed species was as high as 28%, involving 37,400 species, in that year. The data indicate that global biodiversity loss is serious. Humans account for only approximately 0.01% of global biomass, but they occupy 90% of the global biological activity area and destroy 83% of wild animals and 50% of plants (Bar-on et al., 2018). Moreover, future human social activities will further increase the risk of extinction for more species worldwide (Venter et al., 2016; Tilman et al., 2017; Wang et al., 2021) and may even lead to the early arrival of the sixth mass extinction (Ceballos et al., 2020). Therefore, effectively curbing the loss of global biodiversity has become a major problem and challenge faced by all countries.
As one of the core goals of the Convention on Biological Diversity and 2030 United Nations Sustainable Development Agenda, biodiversity has become another global environmental issue that attracts attention besides climate change (Dai et al., 2021). The world is actively exploring ways to protect biodiversity (Waldron et al., 2017) and making efforts to mitigate the adverse effects of the sharp decline in biodiversity (Driscoll et al., 2018); however, the effect of current policies is not ideal owing to the combined impact of poor supervision, policy conflict, interest group games, and the novel coronavirus of 2019. The loss of global biodiversity persists and shows an accelerating trend (Reyers and Selig, 2020). Against this backdrop, it is imperative to strengthen global communication and cooperation regarding biodiversity conservation and find a balance between economic and biodiversity conservation objectives. This must be based on clarifying the influencing factors and regional distribution characteristics of biodiversity loss. The formulation and implementation of relevant policies can promote substantive progress in conservation worldwide only if they are based on specified causes and the explicit geography of biodiversity (Joppa et al., 2016).
Existing research has extensively discussed the factors affecting biodiversity 15th analyzed those that result in the sustained loss of biodiversity from agricultural production (Zabel et al., 2019; Green et al., 2019), land use (Chaudhary and Brooks, 2019; Dai et al., 2021), climate change (Scheffers et al., 2019; Arneth et al., 2020), illegal hunting (Gray et al., 2018), and international trade (Lenzen et al., 2012; Moran and Kanemoto, 2017). International trade has become the main threat to global biodiversity at this stage (Wiedmann and Lenzen, 2018). In particular, the deepening division of global value chains and increasing trade links among countries (Acquaye et al., 2017; Wang et al., 2020a) further deepen and amplify the impact of international trade on global biodiversity (Kok et al., 2020). Therefore, this study focuses on how international trade affects biodiversity in developed and developing countries from the perspective of consumption.
With the development of global trade, production, assembly, transportation and marketing of products across multiple sectors and areas are bound to result in differences in spatial and temporal distribution of economic gains and environmental costs (Gereffi and Frederick, 2010). Raw material exploitation and primary manufacturing in front-end manufacturing industry in global industry chain tend to gather more resource inputs, resulting in more environmental pollution at the same time, economic benefits are relatively low. Developed countries and regions take advantage of capital and technology to “outsource” front-end manufacturing to less developed areas, resulting in transfer of environmental costs to less developed regions. At the same time, backward areas of manufacturing which are at the front-end of the industrial chain can also be locked in resource-intensive production patterns as “shelters” of developed regions, resulting severe challenges of regional economic and social development in developing countries and regions (Zhang et al., 2017). Biodiversity loss is also part of environmental costs. Although international trade has brought about many benefits to participating countries, such as technology spillovers and economic growth, it inevitably causes pollution and ecological damage to the environment of trading countries, especially major exporters. This damage results in a huge loss of biodiversity (Kok et al., 2020). On the one hand, deforestation, over exploitation, and other activities triggered by international trade have destroyed the local ecosystem and exacerbated habitat degradation and fragmentation, which directly lead to a reduction in biodiversity. On the other hand, the environmental pollution caused by international trade and the invasion of alien species threaten regional biodiversity, thereby indirectly increasing the risk of biodiversity loss. In addition, the complexity and intersectionality of inter-country trade not only increases the difficulty of clarifying the parties responsible for biodiversity conservation, but also poses challenges to cross-regional cooperation in biodiversity conservation worldwide (Chang et al., 2016).
Existing research mainly examines the impact of international trade on biodiversity in a specific country or region from a single perspective of imports or exports, ignoring the differences between production and consumption. Wilting and van Oorschot, (2017) measured the biodiversity footprints of 47 industries in the Netherlands to examine the impacts of two environmental pressures, land use and greenhouse gas emissions caused by industrial production. Chaudhary et al. (2016) attempted to explore the impact of food imports in Sweden on biodiversity and found that domestic imports affect land use abroad, undermining local biodiversity. Taking Finland as an example, Sandström et al. (2017) examined the impact of land and water use on global biodiversity. The results indicate that the impact of agricultural imports on biodiversity in Finland mainly occurs abroad. However, while the aforementioned studies focus on developed countries to explore the impact of international trade on biodiversity, analysis focusing on developing countries is rare. Meanwhile, the majority of research associates export commodity production with biodiversity loss in countries of origin but ignores the driving effect of final consumption and transmission effect of the global supply chain. Moreover, there is a lack of uniform standards for measuring biodiversity loss. For example, Wilting and van Oorschot, (2017) and Newbold et al. (2015) measured the impact of trade on regional biodiversity by the loss of average species richness and loss of total species richness, respectively. However, the measurement of this impact depends on selected environmental pressures such as land use and water use, which has certain limitations.
The measurement of resource footprint contains material balance method, life cycle method, input-output method, etc. Material balance method requires detailed data basis and can not reflect the dynamic effect of industry economic factors on the footprint. Life cycle method makes it difficult to measure all goods in society. As a result, the input-output method is frequently used in related studies. Therefore, by integrating the IUCN Red List of Threatened Species with the global multi-region input–output (MRIO) database, this study links biodiversity with international trade and measures the biodiversity footprints of 188 countries from 2006 to 2015. From the perspective of consumption, this study examines the impact of international trade on biodiversity in different countries. Based on the results, the center of gravity method and standard deviational ellipse method are used to analyze and comprehend the spatial distribution characteristics, spatio-temporal evolution laws, and variation in global biodiversity loss from 2006 to 2015. The findings may help define the mitigation responsibility of international biodiversity loss and transnational biodiversity cooperation as well as realize sustainable development goals.
In summary, the major contributions of this study are threefold. First, from the perspective of consumption, the impacts of international trade on biodiversity in developed and developing countries are included in a unified analytical framework for the first time. The biodiversity footprint of each country is measured from the aspects of imports and exports and the differences in the impacts of international trade on biodiversity in different countries are compared and analyzed. Second, in terms of measurement, by combining the IUCN Red List of Threatened Species with the global MRIO database, we can link threatened species with the production of specific countries. The biodiversity loss throughout the supply chain during the study period is tracked by measuring the biodiversity footprints of 188 countries from 2006 to 2015. The measurement of the impact of international trade on biodiversity is more reasonable and accurate than in previous studies. Finally, this study comprehensively elucidates the spatial distribution characteristics and spatio-temporal evolution laws of biodiversity footprints worldwide at the national and sectoral levels for the first time. It also focuses on the specific flows of and differences in biodiversity in the process of trade, laying the foundation for the strategic protection and policy formulation of global biodiversity.
2 Material and methods
Drawing on the concept of carbon footprint, this study attempts to measure the biodiversity footprint of the process of international trade. Referring to the measurement method proposed by Lenzen et al. (2012), we consider species, a kind of environmental resource, as a satellite account for integrated environmental–economic analysis. By integrating the IUCN Red List of Threatened Species with the Eora global MRIO database, we can examine the status of biodiversity imports and exports in 188 countries and regions.
The IUCN Red List of Threatened Species was processed to accurately measure the impact of international trade on biodiversity. First, the IUCN distinguishes eight levels of threat, of which we excluded five (Extinct, Extinct in the Wild, Data Deficient, Least Concern, and Near Threatened) and summarized the remaining three levels: Critically Endangered, Endangered, and Vulnerable. Second, the list provides country-wise information on K = 82 detailed threat causes of the omitted causes that could not be linked to specific human industrial activities and international trade; these covered invasive and other problematic species and genes, geological events, and some natural system modifications. Finally, as the former Soviet Union has collapsed, we excluded it from the study data, which counted 188 countries and regions.
In terms of data availability, the relevant raw data to account for the biodiversity footprint are obtained from the IUCN and Eora MRIO databases, which are publicly available.
3 Theory/calculation
3.1 Database matching
In the first step, each of the 82 threat causes was allocated to zero, one, or multiple sectors in the Common Product Classification (CPC V1.0). This principle is based on Lenzen’s research. The allocation was accomplished using a K×U concordance matrix M1, including 188 countries and regions, with K = 15416 rows and U = 1811 columns. Each row contained values of 1 in those columns that belong to the economic sector(s) to which that threat is attributed.
In the second step, according to the International Standard Industrial Classification, we constructed a concordance matrix M2 that relates CPC sectors to the 26 sector classifications of countries in the MRIO table. The CPC concordance matrix M1 was posted with an 1811 × 4888 concordance matrix M2, yielding a 15416 × 4888 binary concordance matrix MC:
In the final step, we normalized the binary concordance MC:
where x is a 4888 × 1 normalization weight matrix, with the hat symbol denoting the diagonalization of a vector. Sectors are weighted by their gross industrial output for all causes. This normalization ensures that the concordance rows sum to 1 and that threat causes are not counted multiple times.
3.2 Species introduction
Once the database was matched, it was assumed that the threat to nationally endangered species was only associated with its own country. Because of this assumption, we converted the original O × 4888 Red List sub-records ZC into matrix Q to introduce the threatened species:
where the matrix ZC has rows of countries/species/cause sub-records and columns of countries/cause sub-records, and O represents endangered species under sub-threats in all countries.
We aggregated rows referring to the same country/species record to create an R × 4888 matrix Qag with row sums that show the number of causes listed for each record. As a result, species relate to national industrial activities. To accurately measure the impact of industrial activities on species, Qag was normalized as follows:
where D is a 4888 × 1 summation operator, represented as
Finally, we aggregated the rows referring to the same species to create a P × 4888 matrix Wag. The matrix Wag shows species threats against exerting industry sectors, thus conforming to the standard format of satellite accounts that is required for integrated environmental–economic analysis.
3.3 Biodiversity footprint
Compared with the single-region input–output (SRIO) model, the MRIO model considers the differences in intermediate input and technical levels across countries. Thus, the complete consumption coefficient is modified to a certain extent, leading to a more accurate result. Therefore, this study uses the MRIO model to calculate the biodiversity footprint. Based on the use direction of the product, the MRIO model can be expressed as
where Xs refers to the total industry output in country s; Ysr refers to the final product of total output by industry in country s that is used to meet the demand in each industry in country r; Asr is the direct consumption coefficient, which represents intermediate products in country s consumed by industrial unit output in country r, and AsrXr refers to intermediate goods exported to industries in country r from the total output by industry in country s.
The formula, which can also cover all 188 countries and regions, is expressed in matrix form:
where X is a 4888 × 1 matrix of total output, element Xs is a 26 × 1 column vector, A is a 4888 × 4888 matrix of direct consumption coefficient, element Asr is a 26 × 26 matrix, and T is a 4888 × 4888 matrix representing input–output data for countries, and
The equation can be transformed into
where X is a 4888 × 4888 unit matrix, L is a 4888 × 4888 Leontief inverse matrix, which is also called the complete demand matrix, and Element Lst refers to the full demand for the production of one additional unit of final product in each industry of country t on the total output in each industry of country s.
Lenzen et al. (2012) measured the imports and exports of biodiversity in terms of the number of threatened species. This study adopted a slightly different approach. Considering that carbon emissions and biological species both belong to the environmental resource account, we calculated the biodiversity footprint mainly based on the carbon footprint (Wang et al., 2019; Wang et al., 2020b; Wang et al., 2020c). Leontief proposed that the carbon footprint can be calculated by adding a pollution intensity matrix to the traditional input–output matrix, regardless of whether the carbon intensity of imported products is consistent with that of domestic products, whether traded unilaterally or multilaterally. This approach is also applicable when calculating the biodiversity footprint.
Let Es denote the vector of biodiversity depletion coefficient for country s. Then, the biodiversity export from country s to country r can be expressed as
The equation can be expressed in the form of a matrix that includes all 188 countries and regions:
where Es, the diagonal elements of matrix E, are all 26 × 26 diagonal matrices. The diagonal elements in Es represent the biological species consumed per unit of total output in each industry of country s, i.e., biological species threatened by production activities in each industry of country s/total output in each industry of country s. Wag refers to the direct threat to species due to production in each industry. The rows of the Wag matrix are summed to obtain a 1 × 4888 row vector. Each vector element is divided by the corresponding national industrial output to obtain a biodiversity depletion coefficient, placed on the diagonal of the matrix to obtain the biodiversity depletion coefficient matrix E.
The biodiversity footprint matrix F quantifies the indirect threats to species caused by final consumers; thus, the biodiversity footprint is extended from domestic to foreign countries. Based on Leontief’s input–output analysis, we found that the biodiversity footprint of a country’s exports can be obtained by summing the row elements of the F matrix. The biodiversity footprint of a country’s imports can be obtained by summing the column elements. Moreover, the biodiversity footprint of each country’s domestic consumption can be obtained by summing the diagonal elements. The net biodiversity footprint of each country measured in this study is equal to exports minus imports of biodiversity, with a positive value indicating that the country is a net biodiversity exporter and vice versa for importers.
The world economy is universally connected. According to the basic theory of international trade, total exports are equal to total imports. The same conclusion applies to biodiversity imports and exports. The sum of the net export values of net exporters and the sum of the net import values of net importers are equal in absolute terms (i.e., they add up to zero). To ensure the accuracy of the data, we followed the aforementioned steps for validation. The export value for all net exporters is 165891371.2 and the import value for all net importers is −165900445.3. The sum is −9074.086152, which accounts for 5.469E-05 of the import or export values. Therefore, we can confirm that the calculation of the biodiversity footprint is correct.
4 Results and discussion
4.1 Analysis of biodiversity footprints
Based on an MRIO model, this study measures the global biodiversity flows from a consumption perspective. The biodiversity footprints of 188 countries/regions worldwide are systematically accounted for, with positive values being net biodiversity exports (indicating intra-regional biodiversity damage) and negative values being net biodiversity imports (indicating intra-regional biodiversity benefits). Our empirical study answers four main questions that provide information to clarify the impact of international trade as a driving force on biodiversity and suggest mitigation activities that reduce biodiversity loss. First, which regions suffer most from biodiversity damage from international trade? Second, did the spatial distribution patterns and changes in the location of these damaged countries shift over the period examined? Third, if shifts occurred, how did their spatial evolution and transfer pathways change? Fourth, which countries and sectors are most affected by biodiversity flows during international trade and commerce? These four questions will be answered individually in the following sections.
4.1.1 Results of the biodiversity footprint measurement
Based on the results of the biodiversity footprint measurement, this study classifies the biodiversity loss in 188 countries/regions worldwide into six levels. International trade has driven the transfer and flow of biodiversity resources within the different regions of the world during the study period, having different impacts on different countries and causing clear regional differences. The number of net importers of biodiversity in Asia and Europe is much larger than the number of net exporters. Canada, the United States, and Mexico are the main importers of biodiversity in North America, and Central America (south of Mexico) is mostly an exporter. Africa has a high concentration of net biodiversity exporters, especially in low-income countries on both sides of the equator, where biodiversity is more severely damaged.
Figure 1 shows the spatial distribution pattern of biodiversity footprints at the global scale. There are clear unbalanced characteristics; hence, it is necessary to further investigate the extent of the spatial imbalance. At present, academics focus on biodiversity loss caused by international trade; while a few scholars analyze the decomposition of biodiversity trade chains in the international trade process, systematic research on the spatial distribution characteristics and evolutionary transfer pathways of biodiversity damage remains scarce.
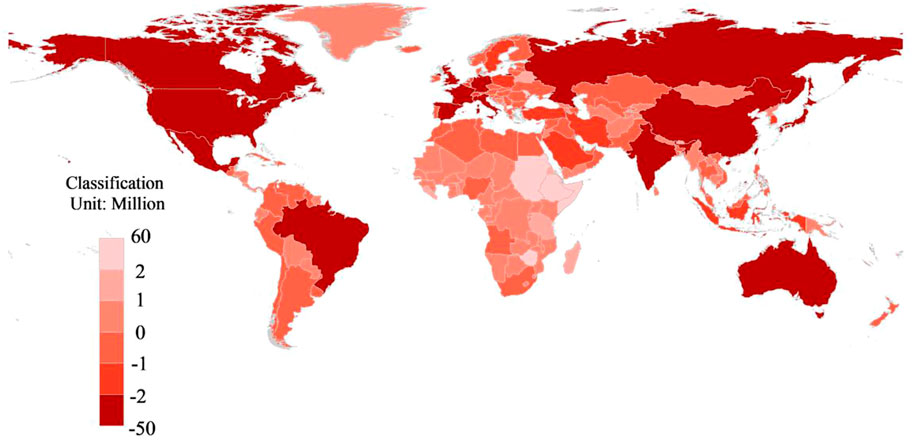
FIGURE 1. Global biodiversity footprint distribution of 188 countries/regions. Note: The value is calculated based on the average of the net import and export footprints of biodiversity in each country.
4.1.2 Spatial distribution pattern analysis
Using spatial statistics, we bridge the gap in research on spatial distribution patterns and investigate the spatial distribution and evolutionary transfer of global biodiversity damage. Drawing on the ideas of Corrado-Gini and other scholars, the Theil index, GINI coefficient, and log deviation mean are introduced to measure the degree of spatial non-equilibrium and its variation in the upper, middle, and bottom biodiversity footprints, respectively. The larger the value, the greater the regional variation, which means the greater the degree of spatial non-equilibrium as well. By measuring the aforementioned indicators, a more precise analysis of regional differences in trade-induced biodiversity loss at different levels worldwide is possible. Among them, the Theil index (T), GINI coefficient (G), and log deviation mean (LI) are calculated using the following equations:
where n represents the number of samples, bi represents the biodiversity footprint of the ith country after ranking the net biodiversity footprint from the lowest to highest, bi is the net biodiversity footprint of each region, and B is the average value of the overall net biodiversity footprint. The trends of the spatial non-equilibrium degree of the biodiversity footprint from 2006 to 2015 are shown in Figure 2.
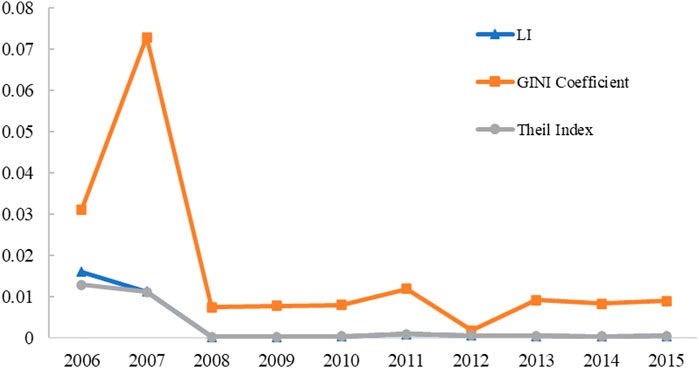
FIGURE 2. Trend of GINI coefficient, Theil index and LI.
Between 2006 and 2015, the Theil index and mean log deviation showed a basically consistent trend of change, indicating that the regional differences at the two ends of the biodiversity loss level had the same trend; hence, their spatial non-equilibrium degree showed a simultaneous expansion or reduction. Conversely, the GINI coefficients exhibited larger fluctuations and had clearer characteristics by year. Moreover, compared with the Theil index and log deviation mean, the GINI coefficient had relatively large values, implying that the spatial non-equilibrium degree was relatively large in the regions where biodiversity loss was at the middle level, whereas the degree in the regions at the two ends was relatively small. Specifically, from 2006 to 2008, both the Theil index and the mean log deviation showed a significant decreasing trend, indicating that the spatial disequilibrium of areas at both ends of the biodiversity loss scale tended to decrease. The GINI coefficient showed an increasing and then decreasing trend, indicating that the differences between areas with intermediate levels of biodiversity loss tended to increase and then decrease during these 3 years. The GINI coefficients showed some fluctuations, but they eventually stabilized, implying that the spatial disequilibrium was gradually maintained. In general, the GINI coefficient, Theil index, and log deviation mean values all decreased during the study period, indicating that the regional differences in biodiversity loss tended to decrease.
On this basis, this study further attempts to analyze the spatial distribution characteristics of the biodiversity footprints at the continental level using the Theil index. According to the formula, the Theil index of global biodiversity footprints in six continents in 2006–2015 was calculated (Supplementary Appendix Table S1) and the corresponding trend analysis was carried out.
As shown in Figure 3, the changes in the Theil index in Asia, Europe, Oceania, and South America were relatively small and tended to be flat overall during the study period. Specifically, they can be divided into the following stages: decline (2006–2008), small recovery (2008–2011), and slight decline and leveling off (2011–2015). This indicates that the spatial non-equilibrium of the biodiversity footprints of the aforementioned four continents showed a trend of first narrowing, then slightly expanding, then narrowing, and finally leveling off. From 2006 to 2015, the Theil indices of North America and Africa showed relatively large changes, mainly around 2008. From 2006 to 2008, the Theil indices of North America and Africa experienced significant decreases of 97% and 99%, respectively. This indicates that the spatial non-equilibrium between the North American and African biodiversity footprints reduced significantly during this period. The overall global spatially uneven degree of biodiversity showed a relatively consistent trend with the changes in North America and Africa, which also underwent significant changes in 2008. This may be related to the exceptional international economy in 2008. The outbreak of the financial crisis severely affected investment and consumption globally, especially in the United States, leading to a significant decline in demand, which had a huge impact on international trade and economic growth. As a result, the worldwide loss of biodiversity from international trade reduced in 2008. As Africa is a major source and exporter of raw materials such as U.S. ore and is particularly vulnerable to the U.S. economic situation and international trade, this may explain the similar trends in biodiversity footprint changes in Africa and North America.
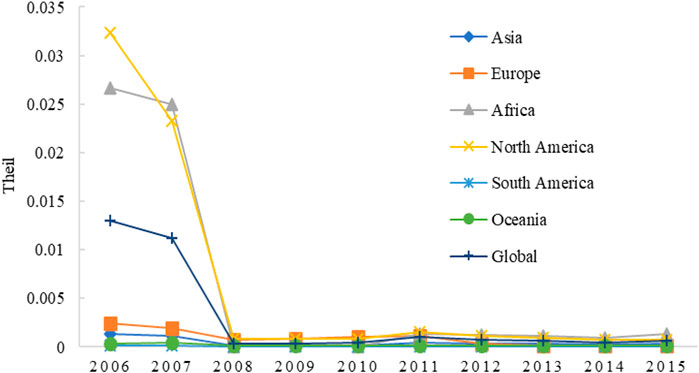
FIGURE 3. Global and six continents Theil index trends.
4.1.3 Spatial evolution and transfer path analysis
After clarifying the spatial disequilibrium of the global biodiversity footprint and degree of regional disequilibrium, this study analyzes the spatial evolution trajectory of the biodiversity footprint of net exporting countries. The analysis is based on Figure 2 using the center of gravity and standard deviational ellipse methods. The spatial distribution of the biodiversity footprints of net exporting countries from the perspective of trade is shown in Table 1.
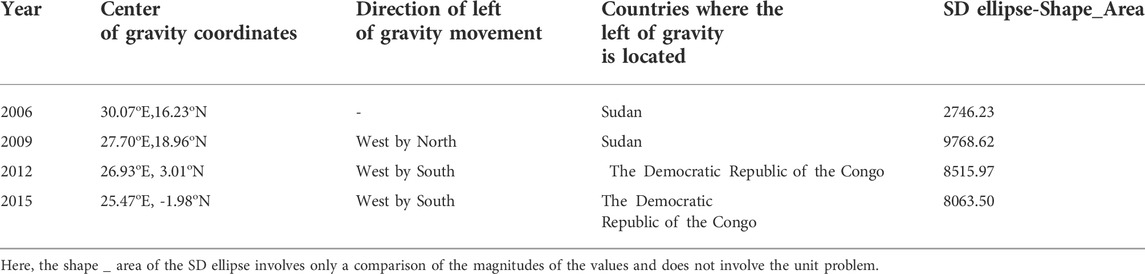
TABLE 1. Spatial attributes of biodiversity footprints.
The center of gravity of the biodiversity loss induced by international trade is mainly located between 25.47°E–30.07°E and –1.98°N–18.96°N, spanning approximately 4.6° from east to west and 20.9° from north to south. From the distribution range of the center of gravity, we observe that the global biodiversity imbalance is highly clustered in the east–west direction and more dispersed in the north–south direction. This may be highly correlated with the distribution characteristics of the natural climate and geography. Overall, there is a huge difference in biological species between the north and south, but relatively less heterogeneity between the east and west. The fact that the center of gravity of global biodiversity loss is in Africa is partially an indication that Africa is the hardest hit region in the world. As a high-risk region, Africa’s international trade pattern and structure need to be urgently adjusted; otherwise, there will be disastrous consequences. From the trajectory and direction of the center of gravity, in 2006 and 2009, the center of gravity of biodiversity exports was in Sudan. In 2012 and 2015, the center of gravity of global biodiversity exports gradually shifted to the southwest, crossing the equator, and shifting to the Democratic Republic of the Congo. This suggests that global biodiversity loss due to trade exports is increasingly prominent in the southwest; this is possibly because of deteriorating or expanding international trade. The standard deviational ellipse coverage first experienced an extreme expansion from 2006 to 2009 owing to the radiation effect of the financial crisis and then showed a gradual decrease from 2009 to 2015, which indicated that the spatial distribution characteristics of global biodiversity exporters experienced discrete and then clustered development. Without the influence of external factors, the coverage area in the later period may further shrink and the risk area may be further concentrated.
Based on the aforementioned analysis, the top 14 net importers of biodiversity globally (Figure 1) are further selected and linked to biodiversity exporters. Tracing the major importers of these countries through the trade chain, finding the top 10 importers of each country, and matching them one by one allow us to map the trade routes of the 14 major net biodiversity importers (see Figure 4).
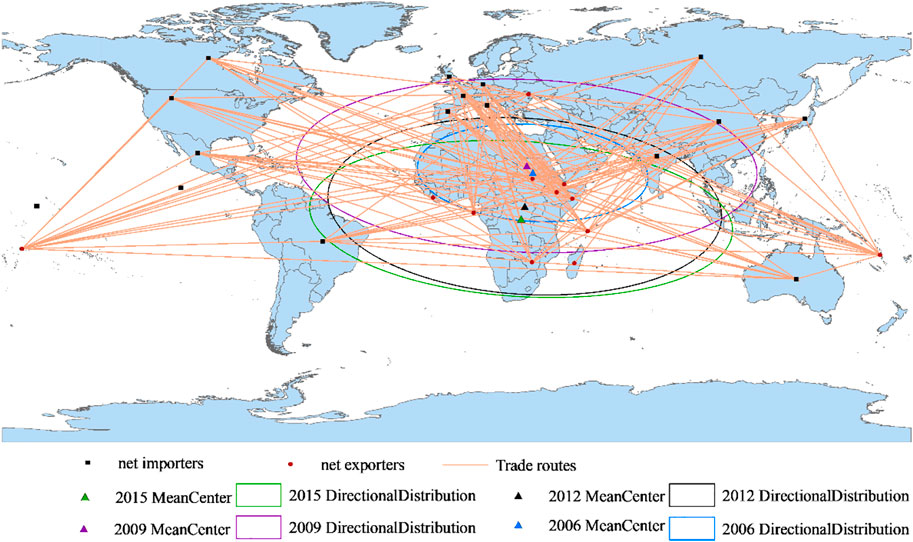
FIGURE 4. International trade routes for biodiversity risks associated with traded commodities.
Figure 4 plots the trade routes between countries, starting with net biodiversity importers and ending with net biodiversity exporters, reflecting the impact of the demand of final consumer countries on the biodiversity of other countries in the trade process. The international supply chains driven by international trade are intricate and intertwined. Most net importers of biodiversity are developed countries or economically powerful developing countries, whereas net exporters of biodiversity are mainly economically backward developing countries. Nine of the top 10 net exporters of biodiversity in Figure 4 are African countries. These countries are generally downstream in the division of labor in the global value chain, relying mainly on the export of raw materials and processing low-tech primary products in international trade to obtain economic benefits. This way of participating in global value chains and adopting the economic development model of GDP growth at the expense of the environment has caused great damage to the ecological environments of these countries.
On a global scale, final consumer demand from developed countries is the main driver of global biodiversity loss. Production activities and the resulting biodiversity loss in developing countries serve to satisfy the final demand of consumers in other countries (especially developed countries). The extraction of trade routes reveals that the trade trajectory of net biodiversity exporters, typically represented by low-income African countries, has a diverging trend outward. Consumer demand from Europe and the United States may have increased, thus exacerbating the claim on biodiversity in Africa through trade. The high net export value of the biodiversity footprint of Africa during the study period suggests that international trade is responsible for the increased biodiversity risk in Africa. To protect the ecological environment and biodiversity, developed countries and some developing countries have transferred industries with lower technological content, comparatively serious ecological damage, and environmental pollution to countries or regions with lax environmental controls and relatively backward economies. Thus, trade imports can make these countries meet their own needs and at the same time ensure the maximum protection of their biological resources and natural environment. This means that international trade is in effect exacerbating the biodiversity risk of low-income countries such as those in Africa, causing them to suffer more biodiversity loss.
4.2 Analysis of biodiversity footprints at the country and sectoral levels
4.2.1 Country level
To clarify the spatial characteristics of the biodiversity footprint, this study further focuses on the major exporters and importers globally. Owing to space limitations, we select 14 importing countries at the first level and 11 exporting countries at the sixth level according to the different levels explained in Section 3.1. The proportion of these two groups of countries in global biodiversity import and export trade reached 77%, which is representative. The net value of the import and export of the biodiversity footprints of the 25 countries is shown in Figure 5.
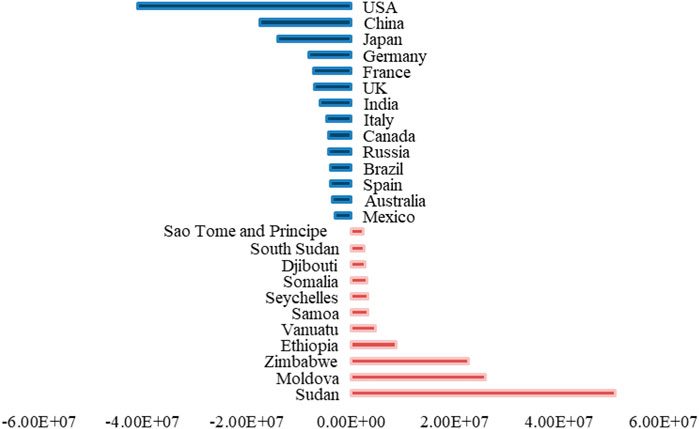
FIGURE 5. Top net importers and exporters of biodiversity threats. Note: The scores were calculated from the average value of the scores in each country from 2006 to 2015. Negative values indicate net imports of biodiversity, whereas positive values indicate net export of biodiversity.
This study finds that nine developed countries (e.g., United States, Japan) and five developing countries (e.g., China, India) pose a great threat to the biodiversity of low-income countries through international trade. All these countries are large importing countries. They are either highly developed and at the top of the international division of labor value chain by virtue of their technological and brand advantages, thus making low-income countries bear a large number of material production links of the goods they consume, or large developing countries with large populations and rapid economic development, with great potential for upward mobility and expanding material consumption. To meet domestic consumption and investment needs, they import a large amount of commodities through international trade, which indirectly leads to biodiversity loss in exporting countries.
Among the top countries, the United States has approximately a quarter of the world’s biodiversity import footprint, and its net import value is as high as 4.09E+07. As the most developed economy in the world, its highly developed society has a huge negative external impact on biodiversity without paying the corresponding price. China, India, Russia, Brazil, and Mexico are constrained by their economic development stage, mode, and technical level. They are still unable to take into account their biodiversity footprint. Therefore, they also have a relatively negative impact on the biodiversity footprint worldwide.
Until 2015, among the 188 countries/regions in the sample, 107 were net exporters of biodiversity and all were developing countries. In particular, countries such as Sudan, Moldova, and Zimbabwe, which are classified at the sixth level, are developing countries with low economic development. The economic development and science and technology in these countries lag those in developed countries; indeed, they are even lower than those of many developing countries. The most urgent task in these countries is to improve people’s basic needs rather than protect the environment and biodiversity of the international community. Moreover, the biodiversity problem of such low-income countries has not been rigidly addressed by the Convention on Biological Diversity. Therefore, driven by global trade, these countries have gradually developed into a destination for more developed countries to transfer their responsibilities for energy consumption and biodiversity. According to our calculations, among the net exporters of biodiversity, Sudan suffers the greatest loss of biodiversity. Its exported biodiversity accounts for 30.66% of the world’s total export value, and its net export footprint is 5.09E+07. Biodiversity in China has also been seriously damaged. If this is not controlled, the national ecosystem will collapse in the long term.
Considering that the world’s major economies have the greatest impact on biodiversity, this study analyzes the biodiversity footprints of the top 10 countries by GDP in 2015. The economic development of a country or region is closely related to the import and export trade of its biodiversity.
Figure 6 shows that the top 10 countries in GDP, whether developed countries such as the United States and Japan or developing countries such as China and India, are typical net importers of biodiversity. From 2006 to 2015, the net imports of biodiversity in these countries showed a downward trend. Around 2008, imports of biodiversity in various countries changed significantly. From 2006 to 2008, they showed a relatively rapid downward trend. From 2008 to 2011, they showed a relatively slow upward trend. In 2008, net imports of biodiversity in most countries dropped to their lowest values during the study period. This may be related to the 2008 global financial crisis. Under the impact of the financial crisis, the economic growth rate of countries, especially the United States, gradually slowed and economies shrunk. The economic recession inevitably led to a decline in demand for oil, minerals, rubber, and other commodities as well as industrial products, daily necessities, and other ordinary commodities. Shrinking demand for production and consumption weakens the impact of these countries on biodiversity in the trade supply chain, thus reducing net imports of biodiversity.
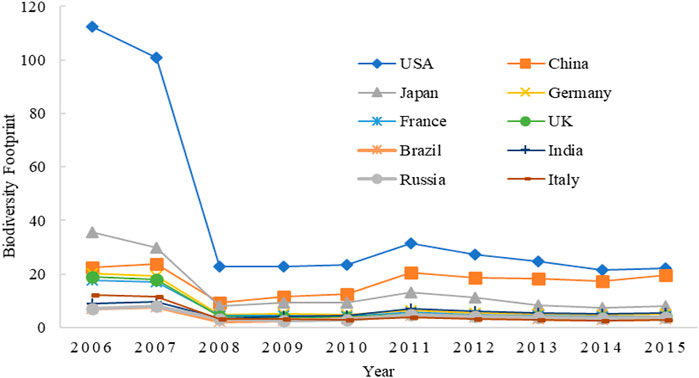
FIGURE 6. Time dynamic trend analysis of the net value of biodiversity import and export in the top ten countries of world GDP.
With the steady recovery of the world economy, the net imports of biodiversity in various countries also gradually increased, but they remained below the import level before the crisis. From 2011 to 2014, the biodiversity imports of the aforementioned countries showed a downward trend. The 10th meeting of the Conference of the Parties to the Convention on Biological Diversity (held in 2010) adopted the Strategic Plan for Biodiversity from 2011 to 2020. The meeting put forward the 2020 global biodiversity target, which urged countries to incorporate biodiversity indicators into national strategies under the overall framework of the Aichi target, to strengthen measures in species and ecosystem protection and environmental pollution reduction as well as reduce the threats and pressures faced by biodiversity. From 2014 to 2015, net imports of biodiversity in various countries fluctuated again, indicating a negative outlook for global biodiversity. The realization of the Aichi target of biodiversity requires continuous effort from all countries.
Although the 10 countries had the same changing trend during the study period, there were significant differences in the net import footprint and growth rate of biodiversity. Specifically, although the net import of biodiversity in the United States decreased from 1.12E+08 in 2006 to 2.20E+07 in 2015, it always ranked first. China’s net import of biodiversity ranked second after it surpassed that of Japan in 2008. After the financial crisis, China, India, and other emerging economies assumed an increasing proportion of the global economy and became an important force to promote the recovery and growth of the world economy. The extensive development mode and gradually restored production and consumption demands of developing countries increased net imports of biodiversity after 2008. Therefore, after 2008, China’s net import of biodiversity far exceeded that of Japan. The net imports of biodiversity in China, India, and Brazil increased by 24.06%, 13.72%, and 10.05%, respectively in 2009, showing a clear upward trend. Germany, France, the United Kingdom, and Italy were close behind Japan in terms of net imports of biodiversity; they ranked relatively high. India, Brazil, and Russia had similar net imports of biodiversity, ranking relatively low. Overall, the net imports of biodiversity in most developed countries were larger than those in developing countries.
4.2.2 Sectoral level
The trade links described in previous studies are limited to the national level and have not yet reached the sectoral level. What are the commonalities and heterogeneities of the impacts of different sectors in different countries on biodiversity? Incorporating the biodiversity footprint into various sectors and making it a required focus for each sector are not only refinements of national research, but also important support for the implementation of relevant policies. Therefore, it is of great significance to clarify the threats of different countries’ sectors to biodiversity to formulate targeted biodiversity conservation measures. In this light, this study further calculates the biodiversity footprints of 26 sectors in the 188 countries/regions based on the MRIO model and performs a visual analysis of the threatening sectors within importing countries (Figure 7).
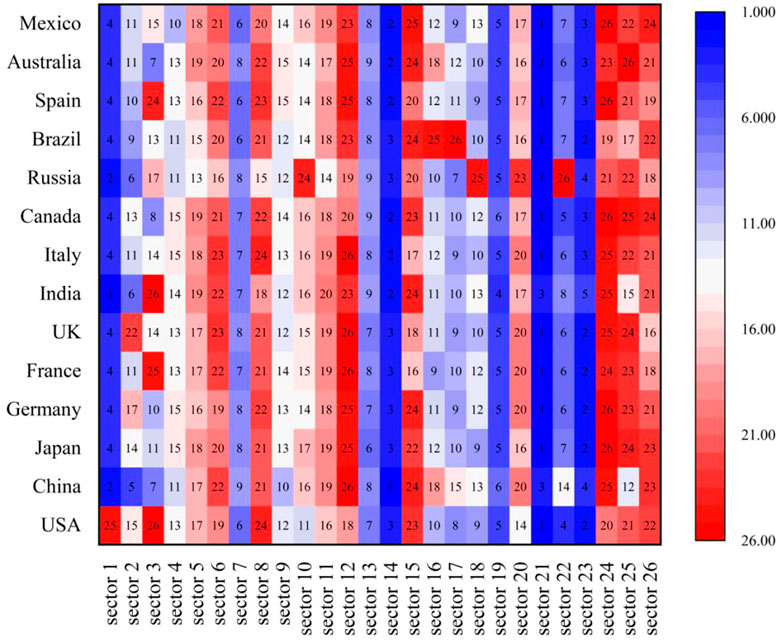
FIGURE 7. Biodiversity net importing countries sectoral threat ranking. Note: See Supplementary Appendix Table S2 for the specific corresponding department names; the ranking of chromaticity bands represents the severity of threats from departments; the numbers in the squares represent the ranking of threats to biodiversity from 26 departments in this country.
Figure 7 ranks the top 14 sectors that threaten biodiversity in countries and regions in international trade. Overall, the top four sectors that threaten biodiversity are Sector 21 (Financial Intermediation and Business Activities), Sector 23 (Education, Health, and Other Services), Sector 14 (Construction), and Sector 1 (Agriculture). As expected, Sector 14 (Construction) and Sector 1 (Agriculture) pose a direct threat to biodiversity because of agricultural production, logging, and other activities. However, it is surprising that Sector 21 (Financial Intermediation and Business Activities) and Sector 23 (Education, Health, and Other Services) pose a serious threat to biodiversity. The impacts of these two factors on biodiversity may manifest in more complicated indirect forms. On the one hand, Sector 21 (Financial Intermediation and Business Activities), as the core of the economic prosperity of net importing countries, is an important driving force for the globalization of production and international trade. Although the prosperity of Sector 21 (Financial Intermediation and Business Activities) does not lead to the direct loss of biodiversity, it is the final cause of its present stage. On the other hand, the science and technology behind Sector 23 (Education, Health, and Other Services) is still driving environmental pollution and the loss of biological resources. In the absence of social concerns, with the rapid transformation of scientific and technological achievements to productivity, the negative impact of Sector 23 (Education, Health, and Other Services) on biodiversity has become severe.
Further analysis shows that different sectors threaten biodiversity in different countries. For example, Sector 1 (Agriculture), which ranks high among the other 13 countries, is one of the sectors with the least impact on biodiversity in the United States. Whereas in other countries, Sector 3 (Mining and Quarrying) has a lower impact on biodiversity, it has a greater impact on biodiversity in China, Australia, and Canada. This is because all three countries have large mining sectors. To a certain extent, this analysis of net importing countries shows the important sectors that have negatively influenced biodiversity globally. Next, this study systematically analyzes the ranking of the impacts of the various sectors of net exporting countries on biodiversity (Figure 8).
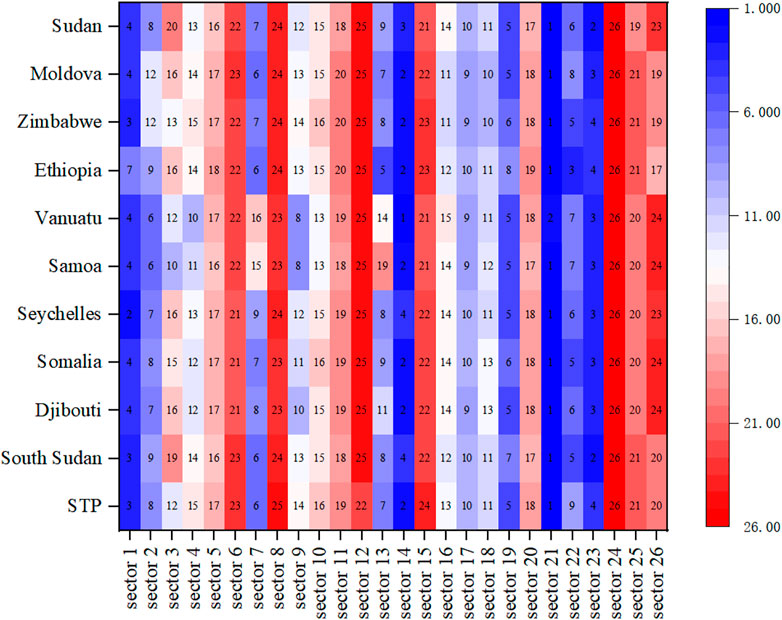
FIGURE 8. Biodiversity net exporting countries sectoral threat ranking.
It can be seen from Figure 8 that among the sectors of the net exporters of biodiversity, the top four are still Sector 21 (Financial Intermediation and Business Activities), Sector 14 (Construction), Sector 23 (Education, Health, and Other Services), and Sector 1 (Agriculture). Compared with net importing countries, there is no significant structural change overall, except for a small shift in ranking. This shows that with the continuous advancement of globalization, the impact of biodiversity is no longer confined within countries. The analysis also shows some of the common characteristics in the world. For net importing countries, although Sector 21 (Financial Intermediation and Business Activities) and Sector 23 (Education, Health, and Other Services) are relatively backward, the output value may be relatively low. However, its unfavorable position in the world economic chain may further aggravate its negative impact on biodiversity; hence, the threat is still high. Sector 14 (Construction) and Sector 1 (Agriculture) have a significant negative impact on biodiversity. In the net exporting and net importing countries studied, the two sectors with the least threat to biodiversity are Sector 24 (Private Households) and Sector 12 (Recycling). This shows that these two industries have eco-friendly properties. Overall, the ranking of sectoral threats in both net importers and net exporters shows a certain degree of consistency. This shows that although some sectors in different countries have different impacts on biodiversity, the attributes and characteristics of sectors play a more decisive role in their impact on biodiversity overall.
5 Conclusion and policy implications
This study finds that extreme inequality in the international trade chain is behind the unbalanced global biodiversity footprint. Developed countries are in the high end of global industrial chain and value chain, and technology-intensive industries dominate, so the negative environmental externalities of such industrial activities are small and the loss of biodiversity is relatively limited. Developing countries are in the low end of the global industrial chain and value chain, undertaking most of the labor or resource-intensive industries that are outsourced by developed countries. The negative externalities of such industrial activities are large, which accelerate the loss of domestic biodiversity. On the one hand, countries with damaged biodiversity rely on exporting products with high biodiversity costs to reduce poverty and develop economically. On the other hand, owing to the influence of the industrial structure, resource endowment, and economic characteristics, the circulation mode of biodiversity is solidified to a certain extent. Moreover, it is difficult to change in a short period of time. Therefore, in this unequal trade chain, the loss of biodiversity is mostly borne by producers in low-income countries, which poses a serious threat to them.
Compared with previous study, we used MRIO model to measure biodiversity footprint, which can be analyzed to trace biodiversity loss caused by implicated commodities’ trade. In this way, the description of biodiversity loss driven by international trade will be more accurate and the definition of responsibility for biodiversity loss will be more equitable. Meanwhile, this study also extends the research level from nation to sector, and mainly discusses the implied biodiversity flows in international trade in different types of countries and industries. Thus, we find that the world’s biodiversity footprint is characterized by a significant spatial non-equilibrium. Financial intermediation and business activities, education, health, and other services, and construction and agriculture sectors play an important role in the accounting scheme for biodiversity loss. Based on this, the study proposes the following policies and suggestions.
First, we focus on the unbalanced spatial distribution of biodiversity loss and advocate for the establishment of a fair and reasonable global responsibility mechanism. According to this research, there is a significant spatial imbalance in global biodiversity damage. Driven by international trade, low-income developing countries in Africa and South America bear the responsibility of serious biodiversity damage, while developed countries in Europe and North America are the main beneficiaries of international trade. We should not judge the global biodiversity loss responsibility only from the perspective of producers, but also consider this issue from the consumer side and attempt to establish a fair and reasonable global biodiversity loss responsibility mechanism. We should gradually narrow the regional gap of biodiversity loss and clarify the responsibilities and obligations that countries and regions should bear to address the global biodiversity loss problem. On this basis, we should strengthen cross-regional cooperation in biodiversity conservation and promote coordinated development to mitigate regional biodiversity loss.
Second, we need to strengthen the supervision of the financial and scientific and technological research and development sectors. This would require eliminating the negative impact of illegal financial activities and destructive technology research and development on biodiversity as well as moderately controlling legal financial activities and transforming technological achievements that are harmful to biodiversity. At present, the impact of financial activities and technological transformation on the natural environment has not attracted broad attention. Even less is known about the damage to biodiversity and impact of wildlife trade. However, the results of this study show that the aforementioned two sectors pose the highest threat to biodiversity among the 26 sectors studied. Therefore, we should pay attention to the biodiversity risks caused by financial and scientific research activities, allow more regulators to participate, and implement shared responsibility among all participants to jointly maintain global biodiversity and ecological stability.
Third, we need to strengthen the supervision of the external influence of international trade activities in developed countries and increase their financial funds for biodiversity conservation. From the data analysis, the economic development of developed and developing countries is achieved at the expense of biodiversity loss in economically backward countries to a certain extent. According to the literature, the proportion of threatened species decreases by approximately 0.57% every year for every 1 billion dollars invested in biodiversity conservation (Newbold et al., 2015). Studies have shown that owing to the lack of government control over wildlife trade and ecosystem degradation and the shortage of financial resources provided by them, biodiversity in Africa has suffered the most from international trade. Therefore, it is necessary to focus on strengthening investment in Africa’s biodiversity, which can also maintain the stability of the global ecosystem.
Finally, we should strengthen biodiversity conservation cooperation among countries and regions worldwide and attach importance to the strength of non-governmental organizations. Under the auspices of economic globalization, the problem of biodiversity loss is not only the problem of a specific country, but also a problem related to the entire society. Therefore, it is necessary to strengthen strategic cooperation between countries and regions to avoid the adverse impact of policy conflicts. In addition, considering the characteristics of non-governmental organizations, such as public welfare and flexibility, especially their unique advantages in transcending narrow nationalism, we should give full play to the coordination and communication role of such organizations in the transnational cooperation of biodiversity conservation globally.
Through our study, we found that biodiversity loss has become a global crisis and that conservation efforts need more concerted cooperation among countries. However, future conservation efforts may face a series of problems and challenges such as political obstacles, a shortage of funds for conservation, and conflicts between economic development and conservation. In conclusion, there is still a long way to go for biodiversity conservation. Six key issues remain to be solved.
First, the circulation of materials and flow of energy in an ecosystem are accomplished through an intricate food chain. If the level of biodiversity in a region decreases owing to international trade or other reasons and the food chain in a stable state is interrupted, existing species may form new habitats and food competition patterns. This study discussed the direct impact of international trade on biodiversity, but has no further discussion on the subsequent food chain. We can focus on some species-specific to analyze the indirect influence of international trade on biodiversity through food chain in the future.
Second, in the treatment of the causes of biodiversity threats in this study, the issue of biological invasion brought about by international trade is ignored. However, biological invasion can disrupt ecosystems that were originally in a stable state. If we further consider the invasion of alien species brought about by international trade, as they do not belong to the local ecosystem, they inevitably affect the original species in the regional ecosystem. On the one hand, they may lack the species to restrain them and expand rapidly; on the other hand, the alien species may prey on or limit the survival space of local species. How to measure this phenomenon through quantitative models is a question worthy of further study and exploration.
Third, we just evaluate and compare the biodiversity footprints of 188 countries/regions, then analyze biodiversity loss caused by international trade from sector perspective. In fact, modeling and evaluating the impact of different influencing factors on biodiversity and their intrinsic mechanisms are also important, which was not mentioned in the article. This is the key work of our group in future exploration.
Fourth, in recent years, the deepening fragmentation of international production and expanding scope of trade have greatly promoted the development of trade in biodiversity-related intermediate products in various countries, making the impact of intermediate products on biodiversity in each country increasingly important. However, in our accounting model, we only focus on the impact of final consumer goods; we do not measure or account for the trade in biodiversity intermediate products. Therefore, subsequent research should continue to advance this aspect, focusing on both final consumption and intermediate trade related to biodiversity.
Fifth, there may be a significant lag in the scale and extent of damage to global biodiversity caused by the dramatic increase in international trade, and the damage to ecosystems may take decades to become apparent. Therefore, an effective biodiversity loss prediction model can serve as an antecedent warning for global biodiversity damage. We attempted to distinguish the different stages of biodiversity trade evolution in countries/regions, so that future biodiversity evolution trends can be predicted. The exploration of biodiversity evolution trends is positive and meaningful, but the work is still in progress because of data collection and processing problems.
Sixth, this study found that large economic fluctuations have a significant impact on biodiversity issues triggered in international trade; for example, the 2008 financial crisis changed the trade structure of many countries, which resulted in important changes in the import and export values of biodiversity footprints in each country. It is thus necessary to explore whether the spread of the coronavirus epidemic in 2020 will affect global biodiversity issues, whether a new pattern of biodiversity imports and exports will be formed after the epidemic, and whether the original pattern of biodiversity spatial evolution will be disrupted.
Data availability statement
The raw data supporting the conclusion of this article will be made available by the authors, without undue reservation.
Author contributions
XL: conceptualization, methodology, data processing, and writing (original draft); LX: visualization, investigation, supervision, and writing (review and editing); ZZ: data collection, formal analysis and language edit; YZ: data collection, validation, and writing (review and editing).
Conflict of interest
The authors declare that the research was conducted in the absence of any commercial or financial relationships that could be construed as a potential conflict of interest.
Publisher’s note
All claims expressed in this article are solely those of the authors and do not necessarily represent those of their affiliated organizations, or those of the publisher, the editors and the reviewers. Any product that may be evaluated in this article, or claim that may be made by its manufacturer, is not guaranteed or endorsed by the publisher.
Supplementary material
The Supplementary Material for this article can be found online at: https://www.frontiersin.org/articles/10.3389/fenvs.2022.1000970/full#supplementary-material
References
Acquaye, A., Feng, K., Oppon, E., Salhi, S., Ibn-Mohammed, T., Genovese, A., et al. (2017). Measuring the environmental sustainability performance of global supply chains: A multi-regional input–output analysis for carbon, sulphur oxide and water footprints. J. Environ. Manage. 187, 571–585. doi:10.1016/j.jenvman.2016.10.059
Arneth, A., Shin, Y. J., Leadley, P., Rondinini, C., Bukvareva, E., Kolb, M., et al. (2020). Post-2020 biodiversity targets need to embrace climate change. Proc. Natl. Acad. Sci. U. S. A. 117 (49), 30882–30891. doi:10.1073/pnas.2009584117
Bar-on, Y. M., Phillips, R. M., and Milo, R. (2018). The biomass distribution on Earth. Proc. Natl. Acad. Sci. U. S. A. 115 (25), 6506–6511. doi:10.1073/pnas.1711842115
Blicharska, M., Smithers, R. J., Mikusiński, G., Rönnbäck, P., Harrison, P. A., Nilsson, M., et al. (2019). Biodiversity’s contributions to sustainable development. Nat. Sustain. 2 (12), 1083–1093. doi:10.1038/s41893-019-0417-9
Ceballos, G., Ehrlich, P. R., and Raven, P. H. (2020). Vertebrates on the brink as indicators of biological annihilation and the sixth mass extinction. Proc. Natl. Acad. Sci. U. S. A. 117 (24), 13596–13602. doi:10.1073/pnas.1922686117
Chang, J., Symes, W. S., Lim, F., and Carrasco, L. R. (2016). International trade causes large net economic losses in tropical countries via the destruction of ecosystem services. Ambio 45 (4), 387–397. doi:10.1007/s13280-016-0768-7
Chaudhary, A., and Brooks, T. M. (2019). National consumption and global trade impacts on biodiversity. World Dev. 121, 178–187. doi:10.1016/j.worlddev.2017.10.012
Chaudhary, A., Pfister, S., and Hellweg, S. (2016). Spatially explicit analysis of biodiversity loss due to global agriculture, pasture and forest land use from a producer and consumer perspective. Environ. Sci. Technol. 50 (7), 3928–3936. doi:10.1021/acs.est.5b06153
Dai, Y. P., Peng, G., Wen, C., Zahoor, B., Ma, X., Hacker, C. E., et al. (2021). Climate and land use changes shift the distribution and dispersal of two umbrella species in the Hindu Kush Himalayan region. Sci. Total Environ. 777, 146207. doi:10.1016/j.scitotenv.2021.146207
Driscoll, D. A., Bland, L. M., Bryan, B. A., Newsome, T. M., Nicholson, E., Ritchie, E. G., et al. (2018). A biodiversity-crisis hierarchy to evaluate and refine conservation indicators. Nat. Ecol. Evol. 2 (5), 775–781. doi:10.1038/s41559-018-0504-8
Gereffi, G., and Frederick, S. (2010). The global apparel value chain, trade and the crisis: Challenges and opportunities for developing countries. Washington, D.C.: World Bank Policy Research Working Paper, 5281. doi:10.1596/1813-9450-5281
Girardello, M., Santangeli, A., Mori, E., Chapman, A., Fattorini, S., Naidoo, R., et al. (2019). Global synergies and trade-offs between multiple dimensions of biodiversity and ecosystem services. Sci. Rep. 9 (1), 5636. doi:10.1038/s41598-019-41342-7
Gray, T. N. E., Hughes, A. C., Laurance, W. F., Long, B., Lynam, A. J., O’Kelly, H., et al. (2018). The wildlife snaring crisis: An insidious and pervasive threat to biodiversity in Southeast Asia. Biodivers. Conserv. 27 (4), 1031–1037. doi:10.1007/s10531-017-1450-5
Green, J. M. H., Croft, S. A., Durán, A. P., Balmford, A. P., Burgess, N. D., Fick, S., et al. (2019). Linking global drivers of agricultural trade to on-the-ground impacts on biodiversity. Proc. Natl. Acad. Sci. U. S. A. 116 (46), 23202–23208. doi:10.1073/pnas.1905618116
Hugé, J., de Bisthoven, L. J., Mushiete, M., Rochette, A., Candido, S., Keunen, H., et al. (2020). EIA-driven biodiversity mainstreaming in development cooperation: Confronting expectations and practice in the DR Congo. Environ. Sci. Policy 104, 107–120. doi:10.1016/j.envsci.2019.11.003
Joppa, L. N., O’Connor, B., Visconti, P., Smith, C., Geldmann, J., Hoffmann, M., et al. (2016). Filling in biodiversity threat gaps. Science 352 (6284), 416–418. doi:10.1126/science.aaf3565
Kok, A., Oostvogels, V. J., de Olde, E. M., and Ripoll-Bosch, R. (2020). Balancing biodiversity and agriculture: Conservation scenarios for the Dutch dairy sector. Agric. Ecosyst. Environ. 302, 107103. doi:10.1016/j.agee.2020.107103
Lenzen, M., Moran, D., Kanemoto, K., Foran, B., Lobefaro, L., and Geschke, A. (2012). International trade drives biodiversity threats in developing nations. Nature 486 (7401), 109–112. doi:10.1038/nature11145
Moran, D., and Kanemoto, K. (2017). Identifying species threat hotspots from global supply chains. Nat. Ecol. Evol. 1 (1), 0023. doi:10.1038/s41559-016-0023
Newbold, T., Hudson, L. N., Hill, S. L., Contu, S., Lysenko, I., Senior, R. A., et al. (2015). Global effects of land use on local terrestrial biodiversity. Nature 520 (7545), 45–50. doi:10.1038/nature14324
Rahman, M. M., Jiang, Y., and Irvine, K. (2018). Assessing wetland services for improved development decision-making: A case study of mangroves in coastal Bangladesh. Wetl. Ecol. Manag. 26 (4), 563–580. doi:10.1007/s11273-018-9592-0
Reyers, B. S., and Selig, E. R. (2020). Global targets that reveal the social–ecological interdependencies of sustainable development. Nat. Ecol. Evol. 4 (8), 1011–1019. doi:10.1038/s41559-020-1230-6
Sandström, V., Kauppi, P. E., Scherer, L., and Kastner, T. (2017). Linking country level food supply to global land and water use and biodiversity impacts: The case of Finland. Sci. Total Environ. 575, 33–40. doi:10.1016/j.scitotenv.2016.10.002
Scheffers, B. R., Oliveira, B. F., Lamb, I., and Edwards, D. P. (2019). Global wildlife trade across the tree of life. Science 366 (6461), 71–76. doi:10.1126/science.aav5327
Tilman, D., Clark, M., Williams, D. R., Kimmel, K., Polasky, S., and Packer, C. (2017). Future threats to biodiversity and pathways to their prevention. Nature 546 (7656), 73–81. doi:10.1038/nature22900
Venter, O., Sanderson, E. W., Magrach, A., Allan, J., Beher, J., Jones, K. R., et al. (2016). Sixteen years of change in the global terrestrial human footprint and implications for biodiversity conservation. Nat. Commun. 7 (1), 12558. doi:10.1038/ncomms12558
Waldron, A., Miller, D. C., Redding, D., Mooers, A., Kuhn, T. S., Nibbelink, N., et al. (2017). Reductions in global biodiversity loss predicted from conservation spending. Nature 551 (7680), 364–367. doi:10.1038/nature24295
Wang, S. H., He, Y. Q., and Song, M. L. (2020a). Global value chains, technological progress, and environmental pollution: Inequality towards developing countries. J. Environ. Manage. 277, 110999. doi:10.1016/j.jenvman.2020.110999
Wang, S. H., Li, Z. Z., and Song, M. L. (2019). How embodied carbon in trade affects labor income in developing countries. Sci. Total Environ. 672, 71–80. doi:10.1016/j.scitotenv.2019.03.456
Wang, S. H., Sun, X. L., and Song, M. L. (2021). Environmental regulation, resource misallocation, and ecological efficiency. Emerg. Mark. Finance Trade 57, 410–429. doi:10.1080/1540496X.2018.1529560
Wang, S. H., Tang, Y., and Song, M. L. (2020b). Export trade, embodied carbon emissions, and environmental pollution: An empirical analysis of China's high- and new-technology industries. J. Environ. Manage. 276, 111371. doi:10.1016/j.jenvman.2020.111371
Wang, S. H., Wang, X. Q., and Tang, Y. (2020c). Drivers of carbon emission transfer in China-An analysis of international trade from 2004 to 2011. Sci. Total Environ. 709, 135924. doi:10.1016/j.scitotenv.2019.135924
Wiedmann, T., and Lenzen, M. (2018). Environmental and social footprints of international trade. Nat. Geosci. 11 (5), 314–321. doi:10.1038/s41561-018-0113-9
Wilting, H. C., and van Oorschot, M. M. P. (2017). Quantifying biodiversity footprints of Dutch economic sectors: A global supply-chain analysis. J. Clean. Prod. 156, 194–202. doi:10.1016/j.jclepro.2017.04.066
Xu, H., Cao, Y., Yu, D., Cao, M., He, Y., Gill, M., et al. (2021). Ensuring effective implementation of the post-2020 global biodiversity targets. Nat. Ecol. Evol. 5 (4), 411–418. doi:10.1038/s41559-020-01375-y
Zabel, F., Delzeit, R., Schneider, J. M., Seppelt, R., Mauser, W., and Václavík, T. (2019). Global impacts of future cropland expansion and intensification on agricultural markets and biodiversity. Nat. Commun. 10 (1), 2844. doi:10.1038/s41467-019-10775-z
Keywords: accounting for biodiversity loss, international trade, biodiversity footprint, spatio-temporal evolution law, MRIO model
Citation: Li X, Xing L, Zhang Z and Zhang Y (2022) National accounting scheme for biodiversity loss: An international trade perspective. Front. Environ. Sci. 10:1000970. doi: 10.3389/fenvs.2022.1000970
Received: 22 July 2022; Accepted: 29 July 2022;
Published: 06 September 2022.
Edited by:
Shuhong Wang, Shandong University of Finance and Economics, ChinaReviewed by:
Yuanxiang Zhou, Anhui University of Finance and Economics, ChinaMei Chenm, Zhengzhou University, China
Copyright © 2022 Li, Xing, Zhang and Zhang. This is an open-access article distributed under the terms of the Creative Commons Attribution License (CC BY). The use, distribution or reproduction in other forums is permitted, provided the original author(s) and the copyright owner(s) are credited and that the original publication in this journal is cited, in accordance with accepted academic practice. No use, distribution or reproduction is permitted which does not comply with these terms.
*Correspondence: Zhe Zhang, zhangzhe20120912@126.com