Vertical Distributions of Aerosol and Cloud Microphysical Properties and the Aerosol Impact on a Continental Cumulus Cloud Based on Aircraft Measurements From the Loess Plateau of China
 Zhaoxin Cai1,2
  Zhanqing Li3* Peiren Li1
  Junxia Li4* Hongping Sun1 Xin Gao5 Yiran Peng6
  Yuying Wang7 Dongmei Zhang2 Gang Ren1
- 1Artificial Precipitation and Lightning Protection Technology Center, Meteorological Disasters Defense Technology Center, Meteorological Bureau of Shanxi Province, Taiyuan, China
- 2State Key Laboratory of Remote Sensing Science, College of Global Change and Earth System Science, Beijing Normal University, Beijing, China
- 3Department of Atmospheric and Oceanic Science, University of Maryland, College Park, MD, United States
- 4Key Laboratory for Cloud Physics of China Meteorological Administration, CMA Weather Modification Center, Chinese Academy of Meteorological Sciences, Beijing, China
- 5Service Center of Meteorological Bureau of Shanxi Province, Taiyuan, China
- 6Ministry of Education Key Laboratory for Earth System Modeling, Department of Earth System Science, Tsinghua University, Beijing, China
- 7Key Laboratory for Aerosol–Cloud–Precipitation of China Meteorological Administration, School of Atmospheric Physics, Nanjing University of Information Science and Technology, Nanjing, China
Based on aircraft measurements of aerosols and continental cumulus clouds made over the Loess Plateau of China (Xinzhou, Shanxi Province) on 30 July 2020, this study focuses on the vertical profiles of microphysical properties of aerosols and cumulus clouds, and use them to study aerosol-cloud interactions. During the study period, the boundary layer was stable with a height ∼1,500 m above sea level. Aerosols in the boundary layer mainly came from local emissions, while aerosols above this layer were mostly dust aerosols transported over long distances. Vertical profiles of aerosols and cloud condensation nuclei were obtained, and aerosol activation ratios at different supersaturation (SS) levels ranged from 0.16 to 0.32 at 0.2% SS and 0.70 to 0.85 at 0.8% SS. A thick cumulus cloud in the development stage was observed from the bottom to the top with the horizontal dimension of 10 km by 7 km, the cloud-base height of 2,450 m (15.8°C), and the cloud-top height of 5,400 m (−3°C). The maximum updraft velocity near the cloud top was 13.45 m s−1, and the maximum downdraft velocity occuring in the upper-middle part of the cloud was 4.44 ms−1. The temperature inside the cloud was higher than the outside, with their difference being positively correlated with the cloud water content. The temperature lapse rate inside the cloud was about −6.5°C km−1. The liquid water content and droplet effective radius (Re) increased with increasing height. The cloud droplet number concentration (Nc) increased first then decreased, peaking in the middle and lower part of the cloud, the average values of Nc and Re were 767.9 cm−3 and 5.17 μm, respectively. The cloud droplet spectrum had a multi-peak distribution, with the first appearing at ∼4.5 μm. SS in the cloud first increased then decreased with height. The maximum SS is ∼0.7% appearing at ∼3,800 m. The conversion rate of intra-cloud aerosols to cloud droplets was between 0.2 and 0.54, with the ratio increasing gradually with increasing height. The cloud droplet spectral dispersion and Nc were positively correlated. The aerosol indirect effect (AIE) was estimated to be 0.245 and 0.16, based on Nc and Re, respectively. The cloud droplet dispersion mainly attenuated the AIE, up to ∼34.7%.
Highlights
1) Simutaneous and coincident measurements of the vertical profiles of aerosol and clouds parameters are obtained to allow for studying their interactions in central northern China.
2) The cloud droplet number concentration is higher than the most observations which have been carried out.
3) Considerable variation in vertical velocity was observed in the cloud system ranging from downdraft of 4.44 ms−1 to updraft of 13.45 ms−1 with associated changes in cloud microphysics, and so is supersaturation rate.
4) Aerosol-cloud relationship was derived that is weakened by the cloud droplet spectral dispersion by up to 35%.
Introduction
Clouds play significant roles on Earth’s energy budget (e.g., Ramanathan et al., 1989; Norris, 2005) and hydrological cycle (e.g., Lohmann and Feichter, 2005; Andreae and Rosenfeld, 2008), strongly affecting regional and global climate. Aerosols are key to the formation and development of convective clouds by serving as cloud condensation nuclei (CCN) and interacting with the atmpospheric planetary boundary layer (PBL) (Pruppacher and Klett, 1997; Li et al., 2017). CCN is generally positively correlated with the number of cloud droplets and negatively with cloud droplet size. The later enhances cloud reflection, or cloud albedo, commoly known as the first type of aerosol indirect effect (AIE) (Twomey, 1977). By altering cloud droplet size, it affects the collision-coalescence efficiency and prolong the cloud lifetime by retaining more but smaller droplets in clouds, inhibiting the formation of rain (the second AIE; Albrecht, 1989). Numerous studies (e.g., Peng et al., 2002; Feingold et al., 2003a; Penner et al., 2004; Berg et al., 2011; Qiu et al., 2017) have provided observational evidence and theoretical explanations on both types of AIE. Its impacts on global and regional climate have drawn much attention, especially through the Intergovernmental Panel on Climate Change (IPCC) (e.g. IPCC, 2013 and IPCC, 2021).
In the past few decades, the aerosol-cloud-interaction (ACI) has been investigated (Ackerman et al., 2004; Fan et al., 2016; Liu and Li, 2018a; Zhao X. et al., 2018). Liu and Daum, 2002 find that anthropogenic aerosols exert an additional effect on cloud properties via altering the spectral shape of the size distribution of cloud droplets in polluted air and acts to diminish this cooling, which helped solve an outstanding problems of the aerosol-cloud interaction (Liu et al., 2008). The wide range of the relative dispersion for low cloud droplet concentrations produces a large uncertainty in the estimation of the indirect radiative forcing that increases with the relative dispersion (C. Zhao et al., 2006). Fan et al. (2016) pay attention to AIEs on cumulus or convective clouds over land, although the mechanism of convective development and the aerosol impact on mixed-phase and ice-phase clouds are still fraught with many uncertainties. Zhao et al., 2018b find water clouds in coastal regions downwind of a polluted continent are more sensitive to increases in aerosols. Liu and Li (2018a) discover a significant influence of aerosol hygroscopicity on the magnitude of the aerosol first indirect effect (FIE) when aerosol optical quantities are used to estimate the FIE.
Due to the paucity of in-situ measurements of cloud condensation number (CCN) or cloud droplet number (CDN), the vast majority of studies employed such aerosol proxy variables as aerosol optical depth (AOD) retrieved from satellite (Nakajima et al., 2001; Liu, 2003; Menon et al., 2008; Wei et al., 2021), aerosol extinction cofficient from ground-based lidar or nephelometers (Liu et al., 2016; Liu and Li, 2018b). In-situ aircraft observation is most ideal for the AIE studies, but it is especially challenging for convective clouds because of the safety concern. Considering that the convective clouds are often formed via surface heating over land that is often coupled with the boundary-layer, measurements of in-situ cloud microphysical properties together with the measurements of CCN and aerosols inside and below the cloud base are highly valuable for studying the aerosol effect on clouds. Some field campaigns and numerical simulations have shown that more aerosols lead to more cloud droplets and smaller droplet sizes in shallow cumuli over land (M.-L. Lu et al., 2008; Xue and Feingold, 2006; Gustafson et al., 2008; Shrivastava et al., 2013). However, Jiang et al. (2008) showed a negligible effect of increasing aerosols on the lifetime of shallow cumulus clouds. Lohmann and Hoose (2009) and C. Lu et al. (2013) explored the relationship between entrainment mixing and microphysical properties of shallow cumuli but were unable to determine whether homogeneous or extremely inhomogeneous mixing dominated. Modeling work by Saleeby et al. (2015) indicated that increasing aerosols was favorable to the transition from shallow cumulus clouds to deep convective clouds by accounting for the interaction between microphysics and dynamic feedbacks. Yuan et al. (2011) illustrated the aerosol invigoration effect by analyzing satellite data, finding enhanced trade wind cumulus cloud amounts in the presence of volcanic aerosols. Nevertheless, the AIE on shallow cumuli is still highly uncertain, with an undetermined sign and magnitude of the radiative forcing (e.g., Xue et al., 2008). The effect of aerosols in the transition from shallow cumulus clouds to convective clouds is also controversial.
In North China, the number concentration of aerosol particles and CCN are extremely high due partially to the heavy anthropogenic pollution (e.g., Duan et al., 2012; Li et al., 2015). Several studies using long-term observational data have suggested the potential link between deep convective precipitation and aerosols in eastern China (including the Beijing-Tianjin-Hebei area and the Loess Plateau), but the relation is non-monotonic, lacking a convincing explanation of the underlying mechanism (e.g., M. Jiang et al., 2016; Guo et al., 2017; Li et al., 2019). Aircraft measurements of aerosol properties and shallow cumulus clouds in this specific region are thus desired to study the aerosol impact on convection. So far, an air-borne based estimate of the AIE to be around 0.10–0.19 (Zhao C. et al., 2018) for shallow cumulus clouds in Hebei, which is heavily affected by pollutants and the AIE is dictated partially by water vapor supply (Y. Yang et al., 2019).
This study is concerned with the analyses of aircraft measurements of aerosol properties and their impact on the growth of a continental cumulus cloud observed in Shanxi province in China. The paper is organized as follows. Description of The Field Campaign describes the instruments and data from aircraft measurements. Observational Results presents the vertical distributions of aerosol and cloud characteristics, and examines the aerosol effect on cloud microphysics. Conclusions are given in Conclusion.
Description of The Field Campaign
Instruments on Aircraft
The research aircraft operated in the study region is the Harbin Yun-12 twin-engine turboprop aircraft whose cruise speed is ∼60–70 m s−1, and the climbing and descending speeds are ∼2–6 m s−1. Table 1 lists the instruments installed in the aircraft to make aerosol and cloud measurements. The main sampling probes were mounted underneath the aircraft wings carrying the Passive Cavity Aerosol Spectrometer Probe (PCASP, DMT, USA) measuring aerosol particle sizes and number concentrations in the diameter range of 0.1–3 μm; the Cloud Droplet Probe (CDP, DMT, USA) measuring cloud droplet size distributions of droplets in the size range of 2–50 μm; the Cloud Imaging Probe (CIP, DMT, USA) measuring large cloud droplets/crystals and precipitating particles in the diameter range of 15–930 μm; the Aircraft-Integrated Meteorological Measurement System (AIMMS, Aventech Research Inc., Canada) providing meteorological data, such as temperature, pressure, specific humidity, relative humidity (RH), longitude, latitude, and altitude, among others. The temporal resolution of all data is 1 Hz.
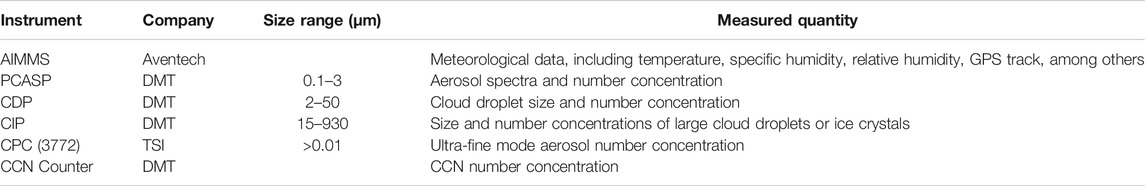
TABLE 1. List of instruments in the aircraft during the research flights.
Other instruments were installed inside the aircraft cabin including the following. The Model 3,772 Condensation Particle Counter (CPC, TSI, USA) is a compact, rugged, and full-featured instrument, detecting airborne particles down to 10 nm in diameter at an aerosol flow rate of 1.0 L min−1, over a concentration range of 0 to 104 particles cm−3. This instrument can measure the ultra-fine mode aerosol number concentration. The CCN Counter (CCN-100, DMT, USA) can be set up with different supersaturation (SS) levels within 0.1–2% and has 20 bins from 0.75 to 10 μm.
All instruments were calibrated before a flight took place, and the air tightness of the gas path and each instrument was checked with a hand-held manometer. An air sampling inlet device made of stainless steel was mounted on top of the airplane fuselage, with a stent height of ∼10 cm. The air inlet was connected to the sampling equipment inside the aircraft through straight stainless-steel tubes and non-adsorption rubber hose. The collection efficiency for aerosol particles in the size range of 0.01–5.0 μm was 95%, and the collection efficiency of aerosol particles with sizes larger than 5.0 μm was ∼50%. Without using an air pump, the air inlet flow was about 15 L min−1 when the flight speed ranged from 200 to 300 km h−1. The inlet was connected to the instruments as directly as possible to avoid turns or corners. Ambient air was pumped into the aircraft cabin from the sample inlet, entering each instrument after drying. The RH of sampled air after drying was less than 40%. Note that the CPC can measure all aerosol particles even if some particles have been activated. Video equipment was installed inside the front windshield of the aircraft to record the entire detection process. The flight commander carried a high-definition camera to take photos of the measured cumulus clouds.
Datasets
The CPC and PCASP provided aerosol particle number concentrations in different diameter ranges. The total aerosol number concentration (as measured by the CPC) is denoted as Na (cm−3). The accumulation-mode aerosol number concentration (as measured by the PCASP) is denoted as Nacc (cm−3). The CCN number concentration at SS levels of 0.2 and 0.8% are written as CCNc (SS = 0.2%) (cm−3) and CCNc (SS = 0.8%) (cm−3), respectively. LWC refers to the cloud liquid water content measured with the CDP and CIP probes. CDP-detected droplet numbers with diameters ranging from 2 to 50 μm (Nc, cm−3) represent the cloud droplet number concentration. Drizzle drops are typically larger than 50 μm in diameter (Pruppacher and Klett, 1997). Thus the number of cloud droplets detected by CIP and ranged in 50–930 μm (Nd, cm−3) represents the drizzle droplet number concentration. Note that data from the PCASP in the first bin (0.09–0.1 μm) are inaccurate due to the detection limit of the instrument, so they were eliminated from the analysis (Li et al., 2015).
According to previous studies, different criteria have been applied to define the presence of clouds in aircraft observation (Gultepe and Isaac, 2004; Rangno and Hobbs, 2005). Considering that the measured clouds in this study are over land, we apply the criteria of Nc > 10 cm−3 and LWC > 0.001 g m−3 for defining clouds, which are similar to that in Zhang et al. (2011) for studying clouds in Beijing, China.
All times refer to Beijing Standard Time (BST), and all heights are heights above sea level (ASL) with reference to Taiyuan City (112.55°E, 37.867°N, 778 m ASL), the capital of Shanxi Province.
Flight Description
Aircraft measurements were conducted in the vicinity of the Xinzhou (XZ) meteorological station (112.12°E, 38.07°N, 870 m ASL) in Shanxi Province from 15:00 to 19:00 BST on 30 July 2020. The station is located on the border between the Loess Plateau and the North China Plain and is 60 km northeast of Taiyuan City and 360 km southwest of Beijing. Figure 1 shows details of the flight trajectory. The aircraft took off from Taiyuan Wusu International Airport, flew northward, and climbed up to 3,500 m at 15:20 BST, then leveled off at this altitude. CCN supersaturation was set at 0.2% when the airplane took off. The temperature at 3,500 m was ∼10.8°C. The airplane was in the vicinity of XZ at 15:32 BST when observers in the airplane spotted a thick cumulus cloud to the northeast of XZ (Figure 1E). The cloud body was white, and the cloud top had a clear-cut, cauliflower-uplift shape. The cloud length was ∼10 km, the width was ∼7 km, and the depth was ∼3 km. The terrain under the cumulus cloud was mountainous with an altitude of ∼1,400 m. The plane penetrated the cloud at the height of 3,200 m, descended 300 m, then flew straight and level through the cloud. It descended again, reaching the cloud base and flying around the cloud base for about 6 min. The height of the cloud base was ∼2,450 m, and the temperature at the cloud base was ∼15.8°C. The cloud-top height was ∼5,400 m, and the temperature at the cloud top was about −3°C. Climbing and descending aircraft maneuvers were done outside the cloud to reduce the impact of the aircraft on the cloud as the aircraft shifted power. There are no ice crystal particles appeared from the CIP particle image, and the convective cloud is a water cloud. The aircraft began its observations through the clouds after the aircraft was at a relatively stable height. According to the Himawari-8 satellite image taken during the observation period (at 16:00 BST), there was a cumulus cloud (Figure 1D) with a cloud-top height of ∼5 km (Figure 1C) in the detection area, consistent with the digital images taken from the aircraft.
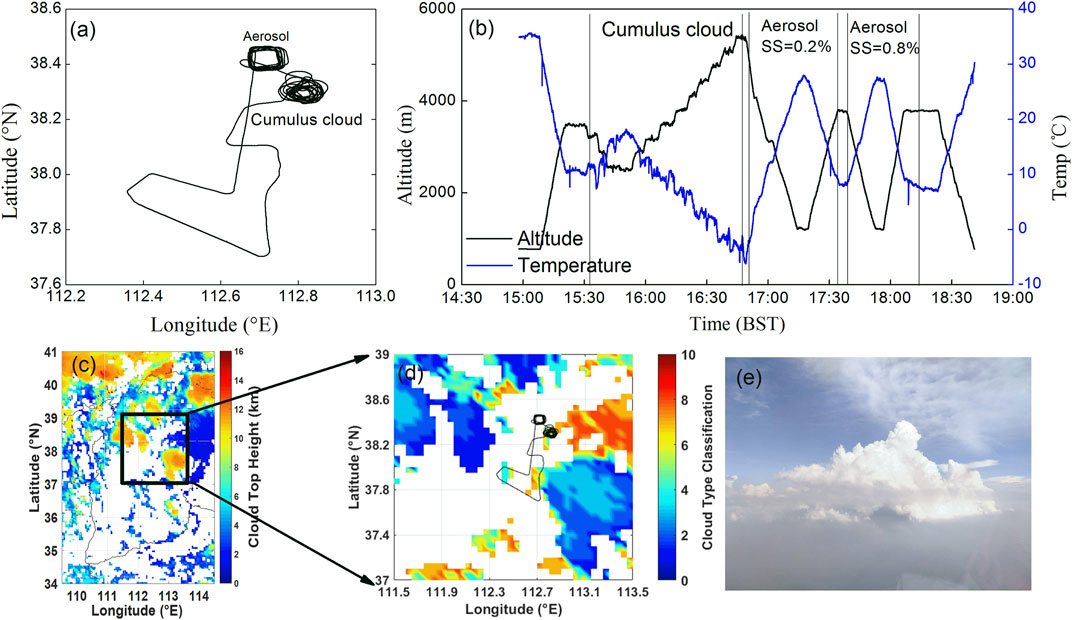
FIGURE 1. (A) Flight trajectory, (B) time series of flight altitude (blue line, unit: m) and temperature (black line, unit: °C), (C) cloud-top height (unit: km), (D) cloud-type classification from the Himawari-8 satellite at 16:00 BST 30 July 2020, and (E) photo of the cumulus cloud. Himawari-8 satellite classifies the following clouds:1 Ci, 2 Cs, 3 deep convection, 4 Ac, 5 As, 6 Ns, 7 Cu, 8 Sc, 9 St, with 0 being clear and 10 unknown, 255 missing_value.
After detecting the cumulus cloud, the aircraft flew northwest for 10 km to XZ and carried out another round of detecting aerosols and CCN. To reduce the influence of the aircraft’s exhaust on environmental aerosols, the aircraft descended spirally from 4,500 m, flying to the lowest safety altitude (∼1,200 m), then flew horizontally for 5 min before circling and climbing to 3,600 m. The SS was adjusted to 0.8%, and the aircraft circled and descended to 1,200 m again after the CCN operating condition stabilized. After flying at this level for 5 min, the aircraft climbed to 3,600 m and continued flying horizontally for another 5 min before turning back to the airport.
Observational Results
Vertical Distributions of Aerosol Microphysical Properties
Figure 2 shows the vertical profiles of aerosol number concentrations for different size ranges, CCNc, and activation rate (AR) at SS levels of 0.2 and 0.8%. The maximum value of Nacc occurred near the ground, with a maximum value of 2000 cm−3. Nacc gradually decreased with increasing height below 3,000 m then increased with height above 3,000 m, reaching another peak at 4,200 m. Na first increased then decreased with increasing height, with the first peak value appearing at 1,500 m with a maximum concentration of 4,437 cm−3. Clear differences between Na and Nacc were seen below 3,600 m, with smaller differences seen between 3,900 m and 4,500 m. From the measurements of the micropulse lidar at XZ, the boundary-layer height during the observation period was estimated to be ∼1,500 m (Sawyer and Li, 2013; Su et al., 2020). The upward transport of near-surface aerosol particles was inhibited due to the stable boundary layer that constrained the bulk of aerosol particles to within 2,100 m. Figure 1E shows that the visibility below the cumulus cloud was low.
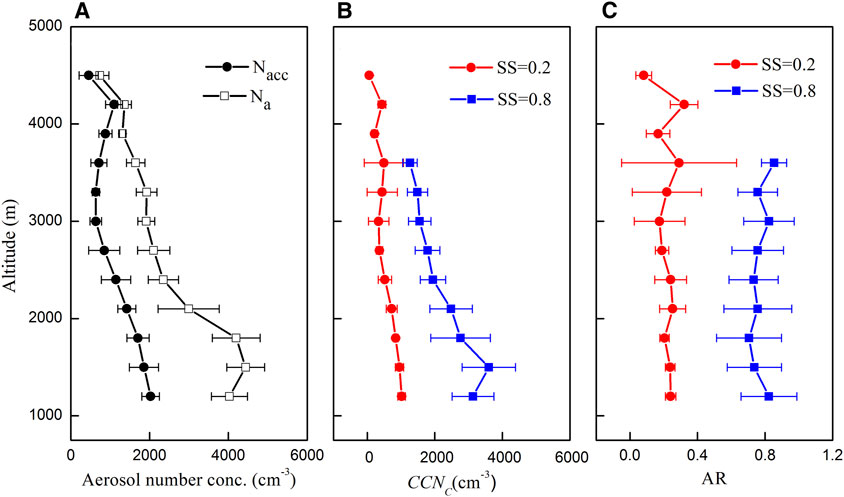
FIGURE 2. (A) Vertical profiles of the total (Na, hollow squares) and accumulation-mode (Nacc, black dots) aerosol number concentrations, (B) cloud condensation nuclei number concentrations (CCNc) at supersaturation (SS) levels of 0.2% (red) and 0.8% (blue), and (C) activation ratios (AR) at SS = 0.2% (red) and SS = 0.8% (blue) on 30 July 2020.
The shapes of the vertical profiles of Nacc and Na were very similar as CCNc at SS of 0.2 and 0.8% SS, respctively. Particles larger than 0.1 μm were mainly activated at SS = 0.2%. At SS = 0.8%, however, CCNc was much larger than Nacc and smaller than Na, suggesting that a large number of small particles ranging from 0.01 to 0.1 μm are activated at this larger SS. The maximum values of CCNc at 0.2 and 0.8% SS were 1,073 cm−3 and 3,672 cm−3, respectively.
Activation of aerosol particles to CCN is related to particle size, chemical composition, hygroscopicity, and environmental SS, as denoted by the ratio of CCN to aerosol number concentration at a certain SS level. Figure 2C shows the vertical profile of AR reflecting the joint impact of these CCN influential factors thoroughout the observed vertical extent. In general, the AR is much less variable with height but it is markedly different for two different SS values (0.2 and 0.8%). At 0.2% SS, the average AR is generally less than 0.4. And at 0.8% SS, the average value of AR is above 0.8. The aircraft measurements of aerosol particles and CCN were carried out and reported by Li et al. in the same area in 2013 (Li et al., 2015), they gave the vertical profiles of mean AR at 0.3 and 0.4% SS. In the research in 2013, when SS was 0.3, the average value of AR was mostly less than 0.4, and there was no obvious change trend in the vertical direction, which is similar to the results of this study. And when SS was 0.4, AR showed an obvious increasing trend in the vertical direction. The average AR was basically less than 0.4 in the lower layer (below 2000 m), then increased with height, and reached to 0.6–0.8 when above 4,000 m. But at the two supersaturations in this study, there is no obvious trend of AR vertical variation. All the variables are dictated by aerosol types, aerosol size and chemical compositions (including mixing state) that are further linked to the origin of air masses.
Figure 3 shows 48-hour backward trajectories of air masses at four height levels simulated by the Hybrid Single-Particle Lagrangian Integrated Trajectory model. The air masses at 1,000 m and 2,000 m originated east and south of the study area, respectively. The majority of aerosol particles in the boundary layer were fine particles from local emissions. Based on previous aerosol observations in the same area, the chemical composition of aerosol in this area is mainly sulfate (Zhang et al., 2016; Zhang et al., 2017), and the particles have a high content of soluble components, which are easy to activate under high humidity conditions. The air masses at 3,000 m and 4,000 m originated from northwest China and Inner Mongolia, respectively, carrying dust aerosols (J. Yang et al., 2017) from deserts and arid regions along the way (such as the Gobi Desert). Located in this part of Shanxi Province is the Xinfu District meteorological station, surrounded by mountains on three sides. A strong updraft was observed at the time of experiment (figure not shown) that likely transported aerosols from the surface to higher altitudes. Aerosols were well mixed in the upper atmospheric layer, and insoluble dust particles may have become more hygroscopic by mixing with soluble pollutants, acting as good CCNs due to their large sizes (Zhang et al., 2015; Wang et al., 2018).
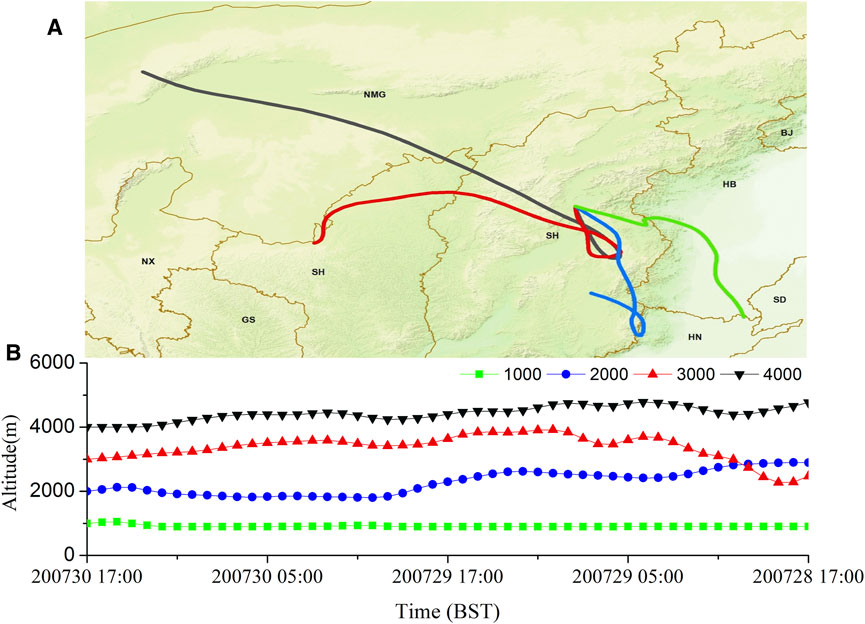
FIGURE 3. Forty-eight-hour backward trajectories of air masses at four height levels, ending at 17:00 BST 30 July 2020 in the study area.
Number Size Distribution of Aerosol Particles
The number of aerosol particles in different size ranges is described by the aerosol spectral distribution, as is shown in Figure 4 at different heights. It is fitted by multi-lognormal distribution functions (Seinfeld and Pandis, 1998; Abdul-Razzak et al., 1998; Li et al., 2015):
where n is the number of modes per size distribution for the best fit, Dp is the peak aerosol diameter, Ni is the aerosol number in mode i, Dg,i is the geometric mean diameter of mode i, and σg,i is the standard deviation of mode i. The red and green solid lines in Figure 4 show the lognormal fits of two modes to the mean aerosol particle spectrum. Table 2 lists the parameters at different altitudes characterizing the number size distributions of these two modes. Aerosol particles showed bimodal distributions in the four height ranges that were thus fitted by two-mode lognormal distribution with the Mode-I being more dominant.
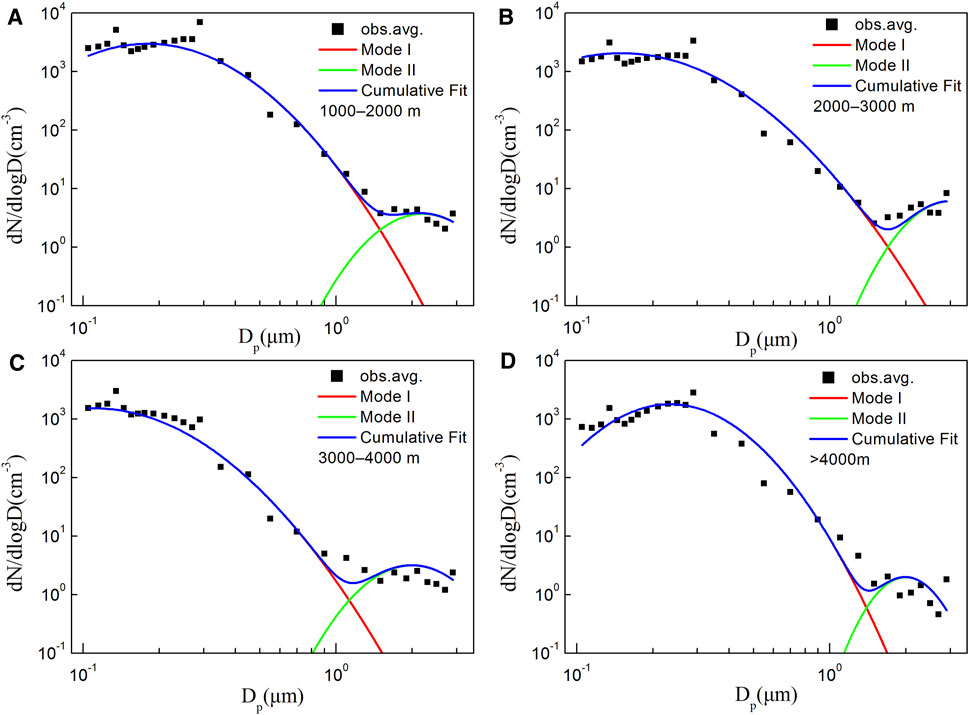
FIGURE 4. Mean size distributions of aerosol particles from (A) 1,000–2,000 m, (B) 2,000–3,000 m, (C) 3,000–4,000 m, and (D) above 4,000 m. The black hollow squares show the mean observed aerosol size distribution. The solid blue line represents the cumulative fit of the total aerosol size distribution, and the red (Mode I) and green (Mode II) solid lines represent the lognormal fits of the two aerosol mode size distributions, respectively. Macro- and Microphysical Characteristics of the Continental Cumulus Cloud Studied.
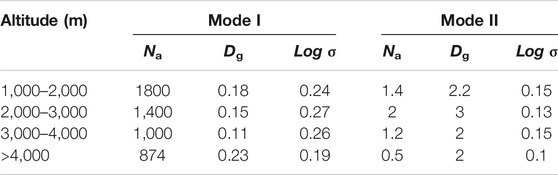
TABLE 2. Parameters characterizing the number size distributions of the two aerosol modes at different altitudes.
Macro- and Microphysical Characteristics of the Continental Cumulus Cloud Studied
Figure 5 shows various microphysical parameters during the whole cloud detection phase (15:30–16:50, BST). We can see the difference of RH between inside and outside the cloud obviously at each altitude. Besides, the temperature also has a lot of differences between the environment and the cloud. The values of LWC ranged from 0.001 to 2.827 g m−3 with the average value of 0.434 ± 0.512 g m−3. It is lower than those in tropical cumulus clouds from the Ice in Clouds Experiment–Tropical (ICE-T) (Lawson et al., 2015) and mixed phase clouds observed during Cloud Aerosol Interaction and Precipitation Enhancement Experiment (CAIPEEX) (Patade et al., 2016), but larger than those in deep convective clouds observed in Texas (Rosenfeld and Woodley, 2000). Nc ranged from 10 to 2,680 cm−3 with the average value of 767.9 ± 634.5 cm−3, which are greater than most observations reported before (Rosenfeld and Woodley 2000; Rangno and Hobbs 2005; Huang et al., 2008; Heymsfield and Willis 2014; Padmakumari et al., 2017). The Re ranged from 2.16 to 7.65 μm with the average value of 5.17 ± 1.08 μm, which are smaller than those observed over India (Rosenfeld et al., 2012; Patade et al., 2016) and Amazon (Braga et al., 2017). Drizzle drops appeared near the top of the cloud.
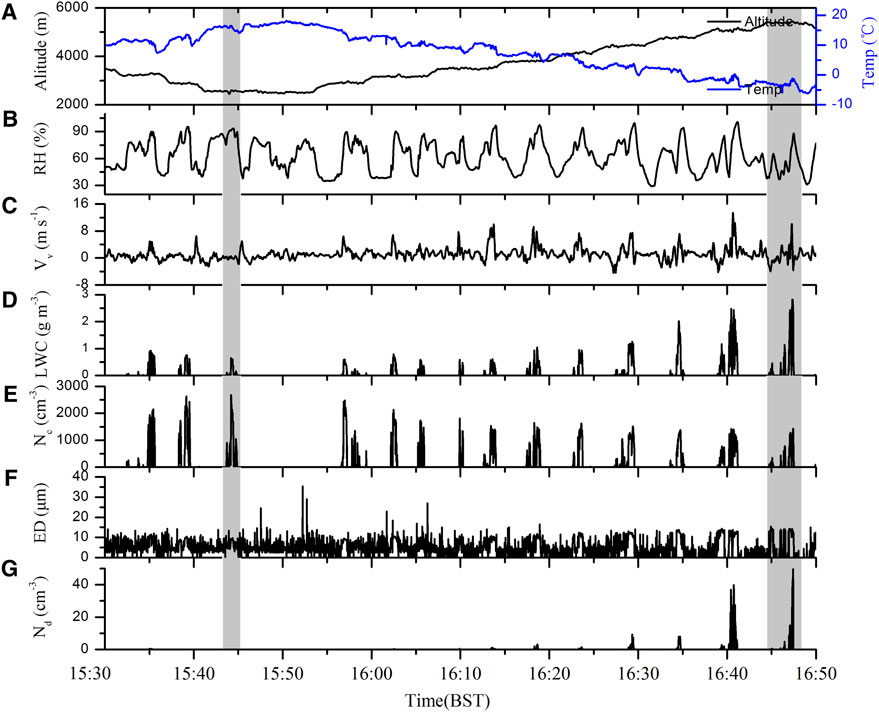
FIGURE 5. The time series of altitude and temperature (A), relative humidity (RH) (B), vertical velocity (Vv) (C), liquid water content (LWC) (D), cloud particle number concentration (Nc) (E), cloud droplet effective diameter (ED) (F), drizzle droplet number concentration (Nd) (G), for cumulus clouds as observed by aircraft on 30 July 2020. The light gray areas represent the cloud base and the cloud top, respectively.
Figure 6A shows the vertical variations in microphysical quantities of the continental cumulus cloud studied. Both LWC and Re increased with height, and the maximum vertical velocity (Vv) was located in the upper middle part of the cloud. The relationship between LWC and altitude was clearer than that between LWC and Vv. The maximum LWC in the cloud was ∼2.83 gm−3. Within 500 m above the cloud base, the measured and calculated LWC were close in magnitude, suggesting that this region was a quasi-adiabatic region. As the height increased, measured LWC values were less than calculated values, with differences becoming larger with height, indicating that the mixing of air inside and outside the cloud was becoming stronger. Figures 6C,D show the flight trajectories and cumulus-cloud projections in the longitudinal and latitudinal directions, respectively. The cumulus cloud under study was composed of several small convective bubbles. There were gaps in the cumulus cloud, and there was entrainment at the cloud boundary. The vertical distributions of microphysical quantities within the cumulus cloud were not thus completely consistent with adiabatic growth. The liquid water path (Brenguier et al., 2011) of the observed convective cloud was ∼1337 g m−2.
FIGURE 6. Vertical distribution of the liquid water content (LWC) for different cloud droplet effective radii size ranges (size of the dot) and vertical velocities (color of the dot) (A), droplet size distributions at cloud base (black), mid-cloud (red), and cloud top (blue) (B), and projections of flight trajectories colored by vertical velocity superimposed onlatitudinal (C) and longitudinal (D) views of the cumulus cloud on 30 July 2020. The curve shown in (A) is the calculated adiabatic water content.
Figure 6B shows cloud droplet spectra at different heights. Cloud droplet spectra at cloud base, in the middle of the cloud, and at the cloud top have multi-peak distributions. The first peak appeared at 4.5 μm. The Na decreased, and the spectrum width increased with increasing height. The maximum diameter of cloud droplets at the cloud top reached 38 μm.
Table 3 shows average values of temperature in the cloud (Tc), ambient temperature (Te), Vv range, LWC, Nc, Re, and cloud droplet critical radius (Rc) at different penetration heights in the cumulus cloud. The decreasing rate of temperature, or lapse rate, within the cloud was about −6.5°C km−1, close to the wet adiabatic lapse rate (Seinfeld and Pandis, 1998). According to the temperature and dew-point temperature measured at the ground observation station at 15:00 BST, the lifting condensation level was 1964 m, slightly below the observed cumulus cloud-base height. The temperature inside the cumulus cloud was significantly higher than outside the cloud at the same height. The temperature difference between inside (Ti) and outside (To) the cloud (ΔT = Ti–To) was ∼0.18–1.03°C, caused by the latent heat release from the condensation of water vapor. This is attested by a positive linear relation found between LWC in the cumulus cloud and ΔT with the correlation coefficient of 0.43, namely,
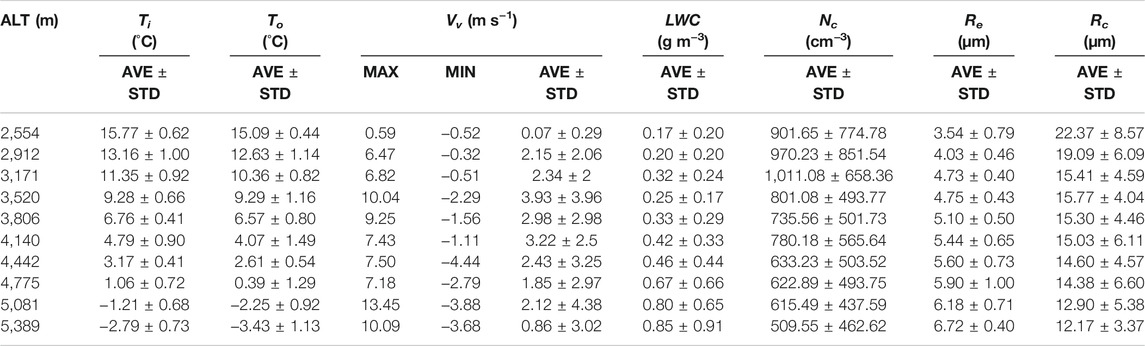
TABLE 3. Temperature in the cloud (Ti), temperature out the cloud (To), the vertical velocity range (Vv), cloud liquid water content (LWC), cloud particle number concentration (Nc), cloud droplet effective radius (Re), and cloud droplet critical radius (Rc) at different penetration altitudes in the cumulus cloud studied. AVE and STD stand for average and standard deviation, respectively.
The warmed air inside cloud incurs buoyance to fueld the further development of convection. The Vv inside the cumulus cloud ranged from −4.44 m s−1–13.45 m s−1, with overwhelming updraft (positive Vv) over the downdraft (negaitive Vv). The maximum updraft velocity was near the cloud top, and the maximum downdraft velocity occurs in the upper-middle part of the cloud. The Nc first increased then decreased with increasing height, with the peak Nc at 3,200 m. The Re increased slowly with height, following the condensation growth curve.
Rc represents the critical radius of the cloud-rain transformation function (Eq. 2 in Liu and McGraw, 2005):
where βc is an empirical constant equal to 1.15 ×10²³. When cloud droplets are larger than Rc, the coalescence mechanism can be triggered in the cloud. It follows from Figure 6B; Table 3 that the cloud droplet spectral width is less than 28 μm, Rc is 22.37 (so the critical diameter, Dc is 44.74 μm) at the cloud base; the cloud droplet spectrum width is about 30 μm; Rc is 15.03 μm (Dc is 30.06 μm) at mid-cloud; and the cloud droplet spectral width is about 48 μm; Rc is 12.17 μm (Dc is 24.34 μm) at the cloud top; and there are droplets larger than Dc in the cloud, which can trigger the collision and coalescence. As we can see from Figure 5, drizzle appeared above the middle of the cloud.
To help understand the interaction between aerosols and cloud droplets, the aircraft flew straight and level near the cloud base for nearly 6 minutes, i.e., from 15:46 to 15:52 BST (Figure 7). Combined with the aerosol vertical distribution, Na and CCNc (SS = 0.2%) at 100 m below the cloud base were 2,157 ± 621 cm−3 and 793 ± 335 cm−3, respectively. Nc at the cloud base was 901.65 ± 774.78 cm−3. About 36.76% of aerosol particles were activated to CCN at 0.2% SS in the sub-cloud, and about 38.4% of aerosol particles were transformed to cloud droplets.
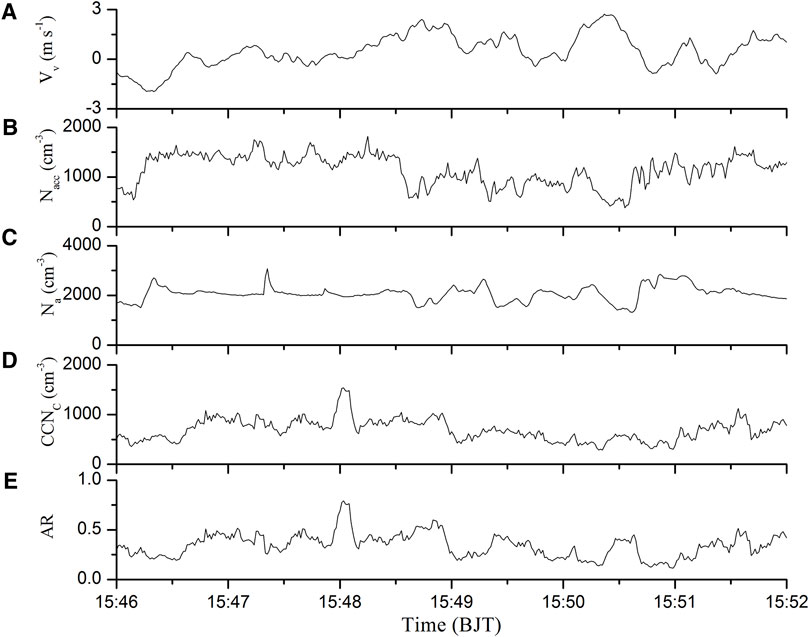
FIGURE 7. The time series of vertical velocity (Vv) (A), accumulation-mode aerosol number concentration (Nacc) (B), total aerosol number concentration (Na) (C), CCN number concentration (CCNc) (D), activation ratio (AR) (E), for sub-cloud as observed by aircraft on 30 July 2020.
Vertical Distribution of Supersaturation in the Continental Cumulus Cloud
Supersaturation is an important factor affecting the activation of aerosols. Supersaturation varies at different positions within clouds. Since the classical work by Twomey (1959), many studies have been aimed at calculating the maximum SS in clouds (Cohard et al., 1998; Abdul-Razzak and Ghan, 2000; Shipway and Abel, 2010). Pinsky et al. (2012) found that the maximum SS near the cloud base was positively correlated with the updraft velocity and negatively correlated with Nc, thus improving the calculation method of maximum SS. This method was used to calculate SS at different heights inside the cumulus cloud, i.e.,
whereρa is the density of air (kg m−3),ρw is the density of liquid water (kg m−3), Lw is the latent heat for liquid water (J kg−1), ka is the coefficient of air heat conductivity (J m−1 s−1 K−1), and Rv and Rd are the water vapor specific gas constant and the dry air specific gas constant, respectively. The quantity ew (T) is the saturation vapor pressure above the flat surface of water (N m−2), D is the coefficient of water vapor diffusion in the air (m2 s−1), cp is the specific heat capacity of moist air at constant pressure (J kg−1 K−1), and qv is the water vapor mixing ratio.
The supersaturation value obtained by direct aircraft observation is one of the key contents of this study. Through observing and calculating, the vertical distribution of SS in the cloud is got and showed in Figure 8A. SS in the cloud first increased then decreased with increasing height. The peak value of SS appeared at 3,800 m with a value of 0.7%. The SS values in clean continental convective clouds are close to those calculated by Pinsky and Khain, 2020, but far less than the simulation values for a deep convective cloud systems (DCCs) over the Amazon (Fan et al., 2018). The mean and maximum values of SS at cloud base are 0.08 and 0.25%, respectively. Nc is slightly greater than CCNc (SS = 0.2%) at the cloud base. The ratio of intra-cloud Nc to Na ranged from 0.17 to 0.31 (Figure 8B). As Nacc accounts for a higher proportion of all aerosol particles above 3,600 m (Figure 2), larger aerosol particles are easier to activate. Besides, LWC increases with height inside the cloud, there is more abundant water vapor supply in the middle and upper part of the cloud. Aerosol particles are more easily activated under high humidity conditions. As such, the ratio of Nc to Na increases gradually with height, and the maximum value appearing at the cloud top.
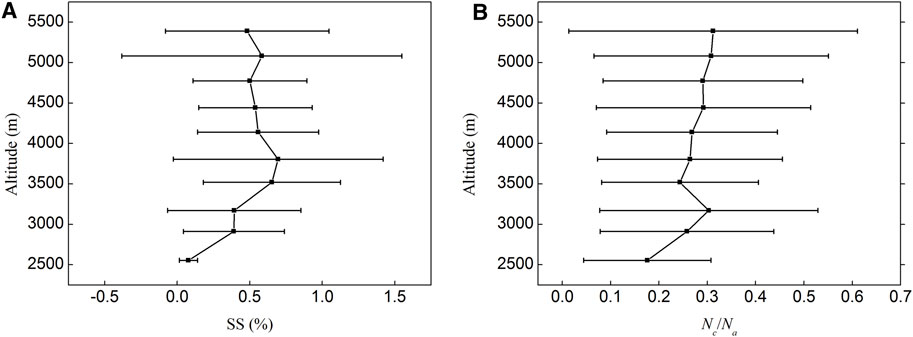
FIGURE 8. Vertical profiles of (A) supersaturation (SS) and (B) Nc/Na at different altitudes in the cumulus cloud on 30 July 2020.
Cloud Droplet Spectral Dispersion
The cloud droplet spectral dispersion (ε) is the ratio of the cloud droplet spectral distribution standard deviation to the average radius of cloud droplets (Rm). It is an important parameter for describing cloud microphysics for it measures the dispersion of cloud droplets, expressed as
The ε can affect microphysical processes in clouds through the first AIE and can also affect the cloud water to rainwater conversion process through the second AIE, ultimately affecting precipitation formation. The magnitude of ε varies greatly in different clouds and has a certain correlation with Nc, but the degree of correlation between the two parameters varies considerably (Martin et al., 1994; Grabowski, 1998; Rotstayn and Liu, 2003; Ma et al., 2010; Xie and Liu, 2013; Wang et al., 2021). Figure 9 shows the changes in relative dispersion (ε) with Nc, and LWC on 30 July 2020. the average ε in each 500 cm−3 Nc and each 0.5 g m−3 LWC bin, respectively, and the average ε is fitted as a fuction of Nc and LWC. The maximum, minimum, and average values of ε were 0.60, 0.29, and 0.44 ± 0.05, respectively. When LWC in the cloud was low, the corresponding Nc was low, and ε varied over a wide range of values (0.29–0.6). The region with larger LWCs in the cloud also had a higher Nc, indicating that more droplets were activated. The cloud thus grew more, leading to the narrow spectrum. Overall, ε tended toward a value of 0.5. similar results were reported by C. Zhao et al. (2006) and Deng et al. (2009).
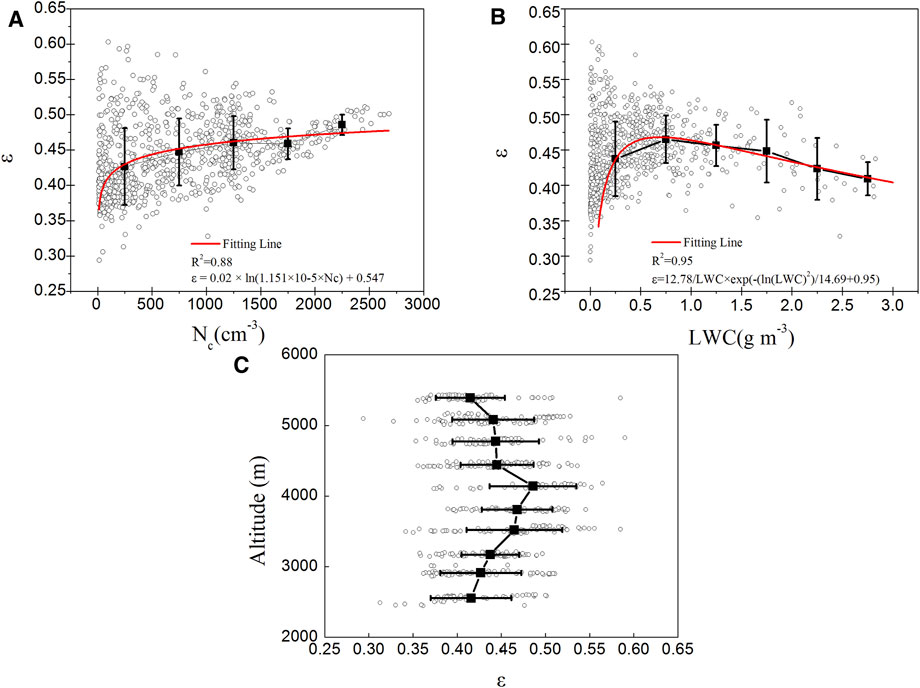
FIGURE 9. Relative dispersion (ε) as a function of cloud droplet number concentration (Nc) (A), ε as a function of LWC (B) and ε as a function of Altitude (C), on 30 July 2020. Error bars in the picture (A) represent the standard deviation of average ε in each 500 cm−3 Nc bin, error bars in the r picture (B) represent the standard deviation of average ε in each 0.5 g m−3 LWC bin, and the red line represents the best fit.
The convergent relationship between ε and Nc (the convergence in the dispersion relation at high cloud droplet concentrations) was closely related to the Twomey effect (Figure 9A). When the cloud droplet concentration is high, the corresponding ε changes within a small range of values, and so is the uncertainty of the Twomey indirect effect, especially at high cloud droplet concentrations. The positive relationship between ε and Nc can be expressed as (Grabowski, 1998)
Their relationship between ε and LWC is showed in Figure 9B. As the LWC increased, ε increased when the LWC is less than 0.7 gm−3, but decreased when LWC value is large than 0.7 gm−3. Their relationship can be expressed as
Tas et al. (2012), Tas et al. (2015) also reported similar results, i.e., that LWC reached its maximum value in the core region of mature cumulus clouds and that ε converges.
The relationship between ε and altitude is showed in Figure 9C, showing that ε in the cloud first increased then decreased with increasing height. The peak value of ε appeared at 4,100 m.
Aerosol-Cloud Relationships and the AIE
Twomey (1977) proposed that given the same atmospheric conditions and when the cloud water content was constant, an increase in anthropogenic aerosol particles would lead to an increase in Nc and a decrease in the radii of cloud droplets. The larger number of smaller cloud droplets has a larger total surface area than a smaller number of large cloud droplets. An increase in aerosol particles will thus lead to an increase in the albedo of clouds and a decrease in the amount of solar radiation reaching the surface, i.e., the first AIE. Many observations support the cooling effect of the first AIE, but the magnitude of this effect has a large range (Feingold et al., 2003a; Rosenfeld and Feingold, 2003). Estimates of the first AIE from global climate models are often much larger than observations (Anderson, 2003).
The relationships between Na and Nc and between Re and Na were further examined (Figure 10). The relationship between Na and Nc can be fitted with the formula Na = 2.253×Nc 0.736, and that between Re and Na can be fitted with the formula Na = 17.863×Re −0.16. Similar to previous studies (Feingold, 2003b; Zhao C. et al., 2018; Y.; Wang et al., 2019), the aerosol first AIE, or Twomey effect, with respect to Nc and Re, i.e., AIEn and AIEs, respectively, can be expressed as
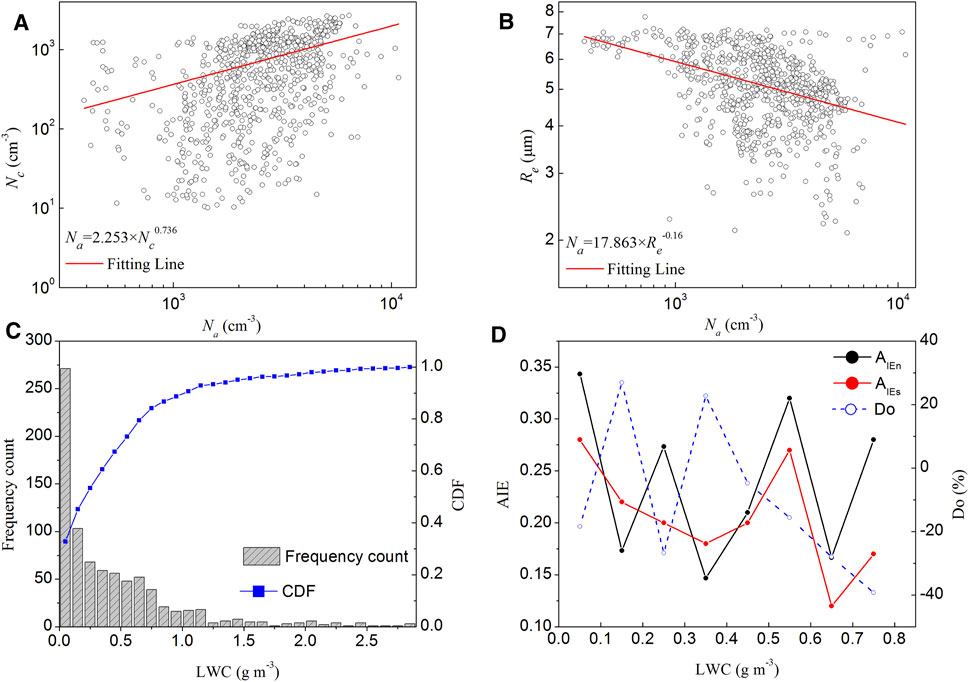
FIGURE 10. Relationships between cloud droplet concentration (Nc) and aerosol concentration (Na) (A), cloud droplet effective radius (Re) and aerosol concentration (Na) (B), the frequency distribution and cumulative distribution function (CDF) of the measured LWC (C), and aerosol indirect effect (AIE) and dispersion offset as a function of LWC (D). The black solid line and the red line represent the aerosol indirect effects calculated by cloud droplet concentration (AIEn) and droplet effective radius (AIEs), the right y-axis represents the dispersion offset (Do, the blue dash line).
Here, βis the effective radius ratio to the droplet effective radius (Re) and volume mean radius (Rv) 9, it’s a function of the spectral dispersion ε of the cloud droplets (Martin et al., 1994). AIEn and AIEs were estimated to be 0.245 and 0.16, respectively. They are similar to the those estimated from observations in the North China Plain (Zhao C. et al., 2018), larger than those in eatern China (Wang et al., 2021). The second term on the right hand of Eq. 10 is called dispersion effect (De), which is the main reason for the difference between the two quantitative estimates of the first AIE (Anil Kumar et al., 2016; Wang et al., 2021). Using the ratio of dispersion effect on AIEn to measure the dispersion effect on AIEs is called the dispersion offset (Do, Liu and Daum, 2002; 2008). If the dispersion offset is negative, the dispersion effect counteracts AIEn, weakening AIEn, and if the dispersion offset is positive, the dispersion effect strengthens AIEn. In this study, the cloud droplet dispersion mainly attenuated the AIE by ∼34.7%.
In order to meet the premise that the water content is constant in the Twomey effect, the LWC should be classified into narrow intervals, but the sorting may lead to too few data samples. Figure 10C shows LWC frequency distribution observed in this study. It can be seen that there are few data records of LWC greater than 0.8 g m−3, and data records in each bin are less than 30. To ensure a certain number of data records, we only discussed the AIE with LWC in the range of 0.001–0.8 g m−3, and the aerosol number concentration and the cloud microphysical quantities (Nc and Re) were grouped according to different LWC. Figure 10D shows the changes of AIEn and AIEs with LWC. AIEn ranged from 0.15 to 0.34 with an average of 0.24, and AIEs ranged from 0.12 to 0.28 with an average of 0.21. On the whole, AIEn is larger than AIEs, especially in LWC in the range of 0.5–0.6 g m−3. The difference is most obvious, which is consistent with some previous findings (Feingold et al., 2003a; Twohy, 2005; Anil Kumar et al., 2016).
Conclusion
Aircraft measurements of aerosols and the macro- and microphysical properties of a continental cumulus cloud over the Loess Plateau in Shanxi Province of China were carried out in July 2020. Aerosol and CCN data at different levels from near the ground to up to 4500 m were analyzed in combination with back-trajectory simulations. Distinct aerosol sources in the boundary layer and in the free atmosphere were identified. Aerosols in the boundary layer were mainly from local urban emissions and composed of fine-particle pollutants. Aerosol particles above 4 km were mostly transported from deserts in northwest China and composed of submicron dust particles. Aerosol properties measured at the surface may thus provide misleading information about aerosol characteristics for aerosol-cloud studies. Unfortunately, this has been the case for the vast majority of previous aerosol-cloud-interaction (ACI) studies due to exceptional difficulties in making in-situ measurements of aerosol and cloud quantities, essential for investigating the ACI. Under low SS conditions, only accumulation-mode aerosols were activated. However, a large number of fine-mode aerosols were activated as SS increased. The finding underlines the importance of using observations of fine-mode aerosol particles and CCN at different SS levels near the cloud base when investigating the impact of aerosol on mid- or high-level clouds.
For investigating the ACI, a cumulus cloud in the developing stage was analyzed. LWC and Re increased with increasing height within the cloud, but no clear relationship was found with respect to Vv. Values of Nc ranged from 10 to 2,680 cm−3, the average Nc was 767.9 ± 634.5 cm−3; Re ranged from 2.16 to 7.65 μm, the average Re was 5.17 ± 1.08 μm. At the sub-cloud, about 36.76% of aerosol particles were activated to CCN at 0.2% SS, and about 38.4% of aerosol particles were transformed to cloud droplets. The SS in the cloud increased then decreased with increasing height, and the maximum SS was ∼0.7%, occurring at 1,300 m above the cloud base. The ratio of Nc to Na increases gradually with height inside the cloud. The AIE was estimated to be 0.245 and 0.16 based on Nc and Re, respectively. The cloud droplet dispersion mainly attenuated the AIE by ∼34.7%.
The in-situ concurrent measurements of aerosol and cloud quantities are very unique in studying aerosol properties and cloud microphysics, especially in terms of their vertical variations, which renders a rare opporuntiy to study the ACI. Having said this, it is admitted that the samples of our measurements are highly limited which may undermine the general validity of the quantitative estimates of the ACI. It is worthy noting that the experiment was well planned and pursued over a long period of time virtually thoroughout the summer of 2020 during which we conducted 6 flights in total, but it was proven exceptionally difficult to be able to fly under ideal meteorological conditions due to various constraints, some of which being out of our control. Nevertheless, we felt it a fortunate to have the one under study that did pose an opportunity to gain such insights into aersol, cloud and the ACI in a region that is heavily polluted from a variety of sources. As far as instrumentation is concerned, a lack of information on the aerosol chemical composition disallows us to directly study its impact on the ACI. We will take it into account in our future aircraft campaigns by incorporating integrating more instruments and acquire more samples.
Data Availability Statement
The raw data supporting the conclusion of this article will be made available by the authors, without undue reservation.
Author Contributions
ZL and JL proposed and guided the study; ZC conducted the bulk of the investigation and drafted the original manuscript; PL and HS designed and participated in aircraft campaign; XG and YP revised the manuscript; YW, DZ, and GR operated and maintained the instruments used in the study.
Funding
This study was supported by the National Key R&D Program of China (2019YFC1510301) and the National Natural Science Foundation of China (42030606, 41805111).
Conflict of Interest
The authors declare that the research was conducted in the absence of any commercial or financial relationships that could be construed as a potential conflict of interest.
Publisher’s Note
All claims expressed in this article are solely those of the authors and do not necessarily represent those of their affiliated organizations, or those of the publisher, the editors and the reviewers. Any product that may be evaluated in this article, or claim that may be made by its manufacturer, is not guaranteed or endorsed by the publisher.
References
Abdul-Razzak, H., and Ghan, S. J. (2000). A Parameterization of Aerosol Activation: 2. Multiple Aerosol Types. J. Geophys. Res. 105 (D5), 6837–6844. doi:10.1029/1999jd901161
Abdul-Razzak, H., Ghan, S. J., and Rivera-Carpio, C. (1998). A Parameterization of Aerosol Activation: 1. Single Aerosol Type. J. Geophys. Res. 103 (D6), 6123–6131. doi:10.1029/97JD03735
Ackerman, A. S., Kirkpatrick, M. P., Stevens, D. E., and Toon, O. B. (2004). The Impact of Humidity above Stratiform Clouds on Indirect Aerosol Climate Forcing. Nature 432, 1014–1017. doi:10.1038/nature03174
Albrecht, B. A. (1989). Aerosols, Cloud Microphysics, and Fractional Cloudiness. Science 245, 1227–1230. doi:10.1126/science.245.4923.1227
Anderson, T. L., Charlson, R. J., Schwartz, S. E., Knutti, R., Boucher, O., Rodhe, H., et al. (2003). Climate Forcing by Aerosols-Aa Hazy Picture. Science 300 (5622), 1103–1104. doi:10.1126/science.1084777
Andreae, M. O., and Rosenfeld, D. (2008). Aerosol-cloud-precipitation Interactions. Part 1. The Nature and Sources of Cloud-Active Aerosols. Earth-Science Rev. 89, 13–41. doi:10.1016/j.earscirev.2008.03.001
Anil Kumar, V., Pandithurai, G., Leena, P. P., Dani, K. K., Murugavel, P., Sonbawne, S. M., et al. (2016). Investigation of Aerosol Indirect Effects on Monsoon Clouds Using Ground-Based Measurements over a High-Altitude Site in Western Ghats. Atmos. Chem. Phys. 16 (13), 8423–8430. doi:10.5194/acp-16-8423-2016
Berg, L. K., Berkowitz, C. M., Barnard, J. C., Senum, G., and Springston, S. R. (2011). Observations of the First Aerosol Indirect Effect in Shallow Cumuli. Geophys. Res. Lett. 38 (3), n/a. doi:10.1029/2010gl046047
Braga, R. C., Rosenfeld, D., Weigel, R., Jurkat, T., Andreae, M. O., Wendisch, M., et al. (2017). Further Evidence for CCN Aerosol Concentrations Determining the Height of Warm Rain and Ice Initiation in Convective Clouds over the Amazon basin. Atmos. Chem. Phys. 17 (23), 14433–14456. doi:10.5194/acp-17-14433-2017
Brenguier, J.-L., Burnet, F., and Geoffroy, O. (2011). Cloud Optical Thickness and Liquid Water Path - Does the K Coefficient Vary with Droplet Concentration? Atmos. Chem. Phys. 11 (18), 9771–9786. doi:10.5194/acp-11-9771-2011
Cohard, J.-M., Pinty, J.-P., and Bedos, C. (1998). Extending Twomey's Analytical Estimate of Nucleated Cloud Droplet Concentrations from CCN Spectra. J. Atmos. Sci. 55, 3348–3357. doi:10.1175/1520-0469(1998)055<3348:etsaeo>2.0.co;2
Deng, Z., Zhao, C., Zhang, Q., Huang, M., and Ma, X. (2009). Statistical Analysis of Microphysical Properties and the Parameterization of Effective Radius of Warm Clouds in Beijing Area. Atmos. Res. 93, 888–896. doi:10.1016/j.atmosres.2009.04.011
Duan, J., Chen, Y., and Guo, X. (2012). Characteristics of Aerosol Activation Efficiency and Aerosol and CCN Vertical Distributions in North China. Acta Meteorol. Sin 26 (5), 579–596. doi:10.1007/s13351-012-0504-6
Fan, J., Rosenfeld, D., Zhang, Y., Giangrande, S. E., Li, Z., Machado, L. A. T., et al. (2018). Substantial Convection and Precipitation Enhancements by Ultrafineaerosol Particles. Science 359 (6374), 411–418. doi:10.1126/science.aan8461
Fan, J., Wang, Y., Rosenfeld, D., and Liu, X. (2016). Review of Aerosol-Cloud Interactions: Mechanisms, Significance, and Challenges. J. Atmos. Sci. 73, 4221–4252. doi:10.1175/JAS-D-16-0037.1
Feingold, G., Eberhard, W. L., Veron, D. E., and Previdi, M. (2003a). First Measurements of the Twomey Indirect Effect Using Ground-Based Remote Sensors. Geophys. Res. Lett. 30 (6), 1287. doi:10.1029/2002GL016633
Feingold, G. (2003b). Modeling of the First Indirect Effect: Analysis of Measurement Requirements. Geophys. Res. Lett. 30 (19). doi:10.1029/2003gl017967
Grabowski, W. W. (1998). Toward Cloud Resolving Modeling of Large-Scale Tropical Circulations: a Simple Cloud Microphysics Parameterization. J. Atmos. Sci. 55 (21), 3283–3298. doi:10.1175/1520-0469(1998)055<3283:tcrmol>2.0.co;2
Gultepe, I., and Isaac, G. A. (2004). Aircraft Observations of Cloud Droplet Number Concentration: Implications for Climate Studies. Q. J. R. Meteorol. Soc. 130, 2377–2390. doi:10.1256/qj.03.120
Guo, J., Su, T., Li, Z., Miao, Y., Li, J., Liu, H., et al. (2017). Declining Frequency of Summertime Local-Scale Precipitation over Eastern China from 1970 to 2010 and its Potential Link to Aerosols. Geophys. Res. Lett. 44, 5700–5708. doi:10.1002/2017GL073533
Gustafson Jr, W. I., Berg, L. K., Easter, R. C., and Ghan, S. J. (2008). The Explicit-Cloud Parameterized-Pollutant Hybrid Approach for Aerosol-Cloud Interactions in Multiscale Modeling Framework Models: Tracer Transport Results. Environ. Res. Lett. 3, 025005. doi:10.1088/1748-9326/3/2/025005
Heymsfield, A., and Willis, P. (2014). Cloud Conditions Favoring Secondary Ice Particle Production in Tropical Maritime Convection. J. Atmos. Sci. 71 (12), 4500–4526. doi:10.1175/jas-d-14-0093.1
Huang, Y., Blyth, A. M., Brown, P. R. A., Choularton, T. W., Connolly, P., Gadian, A. M., et al. (2008). The Development of Ice in a Cumulus Cloud over Southwest England. New J. Phys. 10 (10), 105021. doi:10.1088/1367-2630/10/10/105021
IPCC (2021). in Climate Change 2021: The Physical Science Basis. Contribution of Working Group I to the Sixth Assessment Report of the Intergovernmental Panel on Climate Change. V Masson-Delmotte. Editor (Cambridge, UK: Cambridge University Press), 3929. Available at: https://www.ipcc.ch/report/ar6/wg1/downloads/report/IPCC_AR6_WGI_Full_Report.pdf.
IPCC (2013). in Climate Change 2013: The Physical Science Basis. Contribution of Working Group I to the Fifth Assessment Report of the Intergovernmental Panel on Climate Change. T. F. Stocker. Editor (Cambridge, United Kingdom and New York, NY, USA: Cambridge University Press), 1535. doi:10.1017/CBO9781107415324
Jiang, J. H., Su, H., Schoeberl, M. R., Massie, S. T., Colarco, P., Platnick, S., et al. (2008). Clean and Polluted Clouds: Relationships Among Pollution, Ice Clouds, and Precipitation in South America. Geophys. Res. Lett. 35, L14804. doi:10.1029/2008GL034631
Jiang, M., Li, Z., Wan, B., and Cribb, M. (2016). Impact of Aerosols on Precipitation from Deep Convective Clouds in Eastern China. J. Geophys. Res. Atmos. 121, 9607–9620. doi:10.1002/2015JD024246
Lawson, R. P., Woods, S., and Morrison, H. (2015). The Microphysics of Ice and Precipitation Development in Tropical Cumulus Clouds. J. Atmos. Sci. 72 (6), 2429–2445. doi:10.1175/jas-d-14-0274.1
Li, J., Yin, Y., Li, P., Li, Z., Li, R., Cribb, M., et al. (2015). Aircraft Measurements of the Vertical Distribution and Activation Property of Aerosol Particles over the Loess Plateau in China. Atmos. Res. 155, 73–86. doi:10.1016/j.atmosres.2014.12.004
Li, J., Li, P., Yuan, L., and Yin, Y. (2017). Physical and Optical Properties of Atmospheric Aerosols in Summer at a Suburban Site in North China. Aerosol Air Qual. Res. 17, 1474–1488. doi:10.4209/aaqr.2016.12.0525
Li, Z., Wang, Y., Guo, J., Zhao, C., Cribb, M. C., Dong, X., et al. (2019). East Asian Study of Tropospheric Aerosols and Their Impact on Regional Clouds, Precipitation, and Climate (EAST‐AIR CPC ). JGR Atmospheres 124, 13026–13054. doi:10.1029/2019JD030758
Liu, G. (2003). Retrieval of Cloud Droplet Size from Visible and Microwave Radiometric Measurements during INDOEX: Implication to Aerosols' Indirect Radiative Effect. J. Geophys. Res. 108 (D1). doi:10.1029/2001jd001395
Liu, J., Li, Z., and Cribb, M. (2016). Response of Marine Boundary Layer Cloud Properties to Aerosol Perturbations Associated with Meteorological Conditions from the 19-Month AMF-Azores Campaign. J. Atmos. Sci. 73 (11), 4253–4268. doi:10.1175/jas-d-15-0364.1
Liu, J., and Li, Z. (2018b). First Surface-Based Estimation of the Aerosol Indirect Effect over a Site in southeastern China. Adv. Atmos. Sci. 35 (2), 169–181. doi:10.1007/s00376-017-7106-2
Liu, J., and Li, Z. (2018a). Significant Underestimation in the Optically Based Estimation of the Aerosol First Indirect Effect Induced by the Aerosol Swelling Effect. Geophys. Res. Lett. 45 (11), 5690–5699. doi:10.1029/2018gl077679
Liu, Y., Daum, P. H., Guo, H., and Peng, Y. (2008). Dispersion Bias, Dispersion Effect, and the Aerosol-Cloud Conundrum. Environ. Res. Lett. 3 (4), 045021. doi:10.1088/1748-9326/3/4/045021
Liu, Y., and Daum, P. H. (2002). Indirect Warming Effect from Dispersion Forcing. Nature 419 (6907), 580–581. doi:10.1038/419580a
Liu, Y., and McGraw, R. L. (2005). Size Truncation Effect, Threshold Behavior, and a New Type of Autoconversion Parameterization. Geophys. Res. Lett. 32 (11). doi:10.1029/2005gl022636
Lohmann, U., and Feichter, J. (2005). Global Indirect Aerosol Effects: a Review. Atmos. Chem. Phys. 5, 715–737. doi:10.5194/acp-5-715-2005
Lohmann, U., and Hoose, C. (2009). Sensitivity Studies of Different Aerosol Indirect Effects in Mixed-phase Clouds. Atmos. Chem. Phys. 9, 8917–8934. doi:10.5194/acp-9-8917-2009
Lu, C., Niu, S., Liu, Y., and Vogelmann, A. M. (2013). Empirical Relationship between Entrainment Rate and Microphysics in Cumulus Clouds. Geophys. Res. Lett. 40, 2333–2338. doi:10.1002/grl.50445
Lu, M.-L., Feingold, G., Jonsson, H. H., Chuang, P. Y., Gates, H., Flagan, R. C., et al. (2008). Aerosol-cloud Relationships in continental Shallow Cumulus. J. Geophys. Res. 113, D15201. doi:10.1029/2007JD009354
Ma, J., Chen, Y., Wang, W., Yan, P., Liu, H., Yang, S., et al. (2010). Strong Air Pollution Causes Widespread Haze-Clouds over China. J. Geophys. Res. 115 (D18). doi:10.1029/2009jd013065
Martin, G. M., Johnson, D. W., and Spice, A. (1994). The Measurement and Parameterization of Effective Radius of Droplets in Warm Stratocumulus Clouds. J. Atmos. Sci. 51 (13), 1823–1842. doi:10.1175/1520-0469(1994)051<1823:tmapoe>2.0.co;2
Martins, J. A., and Silva Dias, M. A. F. (2009). The Impact of Smoke from forest Fires on the Spectral Dispersion of Cloud Droplet Size Distributions in the Amazonian Region. Environ. Res. Lett. 4 (1), 015002. doi:10.1088/1748-9326/4/1/015002
Menon, S., Del Genio, A. D., Kaufman, Y., Bennartz, R., Koch, D., Loeb, N., et al. (2008). Analyzing Signatures of Aerosol-Cloud Interactions from Satellite Retrievals and the GISS GCM to Constrain the Aerosol Indirect Effect. J. Geophys. Res. 113 (D14). doi:10.1029/2007jd009442
Nakajima, T., Higurashi, A., Kawamoto, K., and Penner, J. E. (2001). A Possible Correlation between Satellite-Derived Cloud and Aerosol Microphysical Parameters. Geophys. Res. Lett. 28 (7), 1171–1174. doi:10.1029/2000gl012186
Norris, J. R. (2005). Multidecadal Changes in Near-Global Cloud Cover and Estimated Cloud Cover Radiative Forcing. J. Geophys. Res. 110, D08206. doi:10.1029/2004JD005600
Padmakumari, B., Maheskumar, R. S., Anand, V., and Axisa, D. (2017). Microphysical Characteristics of Convective Clouds over Ocean and Land from Aircraft Observations. Atmos. Res. 195, 62–71. doi:10.1016/j.atmosres.2017.05.011
Pandithurai, G., Dipu, S., Prabha, T. V., Maheskumar, R. S., Kulkarni, J. R., and Goswami, B. N. (2012). Aerosol Effect on Droplet Spectral Dispersion in Warm continental Cumuli. J. Geophys. Res. 117 (D16), a–n. doi:10.1029/2011jd016532
Patade, S., Shete, S., Malap, N., Kulkarni, G., and Prabha, T. V. (2016). Observational and Simulated Cloud Microphysical Features of Rain Formation in the Mixed Phase Clouds Observed during CAIPEEX. Atmos. Res. 169, 32–45. doi:10.1016/j.atmosres.2015.09.018
Peng, Y., Lohmann, U., Leaitch, R., Banic, C., and Couture, M. (2002). The Cloud Albedo-Cloud Droplet Effective Radius Relationship for Clean and Polluted Clouds from RACE and FIRE.ACE. J. Geophys. Res. 107, AAC 1-1–AAC 1-6. doi:10.1029/2000JD000281
Penner, J. E., Dong, X., and Chen, Y. (2004). Observational Evidence of a Change in Radiative Forcing Due to the Indirect Aerosol Effect. Nature 427 (6971), 231–234. doi:10.1038/nature02234
Pinsky, M., and Khain, A. (2020). Calculation of Supersaturation Maximum and Droplet Concentration at Cloud Boundaries. Atmos. Res. 234, 104694. doi:10.1016/j.atmosres.2019.104694
Pinsky, M., Khain, A., Mazin, I., and Korolev, A. (2012). Analytical Estimation of Droplet Concentration at Cloud Base. J. Geophys. Res. 117, a–n. doi:10.1029/2012JD017753
Pruppacher, H. R., and Klett, J. D. (1997). Microphysics of Clouds and Precipitation. New York: Springer. doi:10.1023/A:1000652616430
Qiu, Y., Zhao, C., Guo, J., and Li, J. (2017). 8-Year Ground-Based Observational Analysis about the Seasonal Variation of the Aerosol-Cloud Droplet Effective Radius Relationship at SGP Site. Atmos. Environ. 164, 139–146. doi:10.1016/j.atmosenv.2017.06.002
Ramanathan, V., Cess, R. D., Harrison, E. F., Minnis, P., Barkstrom, B. R., Ahmad, E., et al. (1989). Cloud-Radiative Forcing and Climate: Results from the Earth Radiation Budget Experiment. Science 243 (4887), 57–63. doi:10.1126/science.243.4887.57
Rangno, A. L., and Hobbs, P. V. (2005). Microstructures and Precipitation Development in Cumulus and Small Cumulonimbus Clouds over the Warm Pool of the Tropical Pacific Ocean. Q. J. R. Meteorol. Soc. 131 (606), 639–673. doi:10.1256/qj.04.13
Rosenfeld, D., and Feingold, G. (2003). Explanation of Discrepancies Among Satellite Observations of the Aerosol Indirect Effects. Geophys. Res. Lett. 30 (14). doi:10.1029/2003gl017684
Rosenfeld, D., Williams, E., Andreae, M. O., Freud, E., Pöschl, U., and Rennó, N. O. (2012). The Scientific Basis for a Satellite mission to Retrieve CCN Concentrations and Their Impacts on Convective Clouds. Atmos. Meas. Tech. 5 (8), 2039–2055. doi:10.5194/amt-5-2039-2012
Rosenfeld, D., and Woodley, W. L. (2000). Deep Convective Clouds with Sustained Supercooled Liquid Water Down to -37.5 °C. Nature 405 (6785), 440–442. doi:10.1038/35013030
Rotstayn, L. D., and Liu, Y. (2003). Sensitivity of the First Indirect Aerosol Effect to an Increase of Cloud Droplet Spectral Dispersion with Droplet Number Concentration. J. Clim. 16 (21), 3476–3481. doi:10.1175/1520-0442(2003)016<3476:sotfia>2.0.co;2
Saleeby, S. M., Herbener, S. R., van den Heever, S. C., and L’Ecuyer, T. (2015). Impacts of Cloud Droplet-Nucleating Aerosols on Shallow Tropical Convection. J. Atmos. Sci. 72, 1369–1385. doi:10.1175/JAS-D-14-0153.1
Sawyer, V., and Li, Z. (2013). Detection, Variations and Intercomparison of the Planetary Boundary Layer Depth from Radiosonde, Lidar and Infrared Spectrometer. Atmos. Environ. 79, 518–528. doi:10.1016/j.atmosenv.2013.07.019
Seinfeld, J. H., and Pandis, S. N. (1998). Atmospheric Chemistry and Physics: From Air Pollution to Climate Change. New York: John Wiley & Sons, 1326.
Shipway, B. J., and Abel, S. J. (2010). Analytical Estimation of Cloud Droplet Nucleation Based on an Underlying Aerosol Population. Atmos. Res. 96, 344–355. doi:10.1016/j.atmosres.2009.10.005
Shrivastava, M., Berg, L. K., Fast, J. D., Easter, R. C., Laskin, A., Chapman, E. G., et al. (2013). Modeling Aerosols and Their Interactions with Shallow Cumuli during the 2007 CHAPS Field Study. J. Geophys. Res. Atmos. 118, 1343–1360. doi:10.1029/2012JD018218
Su, T., Li, Z., and Kahn, R. (2020). A New Method to Retrieve the Diurnal Variability of Planetary Boundary Layer Height from Lidar under Different Thermodynamic Stability Conditions. Remote Sensing Environ. 237, 111519. doi:10.1016/j.rse.2019.111519
Tas, E., Koren, I., and Altaratz, O. (2012). On the Sensitivity of Droplet Size Relative Dispersion to Warm Cumulus Cloud Evolution. Geophys. Res. Lett. 39, a–n. doi:10.1029/2012gl052157
Tas, E., Teller, A., Altaratz, O., Axisa, D., Bruintjes, R., Levin, Z., et al. (2015). The Relative Dispersion of Cloud Droplets: its Robustness with Respect to Key Cloud Properties. Atmos. Chem. Phys. 15 (4), 2009–2017. doi:10.5194/acp-15-2009-2015
Twohy, C. H. (2005). Evaluation of the Aerosol Indirect Effect in marine Stratocumulus Clouds: Droplet Number, Size, Liquid Water Path, and Radiative Impact. J. Geophys. Res. 110 (D8). doi:10.1029/2004jd005116
Twomey, S. (1977). The Influence of Pollution on the Shortwave Albedo of Clouds. J. Atmos. Sci. 34, 1149–1152. doi:10.1175/1520-0469(1977)034<1149:tiopot>2.0.co;2
Twomey, S. (1959). The Nuclei of Natural Cloud Formation Part II: The Supersaturation in Natural Clouds and the Variation of Cloud Droplet Concentration. Geofisica Pura e Applicata 43, 243–249. doi:10.1007/BF01993560
Wang, F., Li, Z., Zhao, D., Ma, X., Gao, Y., Sheng, J., et al. (2022). An Airborne Study of the Aerosol Effect on the Dispersion of Cloud Droplets in a Drizzling marine Stratocumulus Cloud over Eastern China. Atmos. Res. 265, 105885. doi:10.1016/j.atmosres.2021.105885
Wang, Y., Li, Z., Zhang, Y., Du, W., Zhang, F., Tan, H., et al. (2018). Characterization of Aerosol Hygroscopicity, Mixing State, and CCN Activity at a Suburban Site in the central North China Plain. Atmos. Chem. Phys. 18 (16), 11739–11752. doi:10.5194/acp-18-11739-2018
Wang, Y., Niu, S., Lu, C., Liu, Y., Chen, J., and Yang, W. (2019). An Observational Study on Cloud Spectral Width in North China. Atmosphere 10 (3), 109. doi:10.3390/atmos10030109
Wei, J., Li, Z., Pinker, R., Wang, J., Sun, L., Xue, W., et al. (2021). Himawari-8-Derived Diurnal Variations of Ground-Level PM2.5 Pollution Across China Using the Fast Space-Time Light Gradient Boosting Machine (LightGBM). Atmos. Chem. Phys. 21, 7863–7880. doi:10.5194/acp-21-7863-2021
Xie, X., and Liu, X. (2013). Analytical Studies of the Cloud Droplet Spectral Dispersion Influence on the First Indirect Aerosol Effect. Adv. Atmos. Sci. 30 (5), 1313–1319. doi:10.1007/s00376-012-2141-5
Xue, H., and Feingold, G. (2006). Large-eddy Simulations of Trade Wind Cumuli: Investigation of Aerosol Indirect Effects. J. Atmos. Sci. 63, 1605–1622. doi:10.1175/JAS3706.1
Xue, H., Feingold, G., and Stevens, B. (2008). Aerosol Effects on Clouds, Precipitation, and the Organization of Shallow Cumulus Convection. J. Atmos. Sci. 65, 392–406. doi:10.1175/2007JAS2428.1
Yang, J., Lei, H., and Lü, Y. (2017). Airborne Observations of Cloud Condensation Nuclei Spectra and Aerosols over East Inner Mongolia. Adv. Atmos. Sci. 34 (8), 1003–1016. doi:10.1007/s00376-017-6219-y
Yang, Y., Zhao, C., Dong, X., Fan, G., Zhou, Y., Wang, Y., et al. (2019). Toward Understanding the Process-Level Impacts of Aerosols on Microphysical Properties of Shallow Cumulus Cloud Using Aircraft Observations. Atmos. Res. 221, 27–33. doi:10.1016/j.atmosres.2019.01.027
Yuan, T., Remer, L. A., and Yu, H. (2011). Microphysical, Macrophysical and Radiative Signatures of Volcanic Aerosols in Trade Wind Cumulus Observed by the A-Train. Atmos. Chem. Phys. 11, 7119–7132. doi:10.5194/acp-11-7119-2011
Zhang, F., Li, Z., Li, Y., Sun, Y., Wang, Z., Li, P., et al. (2016). Impacts of Organic Aerosols and its Oxidation Level on CCN Activity from Measurement at a Suburban Site in China. Atmos. Chem. Phys. 16 (8), 5413–5425. doi:10.5194/acp-16-5413-2016
Zhang, F., Li, Z., Li, Y., Sun, Y., Wang, Z., Sun, L., et al. (2015). Challenges of Parameterizing CCN Due to Changes in Particle Physicochemical Properties: Implications from Observations at a Suburban Site in China. Chem. Phys. Discuss. 15. doi:10.5194/acpd-15-16141-2015
Zhang, F., Wang, Y., Peng, J., Ren, J., Collins, D., Zhang, R., et al. (2017). Uncertainty in Predicting CCN Activity of Aged and Primary Aerosols. J. Geophys. Res. Atmos. 122 (21), 723–11–736. doi:10.1002/2017jd027058
Zhang, Q., Quan, J., Tie, X., Huang, M., and Ma, X. (2011). Impact of Aerosol Particles on Cloud Formation: Aircraft Measurements in China. Atmos. Environ. 45 (3), 665–672. doi:10.1016/j.atmosenv.2010.10.025
Zhao, C., Qiu, Y., Dong, X., Wang, Z., Peng, Y., Li, B., et al. (2018a). Negative Aerosol-Cloud r e Relationship From Aircraft Observations Over Hebei, China. Earth Space Sci. 5, 19–29. doi:10.1002/2017EA000346
Zhao, C., Tie, X., Brasseur, G., Noone, K. J., Nakajima, T., Zhang, Q., et al. (2006). Aircraft Measurements of Cloud Droplet Spectral Dispersion and Implications for Indirect Aerosol Radiative Forcing. Geophys. Res. Lett. 33 (16). doi:10.1029/2006gl026653
Keywords: continental cumulus clouds, aerosol, aerosol indirect effect, spectral dispersion, aircraft observation
Citation: Cai Z, Li Z, Li P, Li J, Sun H, Gao X, Peng Y, Wang Y, Zhang D and Ren G (2022) Vertical Distributions of Aerosol and Cloud Microphysical Properties and the Aerosol Impact on a Continental Cumulus Cloud Based on Aircraft Measurements From the Loess Plateau of China. Front. Environ. Sci. 9:808861. doi: 10.3389/fenvs.2021.808861
Received: 04 November 2021; Accepted: 17 December 2021;
Published: 06 January 2022.
Edited by:
Bin Zhao, Tsinghua University, ChinaReviewed by:
Jingyi Chen, Pacific Northwest National Laboratory (DOE), United StatesHongrong Shi, Institute of Atmospheric Physics (CAS), China
Chandan Sarangi, Indian Institute of Technology Madras, India
Copyright © 2022 Cai, Li, Li, Li, Sun, Gao, Peng, Wang, Zhang and Ren. This is an open-access article distributed under the terms of the Creative Commons Attribution License (CC BY). The use, distribution or reproduction in other forums is permitted, provided the original author(s) and the copyright owner(s) are credited and that the original publication in this journal is cited, in accordance with accepted academic practice. No use, distribution or reproduction is permitted which does not comply with these terms.
*Correspondence: Zhanqing Li, zli@atmos.umd.edu; Junxia Li, ljx22258@126.com