Dynamics and Determinants of Market Integration of Green, Clean, Dirty Energy Investments and Conventional Stock Indices
 Xin Liu
 Elie Bouri
 Naji Jalkh
- 1School of Economics and Management, MianYang Teachers’ College, MianYang, China
- 2School of Business, Lebanese American University, Beirut, Lebanon
- 3Faculty of Business and Management, Saint Joseph University, Beirut, Lebanon
We examine market integration across and clean and green investments, crude oil, and conventional stock indices covering technology stocks, and United States and European stocks. Using daily data covering the period December 1, 2008—October 8, 2020, we first apply the dynamic equicorrelation (DECO) model and make inferences regarding the time-varying level of market integration. Then, we use several regression models and uncover the driving factors of market integration under lower and upper quantiles of the distribution of the equicorrelation. The results show that return equicorrelation varies with time and is shaped by the COVID19 outbreak. Various uncertainty measures are the main drivers of market integration, especially at high levels of market integration. During the COVID-19 outbreak period, the United States Dollar index, the term spread, and the Chinese stock market index have significantly increased market integration.
1 Introduction
It is often argued that an increase/decrease in the correlation across markets can be considered as evidence of an increased/decreased market integration, which matters to asset pricing, asset allocation, and risk management. The related academic literature on market integration has been grown over the past decades covering various markets and asset classes such as stocks, bonds, and commodities (e.g., Bekaert and Harvey, 1995; Pukthuanthong and Roll, 2009; Aladesanmi et al., 2019; Batten et al., 2019; Saji, 2021). However, market integration is an evolving phenomenon that can be shaped by various macroeconomic events and financial crises, and the COVID-19 can be relevant in this regard given the unprecedented uncertainty and damage that it has induced on the economic and financial scenes.
In early 2020, the COVID-19 pandemic abruptly emerged as a global health crisis of a magnitude not seen before affecting the human life, before transforming into a crisis affecting global economic conditions and shaping the financial markets worldwide. The COVID-19 outbreak led to severe health problems and social massive disruption, which imposed intense and unparalleled challenges for individuals, societies, economies, financial markets, and policymakers. By the second quarter of 2021, the number of infected people reached more than 200 million and the number of deaths exceeded 5 million. On the economic front, many countries plunged into a deep recession and the level of unemployment spiked to high levels, in spite of the efforts of governments to neutralize the economic downturn with fiscal and monetary policy support. On the financial scene, global financial markets reacted negatively to the pandemic, especially around its early period of February-April 2020. Notably, oil demand collapsed and there was a crash in oil prices and global stock markets indices. Interestingly, the universe of clean and green investments showed some resilience to the COVID-19 outbreak, especially if one considers their price performance relative to that of dirty energy investments (e.g., crude oil), and conventional stock investments in the United States and Europe. A lower level of resilience was shown for investments in the stock of technology companies that are key to the developments of new technological innovations for clean energy products and services (See the figures in the Supplementary Figure S1).
The above discussion motives us to consider the universe of clean and dirty energy investments, and conventional stock indices as well as technology stocks. A look into the academic literature reveals that previous studies have focused on the effect of the COVID-19 outbreak on economic activities (König and Winkler, 2020; Ozili and Arun, 2020), equity markets in the United States and Europe (Abuzayed et al., 2021; Bouri et al., 2021), and the price dynamics of crude oil and clean energy stock indices (Saeed et al., 2020a; Saeed et al., 2020b; Dutta et al., 2021). Although green bonds and clean energy investments have attracted a lot of attention from economic actors over the past 10–15 years, few studies have considered the effects of the pandemic on these investments. Notably, there is a lack of studies on market integration in the universe of green, clean, dirty energy investments, technology stocks, and conventional stock indices, and it is not clear which economic and financial variables can determine market integration and what is the effect of the COVID-19 outbreak.
Against this background, the aim of this study is to examine the integration in the markets of clean and green investments, crude oil, technology stocks, and United States and European stocks. Using daily data covering the period December 1, 2008—October 8, 2020, we apply the dynamic equicorrelation (DECO) model of Engle and Kelly (2012) and make inferences regarding the time-varying level of market integration. Then, we use several regression models and uncover the driving factors of market integration under lower, middle, and upper quantiles of the distribution of the equicorrelation. The advantage of the DECO model resides in its ability and power to process a large number of return series while overcoming estimation and numerical problems. In that sense, the DECO is superior and more convenient than other multivariate GARCH models such as the DCC or the BEKK models and their variants. This related to the fact that the DECO model treats the correlation among indices under study to be contemporaneously equal but uneven over time, which is suitable to the context of our study seeking to uncover the time evolution of market integration.
Our current paper contributes to the existing literature on several fronts. Firstly, it focuses on the market integration among various types of investments covering green bonds, clean energy stocks, crude oil, technology stocks and aggregate stock indices from the United States and Europe. This extends previous studies on market integration, which limit their analysis to the universe of equities (Aladesanmi et al., 2019; Saji, 2021) or energy commodities (e.g., Batten et al., 2019). Secondly, it uncovers the time-variation in the level of market integration via the application of the DECO equicorrelation that allows for taking into account the stylized facts of the return of variables such as volatility clustering, heteroscedasticity, and fat tails. Third, it uncovers the drivers of market integration using both standard and quantile repressions and considering a large set of economic and financial variables as well as the COVID-19 outbreak.
Our current study is related to a growing literature focusing the information transmission across clean and dirty energy investments (Ferrer et al., 2018; Ferreira et al., 2021), crude oil and stock market indices (Dawar et al., 2021; Geng et al., 2021), and the factors affecting each of these assets (Batten et al., 2019; Saeed et al., 2020a). However, our current study is different in its focus on market integration among the above-mentioned and the determinants factors under various quantiles as well as the use of the DECO model that processes a large number of time series without encountering the problem of dimensionality.
Our empirical analysis indicates that integration in the markets under study is evolves over time and is affected by the COVID-19 outbreak. This result is relevant to trading strategies, and portfolio allocation and risk management that involve an investment combining green bonds, clean stocks, crude oil, technology stocks and stock indices. Results from regressions analysis show that main drivers of market integration are various global uncertainty measures, especially at high levels of market integration. Further analysis indicates that the United States Dollar index and term spread have significantly increased the equicorrelation during the COVID-19 outbreak period.
The rest of the paper is structured in three sections as follows. The employed data and models are described in Section 2. The empirical results of the time evolution of equicorrelation and its drivers are presented in Section 3. Some policy implications and concluding remarks are provided in Section 4.
2 Data and Models
2.1 The Dataset
Our dataset is at the daily frequency, covering the indices of green bonds, clean energy stocks, Arca technology 100, S&P 500, Brent crude oil prices, S&P 500 composite index, and Eurostoxx 50. Price data are extracted from the DataStream of Refinitiv. The sample period is December 1, 2008—October 8, 2020, as depicted by data availability. All series are transformed to log-returns multiplied by 100, yielding 3,084 daily return observations for each index. The Appendix Figure 1 plots the time evolution of levels and log returns of the six indices.
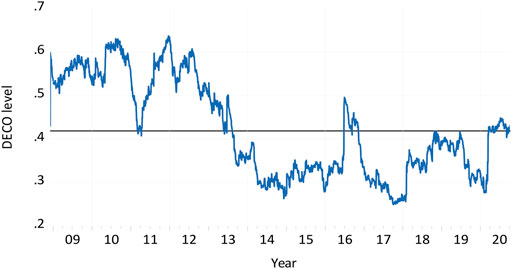
FIGURE 1. The return equicorrelation. Notes: This figure shows the time evolution of the DECO return equicorrelation among the indices under study (estimated based on the model described in Section 2.2.) for the period December 1, 2008—October 8, 2020.
The summary statistics of daily returns are shown in Table 1. Arca technology 100 index offers the highest average return, followed by the S&P 500. Crude oil returns exhibit a negative average return and the highest standard deviation. Conversely, green bonds have the lowest standard deviation. The returns of all indices are negatively skewed, except green bonds. There is evidence of excess kurtosis in all indices. The Jarque-Bera statistics show a departure from the Gaussian distribution for all return series. Evidence from the Augmented Dickey-Fuller (ADF) test (Dickey and Fuller, 1979) points toward the stationarity of all return series. Conditional heteroscedasticity is significant as indicated by the results of the ARCH-LM test. Pairwise correlations across the returns of the six indices (Table 2) are all positive, ranging between 0.1888 (green bonds and crude oil), and 0.9458 (Arca technology 100 and S&P 500). Notably, the correlations between green bonds and the other indices are the weakest.
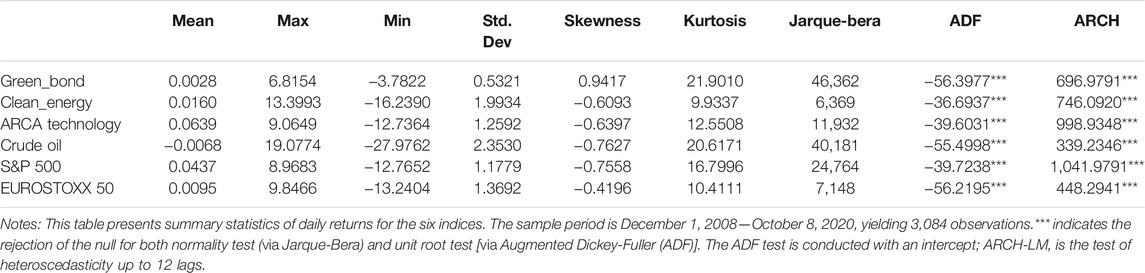
TABLE 1. Summary statistics of daily returns.
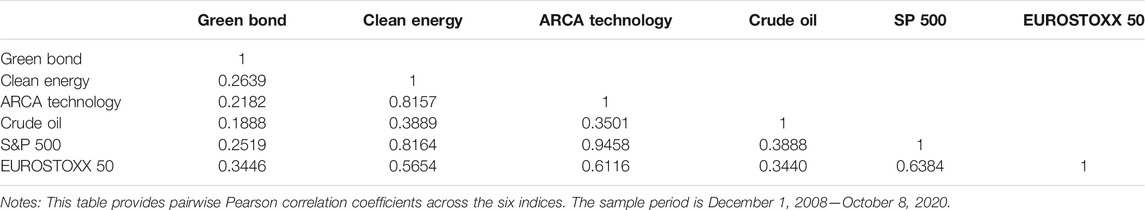
TABLE 2. Unconditional correlation of daily returns.
2.2 The DECO Model
The dynamic equicorrelation (DECO) model is used to study market integration among the various indices under study. This model proposed by Engle and Kelly (2012) is known for its efficiency in estimating covariance matrices without the numerical problems often encountered in other multivariate GARCH models (e.g., DCC and BEKK models).
Assume that
The conditional covariance matrix
where the diagonal matrix (
where
After estimating the univariate GARCH process in Eq. 5, we use the standardized residuals
where
where
To estimate the DCC process of Engle (2002), first we fit univariate GARCH models for each return series. Then, we compute conditional correlation dynamics. However, as the number of series under study increases, it becomes difficult to estimate Eq. 6. Therefore, Engle and Kelly (2012) suggest the DECO model that assumes that the correlation across all return series is the same at any given time but varies over time. In fact, the DECO model simplifies the estimation process by reducing it to two equicorrelation parameters, α and β. It follows that the unconditional correlation matrix is:
where
We define the scalar DECO model as1:
2.3 Drivers of Return Equicorrelation
In this section, we examine the potential drivers of the DECO return equicorrelation. Once the return equicorrelation series is extracted from the DECO model as shown in Section 2.2, its driving factors are uncovered using OLS and quantile regressions to make inferences regarding the determinants of market integration among the six indices under study. The base (OLS) regression model is specified as:
where VIX, OVX, EPU, DXY, FSI, TERM, and EMV denote CBOE United States implied volatility index, CBOE oil implied volatility, United States economic policy uncertainty (Baker et al., 2016), United States dollar index, OFR financial stress index, term spread (difference spread between 10-Year and 3-months Treasury Constant Maturities, a proxy for recession probabilities), and infectious EMV index (Baker et al., 2019), respectively. All are extracted from the DataStream of Refnitiv, except for data on FSI and EMV which are downloaded from https://www.policyuncertainty.com/infectious_EMV.html and https://www.financialresearch.gov/financial-stress-index/, respectively.
The choice of the explanatory variables is motivated by previous findings (e.g., Batten et al., 2019; Saeed et al., 2020a; Gupta et al., 2021) and the following rationales. Firstly, we use the United States VIX because it is a proxy for the United States stock market uncertainty. High levels of the VIX are often associated with low levels in the S&P 500 index. Secondly, the OVX is used as a barometer of uncertainty in the crude oil market. For example, during the COVID-19 outbreak, the OVX reached unpreceded levels not seen before, exceeding those reported during the oil price crash of 2014–2016. Saeed et al. (2020a) has shown that the connectedness between clean and dirty energy investments is affected by the OVX. Thirdly, the United States EPU is used because it represents the only uncertainty metric available at the daily frequency by Baker et al. (2016). This is suitable as the United States economy is considered as the locomotive for the world economy. By using EPU, we add to the scare evidence on the role of EPU for market integration in general and the correlation dynamics of clean, dirty energy investments and stock market indices. Our motivation to use uncertainty measures (e.g. VIX and EPU) on correlations arises from the growing literature showing the uncertainty surrounding the decision and policies of economists during crisis periods such as the 2008 global financial crisis and the COVID-19 outbreak. Fourthly, the United States dollar index is used as a potential explanatory variable for market integration given its effect not only on crude oil prices and stock market indices, but also on the relationship between United States and European stock indices. Fifthly, EMV is a newspaper-based Infectious disease Equity Market Volatility Tracker, constructed by Baker et al. (2019). It has the particularity of accounting for infectious diseases including the recent COVID-19. Several studies have shown the power of this index in driving financial markets (e.g., Gupta et al., 2021). Sixthly, FSI is the OFR financial stress index that measures the degree of financial stress in financial markets. Seventhly, the term spread is the difference spread between 10-Year and 3-months Treasury Constant Maturities, a proxy for recession probabilities.
To save space, we do not provide the summary statistics and unit root tests of the explanatory variables in Eq. 11. Instead, we indicate here that the results of Augmented Dicky Fuller and Phillips-Perron tests indicate that VIX, OVX, EPU, and FSI are stationary at levels, therefore we use the level of these variables in the regression models. In contrast, DXY, term spread, and EMV are non-stationary and therefore we use the first-difference of these variables.
Besides applying an OLS model to Eq. 11, we consider a quantile regression that allows to uncover the drivers of the various states (high and low) of the return equicorrelation. The benefits of using a quantile regression are well recognized in academia, which includes its ability to move beyond the mean function into low and high quantile functions of the conditional distribution of the dependent variable (Koenker and Bassett, 1978; Koenker, 2005). The quantile regression has been recently applied in various papers covering the fields of finance, economics, and energy (e.g., Bouri et al., 2019; Dawar et al., 2021).
The quantile version of Eq. 11 involving the
where
where
Besides applying the baseline regression model in Eq. 11, we examine the COVID-19 effect on the drivers of equicorrelation. To this end, we add the COVID-19 interaction terms, by multiplying the COVID-19 dummy variable with each regressor. Therefore, we estimate the following augmented model:
where DCOVID is a dummy variable representing the COVID-19 outbreak. It takes the value of 1 from February 2020 till the end of the sample period (October 8, 2020) and 0 otherwise.
3 Empirical Results
3.1 Results of the DECO Model
Our first results involve the DECO model (Table 3). The parameter β (0.9825) is high and significant, suggesting a persistence in the association among the six indices under study. The parameter α (0.0134) is significant. Notably, α + β is near unity, suggesting integrated equicorrelation. Regarding the ARCH and GARCH parameters estimated in the first stage, they are both significant at the 1% level for all return series2. Notably, the GARCH term ranges between 0.8147 for the S&P 500 to 0.9268 for the Green Bond Index.
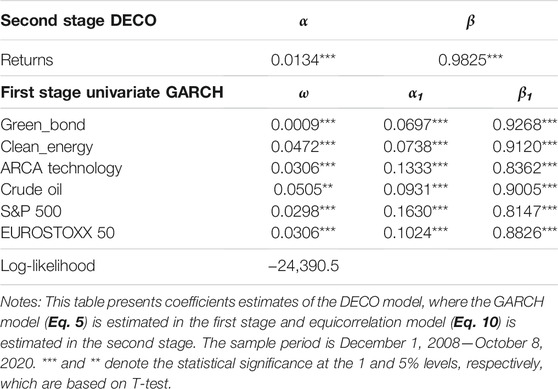
TABLE 3. DECO estimates for cryptocurrencies return.
Moving to the plot of equicorrelation (Figure 1), it shows clear evidence of variation in its time evolution. Notably, it varies between 0.25 and 0.66, with an average value of 0.42 shown by the solid line. The equicorrelation peaked at 0.64 in August 2010 and December 2011, which corresponds to temporary peaks in the levels of many indices such as green bonds, clean energy stocks, and crude oil prices. Conversely, a trough is noticed in late September 2017 and February 2020 just before the erupt of the COVID19 after which the level of the equicorrelation increased to 0.44, suggesting an increase in the level of market integration around the pandemic. During that period of increased uncertainty in financial markets, crude oil prices crashed, and equity indices declined sharply. Therefore, the indices under study appear to be more subject to contagious effects if one index such as crude oil experiences a price collapse. However, we notice various price behaviours in the relationship between the six indices under study and the average equicorrelation. In fact, from 2015 till late 2019, broad equity indices, the technology index, and to some extent, the crude oil market, experienced a long uptrend, whereas the rest of indices entered into a congestion (side-way) area. Accordingly, the equicorrelation reached its bottoms around Q3-2017. While all the indices experienced a major decline during the COVID-19 outbreak period, we notice a major long spike in the clean energy stock index which led this index to move to new all-time levels. During that time, the level of integration increased to 0.44, which generally concords with previous studies showing that the level of correlation among financial markets increases during times of stress (Longin and Solnik, 2001).
3.2 Drivers of Return Equicorrelation
In this section, we consider the significance of the potential drivers of equicorrelation, as specified in Eqs. 11–13.
The estimated results based on the OLS regression specified in Eq. 11 are reported in Table 4. They show that VIX, EPU, FSI, and ΔEMV are significant drivers of the mean return equicorrelation. Specifically, the coefficients of VIX, EPU, and ΔEMV are positive and significant at the 1, 5, and 10% levels, respectively, whereas the coefficient of FSI is negative and significant at the 5% level. In terms of magnitude, the strongest effect is for VIX and FSI, followed by EMV and EPU, which indicates the closer relationship in mean between global market uncertainty measures and market integration among green, clean, dirty energy investments, technology stocks, and conventional stock indices.
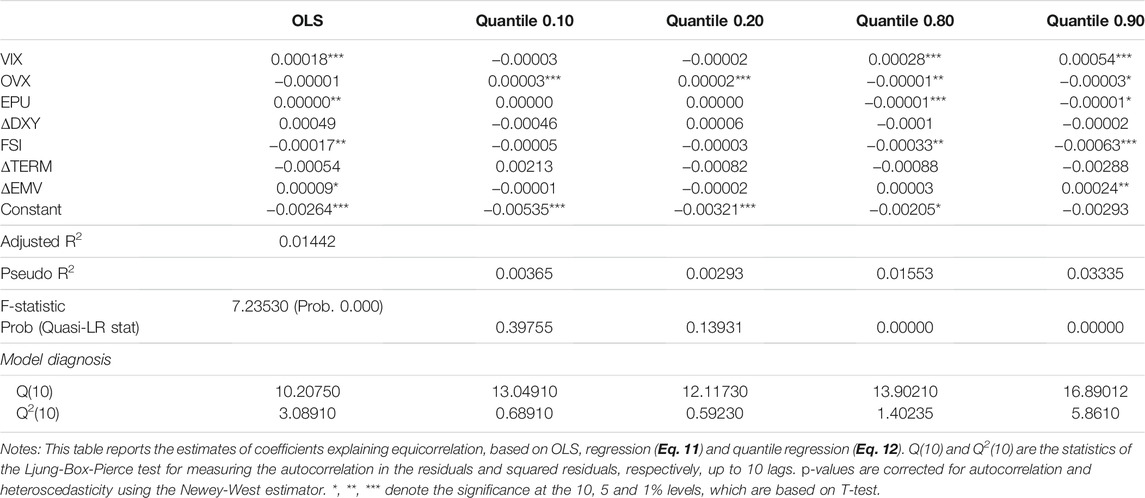
TABLE 4. Drivers of return equicorrelation– OLS and quantile regressions.
Next, we move to the drivers of return equicorrelation across lower and upper quantiles based on a quantile regression (Eq. 12). The estimated results from Table 4 show some differences between the determinants of the return equicorrelation at lower and upper quantiles, which further motivates our decision to employ the quantile regression. In fact, at low levels of the equicorrelation (i.e., quantiles 0.10 and 0.20), only OVX is a significant driver of market integration, with a positive coefficient that is significant at the 1% level. However, at high levels of the equicorrelation (i.e., quantiles 0.80), more variables are significant drivers of market integration, which is highlighted in the increase of the Pseudo R2 and the probability value of the Quasi-LR stat. Notably, VIX, OVX, EPU, and FSI are significant drivers of market integration, with the coefficient of the VIX being positive while the coefficient of the rest is negative. At quantile 0.90, the coefficient of ΔEMV becomes significant, and the VIX coefficient intensifies in magnitude while remaining in positive territories. Therefore, at higher quantiles (80 and 90%), the positive VIX coefficients confirm, bolster and support the increase in the level of correlation among financial markets during times of stress as showed in previous studies (Longin and Solnik, 2001). This finding is reinforced by the well-acknowledged negative correlation between the market fear index and the S&P500.
Considering the results of the interactions terms, Table 5 shows that only the coefficients of interaction ΔDXY*DCOVID and ΔTERM*DCOVID are statistically significant. Both are positive, which implies that during the COVID-19 outbreak period the United States Dollar index and Term spread have significantly increased the equicorrelation of green, clean, dirty energy investments. The other interaction terms do not have any statistical significance, suggesting that other variables do not drive market integration during the pandemic.
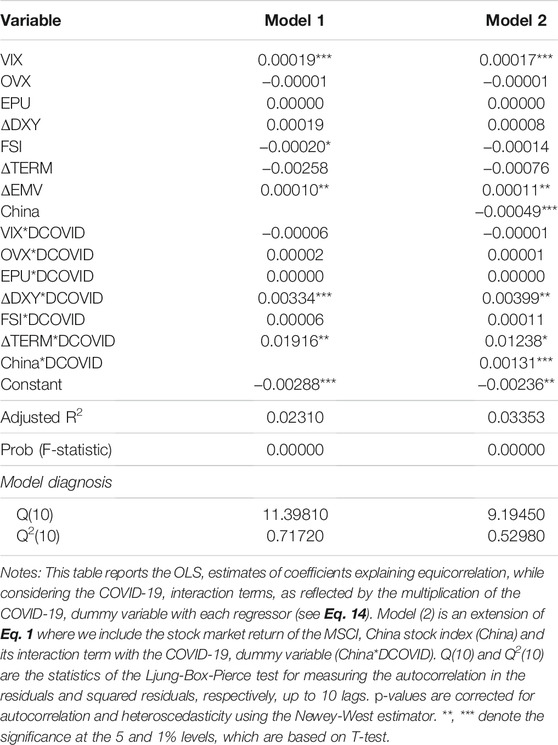
TABLE 5. Drivers of return equicorrelation—OLS regression and COVID-19 interaction terms.
Given that China has been playing an important role in clean and green investments, crude oil, and conventional stock indices covering technology stocks as the second largest economy, we consider the effect of its stock market index returns on market integration. To this end, we re-run Eq. 14 while adding the returns of the MSCI China stock index3 as an additional explanatory variable. Furthermore, we also add an interaction term (China*DCOVID) given that China has went through pandemic4. The results are reported under the Model 2 in Table 5. They show that not only the Chinese stock market returns have a significant effect on the equicorrelation of green, clean, dirty energy investments but its interaction term with the COVID-19 dummy variable is also significant, with a positive value, suggesting it has significantly increased the market integration among the indices under study.
Overall5, the above-mentioned results improve our understanding of the factors affecting market integration in the universe of green, clean, dirty energy investments, technology stocks, and conventional stock indices. This adds to the existing literature such as Dutta et al. (2021) and Saeed et al. (2020b), which tends to study return spillovers without considering the time evolution of integration and the financial and economic factors that can affect it.
4 Concluding Remarks
To enrich the academic literature on market integration, we provide in this paper first empirical evidence on the time evolution of the return equicorrelation in the universe of green, clean, dirty energy investments, technology stocks, and conventional stock indices as well as evidence on the drivers of market integration and the effect of the COVID-19 outbreak. Our main findings are as follows: First, market integration as measured by the DECO return equicorrelation is a dynamic phenomenon that evolves with time, and it is slightly affected by the COVID-19 outbreak. Second, the factors driving market integration differs between lower and upper quantiles of the distribution of return equicorrelation. Thirdly, VIX, OVX, EPU, FSI, and EMV are the main drivers of market integration at high levels of market integration, whereas VIX, EPU, and FSI play a significant role when mean-based estimators are used. Fourthly, the results from the interaction terms in Table 5 show that the United States Dollar index, Term spread, and the Chinse stock market index have significantly increased the equicorrelations during the COVID-19 outbreak period.
The above findings matter to investors and portfolio managers keen to understand the dynamics of conditional correlations among clean, dirty energy investments and stock market indices, which can affect diversification strategies and concern asset pricing. This is especially relevant during crisis periods such as the COVID-19 outbreak which seems to influence market integration and the identity of its drivers. They also matter to investors mixing green and non-green investments in their portfolio and to the policy makers who often ask for more greener and environmentally friendly investments. In that sense, future research can consider return equicorrelation and the activities of speculators and investors to make more refined inferences on how the identity of market participant can affect market integration among green, clean, dirty energy investments, technology stocks, and conventional stock indices.
Data Availability Statement
The data analyzed in this study is subject to the following licenses/restrictions: Data were extracted from DataStream. Requests to access these datasets should be directed to elie.elbouri@lau.edu.lb.
Author Contributions
XL: Methodology, data curation, formal analysis, validation, writing sections of the article. NJ: Methodology, writing-original draft preparation. EB: Conceptualization, methodology, data curation, formal analysis, writing-original draft preparation.
Funding
XL acknowledges the following: Project of Sichuan County Economic Development Research Center, Key Social Science Research Base of Sichuan Province “Study on indicator System and Evaluation Method of Rural Green Development at County level in Sichuan” (XY2018028).
Conflict of Interest
The authors declare that the research was conducted in the absence of any commercial or financial relationships that could be construed as a potential conflict of interest.
Publisher’s Note
All claims expressed in this article are solely those of the authors and do not necessarily represent those of their affiliated organizations, or those of the publisher, the editors and the reviewers. Any product that may be evaluated in this article, or claim that may be made by its manufacturer, is not guaranteed or endorsed by the publisher.
Supplementary Material
The Supplementary Material for this article can be found online at: https://www.frontiersin.org/articles/10.3389/fenvs.2021.786528/full#supplementary-material
Footnotes
1The reader can see the log-likelihood function in Engle and Kelly (2012).
2These results are available from the authors upon request.
3The MSCI China Index reflects the stock price performance of large and mid cap Chinese companies covering 740 constituents that represent 85% of the China equity universe. Its data are collected from the DataStream of Refinitiv and its returns are computed as log-returns multiplied by 100.
4We thank an anonymous reviewer for making this important suggestion.
5The results remain qualitatively unchanged when the asymmetric term is incorporated into the univariate GARCH model.
References
Abuzayed, B., Bouri, E., Al-Fayoumi, N., and Jalkh, N. (2021). Systemic Risk Spillover Across Global and Country Stock Markets during the COVID-19 Pandemic. Econ. Anal. Pol. 71, 180–197. doi:10.1016/j.eap.2021.04.010
Aladesanmi, O., Casalin, F., and Metcalf, H. (2019). Stock Market Integration between the UK and the US: Evidence over Eight Decades. Glob. Finance J. 41, 32–43. doi:10.1016/j.gfj.2018.11.005
Baker, S. R., Bloom, N., Davis, S. J., and Kost, K. J. (2019). Policy News and Stock Market Volatility (No. W25720). Cambridge, MA, United States. National Bureau of Economic Research.
Baker, S. R., Bloom, N., and Davis, S. J. (2016). Measuring Economic Policy Uncertainty*. Q. J. Econ. 131 (4), 1593–1636. doi:10.1093/qje/qjw024
Batten, J. A., Kinateder, H., Szilagyi, P. G., and Wagner, N. F. (2019). Time-varying Energy and Stock Market Integration in Asia. Energ. Econ. 80, 777–792. doi:10.1016/j.eneco.2019.01.008
Bekaert, G., and Harvey, C. R. (1995). Time-Varying World Market Integration. J. Finance 50 (2), 403–444. doi:10.1111/j.1540-6261.1995.tb04790.x
Bouri, E., Cepni, O., Gabauer, D., and Gupta, R. (2021). Return Connectedness Across Asset Classes Around the COVID-19 Outbreak. Int. Rev. Financial Anal. 73, 101646. doi:10.1016/j.irfa.2020.101646
Bouri, E., Jalkh, N., and Roubaud, D. (2019). Commodity Volatility Shocks and BRIC Sovereign Risk: A GARCH-Quantile Approach. Resour. Pol. 61, 385–392. doi:10.1016/j.resourpol.2017.12.002
Buchinsky, M. (1995). Estimating the Asymptotic Covariance Matrix for Quantile Regression Models a Monte Carlo Study. J. Econom. 68 (2), 303–338. doi:10.1016/0304-4076(94)01652-g
Dawar, I., Dutta, A., Bouri, E., and Saeed, T. (2021). Crude Oil Prices and Clean Energy Stock Indices: Lagged and Asymmetric Effects with Quantile Regression. Renew. Energ. 163, 288–299. doi:10.1016/j.renene.2020.08.162
Dickey, D. A., and Fuller, W. A. (1979). Distribution of the Estimators for Autoregressive Time Series with a Unit Root. J. Am. Stat. Assoc. 74 (366a), 427–431. doi:10.1080/01621459.1979.10482531
Dutta, A., Bouri, E., Dutta, P., and Saeed, T. (2021). Commodity Market Risks and Green Investments: Evidence from India. J. Clean. Prod. 318, 128523. doi:10.1016/j.jclepro.2021.128523
Engle, R. (2002). Dynamic Conditional Correlation. J. Business Econ. Stat. 20 (3), 339–350. doi:10.1198/073500102288618487
Engle, R., and Kelly, B. (2012). Dynamic Equicorrelation. J. Business Econ. Stat. 30 (2), 212–228. doi:10.1080/07350015.2011.652048
Ferreira, P., Almeida, D., Dionísio, A., Bouri, E., and Quintino, D. (2021). Energy Markets – Who Are the Influencers? Energy 239, 121962. doi:10.1016/j.energy.2021.121962
Ferrer, R., Shahzad, S. J. H., López, R., and Jareño, F. (2018). Time and Frequency Dynamics of Connectedness between Renewable Energy Stocks and Crude Oil Prices. Energ. Econ. 76, 1–20. doi:10.1016/j.eneco.2018.09.022
Geng, J.-B., Liu, C., Ji, Q., and Zhang, D. (2021). Do oil Price Changes Really Matter for Clean Energy Returns? Renew. Sustain. Energ. Rev. 150, 111429. doi:10.1016/j.rser.2021.111429
Gupta, R., Subramaniam, S., Bouri, E., and Ji, Q. (2021). Infectious Disease-Related Uncertainty and the Safe-haven Characteristic of US Treasury Securities. Int. Rev. Econ. Finance 71, 289–298. doi:10.1016/j.iref.2020.09.019
Koenker, R., and Bassett, G. (1978). Regression Quantiles. Econometrica 46, 33–50. doi:10.2307/1913643
Koenker, R. W., and d'Orey, V. (1987). Algorithm AS 229: Computing Regression Quantiles. Appl. Stat. 36 (3), 383–393. doi:10.2307/2347802
König, M., and Winkler, A. (2020). COVID-19 and Economic Growth: Does Good Government Performance Pay off? Intereconomics 55 (4), 224–231. doi:10.1007/s10272-020-0906-0
Longin, F., and Solnik, B. (2001). Extreme Correlation of International Equity Markets. J. Finance 56, 649–676. doi:10.1111/0022-1082.00340
Ozili, P. K., and Arun, T. (2020). Spillover of COVID-19: Impact on the Global Economy. SSRN Electron. J. Available at SSRN 3562570. doi:10.2139/ssrn.3562570
Pukthuanthong, K., and Roll, R. (2009). Global Market Integration: An Alternative Measure and its Application☆. J. Financial Econ. 94 (2), 214–232. doi:10.1016/j.jfineco.2008.12.004
Saeed, T., Bouri, E., and Alsulami, H. (2020a). Extreme Return Connectedness and its Determinants between Clean/Green and Dirty Energy. Energ. Econ. 96, 105017. doi:10.1016/j.eneco.2020.105017
Saeed, T., Bouri, E., and Tran, D. K. (2020b). Hedging Strategies of Green Assets Against Dirty Energy Assets. Energies 12 (13), 3141. doi:10.3390/en13123141
Keywords: green bonds, clean energy stocks, crude oil, equity indices, DECO equicorrelation, drivers of integration, COVID19 JEL classification: C22, G10
Citation: Liu X, Bouri E and Jalkh N (2021) Dynamics and Determinants of Market Integration of Green, Clean, Dirty Energy Investments and Conventional Stock Indices. Front. Environ. Sci. 9:786528. doi: 10.3389/fenvs.2021.786528
Received: 30 September 2021; Accepted: 11 November 2021;
Published: 01 December 2021.
Edited by:
Zhen Wang, Huazhong Agricultural University, ChinaReviewed by:
Partha Gangopadhyay, Western Sydney University, AustraliaZhenxing Liu, University of North Carolina at Chapel Hill, United States
Copyright © 2021 Liu, Bouri and Jalkh. This is an open-access article distributed under the terms of the Creative Commons Attribution License (CC BY). The use, distribution or reproduction in other forums is permitted, provided the original author(s) and the copyright owner(s) are credited and that the original publication in this journal is cited, in accordance with accepted academic practice. No use, distribution or reproduction is permitted which does not comply with these terms.
*Correspondence: Elie Bouri, eliebouri@usek.edu.lb