The Particulate Organic Carbon-to-Nitrogen Ratio Varies With Ocean Currents
 Shengjun Xiao
 Linlin Zhang1,2
  Wen Luo
- 1Key Laboratory of Virtual Geographic Environment, School of Geography, Ministry of Education, Nanjing Normal University, Nanjing, China
- 2Jiangsu Center for Collaborative Innovation in Geographical Information Resource Development and Application, Nanjing, China
Ocean currents could adjust ocean carbon and nitrogen composition which are an important part of the global carbon and nitrogen cycle. We procured global concentrations of particulate carbon and nitrogen in different depths, classified them according to ocean currents (upper 300 m), and analyzed POC-to-PON ratio (particulate organic carbon-to-nitrogen ratio) variations. We found that the regions with currents have a higher ratio than those without currents in the northern hemisphere, except in 50°–60°N (median ratio without currents is 8.38). Warm currents (median ratio ranges from 5.96 to 8.44) have a higher ratio than cold currents (6.19–8.89), except for the East Greenland Current (reach to 8.44) and Labrador Current (reach to 8.89). Meanwhile, we also analyzed the effects of ocean currents’ flowing and found that the distributions of the POC-to-PON ratio vary in different current types (e.g., cause of formation and distance from the shore). Generally speaking, the POC-to-PON ratio of the eolian currents and near-ocean currents change fiercer than that of compensation currents and near-coast currents. Ocean currents also have a buffering effect in the variation between surface and deep water, which prevents the severe change of the POC-to-PON ratio. The high-value anomaly of POC-to-PON caused by the confluence of warm and cold currents was also analyzed. It can be deduced that the high ratio in the high-latitude region was mainly caused by the terrigenous organic matter (especially carbon) and low nitrogen.
Introduction
As an important part of the global biogeochemistry cycle, the ocean carbon and nitrogen cycle has always been concerned. Alfred Redfield presented the deep ocean particulate matter ratio, which later we call “Redfield ratio” (C:N:P = 106:16:1, Redfield, 1934), and it became a central tenet for ocean biogeochemistry and nutrition research (Deutsch and Weber, 2012; Mills and Arrigo, 2010). Later, many scholars studied the carbon, nitrogen, and phosphorus biochemical or stoichiometric variations of phytoplankton in deep or surface water (Dickman et al., 2006). The elemental composition and ratio have always been crucial points in ocean or land water research.
The research about oceans have been conducted very early (Allen, 1921; Stommel, 1957), but most of it focused on the production, for example, Parsons thought that the ocean detritus should be considered a source of food and secondary producers (Parsons and Strickland, 1962). In early times, the stress of ocean research was the nutrition and production of plankton. Then numerous studies of biology, geography, and chemistry on oceans have been conducted until now. When the Redfield ratio became a hot spot in marine research, Tett connected the Redfield ratio with the phytoplankton growth rate (Tett et al., 1985), and Handa performed chemical studies on the organic matter and carbon cycle in ocean (Handa, 1991), and there had been research into the kinds or variations of the phytoplankton community (Karl et al., 2001; Ho et al., 2010). Singh researched C:N:P stoichiometry in the North Atlantic Ocean (Singh et al., 2015), and Seok Jin Oh conducted research work on spatial–temporal distribution of particulate organic carbon (POC) and nitrogen (PON) in the southwestern area of the East Sea (Seok Jin et al., 2016). Particulate organic matter (POM) reveals carbon or nitrogen sequestration and release in ocean compared with DOM (dissolved organic matter). They are significant processes in the global carbon or nitrogen cycle. Therefore, the distribution and variation of POM in oceans or rivers get more attention.
Recently, many studies have been conducted on variations in particulate carbon, nitrogen, and the phosphorus ratio of oceans, lakes, rivers, and estuaries. Furthermore, the scale from estuaries is regional to global (Kunz et al., 2011; Martiny et al., 2014). Megan Young researched the export of carbon and nitrogen in mangrove-dominated lagoons (Young et al., 2005), and Nicolas Savoye studied particulate organic matter in the Gironde Estuary in France (Savoye et al., 2012); regional research have been conducted in the Strait of Magellan (Fabiano et al., 1999), Southern Ocean at 30°E–80°E (Pasquer et al., 2010), and the northern Beibu Gulf (Kaiser et al., 2014). Globally, Martiny found strong latitudinal patterns in the C-to-P and N-to-P ratios of marine plankton (Martiny et al., 2013; Martiny et al., 2014). Mouw even combined the global ocean particulate organic carbon flux with satellite parameters (Mouw et al., 2016). The researches were not only carried out among the space domain but also the variation of the carbon and nitrogen ratio in time, for example, Rembauville monitored the seasonal dynamic POC export in the Southern Ocean (Rembauville et al., 2015), and Zhao studied the seasonal variation of C:N:P in the western Pacific Ocean (Zhao et al., 2016), and some conducted research both in space and time (Niemi and Michel, 2015). Besides the seasonal variation, there also has been long time scale research about ocean POC or PON (Heinze et al., 2016). There are many scholars trying to explain the distribution and variation of POM in marine environment (Mouw et al., 2016; Barrera et al., 2017). Therefore, variations in the element composition and ratio in space–time have been focused in marine biogeochemistry, and the time variation could be more important with the increasing impact of extreme climatic change and human activities on the environment.
However, few studies suggest the ocean current itself has effects on the variations in the carbon, nitrogen, and phosphorus ratio and spatiotemporal change comprehensively and systematically. Most usually, researchers study the regional, global, or spatial–temporal variations in carbon or nitrogen in oceans. Even some conducted research on ocean currents’ effect on carbon or nitrogen, where they only observed one current C or N variation (Ruiz-Cooley et al., 2014), which are regional research in fact. Ocean currents regulate the global carbon and nitrogen cycle through their most important effect—transmission. They influence the physical, chemical, biological, and geological processes of surface or even deep oceans. The clear majority of studies focusing on POM of phytoplankton in oceans are regional or global, few from the angle of the ocean currents, and some were studies on the element composition and ratio in the Pacific and Atlantic oceans. The salt content and temperature of oceans can be changed gradually corresponding to global warming; afterward, the element composition could be altered. Therefore, the currents’ influence in POM of phytoplankton and their ratio have profound meaning to study the carbon and nitrogen cycle as well as its response to global warming.
Dataset and Methods
Data
Our data set was archived from Huang (Huang et al., 2018). There are altogether 63,827 sample points in oceans. In order to study ocean currents’ influence on the POC-to-PON ratio, all data have been classified according to ocean currents (Orsi et al., 1995; Bischof et al., 2004a; Gyory et al., 2004a; Bonhoure et al., 2004; Rowe et al., 2004; Pidwirny, 2006). Meanwhile, the data which were below 300 m (where currents can hardly affect the POC-to-PON ratio, Monahan et al., 2001; Scott and Anya., 2001) were rejected, except the data of the California Cold Current, Labrador Current, and North Atlantic Warm Current which contained all data to study the deep area variation on the POC-to-PON ratio. The extremely low or high POC-to-PON ratio has been eliminated through all data, and there were still 43,404 examples left after rejection (Figure 1). After calculating the POC-to-PON median ratio, we only kept values ranging from 2 to 13 when plotting. We mainly used the median POC-to-PON ratio and included data of temperature, salt content, chlorophyll, pH, and C, N, and P index, which were not complete though.
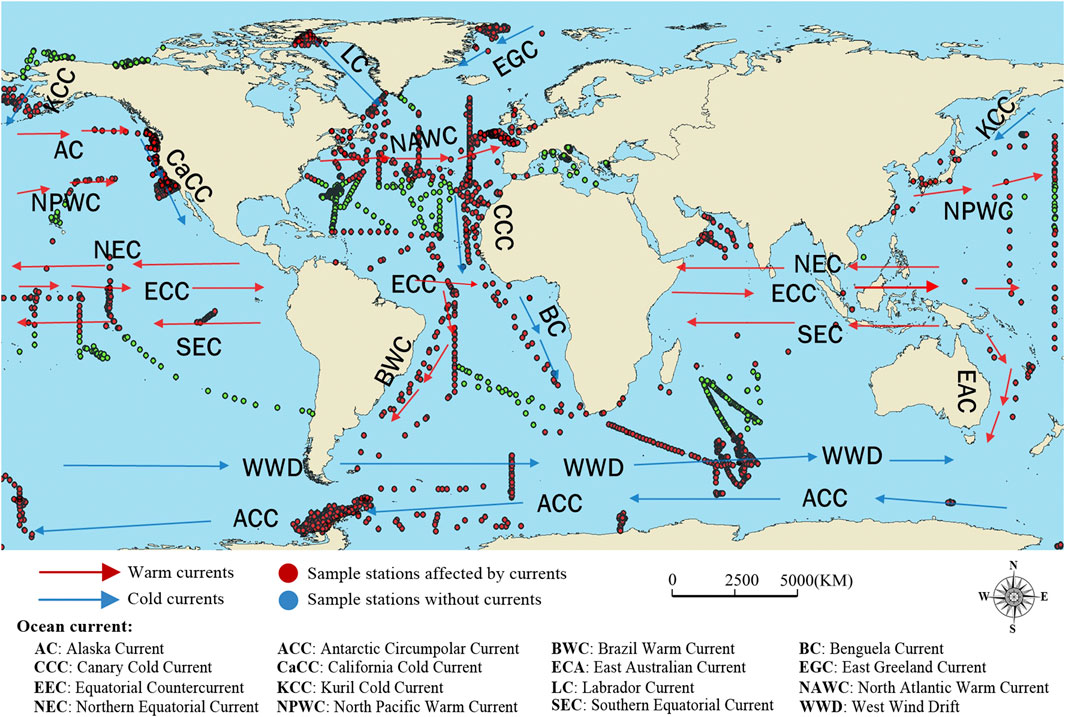
FIGURE 1. Geographical locations of sample stations used in our study and ocean currents’ sketch map.
Spatial Statistical Analysis of Ocean Currents
To identify the global surface ocean variation of the POC-to-PON ratio, we analyzed global distribution from the top 300 m of the water column with and without ocean currents. To reveal the pattern of POC and PON, the currents (except the Benguela Current, Alaskan Current, Canary Cold Current, West Wind Drift, East Greenland Current, Antarctic Circumpolar Current, and the Equatorial Countercurrent in the Atlantic) are divided into upstream and downstream from the middle to understand the variation in the POC-to-PON ratio with respect to the direction of flowing. The direction of the current is also abstract as longitude direction and latitude direction according to the main direction of ocean currents. Because this data set is sampling data, the actual site coordinates are not used. We just classified and summarized the data according to the longitudinal and latitudinal grid. To better study how the material transport and energy transport of ocean currents affect the POC-to-PON ratio, we divide the ocean current into meridional and latitudinal directions and analyze the variation of the POC-to-PON ratio along the meridional and latitudinal directions.
Because the amount of data is huge and the data are not evenly distributed in space and time, the histogram and quantile analysis methods are used to analyze the variation in the POC-to-PON ratio from a statistical point of view. A histogram is used to summarize the value distribution of the data sets. The given POC-to-PON ratio data can be divided into several categories according to the ocean current type or flow direction, and the histogram analysis is performed with every category. For the given category C, it is assumed that the number of observations is N; the histogram analysis is defined as follows:
where S(Xi) is used to divide the original observation data into different subsets, which are also known as histogram bins; Xi denotes the central point of the ith bin, and D denotes the width of the bins. After the division step, F(Xi) can be used to calculate the frequency of the ith bin. And operator count(S(Xi)) is used to count the observation number belonging to the ith bin.
Quantile analysis is a common method used for the quantitative analysis of data set distribution. For the given category C, its m quantile analysis is defined as follows:
In the formula, [] is the rounding operation; there are np samples smaller than the quantile, and np may not be an integer. Cm represents the value of the mth position in the sample. Quantile analysis can generally be expressed by boxplot. Boxplot results reflect the upper and lower boundaries, upper quartile, lower quartile, and the median of the data set.
Result
We classified the datasets according to ocean currents and explored the distribution of values, as shown in Figure 2. As the southern hemisphere has less currents, it has the largest wind current—the West Wind Current. The median C-to-N ratio of the West Wind Current is 7.53 in the Atlantic, 7.76 in India, and 6.57 in the Pacific Ocean, all of them close to the R ratio, especially in the Pacific. Moreover, the Antarctic Cycle Current has a lower median ratio, 6.45. Consequently, in the Antarctic and open ocean zones, both have cold currents. The POC-to-PON ratio is very close to the R ratio. This is consistent with some conclusions, that is, open ocean, few or without human activities, has a POC-to-PON ratio close to 6.63.
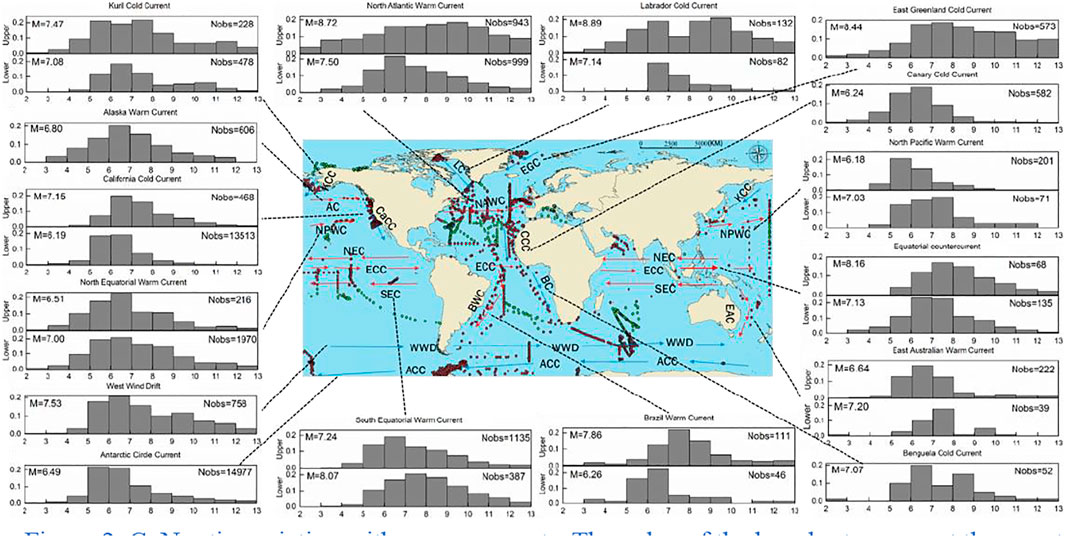
FIGURE 2. C-to-N ratio variation with ocean currents. The value of the bar chart represents the count percentage of the histogram bins.
Discussion
Spatial Variation of the POC-to-PON Ratio With Ocean Currents
Global POC-to-PON Ratio Variation With and Without Ocean Currents
To identify the global surface ocean variation in the POC-to-PON ratio, we analyzed global distribution from the top 300 m of the water column with and without ocean currents. As a result, the median ratio in currents affects the regions’ range from 6.14 to 8.63, which is close to the Redfield ratio in general, and it is higher in the northern hemisphere and high-latitude areas (Figure 3A). In contrast to the POC-to-PON ratio in regions with and without currents, we found that the ratio is higher with currents in the northern hemisphere, except 50°–60°N (median ratio without currents is 8.38), which probably is because of the few samples, but in the southern hemisphere, the ratio is little different. Therefore, in the northern hemisphere, ocean currents had an increased POC-to-PON ratio but little influence in the southern hemisphere. Actually, the distribution is complex in the northern hemisphere.
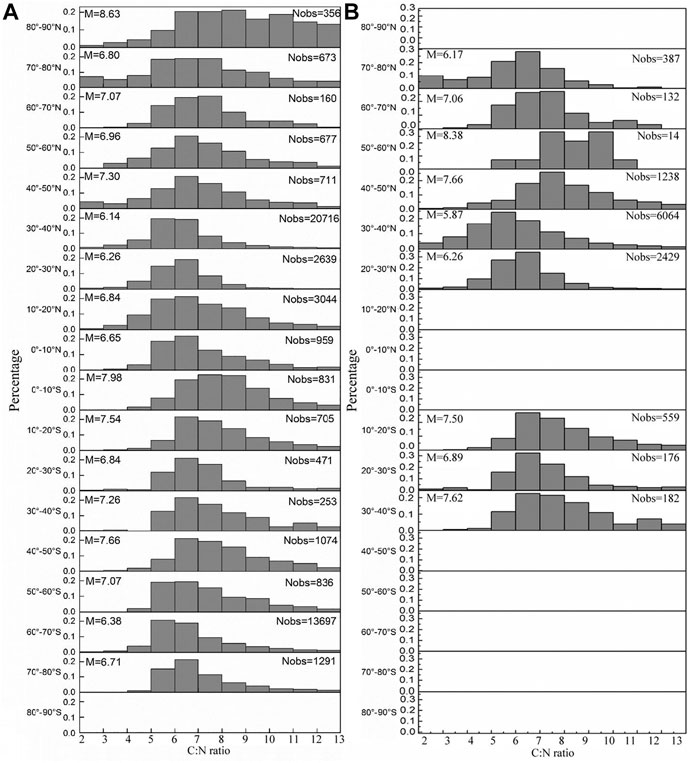
FIGURE 3. Latitudinal patterns of the global C-to-N ratio (upper 300 m). (A) Only including the region affected by ocean currents. (B) the region without ocean currents. The blank indicates no data. M is the median ratio.
We globally analyzed the median POC-to-PON ratio of upper 300 m sea water and classified the data ocean current and the regions without currents. Some researchers have conducted studies about the latitudinal patterns of the C-to-N ratio in oceans (Martiny et al., 2013 Martiny et al., 2014), Although some global median C-to-N ratios differ from the canonical Redfield ratio, most of them are close to 6.6 in general. As other study, the C-to-N ratio is higher in low latitudes and warm ocean regions (Martiny et al., 2013), and the latitude dominates the global element ratio of oceans. However, whether the median C-to-N ratio of regions has ocean currents or not is different. The existence of ocean currents indeed affects the global C-to-N ratio because of the function—transport. The main factors that influence the POC-to-PON ratio of plankton are solar radiation, temperature, nutrients, and the kinds of plankton communities (Barrera et al., 2017). The currents adjust global C and N by delivering heat, nutrients, and so on. The region with currents has a higher median ratio than areas without currents (Figure 3B), although the data of regions without ocean currents are limited. Therefore, ocean currents could increase the POC-to-PON ratio. The ability of regulating the surface global ocean carbon and nitrogen ratio is related to the range of currents affecting the temperature of water, cause of information, flowing direction, and other characters of ocean currents.
The variation of the C-to-N ratio is remarkable in the northern hemisphere, which is because of complicated conditions, than the southern hemisphere—more significant currents as well as the terrene. The southern hemisphere has broader and more open oceans; there is little influence by currents which mainly contain the West Wind Drift and Antarctic Circle Current, as well as less human activities. Our results vary from others distinctly in the upper latitude of the northern hemisphere, and the median ratio in the upper latitude surface of oceans is above 6.63, and it even exceeds eight in 80°N–90°N, most possibly because of the terrigenous organic matter (especially carbon) and low nitrogen in the Arctic Circle. There still is another likelihood—global warming. Because of ice and snow melting in the Arctic Circle, the sea water has been desalinating and the deep ocean circulation probably has been affected to great extent. There have been several research studies about the variation of POM in the Arctic Circle (Emerson et al., 2001; Harada, 2016). The C-to-N ratio in north upper latitudes is likely to increase by currents converging in the future because of global warming, while how and to what extent are unclear.
POC-to-PON Ratio Variation With Ocean Currents
In fact, the ocean current affects the POC-to-PON ratio directly by transporting nutrition, heat, and plankton to change the composition of organic matter, and they also change the ratio indirectly by regulating the environmental conditions. The scale of the current affect could alter the organic matter element ratio as well (Sterner et al., 2008). In our study, ratios are usually higher large scale, and it will be closer to the R ratio in small scale.
Different temperatures of ocean currents have different influences on the POC-to-PON ratio of global surface oceans. In our study, the region with warm currents has higher median C-to-N ratio, except the East Greenland Current and Labrador Current. This is identical with most studies—higher temperature and higher carbon-to-nitrogen ratio (Martiny et al., 2013; Martiny et al., 2014). According to our data, warm currents have higher temperature and concentration of chlorophyll than cold currents, whereas the East Greenland Current has some samples which have high concentration of chlorophyll. Thus, the East Greenland Current has a much higher POC-to-PON ratio, and it is probably a rich terrigenous supply. Low-latitude districts receive more solar radiation. The temperature of surface sea water is higher, so plankton has a favorable environment for growing in higher temperature. Thus, warm currents have a higher POC-to-PON ratio than cold currents, but only in middle and low latitudes.
How about the warm currents at the same latitude? The North Atlantic Warm Current has a much higher ratio than the canonical Redfield value and that of the North Pacific Warm Current. Meanwhile, the North Equatorial Warm Current has a median ratio of 5.96–8.27, from lower to upper reaches, both deviate from the R ratio. The situation at the same latitude is complex and varying as the environment, including land–sea distribution, nitrogen, plankton, and water temperature. The sample points of the North Atlantic Warm Current are more from offshore to central ocean compared with the North Pacific Warm Current; it could comprise several terrigenous particulate organic matter (POM). The North Atlantic is a bigger carbon sink, and there has been a high carbon value and terrestrial POM that could influence the carbon and nitrogen cycle, which has been proved (Head et al., 1996). Although at some latitude, the ocean current could change the latitude pattern of the POC-to-PON ratio, which is affected by the distance to the shore as well.
In our study, all the cold currents, except the Antarctic flow, are divided into upstream and downstream and have a decrease in the POC-to-PON ratio with flowing. It is likely that cold currents usually flow from high to low latitude; besides, the Brazil Warm Current and North Atlantic Warm Current have the same trade. However, the East Australian Current and North Pacific Warm Current are different; their ratio increases from upstream to downstream. They run from low to high latitude, and their regular patterns are like cold currents. As for the Brazilian Warm Current, there is the Falkland Cold Current joint which causes a rich nutritional environment and pulls down the ratio downstream.
Effects of Ocean Currents in POC-to-PON Ratio Variation
POC-to-PON Ratio Variation Along the Direction of Current Flow
Warm Currents
As shown in Figure 3, the range of POC-to-PON median ratios of the warm currents is 5.96–8.44, and most of the warm currents have much higher values than the Redfield ratio. For the meridional current, all the three currents flow from low latitudes to high latitudes (Figure 4A). Among the three currents, both the Japan Warm Current and the East Australia Warm Current are compensation currents, whose POC-to-PON ratio structures are relatively stable (falling first and then rising, and the Japan Warm Current rises abnormally high and far more than the R ratio, which may be caused by the confluence of warm and cold currents). The Brazil Warm Current is an eolian current, whose POC-to-PON ratio is evolving with drastic changes (especially in the front and end of the ocean current). This indicates that ocean currents of different causes have different mechanisms of action on the POC-to-PON ratio.
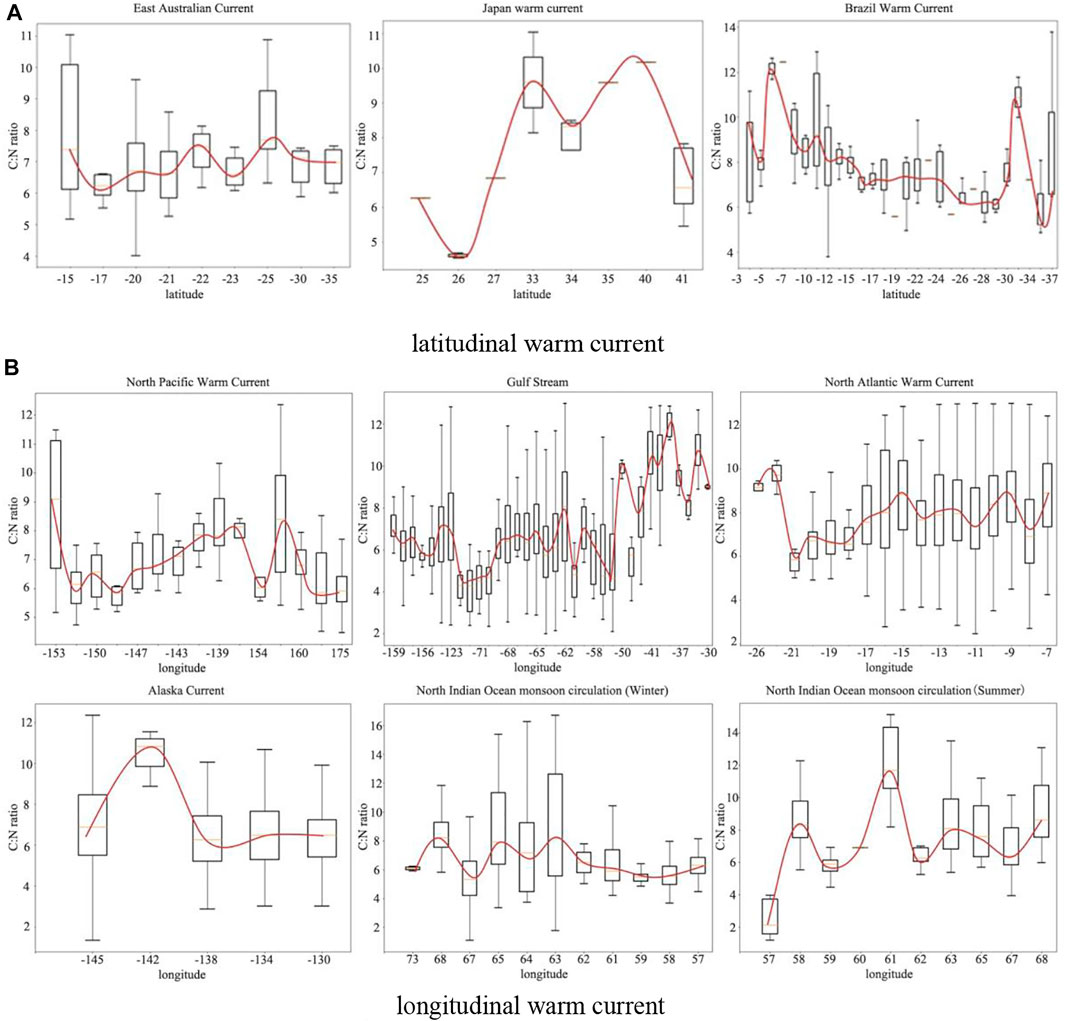
FIGURE 4. POC-to-PON ratio variation along warm currents. (A) Latitudinal warm current. (B) Longitudinal warm current.
The latitudinal current is more common for warm currents (Figure 4B), and the median POC-to-PON ratio of most warm currents decreases with their flow direction. However, there exists a marked difference between the near-coast current and the near-ocean current. For the near-coast Alaska Current and the North Indian Ocean monsoon Circulation, the POC-to-PON ratio is relatively stable (fluctuates in the early stage and stabilizes in the later stage), and the near-ocean North Atlantic Current and the North Pacific Current are found to vary significantly (with an obvious downward trend and fluctuates significantly in the later stage). We can also find that the Mexico Gulf Current rises rapidly in the later stage because of the confluence of warm and cold currents.
Identical with longitudinal currents, almost all latitudinal currents have a decreased POC-to-PON ratio with their flow direction, except the North Atlantic Current and North Pacific Current. There are many rivers that pour into the Northern Atlantic; they carry massive POM from the land which changes the C and N proportion. Different rivers have different effects (Pasquer et al., 2010). Thus, the North Atlantic Current has an increased ratio with its flow direction, reiterating what we think determined by the composition and proportion of injected rivers. As for the North Pacific Current, the increased ratio is probably because of the missing water from the Equatorial Countercurrent which leans toward north and is influenced by the El Nino phenomenon (Chavez et al., 1999).
Cold Currents
As shown in Figure 5, the POC-to-PON ratios of the cold currents range from 6.19 to 8.89 (median), which are higher than the R ratio. The higher the latitude, the higher is the C-to-N ratio. Same as most warm currents, the ratio of cold currents decreases with flow direction. Most cold currents are longitudinal, compared with latitudinal currents which mainly transmit nutrition and organisms, and the longitudinal currents adjust heat of sea water in addition.
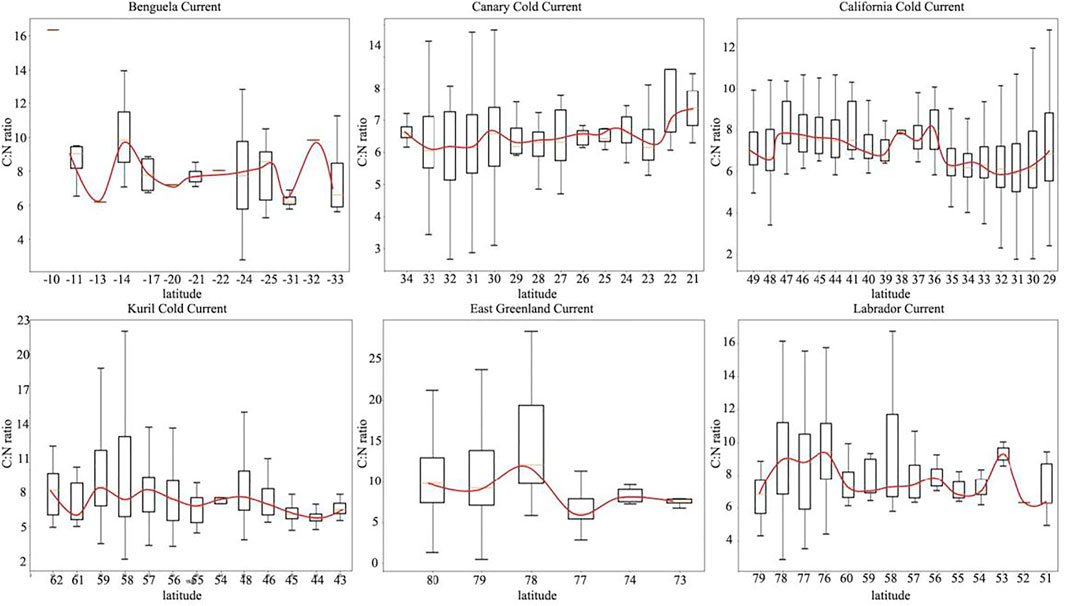
FIGURE 5. POC-to-PON ratio variation along cold currents.
Compared with latitudinal currents, most cold currents have lower POC-to-PON ratios, except the cold currents in high latitudes in the northern hemisphere (the East Greenland Current and Labrador Current). The reason could be the terrigenous organic matter (especially carbon) or the low nitrogen in the Arctic Circle (Wheeler et al., 2002; Martiny et al., 2013). On the other hand, the confluence of warm and cold currents also made the POC-to-PON ratio unusually high.
POC-to-PON Ratio Variation With Ocean Currents Move Vertically
In addition to the horizontal motion of matter and energy, ocean currents will further strengthen the vertical motion. The element ratio changes with depth (Martiny et al., 2013; Auguè res and Loreau, 2015), and the ratio is low in deep water. The ratio of deep water under some currents (below 300 m) is also shown. Deep water of the Labrador Cold Current has a high C-to-N ratio reaching up to 8.17, whereas the North Atlantic Warm Current does not have too low ratio in deep areas (Figure 6). POM of surface ocean water could subside to as deep as the effect of gravity, so deep water could not decrease extremely if the surface water has a high ratio. However, in upwelling areas, such as the deep of the California Cold Current, the ratio of deep water is usually higher than the surface, and it is also above the R ratio. In upwelling zones, surface water is rich in nutrition, yet deep water is short of nutrition. Many studies have confirmed the ratio is low in oligotrophic areas. We can deduce that the C-to-N ratio in deep areas does not reduce drastically if surface water has a high ratio; it will likely continue to have a higher ratio. The ratio tends to be higher in deep water, if the C-to-N ratio of surface water is low. In other words, the currents advance the ratio in deep water, especially in low-ratio areas, particularly in upwelling areas, while this trend is overt in cold currents; the ratio decreases much in deep water of regions with warm currents.
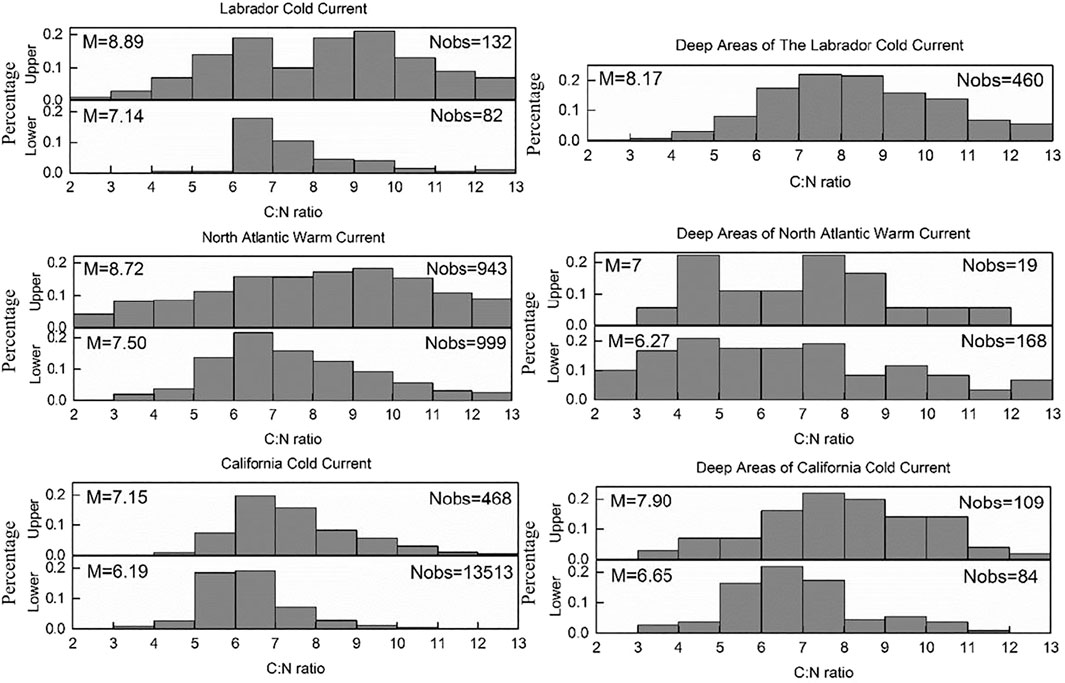
FIGURE 6. Frequency of C-to-N ratio in deep water. M is the median ratio.
Effects of the Confluence of Warm and Cold Currents
The confluence of warm and cold currents could mix sea water resulting in nutrients upwelling from deep water, phytoplankton booming, and fishing grounds being often found there. We chose two typical cold and warm intersections to analyze its impact on the ratio. As shown in Figure 7, the C-to-N ratio in the confluence was much higher. However, we found that the ratio would increase at the intersection first and then decrease after mixing, for example, the Mexico Gulf Warm Current intersects with the Labrador Cold Current, and the median ratio changes from 5.80 to 9.80 and then to 7.60 (Figure 7A). The same trend appears between the North Atlantic Current and the East Greenland Current (Figure 7B). Consequently, the confluence of warm and cold currents could raise the POC-to-PON ratio.
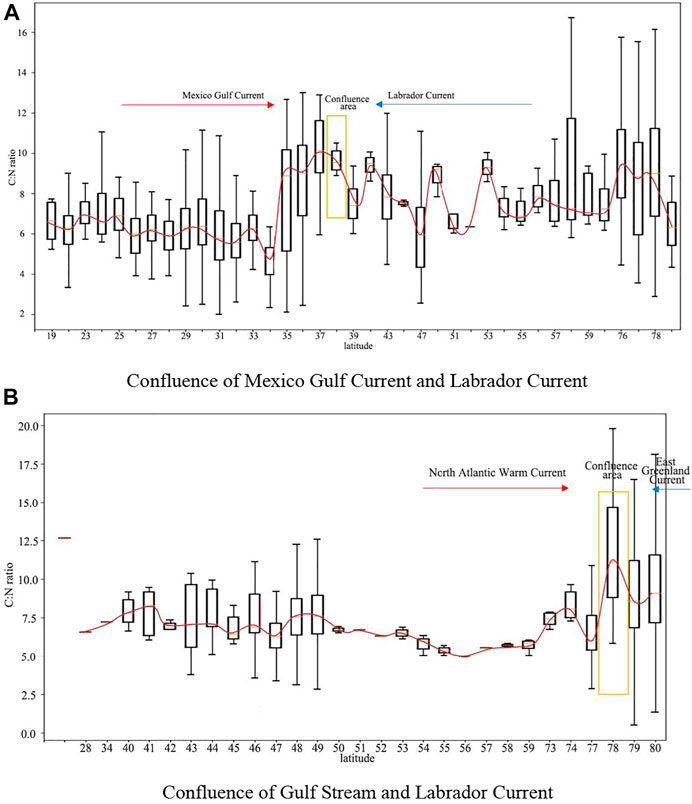
FIGURE 7. Confluence of warm and cold currents. (A) Confluence of the Mexico Gulf Current and Labrador Current. (B) Confluence of the Gulf Stream and Labrador Current.
We can also find that from warm to cold currents, the POC-to-PON ratio increases sharply, but from cold to warm currents, the ratio increases slowly. The reason may be that the POC-to-PON ratio of the cold current is much larger, which further proves that the main reason for the high ratio in the high-latitude region is the terrigenous organic matter (especially carbon) and the low nitrogen (Barrera et al., 2017).
Conclusion
We procured global particulate organic carbon and nitrogen of phytoplankton in oceans, analyzed the POC-to-PON ratio of the global variations of surface water and the median ratio based on ocean currents (with or without ocean currents). We found that the global ocean median ratio, especially in the southern hemisphere, is close to the Redfield ratio, whereas the ratio is a little higher in the northern hemisphere, it even reaches 8.63 in 80°N–90°N. In our study, ocean currents indeed could affect the POC-to-PON ratio by adjusting heat, nutrition, and delivering plankton.
The higher ratio arises in warm upper latitudinal currents, whereas it is lower in cold lower latitudes. On the other hand, the distributions of the POC-to-PON ratio vary in different ocean current types (e.g., cause of ocean currents and distance from shore). Generally speaking, the POC-to-PON ratio of the eolian current and near-ocean current change fiercer than that of the compensation current and near-coast current. Meanwhile, ocean currents also have a buffering effect in the variation between surface and deep water, which prevents the severe change of the POC-to-PON ratio. The analysis of the high-value anomaly of the POC-to-PON ratio with the confluence of warm and cold currents showed that the changing process of warm currents and cold currents is different, which may promote our understanding of high ratios in high-latitude regions.
Our study shows that ocean currents will have more important, extensive, and profound impact on the ocean carbon and nitrogen cycle. With the process of global warming, the effect of currents should get more attention. And we should focus on the variation in the northern hemisphere, especially the Arctic because of its complex conditions and human activity effects.
Data Availability Statement
The datasets presented in this study can be found in online repositories. The names of the repository/repositories and accession number(s) can be found below: https://figshare.com/s/a7cb3953273a6baa5e3e.
Author Contributions
SX and WL contributed to the article’s ideas and methods. LZ, TH, and YT classified the data and drew the graphs. SX, WL, and LZ wrote the article with considerable input from LZ. YT, and TH revised and checked the language of the article.
Funding
This research has been supported by the National Natural Science Foundation of China (grant nos. 41976186 and 41773097) and the Youth Top Talent funded by Nanjing Normal University.
Conflict of Interest
The authors declare that the research was conducted in the absence of any commercial or financial relationships that could be construed as a potential conflict of interest.
Publisher’s Note
All claims expressed in this article are solely those of the authors and do not necessarily represent those of their affiliated organizations, or those of the publisher, the editors, and the reviewers. Any product that may be evaluated in this article, or claim that may be made by its manufacturer, is not guaranteed or endorsed by the publisher.
References
Allen, W. E. (1921). Some Work on Marine Phytoplankton in 1919. Trans. Am. Microscopical Soc. 40 (4), 177–181. doi:10.2307/3221971
Auguères, A.-S., and Loreau, M. (2015). Regulation of Redfield Ratios in the Deep Ocean. Glob. Biogeochem. Cycles 29 (2), 254–266. doi:10.1002/2014gb005066
Barrera, F., Lara, R. J., Krock, B., Garzón-Cardona, J. E., Fabro, E., and Koch, B. P. (2017). Factors Influencing the Characteristics and Distribution or Surface Organic Matter in the Pacific-Atlantic Connection. J. Mar. Syst. 175, 36–45. doi:10.1016/j.jmarsys.2017.07.004
Bischof, B., Mariano, A. J., and Ryan, E. H. (2004a). The North Equatorial Counter Current. Ocean Surface Currents. Available at: http://oceancurrents.rsmas.miami.edu/atlantic/north-equatorial-cc.html (Accessed 2021).
Bischof, B., Rowe, E., Mariano, A. J., and Ryan, E. H. (2004b). The Brazil Current. Ocean Surface Currents. Available at: http://oceancurrents.rsmas.miami.edu/atlantic/brazil.html (Accessed 2021).
Bonhoure, D., Rowe, E., Mariano, A. J., and Ryan, E. H. (2004). The South Equatorial Sys Current. Ocean Surface Currents. Available at: https://oceancurrents.rsmas.miami.edu/atlantic/south-equatorial.html (Accessed 2004).
Chavez, F. P., Strutton, P. G., Friederich, G. E., Feely, R. A., Feldman, G. C., Foleyand, D. G., et al. (1999). Biological and Chemical Response of the Equatorial Pacific Ocean to the 1997-98 El Niño. Science 286 (5447), 2126–2131. doi:10.1126/science.286.5447.2126
Dauby, P., Frankignoulle, M., Gobert, S., and Bouquegneau, J.-M. (1994). Distribution of POC, PON, and Particulate Al, Cd, Cr, Cu, Pb, Ti, Zn and δ13C in the English Channel and Adjacent Areas. Oceanologica Acta 17 (6), 643–657.
Deutsch, C., and Weber, T. (2012). Nutrient Ratios as a Tracer and Driver of Ocean Biogeochemistry. Ann. Rev. Mar. Sci. 4 (4), 113–141. doi:10.1146/annurev-marine-120709-142821
Dickman, E. M., Vanni, M. J., and Horgan, M. J. (2006). Interactive Effects of Light and Nutrients on Phytoplankton Stoichiometry. Oecologia 149 (4), 676–689. doi:10.1007/s00442-006-0473-5
Emerson, S., Mecking, S., and Abell, J. (2001). The Biological Pump in the Subtropical North Pacific Ocean: Nutrient Sources, Redfield Ratios, and Recent Changes. Glob. Biogeochem. Cycles 15 (3), 535–554. doi:10.1029/2000gb001320
Fabiano, M., Povero, P., Danovaro, R., and Misic, C. (1999). Particulate Organic Matter Composition in a Semi-enclosed Periantarctic System: the Straits of Magellan. Scientia Marina 63 (4), 89–98. doi:10.3989/scimar.1999.63s189
Gyory, J., Mariano, A. J., and Ryan, E. H. (2004a). The Benguela Current. Ocean Surface Currents. Available at: http://oceancurrents.rsmas.miami.edu/atlantic/benguela.html (Accessed 2021).
Gyory, J., Mariano, A. J., and Ryan, E. H. (2004b). The Canary Current. Ocean Surface Currents. Available at: http://oceancurrents.rsmas.miami.edu/atlantic/canary.html (Accessed 2021).
Gyory, J., Mariano, A. J., and Ryan, E. H. (2004c). The Labrador Current. Ocean Surface Currents. Available at: http://oceancurrents.rsmas.miami.edu/atlantic/labrador.html (Accessed 2021).
Handa, N. (1991). Chemical Studies on Organic Matter and Carbon Cycle in the Ocean. J. Oceanographical Soc. Jpn. 47, 49–61. doi:10.1007/bf02301755
Harada, N. (2016). Review: Potential Catastrophic Reduction of Sea Ice in the Western Arctic Ocean: Its Impact on Biogeochemical Cycles and marine Ecosystems. Glob. Planet. Change 136, 1–17. doi:10.1016/j.gloplacha.2015.11.005
Head, E. J. H., Harrison, W. G., Irwin, B. I., Horne, E. P. W., and Li, W. K. W. (1996). Plankton Dynamics and Carbon Flux in an Area of Upwelling off the Coast of Morocco. Deep Sea Res. Oceanographic Res. Pap. 43 (11), 1713–1738. doi:10.1016/s0967-0637(96)00080-5
Heinze, C., Hoogakker, B., and Winguth, A. (2016). Ocean Carbon Cycling during the Past 130,000 Years – a Pilot Study on Inverse Paleoclimate Record Modelling. Clim. Past Discuss. 12 (10), 1–48. doi:10.5194/cp-2016-35
Ho, T., Quigg, A., Finkel, Z. V., Milligan, A. J., Wyman, K., Falkowski, P. G., et al. (2010). The Elemental Composition of Some marine Phytoplankton. J. Phycology 39 (6), 1145–1159. doi:10.1111/j.0022-3646.2003.03-090.x
Huang, C., Jiang, Q., Yao, L., Yang, H., Lin, C., Huang, T., et al. (2018). Variation Pattern of Particulate Organic Carbon and Nitrogen in Oceans and Inland Waters. Biogeosciences 15, 1827–1841. doi:10.5194/bg-15-1827-2018
Kaiser, D., Unger, D., and Qiu, G. (2014). Particulate Organic Matter Dynamics in Coastal Systems of the Northern Beibu Gulf. Continental Shelf Res. 82 (1), 99–118. doi:10.1016/j.csr.2014.04.006
Karl, D. M., Bidigare, R. R., and Letelier, R. M. (2001). Long-Term Changes in Plankton Community Structure and Productivity in the North Pacific Subtropical Gyre: The Domain Shift Hypothesis. Deep Sea Res. Part Topical Stud. Oceanography 48 (8–9), 1449–1470. doi:10.1016/s0967-0645(00)00149-1
Kunz, M. J., Anselmetti, F. S., WÜEst, A., Wehrli, B., Vollenweider, A., Thüring, S., et al. (2011). Sediment Accumulation and Carbon, Nitrogen, and Phosphorus Deposition in the Large Tropical Reservoir Lake Kariba (Zambia/Zimbabwe). J. Geophys. Res. 116 (G3), 1–13. doi:10.1029/2010jg001538
Martiny, A. C., Vrugt, J. A., and Lomas, M. W. (2014). Concentrations and Ratios of Particulate Organic Carbon, Nitrogen, and Phosphorus in the Global Ocean. Sci. Data 1 (4), 140048. doi:10.1038/sdata.2014.48
Martiny, A. C., Pham, C. T. A., Primeau, F. W., Vrugt, J. A., Moore, J. K., Levin, S. A., et al. (2013). Strong Latitudinal Patterns in the Elemental Ratios of marine Plankton and Organic Matter. Nat. Geosci 6 (4), 279–283. doi:10.1038/ngeo1757
Martiny, A. C., Vrugt, J. A., Primeau, F. W., and Lomas, M. W. (2013). Regional Variation in the Particulate Organic Carbon to Nitrogen Ratio in the Surface Ocean. Glob. Biogeochem. Cycles 27 (3), 723–731. doi:10.1002/gbc.20061
Monahan, E. C., Dam, H. G., and Hans, G. (2001). Bubbles: An Estimate of Their Role in the Global Oceanic Flux of Carbon. J. Geophys. Res. 106 (C5), 9377–9383. doi:10.1029/2000jc000295
Mouw, C. B., Barnett, A., Mckinley, G. A., Gloege, L., and Pilcher, D. (2016). Global Ocean Particulate Organic Carbon Flux Merged with Satellite Parameters. Earth Syst. Sci. Data 8 (2), 1–24. doi:10.5194/essd-8-531-2016
Mouw, C. B., Barnett, A., Mckinley, G. A., Gloege, L., and Pilcher, D. (2016). Phytoplankton Size Impact on Export Flux in the Global Ocean. Glob. Biogeochem. Cycles 30, 1542–1562. doi:10.1002/2015gb005355
Niemi, A., and Michel, C. (2015). Temporal and Spatial Variability in Sea-Ice Carbon: Nitrogen Ratios on Canadian. Arctic shelves 3, 000078. doi:10.12952/journal.elementa.000078
Oh, S. J., Jeong, S., and Kim, S.-Y. (2016). Spatio-Temporal Distribution of Particulate Organic Carbon (POC) and Nitrogen (PON) in the Southwestern Area of East Sea. Jkosmee 19 (2), 144–150. doi:10.7846/jkosmee.2016.19.2.144
Orsi, A. H., Whitworth, T., and Nowlin, W. D. (1995). On the Meridional Extent and Fronts of the Antarctic Circumpolar Current. Deep Sea Res. Oceanographic Res. Pap. 42 (5), 641–673. doi:10.1016/0967-0637(95)00021-w
Parsons, T. R., and Strickland, J. D. H. (1962). Oceanic Detritus. Science 136 (3513), 313–314. doi:10.1126/science.136.3513.313
Pasquer, B., Mongin, M., and Johnston, N. (2010). Distribution of Particulate Organic Matter (POM) in the Southern Ocean during BROKE-West (30°E - 80°E). Deep-Sea Res. Part 57 (9), 779–793. doi:10.1016/j.dsr2.2008.12.040
Pidwirny, M. (2006). Surface and Subsurface Ocean Currents. 2nd Edition. Fundamentals of Physical Geography. Available at: http://www.physicalgeography.net/fundamentals/8q.html (Accessed 2021).
Redfield, A. C. (1934). “On the Proportions of Organic Derivatives in Sea Water and Their Relation to the Composition of Plankton,” in James Johnstone Memorial Volume (Liverpool, U.K: Liverpool Univ. Press).
Rembauville, M., Salter, I., Leblond, N., Gueneugues, A., and Blain, S. (2015). Export Fluxes in a Naturally Iron-Fertilized Area of the Southern Ocean - Part 1: Seasonal Dynamics of Particulate Organic Carbon export from a Moored Sediment Trap. Biogeosciences 12 (11), 3153–3170. doi:10.5194/bg-12-3153-2015
Rowe, E., Mariano, A. J., and Ryan, E. H. (2004). The North Atlantic Current. Ocean Surface Currents. Available at: http://oceancurrents.rsmas.miami.edu/atlantic/north-atlantic.html (Accessed 2021).
Ruiz-Cooley, R. I., Koch, P. L., Fiedler, P. C., and McCarthy, M. D. (2014). Carbon and Nitrogen Isotopes from Top Predator Amino Acids Reveal Rapidly Shifting Ocean Biochemistry in the Outer California Current. Plos One 9 (10), e110355. doi:10.1371/journal.pone.0110355
Savoye, N., David, V., Morisseau, F., Etcheber, H., Abril, G., Billy, I., et al. (2012). Origin and Composition of Particulate Organic Matter in a Macrotidal Turbid Estuary: The Gironde Estuary, France. Estuarine, Coastal Shelf Sci. 108 (4), 16–28. doi:10.1016/j.ecss.2011.12.005
Scott, D., and Anya, W. (2001). Is Southern Ocean Organic Carbon and Biogenic Silica export Enhanced by Iron-Stimulated Increases in Biological Production? Sediment Trap Results from SOIREE. Deep Sea Res. Part Topical Stud. Oceanography 48 (11-12), 2681–2701. doi:10.1016/S0967-0645(01)00014-5
Singh, A., Baer, S. E., Riebesell, U., Martiny, A. C., and Lomas, M. W. (2015). C: N: P Stoichiometry at the Bermuda Atlantic Time-Series Study Station in the North Atlantic Ocean. Biogeosciences 12 (12), 9275–9305. doi:10.5194/bg-12-6389-2015
Sterner, R. W., Andersen, T., Elser, J. J., Hessen, D. O., Hood, J. M., McCauley, E., et al. (2008). Scale-Dependent Carbon:nitrogen:phosphorus Seston Stoichiometry in marine and Freshwaters. Limnol. Oceanogr. 53 (3), 1169–1180. doi:10.4319/lo.2008.53.3.1169
Stommel, H. (1957). A Survey of Ocean Current Theory. Deep Sea Res. (1953) 4 (3), 149–184. doi:10.1016/0146-6313(56)90048-x
Tett, P., Droop, M. R., and Heaney, S. I. (1985). The Redfield Ratio and Phytoplankton Growth Rate. J. Mar. Biol. Ass. 65 (2), 487–504. doi:10.1017/s0025315400050566
Young, M., Gonneea, M. E., Herrera-Silveira, J., and Paytan, A. (2005). Export of Dissolved and Particulate Carbon and Nitrogen from a Mangrove-Dominated Lagoon, Yucatan Peninsula, Mexico. Int. J. Ecol. Environ. Sci. 31 (3), 189–202. Available at: https://cpb-us-e1.wpmucdn.com/sites.ucsc.edu/dist/5/1050/files/2020/08/IJEES31-189.pdf
Keywords: POC, PON, ocean currents, spatial variation, ratio variations
Citation: Xiao S, Zhang L, Teng Y, Huang T and Luo W (2021) The Particulate Organic Carbon-to-Nitrogen Ratio Varies With Ocean Currents. Front. Environ. Sci. 9:757471. doi: 10.3389/fenvs.2021.757471
Received: 12 August 2021; Accepted: 06 September 2021;
Published: 13 October 2021.
Edited by:
Peng Liu, Institute of Remote Sensing and Digital Earth (CAS), ChinaReviewed by:
Jingwei Shen, Southwest University, ChinaJianfeng Li, Chinese Academy of Geological Sciences, China
Copyright © 2021 Xiao, Zhang, Teng, Huang and Luo. This is an open-access article distributed under the terms of the Creative Commons Attribution License (CC BY). The use, distribution or reproduction in other forums is permitted, provided the original author(s) and the copyright owner(s) are credited and that the original publication in this journal is cited, in accordance with accepted academic practice. No use, distribution or reproduction is permitted which does not comply with these terms.
*Correspondence: Wen Luo, luowen@njnu.edu.cn