Threadfin Porgy (Evynnis Cardinalis) Haplotype Pattern and Genetic Structure in Beibu Gulf, South China Sea
 Lei Xu1,2
  Xuehui Wang1,2
  Lianggen Wang1,2 Jiajia Ning1,2
  Yafang Li1,2 Delian Huang1,2 Shuangshuang Liu1,2
  Feiyan Du1,2*
- 1South China Sea Fisheries Research Institute, Chinese Academy of Fishery Sciences, Guangzhou, China
- 2Guangdong Provincial Key Laboratory of Fishery Ecology and Environment, Guangzhou, China
Threadfin porgy (Evynnis cardinalis) is one of the important commercial fishing targets of bottom trawl fishery in the northern South China Sea. It is mainly threatened by overexploitation and listed as endangered species in the IUCN Red List. To investigate the demographic history and genetic structure of E. cardinalis population, partial sequences of the mitochondrial cytochrome c oxidase subunit I (COI) gene were obtained from 162 individuals collected from Beibu Gulf, South China Sea. In total, 44 different haplotypes were identified, and the dominant haplotype was found in all sampling sites. Across the dataset, nucleotide diversity was low, whereas haplotype diversity was high. Low pairwise comparisons of ΦST and high gene flow among sampling sites revealed a genetically homogeneous population structure in Beibu Gulf, indicating a single panmictic stock of E. cardinalis in this area. The star-like haplotype network, unimodal mismatch distribution, and significantly negative Tajima’s D and Fu’s Fs values indicated recent population demographic expansion of E. cardinalis. The mismatch distribution and Bayesian skyline plot results indicated that E. cardinalis from Beibu Gulf might have experienced colonization and demographic expansion due to sea level fluctuations during the late Pleistocene.
Introduction
Marine fish are generally deemed to have high dispersal potential because of their high moving capability at both larval and adult stages, and the absence of obvious physical barriers to dispersal (Caley et al., 1996; Hellberg, 2009). Theoretically, a species with the higher dispersal capability, the lower the genetic structure between populations. Therefore, in marine fish, especially migratory fish, the signal of population differentiation is weak and difficult to observe because of high levels of gene flow (Gandra et al., 2020). Understanding the genetic diversity of commercially important species is critical to implement protection policies and management regulations (Araki and Schmid, 2010). Genetic diversity (both within and between populations) greatly influences the adaptive potential of species to environmental changes, and ultimately determines their long-term resilience to ecological disturbances (Pauls et al., 2013). Additionally, knowledge of genetic structure is useful for understanding the migration routes, areas, and seasons of fish spawning. Such information can help fisheries managers define the spatiotemporal scales over which they can implement effective stock management and conservation plans (Bradbury et al., 2008). Therefore, from the resource management perspective, understanding the levels of gene flow among populations and patterns of genetic diversity is a fundamental issue. The effectiveness of marine protected areas depends on both their ability to self-recruit (reproductive potential) and the spillover of adults and export of larvae to nearby fished areas (Harrison et al., 2012; Le Port et al., 2017). Over the last 30 years, population genetic studies have become an essential tool for stock management and conservation of coral reef, estuarine, and coastal populations because population genetic studies are useful for estimating genetic diversity and the ability to survive anthropogenic activities such as overfishing, habitat degradation, eutrophication, invasive species, and pollution (Ryman et al., 1995; Ruzzante et al., 1998; Gill and Kemp, 2002; Gaither et al., 2010; Machado et al., 2020). Mitochondrial DNA markers (mtDNA) are widely employed to detect population structure in marine species because they have large number of copies, high mutation rates, generally maternal inheritance, and almost nonexistent recombination. The primary advantages of mtDNA are the inheritance pattern and nonexistent recombination: speciation events over multiple generations can be traced through maternal cloning, and male dispersal does not homogenize the population (Prugnolle and de Meeus, 2002). These factors make mtDNA markers particularly suitable indicators of the genetic structure of marine populations with high gene flows, such as zooplankton and migratory fishes (Wang et al., 2013; Xu et al., 2019; Machado et al., 2020).
Threadfin porgy, Evynnis cardinalis (Lacepède 1802), occurs in the Indo-West Pacific from Japan, Korea, and China to Vietnam and Indonesia (Chen and Qiu, 2005). The species is mainly distributed at depths of 30–60 m, but also can occur to 100 m depth (Iwatsuki and Carpenter, 2014). E. cardinalis can be found in various types of bottoms, but is more common close to coral reefs or rough bottoms. Small individuals are very common in shallow, such as sheltered bays, while larger fish often live in deeper water (Eggleston, 1974). E. cardinalis is one of the main commercial fishing targets of bottom trawl fishery in the northern South China Sea and is thought to have three geographical stocks in the northern South China Sea: the Taiwan Strait, South China Sea, and Beibu Gulf stocks (Zhang et al., 2020). According to the surveys data, more than 90% catches of the total of sparids is E. cardinalis in Beibu Gulf. E. cardinalis is a migratory fish that is captured all year round with significant seasonal differences among different fishing areas. In Beibu Gulf, E. cardinalis undergoes seasonal migration and is found toward the northeastern shallow area of the gulf in late autumn and early winter. Then, spawning takes place in northwest Weizhou Island in early spring, and the recruits disperse widely in the northern area of the gulf and begin to disperse to the south in late spring (Iwatsuki and Carpenter, 2014). However, this species exhibits late maturity and longevity, which predispose it to impacts from heavy exploitation. In the northern South China Sea, the Beibu Gulf stock of E. cardinalis declined by 58% from 2001 to 2005, whereas the Taiwan Strait stock declined by 62% from 1993 to 2008. Therefore, a recent IUCN Red List assessment reported E. cardinalis as endangered, and this species is mainly threatened by overexploitation (Iwatsuki and Carpenter, 2014). Previous studies of E. cardinalis in Beibu Gulf have focused on feeding habits, growth and mortality, ecological distribution, phylogeny, and stock density (Chen and Qiu, 2003; Chen and Qiu, 2005; Zhang et al., 2007; Zhang et al., 2014; Cai et al., 2017; Zhang et al., 2020). However, no information is available to date on the population genetic structure of E. cardinalis in the northern South China Sea, and this prevents reliable stock assessments and protection policy formulation. The objective of this study was to provide a population genetic analysis using a portion of the mitochondrial cytochrome c oxidase subunit I (COI) gene to assess the population genetic diversity pattern and historical demography, and estimate E. cardinalis expansion time in Beibu Gulf.
Materials and Methods
Study Area
Beibu Gulf (17°–22°N, 105°–110°E) is located in the northwestern part of the South China Sea and has a long coastline that belongs to China and Vietnam. It is an approximately 128,000 km2 of semi-closed gulf that ranges from Leizhou Peninsula, Qiongzhou Strait, and Hainan Island to east Vietnam coast, and extends to the Guangxi coast in the north (Ma et al., 2010). The bottom of Beibu Gulf is flat and deepens from the northwest to the southeast, with a depth of typically less than 100 m (average depth, 42 m). The surrounding climate of this gulf is subtropical and monsoonal. Moreover, this gulf contains numerous estuaries from which rivers discharge nutrients. Beibu Gulf is a traditional fishing ground and important source of fishery products for coastal areas because of high productivity and rich biodiversity, which benefit from its unique geographic location and climatic conditions (Chen et al., 2009).
Sample Collection
All E. cardinalis specimens were collected from fishery surveys carried out by the South China Sea Fisheries Research Institute; these surveys were conducted by the commercial fishing vessel “Beiyu60011” in the northern South China Sea using bottom trawler nets in September 2018. We set eleven sampling sites in the study area of Beibu Gulf, which covered over 45,000 km2 (Figure 1). In total, 11–16 specimens of each sampling locations were used for the DNA analyses after morphological identification. The dorsal fin or muscle were removed from each specimen and preserved in absolute ethanol at −20°C.
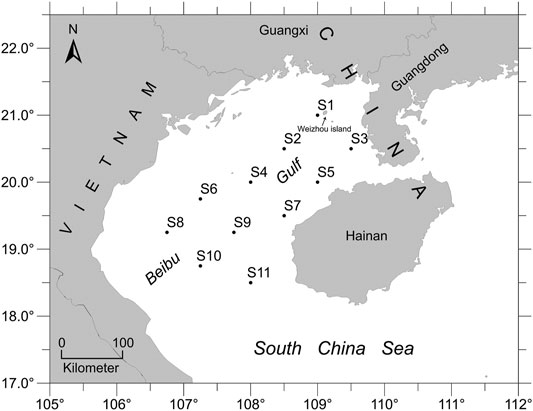
FIGURE 1. Map showing study area and 11 sampling locations in Beibu Gulf, South China Sea.
DNA Extraction, Amplification, and Sequencing
Genomic DNA were extracted from the dorsal fin or muscle tissue using the TIANamp Marine Animals DNA Kit (TIANGEN, China). The concentration used as PCR template was adjusted to an A260 of approximately 0.05–0.2. Fragments of the mtDNA cytochrome c oxidase subunit I gene were amplified from total genomic DNA by the polymerase chain reaction. The primer sets FishF1 and FishR1 (Ward et al., 2005) were used for PCR amplification. Each 50 µl PCR tube contained of 5 µl PCR buffer, 4 µl of 25 μM MgCl2, 2.5 µl DNA template, 5 µl CoralLoad concentrate, 0.5 µl of 25 µM solution of each primer, 1 µl of 10 µM dNTPs, 0.25 µl TopTaq DNA polymerase, and 31.25 µl ddH2O (QIAGEN, Germany). The procedure for PCR amplification were in turn as follows: an initial step of 95°C for 3 min; 35 cycles with 95°C for 30 s (denaturation), 54°C for 30 s (annealing), and 72°C for 1 min (extension); then followed by 5 min at 72°C (final extension) on a 2,720 Thermal Cycler (Applied Biosystems, United States). PCR products were visualized on 1.2% agarose gels and the most intense bands were selected for sequencing. All PCR products were bidirectionally sequenced on an ABI 3730XL automated sequencer with both forward and reverse primers.
Genetic Analysis
The authenticity of all COI sequences was first verified by BLAST search in GenBank (BLASTn, megablast algorithm) and compared with the highest match (99–100%).
Then all sequences were assembled in Bioedit (Hall, 1999) and aligned using the CLUSTALW multiple algorithm under default options. Ambiguous sequences were trimmed after alignment. Molecular diversity from COI sequences was measured using DnaSP 5.0 (Librado and Rozas, 2009) with the following variables: number of haplotypes (H), polymorphic sites (S), haplotype diversity (h), and nucleotide diversity (π).
In order to visually represent the relationships between the mtDNA haplotypes of the sampled E. cardinalis individuals, we performed a haplotype network analysis using HAPLOVIEWER, which turns traditional phylogenetic tree into haplotype genealogies network (Salzburger et al., 2011). The phylogenetic tree used for this visual representation was obtained by employing a maximum likelihood approach in PhyML 3.0 (Guindon et al., 2010) using a GTR model with four gamma-distributed rate categories as the substitution model.
Population genetic differentiation was estimated by pairwise ΦST values among 11 sampling sites using the Tamura–Nei model of nucleotide substitution in Arlequin 3.5 (Excoffier and Lischer, 2010). The model was assessed as most suitable for our data using jModeltest 2.1 (Darriba et al., 2012). The significance of the pairwise ΦST values was tested by 10,000 permutations. To estimate migration rates between sampling sites, we performed maximum likelihood analysis using the coalescence method in Migrate 3.2.1 (Beerli and Felsenstein, 1999). The estimated parameters were Pij = θiMij, where Pij is the number of effective migrants from i to j, θ is mutation-scaled population size, and Mij is mij/μ (where mij is the immigration rate from population i into j, μ is the mutation rate per generation).
Inferring the Historical Demography
Signatures of population demographic patterns (bottlenecks or expansions) in E. cardinalis were first examined by Tajima (1989) and Fu (1997) statistics with 10,000 permutations in Arlequin 3.5 to determine whether E. cardinalis in the Beibu Gulf data conformed to or departed from neutral theory model expectations because of factors such as a population bottleneck or expansion. For neutral markers, significant negative Fu’s Fs and Tajima’s D values can be expected under population expansion.
Then, we calculated the mismatch distribution among sampling sites under the sudden expansion model. This measure quantified the smoothness of the observed mismatch distribution. We used parametric bootstrapping (1,000 replicates) as implemented in Arlequin 3.5 to test the goodness of fit of the observed mismatch distribution to the expected under the sudden expansion model using raggedness index (R index) and the sum of squared deviations (Schneider and Excoffier, 1999; Ray et al., 2003; Excoffier, 2004). Populations that underwent substantial expansion are expected to display unimodal mismatch distributions with a low R index.
Furthermore, we used two methods to estimate the population expansion time of E. cardinalis in Beibu Gulf. First, the population expansion time was directly calculated from the mismatch distribution of τ (tau) statistic and converted to the absolute time in years (t) using the equation τ = 2 ut, where u is the mutation rate of the sequence and is calculated as u = 2 µk; k is the nucleotides number of the sequence and µ is the mutation rate of the mtDNA gene per generation (Rogers and Harpending, 1992). Following Cantatore et al. (1994), mutation rates between 1 and 3% per million years were selected for our mitochondrial analysis.
Subsequently, we inferred historical demography from effective population size estimates over time using the Bayesian skyline plot (BSP) method in BEAST 1.8.0 (Drummond et al., 2005; Drummond and Rambaut, 2007). This calculation used a strict molecular clock with an HKY model assumed with among-site rate heterogeneity across all branches. Markov chains were run for 2.5 × 10⁷ generations and sampled every 1,000 generations, with the first 2,500 samples discarded as burn-in. Three replicates were performed and combined to analyze COI datasets, respectively. The rest of parameters were set as default values. TRACER 1.5 was employed to visualize the posterior probabilities of the Markov chain statistics and to estimate a statistical summary of the genetic parameters.
Results
Genetic Diversity
In total, 162 high-quality sequences were obtained after alignment and trimmed to 618 bp. The average base composition were C = 28.8%, A = 22.3%, T = 30.1%, G = 18.8%. In total, we found 44 different haplotypes in our sampling area (Table 1; Figure 2). All 44 haplotype sequences were deposited in GenBank (accession numbers MW881382–MW881425). Overall, the nucleotide diversity was low (average, 0.00232; range, 0.00185–0.00277), while the haplotype diversity was relatively high and heterogeneous (average, 0.788; range, 0.657–0.886) (Table 1).
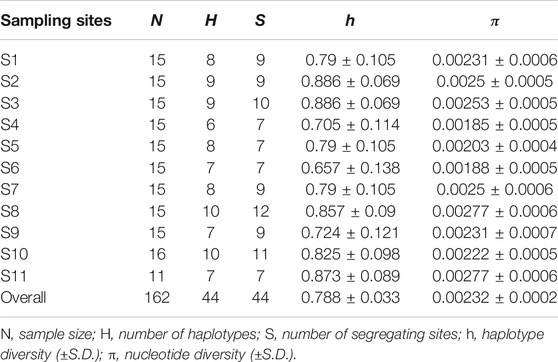
TABLE 1. Descriptive statistics of genetic diversity of Evynnis cardinalis sampled from Beibu Gulf based on COI sequence data.
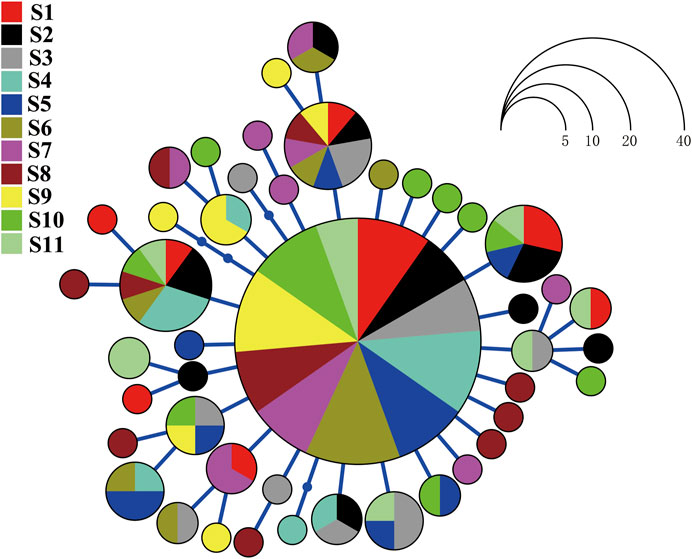
FIGURE 2. Haplotype network for Evynnis cardinalis on the basis of nucleotide variation at the mitochondrial cytochrome c oxidase subunit I gene. Each circle represents a unique haplotype whose size is proportional to the number of individuals sharing that specific haplotype.
The haplotype network analyses of the mtDNA from E. cardinalis in Beibu Gulf showed a typical star-like pattern, with the most common haplotype, H1, located at the center of the haplotype network and surrounded by many low-frequency haplotypes that were divergent from H1 by only one or two mutations (Figure 2). Most of the haplotypes had low-frequency, and 27 haplotypes were uniquely present at only one sampling site. Only 11 out of the 44 haplotypes were observed at more than two sampling sites. However, several of the abundant haplotypes were present at multiple sampling sites. For example, the dominant widespread haplotype H1 distributed in all 11 sampling sites (Figure 3); the largest distance between two sampling sites harboring this haplotype was more than 300 km. H6 and H8 were distributed at eight and seven sampling sites, respectively. Moreover, between six and ten haplotypes were found per sampling site, but there was no clear pattern of geographical variation (Figure 3). The highest number of haplotypes (H = 10) was observed at sites 8 and 10 (Table 1).
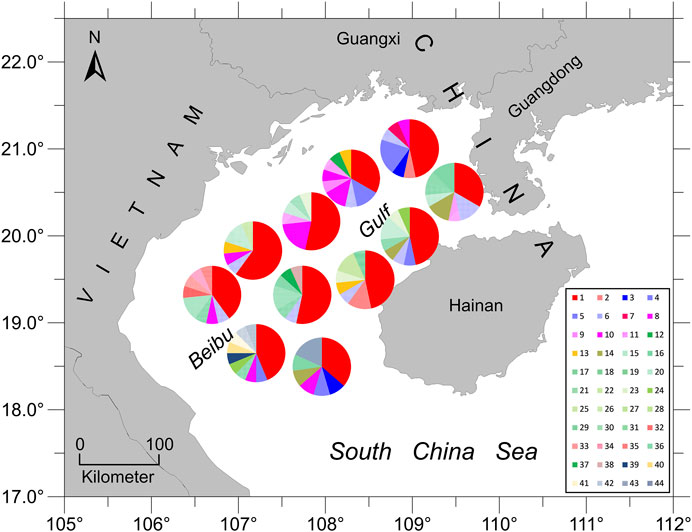
FIGURE 3. Pie diagrams showing the relative abundance of different haplotypes at the eleven sampling sites (total number of different haplotypes = 44). The size of each pie fraction is proportional to the proportion of individuals with a given haplotype.
The average genetic differentiation, ΦST, of E. cardinalis within Beibu Gulf was 0.031 (range, −0.0657–0.0671). All pairwise ΦST values among the sampling sites were small and not significant (Table 2). The effective number of migrants per generation among sampling sites ranged from 5.98 to 45.76. The rates of migration from S7 to S1 were the lowest, whereas those from S1 to S3 were the highest (Table 3).
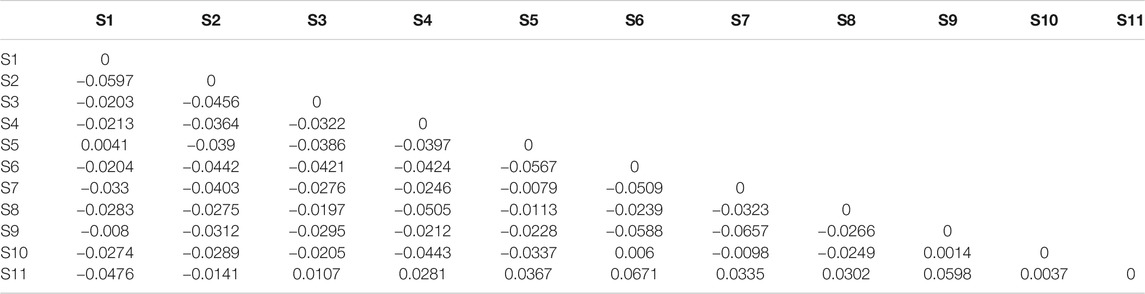
TABLE 2. Pairwise differentiation ΦST of Evynnis cardinalis sampled from Beibu Gulf based on COI sequence data.
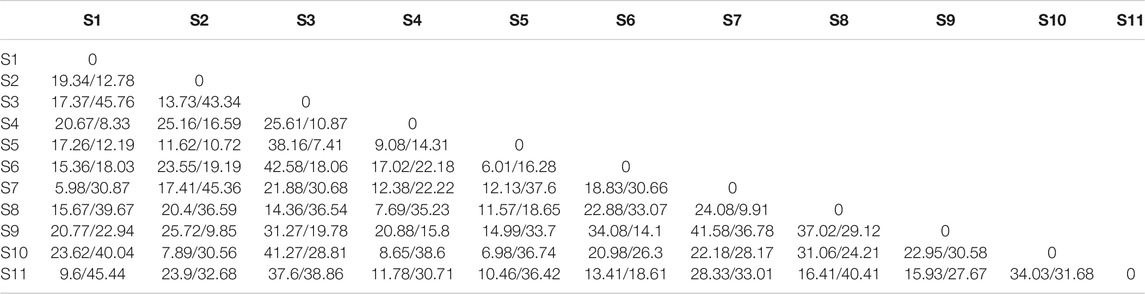
TABLE 3. Migration rates (number of migrants per generation) among Evynnis cardinalis sampling sites from Beibu Gulf (receives/exports).
Demographic History
The Fu’s Fs and Tajima’ D tests of E. cardinalis in Beibu Gulf were significantly negative (Fu’s Fs = −28.378, p < 0.01; Tajima’s D = −2.446, p < 0.01); this indicated that E. cardinalis may have experienced population expansion (Table 4). The mismatch distribution appeared to be unimodal (Figure 4), which was consistent with the expected distribution under a sudden expansion model (R index = 0.055, p = 0.26).
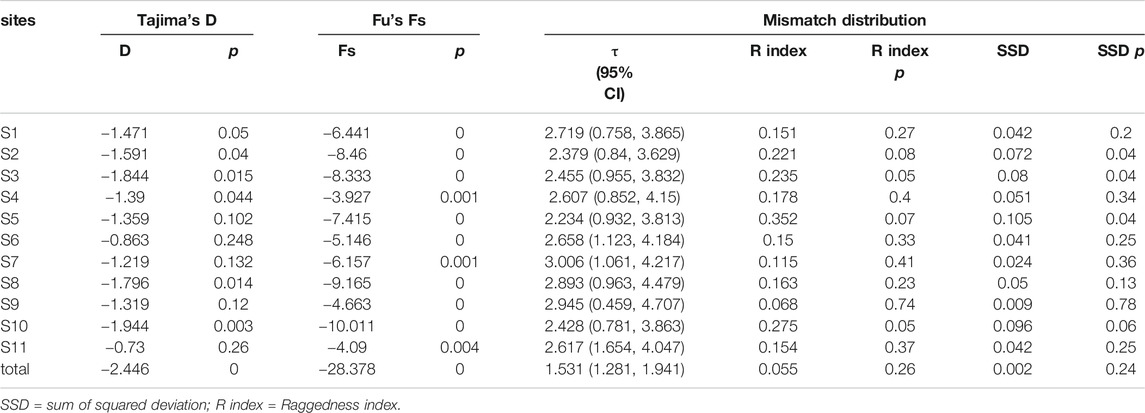
TABLE 4. Mismatch distribution, Tajima’s D and Fu’s Fs statistics for Evynnis cardinalis.
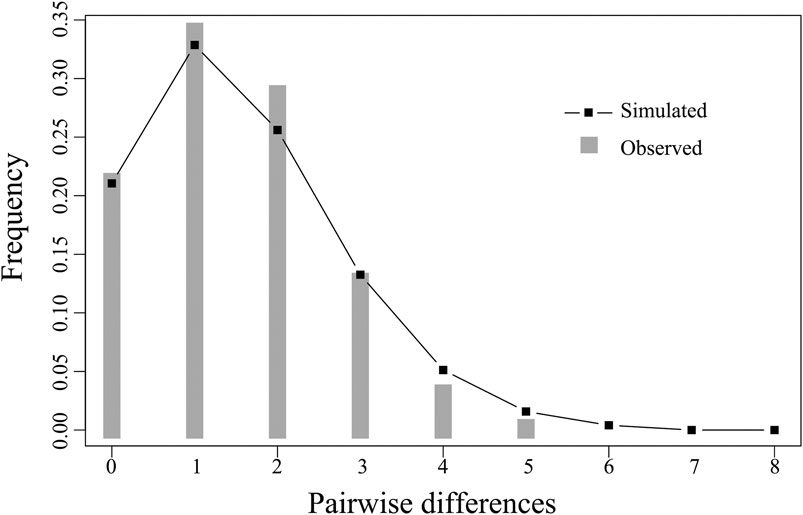
FIGURE 4. Observed mismatch distributions (bars) and expected mismatch distributions under sudden expansion model (line) of COI for Evynnis cardinalis from Beibu Gulf.
On the basis of the mutation rate of 1–3% of mitochondrial genes per million years (Cantatore et al., 1994) and τ value of all data (1.531, 95% confidence interval: 1.281–1.941), the expansion time for E. cardinalis in Beibu Gulf was estimated to have occurred from approximately 62–21 ka.
The BSP analysis indicated that the E. cardinalis haplotypes in Beibu Gulf coalesced approximately 40 ka when a mutation rate of 2% of mitochondrial genes per million years was used for analysis. However, the BSP pattern revealed a coalescence time of 30–70 ka when using a mutation rate of 1–3% per million years (Figure 5). Despite these different coalescence times, the BSP patterns showed similar tendencies and indicated that a steady population expansion took place between 5 and 30 ka.
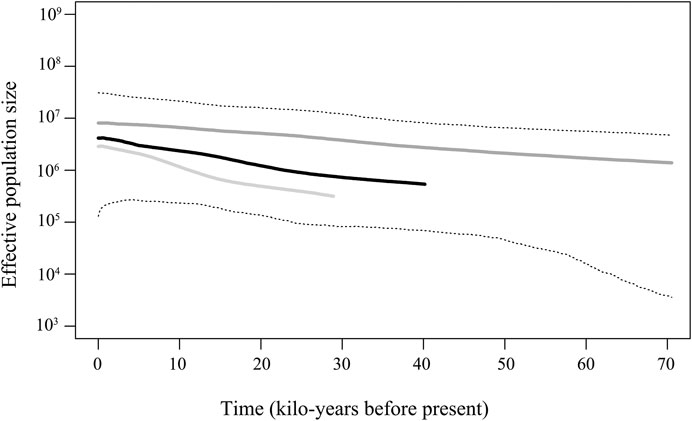
FIGURE 5. Bayesian skyline plot revealing the demographic trends of Evynnis cardinalis in Beibu Gulf. The dark solid line is median estimate under the assumption of a 2% mutation rate per million years. The dark gray solid line shows the median given the assumption of a 1% mutation rate per million, while the light gray bottom line shows the median obtained under the assumption of a 3% mutation rate per million years, and the dashed lines show the 95% highest posterior density (HPD) limits.
Discussion
Studies of population connectivity with mitochondrial markers provide critical information on gene flow and genetic relationships between neighboring populations (Turner et al., 2004; García et al., 2008). Many studies showed that mitochondrial markers are highly effective for revealing marine fish genetic diversity and population connectivity (Lavergne et al., 2014; Gao et al., 2019; Machado et al., 2020). In this study on E. cardinalis, mtDNA sequence analysis of specimens from Beibu Gulf revealed no significant genetic differentiation among sampling sites, with low ΦST values indicating genetic homogeneity.
In contrast to freshwater fish, marine fish are generally expected to show relatively low genetic differentiation across their distribution. It is mainly attributed to genetic exchange being maintained by adult mobility throughout Beibu Gulf during reproduction, and through the passive dispersal of eggs and larvae due to the lack of noticeable physical barriers in pelagic oceans (Grant and Bowen, 1998; Hellberg, 2009; Machado et al., 2020). The dominant widespread haplotype H1 was found in all 11 sampling sites, which also indicated high dispersal potential of E. cardinalis at planktonic egg, larval, or adult stages in Beibu Gulf.
Previous studies suggested that E. cardinalis breed once a year in Beibu Gulf (Chen and Qiu, 2003; Hou et al., 2008). E. cardinalis gonads begin to develop in November and begin to spawn from December to February. The population concentrated in the northern Beibu Gulf during spawning. In early spring, parent fish mainly occur in the northeast of the gulf after spawning, and juveniles concentrate in shallow nearshore of this area in late spring. Thereafter, juveniles gradually migrate southwest and widely disperse in deep waters of Beibu Gulf in summer or early autumn (Zhang et al., 2020).
In addition, the dispersal pattern of E. cardinalis was also impacted by circulation in Beibu Gulf. In spring, the density gradient and monsoon wind drive the ocean current from northeast to southwest in the gulf. The surface current velocity reaches 30 cm/s, and the current in the middle layer is approximately 5–10 cm/s (Gao et al., 2017). The direction of the spring currents roughly coincides with the migration route of E. cardinalis. Therefore, the seasonal migration and ocean current may be responsible for gene exchange between different locations, and E. cardinalis shows low levels of genetic differentiation in Beibu Gulf. If we refer to the biological description of a single stock as given by Ihssen et al. (1981), ‘‘a stock is an intraspecific group of randomly mating individuals with temporal and spatial integrity,’’ then the lack of distinct spatial boundaries and genetic substructure (low ΦST values) revealed by genetic analyses indicated that E. cardinalis in Beibu Gulf belong to a single stock.
The presence of a single stock in Beibu Gulf indicates that geographical isolation might block gene exchange between the Beibu Gulf stock and the other 2 E. cardinalis stocks, the Taiwan Strait and South China Sea stocks. In Beibu Gulf, the circulation, Hainan Island, and Leizhou Peninsula could act as barriers that impede free dispersal of E. cardinalis into this gulf from other areas of the South China Sea (Gao et al., 2017). Our findings and similar investigations conducted elsewhere demonstrated that marine fish that inhabit coastal waters usually constitute a single panmictic stock. For example, Rodrigues et al. (2008) revealed that Cynoscion acoupa from northern Brazil belongs to a single stock, even though it covers at least 1,260 km of coastline. Gao et al. (2019) reported a high level of genetic homogeneity in the Pholis fangi population around Yellow Sea and Bohai Sea, and suggested it should be considered as a single panmictic stock. Hoolihan et al. (2006) also reported a homogeneous distribution of Spanish mackerel (Scomberomorus commerson) throughout the Gulf of Oman, Arabian Gulf, and Arabian Sea on the basis of mtDNA analyses.
In addition, mtDNA sequence regions are particularly suitable for inferring historical processes that might be responsible for the contemporary geographical distribution of marine species because they are more prone to genetic drift than nuclear genes and have a relatively small effective population size (Slatkin and Hudson, 1991; Avise, 1994). In our study, the haplotype network of E. cardinalis from Beibu Gulf exhibited a star-like and unstructured pattern with a predominance of scattered. The dominant haplotype (carried by 45% of the specimens) was at the center of the haplotype network and surrounded by many haplotypes that diverged from the dominant haplotype by only few mutations. Most surrounding haplotypes were unique to each sampling site and showed few differences among them (Figure 2). Similar star-like haplotype networks have been observed for other species in different coastal areas: Terapon jarbua, which consists of a panmictic stock from the Socotra Archipelago to the Hadhramout Coast along the wider Gulf of Aden (Lavergne et al., 2014); and Pogonias courbina, which did not display distinct structure along the coast of the southwestern Atlantic Ocean (Machado et al., 2020).
A star-like haplotype network pattern, low nucleotide diversity, and high haplotype diversity are often considered consequences of recent population expansion linked to the Pleistocene environmental changes (Craig et al., 2007; Pereira et al., 2009; Liu et al., 2011). The recent demographic expansion of E. cardinalis from Beibu Gulf is also supported by the unimodal mismatch distribution and significantly negative Fu’s Fs and Tajima’s D values. The population expansion of E. cardinalis in Beibu Gulf, which was directly estimated from the mismatch distribution, started 62–21 ka before present, corresponding to the late Pleistocene. BSP analysis indicated steady population expansion that started around 30 ka. Both two methods of estimated period of population expansion are consistent with the environment changes of the northern South China Sea in the Pleistocene.
E. cardinalis is mainly distributed from 30 to 60 m depth, and spawns in coastal habitats and shallow shorelines. Therefore, the E. cardinalis distribution is closely related to historical sea level fluctuations. When sea level was 120 m lower than the present level during the last glacial maximum of the Pleistocene, the northern South China Sea included Beibu Gulf, which was part of the South China continent, Hainan Island, and Taiwan Island were connected to mainland China, and the entire South China Sea was separated from the Indian Ocean to form a semi-closed basin (Wang and Sun, 1994; Voris, 2000). Similar to other terrestrial species, E. cardinalis may have moved and survived in a potential glacial refuge during this period, such as the semi-closed South China Sea (Hewitt, 1999). In the late Pleistocene, the sea level was still 30 m lower than the present level, but the glaciation began to disappear and the sea water gradually poured into Beibu Gulf through the Qiongzhou Strait (Lu et al., 2003). An initial population of E. cardinalis may have immigrated to Beibu Gulf from neighboring areas after it was filled with sea water and sufficiently deep. This initial panmictic stock quickly colonized the empty novel environment under the founder and priority effects, and might have experienced rapid population expansion when favorable conditions occurred (Shulman et al., 1983; Boileau et al., 1992).
Conclusion
A homogeneous population structure with low genetic diversity and star-like haplotype pattern was revealed for E. cardinalis in Beibu Gulf of the northern South China Sea. Pairwise comparisons of ΦST and the effective number of migrants between all sampling sites in Beibu Gulf indicated a single panmictic stock of E. cardinalis. This is mainly attributed to the free genetic exchange of E. cardinalis during reproduction. However, E. cardinalis from the eastern South China Sea cannot disperse into Beibu Gulf because of the circulation patterns and ocean geographical features such as the semi-closed sea of Beibu Gulf. This molecular evidence revealed that E. cardinalis from Beibu Gulf might have experienced colonization and population expansion during the late Pleistocene due to sea level fluctuations.
Data Availability Statement
The original contributions presented in the study are publicly available. This data can be found here: National Center for Biotechnology Information (NCBI) BioProject database under accession numbers: MW881382‐MW881425.
Ethics Statement
The animal study was reviewed and approved by South China Sea Fisheries Research Institute, Chinese Academy of Fishery Sciences.
Author Contributions
LX: Conceptualization, Methodology, Formal analysis, Data curation, Writing—original draft, Writing—review and editing. LW, JN, DH, YL, and SL: Methodology, Formal analysis. FD: Funding acquisition, Project administration, Resources.
Funding
This study was funded by Science and Technology Basic Resources Investigation Program of China (2018FY100105) and Fund of Guangdong Provincial Key Laboratory of Fishery Ecology and Environment (FEEL-2019-9).
Conflict of Interest
The authors declare that the research was conducted in the absence of any commercial or financial relationships that could be construed as a potential conflict of interest.
Publisher’s Note
All claims expressed in this article are solely those of the authors and do not necessarily represent those of their affiliated organizations, or those of the publisher, the editors and the reviewers. Any product that may be evaluated in this article, or claim that may be made by its manufacturer, is not guaranteed or endorsed by the publisher.
Acknowledgments
We thank all colleagues and students for their help with sampling. We thank Mallory Eckstut, from Liwen Bianji (Edanz) (https://www.liwenbianji.cn), for editing the language of a draft of this manuscript.
References
Araki, H., and Schmid, C. (2010). Is Hatchery Stocking a Help or Harm? Aquaculture 308, S2–S11. doi:10.1016/j.aquaculture.2010.05.036
Avise, J. C. (1994). Molecular Markers, Natural History and Evolution. New York: Chapman & Hall. doi:10.1007/978-1-4615-2381-9
Beerli, P., and Felsenstein, J. (1999). Maximum-Likelihood Estimation of Migration Rates and Effective Population Numbers in Two Populations Using a Coalescent Approach. Genetics 152 (2), 763–773. doi:10.1093/genetics/152.2.763
Boileau, M. G., Hebert, P. D. N., and Schwartz, S. S. (1992). Non-equilibrium Gene Frequency Divergence: Persistent Founder Effects in Natural Populations. J. Evol. Biol 5 (1), 25–39. doi:10.1046/j.1420-9101.1992.5010025.x
Bradbury, I. R., Laurel, B., Snelgrove, P. V. R., Bentzen, P., and Campana, S. E. (2008). Global Patterns in marine Dispersal Estimates: the Influence of Geography, Taxonomic Category and Life History. Proc. R. Soc. B. 275 (1644), 1803–1809. doi:10.1098/rspb.2008.0216
Cai, Y., Chen, Z., Xu, S., and Zhang, K. (2017). Tempo-spatial Distribution of Evynnis Cardinalis in Beibu Gulf. South China Fish. Sci. 13 (4), 1–10. doi:10.3969/j.issn.2095-0780.2017.04.001
Caley, M. J., Carr, M. H., Hixon, M. A., Hughes, T. P., Jones, G. P., and Menge, B. A. (1996). Recruitment and the Local Dynamics of Open marine Populations. Annu. Rev. Ecol. Syst. 27 (1), 477–500. doi:10.1146/annurev.ecolsys.27.1.477
Cantatore, P., Roberti, M., Pesole, G., Ludovico, A., Milella, F., Gadaletal, M. N., et al. (1994). Evolutionary Analysis of Cytochrome B Sequences in Some Perciformes: Evidence for a Slower Rate of Evolution Than in Mammals. J. Mol. Evol. 39 (6), 589–597. doi:10.1007/BF00160404
Chen, Z., and Qiu, Y. (2005). Stock Variation of Parargyrops Edita Tanaka in Beibu Gulf. South China Fish. Sci. 1 (3), 21–31. doi:10.3969/j.issn.2095-0780.2005.03.004
Chen, Z., Xu, S., Qiu, Y., Lin, Z., and Jia, X. (2009). Modeling the Effects of Fishery Management and marine Protected Areas on the Beibu Gulf Using Spatial Ecosystem Simulation. Fish. Res. 100 (3), 222–229. doi:10.1016/j.fishres.2009.08.001
Chen, Z. Z., and Qiu, Y. S. (2003). Esitimation of Growth and Mortality Parameters of Parargyrops Edita Tanaka in Beibu Bay. J. Fish. China 27 (3), 251–257. doi:10.3321/j.issn:1000-0615.2003.03.010
Craig, M., Eble, J., Bowen, B., and Robertson, D. (2007). High Genetic Connectivity across the Indian and Pacific Oceans in the Reef Fish Myripristis berndti (Holocentridae). Mar. Ecol. Prog. Ser. 334, 245–254. doi:10.3354/meps334245
Darriba, D., Taboada, G. L., Doallo, R., and Posada, D. (2012). jModelTest 2: More Models, New Heuristics and Parallel Computing. Nat. Methods 9 (8), 772. doi:10.1038/nmeth.2109
Drummond, A. J., and Rambaut, A. (2007). BEAST: Bayesian Evolutionary Analysis by Sampling Trees. BMC Evol. Biol. 7 (1), 214. doi:10.1186/1471-2148-7-214
Drummond, A. J., Rambaut, A., Shapiro, B., and Pybus, O. G. (2005). Bayesian Coalescent Inference of Past Population Dynamics from Molecular Sequences. Mol. Biol. Evol. 22 (5), 1185–1192. doi:10.1093/molbev/msi103
Eggleston, D. (1974). “Sparidae,” in FAO Species Identification Sheets for Fishery Purposes. Eastern Indian Ocean (Fishing Area 57) and Western Central Pacific (Fishing Area 71). Editors W. Fischer, and P. J. P. Whitehead (Rome: FAO).
Excoffier, L., and Lischer, H. E. L. (2010). Arlequin Suite Ver 3.5: a New Series of Programs to Perform Population Genetics Analyses under Linux and Windows. Mol. Ecol. Resour. 10 (3), 564–567. doi:10.1111/j.1755-0998.2010.02847.x
Excoffier, L. (2004). Patterns of DNA Sequence Diversity and Genetic Structure after a Range Expansion: Lessons from the Infinite-Island Model. Mol. Ecol. 13 (4), 853–864. doi:10.1046/j.1365-294X.2003.02004.x
Fu, Y.-X. (1997). Statistical Tests of Neutrality of Mutations against Population Growth, Hitchhiking and Background Selection. Genetics 147 (2), 915–925. doi:10.1093/genetics/147.2.915
Gaither, M. R., Toonen, R. J., Robertson, D. R., Planes, S., and Bowen, B. W. (2010). Genetic Evaluation of marine Biogeographical Barriers: Perspectives from Two Widespread Indo-Pacific Snappers (Lutjanus Kasmira and Lutjanus Fulvus). J. Biogeogr. 37 (1), 133–147. doi:10.1111/j.1365-2699.2009.02188.x
Gandra, M., Assis, J., Martins, M. R., and Abecasis, D. (2020). Reduced Global Genetic Differentiation of Exploited Marine Fish Species. Mol. Biol. Evol. 38, 1402–1412. doi:10.1093/molbev/msaa299
Gao, J., Wu, G., and Ya, H. (2017). Review of the Circulation in the Beibu Gulf, South China Sea. Continental Shelf Res. 138, 106–119. doi:10.1016/j.csr.2017.02.009
Gao, T., Li, L., Fang, R., Liu, G., Wang, L., Xu, H., et al. (2019). Shallow Genetic Structure of Pholis Fangi in Bohai Sea and Yellow Sea Inferred from mtDNA Control Region. J. Ocean Univ. China 18 (4), 947–952. doi:10.1007/s11802-019-3991-6
García, G., Vergara, J., and Gutiérrez, V. (2008). Phylogeography of the Southwestern Atlantic Menhaden Genus Brevoortia (Clupeidae, Alosinae). Mar. Biol. 155 (3), 325–336. doi:10.1007/s00227-008-1030-z
Gill, A. C., and Kemp, J. M. (2002). Widespread Indo-Pacific Shore-Fish Species: A Challenge for Taxonomists, Biogeographers, Ecologists, and Fishery and Conservation Managers. Environ. Biol. Fishes 65 (2), 165–174. doi:10.1023/A:1020044616889
Grant, W., and Bowen, B. W. (1998). Shallow Population Histories in Deep Evolutionary Lineages of marine Fishes: Insights from Sardines and Anchovies and Lessons for Conservation. J. Hered. 89 (5), 415–426. doi:10.1093/jhered/89.5.415
Guindon, S., Dufayard, J.-F., Lefort, V., Anisimova, M., Hordijk, W., and Gascuel, O. (2010). New Algorithms and Methods to Estimate Maximum-Likelihood Phylogenies: Assessing the Performance of PhyML 3.0. Syst. Biol. 59 (3), 307–321. doi:10.1093/sysbio/syq010
Hall, T. A. (1999). BioEdit: a User-Friendly Biological Sequence Algnment Editor and Analysis Program for Windows 95/98/NT. Nucl. Acids Symp. Ser. 41, 95–98. doi:10.1021/bk-1999-0734.ch008
Harrison, H. B., Williamson, D. H., Evans, R. D., Almany, G. R., Thorrold, S. R., Russ, G. R., et al. (2012). Larval Export from Marine Reserves and the Recruitment Benefit for Fish and Fisheries. Curr. Biol. 22 (11), 1023–1028. doi:10.1016/j.cub.2012.04.008
Hellberg, M. E. (2009). Gene Flow and Isolation Among Populations of Marine Animals. Annu. Rev. Ecol. Evol. Syst. 40 (1), 291–310. doi:10.1146/annurev.ecolsys.110308.120223
Hewitt, G. M. (1999). Post-glacial Re-colonization of European Biota. Biol. J. Linn. Soc. 68 (1-2), 87–112. doi:10.1006/bijl.1999.033210.1111/j.1095-8312.1999.tb01160.x
Hoolihan, J. P., Anandh, P., and van Herwerden, L. (2006). Mitochondrial DNA Analyses of Narrow-Barred Spanish Mackerel (Scomberomorus commerson) Suggest a Single Genetic Stock in the ROPME Sea Area (Arabian Gulf, Gulf of Oman, and Arabian Sea). ICES J. Mar. Sci. 63 (6), 1066–1074. doi:10.1016/j.icesjms.2006.03.012
Hou, G., Feng, B., Lu, H., and Zhu, J. (2008). Age and Growth Characteristics of Crimson Sea Bream Paragyrops Edita Tanaka in Beibu Gulf. J. Ocean Univ. China 7, 457–465. doi:10.1007/s11802-008-0457-7
Ihssen, P. E., Booke, H. E., Casselman, J. M., McGlade, J. M., Payne, N. R., and Utter, F. M. (1981). Stock Identification: Materials and Methods. Can. J. Fish. Aquat. Sci. 38 (12), 1838–1855. doi:10.1139/f81-230
Iwatsuki, Y., and Carpenter, K. E. (2014). Evynnis Cardinalis. The IUCN Red List of Threatened Species 2014. e.T59034974A59034995. doi:10.2305/IUCN.UK.2014-3.RLTS.T59034974A59034995.en
Lavergne, E., Calvès, I., Meistertzheim, A. L., Charrier, G., Zajonz, U., and Laroche, J. (2014). Complex Genetic Structure of a Euryhaline marine Fish in Temporarily Open/closed Estuaries from the Wider Gulf of Aden. Mar. Biol. 161 (5), 1113–1126. doi:10.1007/s00227-014-2404-z
Le Port, A., Montgomery, J. C., Smith, A. N. H., Croucher, A. E., McLeod, I. M., and Lavery, S. D. (2017). Temperate marine Protected Area Provides Recruitment Subsidies to Local Fisheries. Proc. R. Soc. B. 284 (1865), 20171300. doi:10.1098/rspb.2017.1300
Librado, P., and Rozas, J. (2009). DnaSP V5: a Software for Comprehensive Analysis of DNA Polymorphism Data. Bioinformatics 25 (11), 1451–1452. doi:10.1093/bioinformatics/btp187
Liu, J.-X., Tatarenkov, A., Beacham, T. D., Gorbachev, V., Wildes, S., and Avise, J. C. (2011). Effects of Pleistocene Climatic Fluctuations on the Phylogeographic and Demographic Histories of Pacific Herring (Clupea pallasii). Mol. Ecol. 20 (18), 3879–3893. doi:10.1111/j.1365-294X.2011.05213.x
Lu, B., Huang, S., Li, G., and Zhang, F. (2003). Vertical Variations of Core Sound Velocity: Evidence of Paleooceanographic History since the Pleistocene Epoch. Mar. Georesources Geotechnology 21 (2), 63–71. doi:10.1080/716100485
Ma, F., Wang, Y., Li, Y., Ye, C., Xu, Z., and Zhang, F. (2010). The Application of Geostatistics in Grain Size Trend Analysis: A Case Study of Eastern Beibu Gulf. J. Geogr. Sci. 20 (1), 77–90. doi:10.1007/s11442-010-0077-1
Machado, R. C., da Silva Cortinhas, M. C., Proietti, M. C., and Haimovici, M. (2020). Genetic Connectivity of Black Drum (Pogonias Courbina) Stocks in the Southwestern Atlantic Ocean. Environ. Biol. Fish. 103 (8), 913–926. doi:10.1007/s10641-020-00993-6
Pauls, S. U., Nowak, C., Bálint, M., and Pfenninger, M. (2013). The Impact of Global Climate Change on Genetic Diversity within Populations and Species. Mol. Ecol. 22 (4), 925–946. doi:10.1111/mec.12152
Pereira, A. N., Márquez, A., Marin, M., and Marin, Y. (2009). Genetic evidence of two stocks of the whitemouth croakerMicropogonias furnieriin the Río de la Plata and oceanic front in Uruguay. J. Fish. Biol. 75 (2), 321–331. doi:10.1111/j.1095-8649.2009.02321.x
Prugnolle, F., and de Meeus, T. (2002). Inferring Sex-Biased Dispersal from Population Genetic Tools: a Review. Heredity 88 (3), 161–165. doi:10.1038/sj.hdy.6800060
Ray, N., Currat, M., and Excoffier, L. (2003). Intra-Deme Molecular Diversity in Spatially Expanding Populations. Mol. Biol. Evol. 20 (1), 76–86. doi:10.1093/molbev/msg009
Rodrigues, R., Schneider, H., Santos, S., Vallinoto, M., Sain-Paul, U., and Sampaio, I. (2008). Low Levels of Genetic Diversity Depicted from Mitochondrial DNA Sequences in a Heavily Exploited marine Fish (Cynoscion Acoupa, Sciaenidae) from the Northern Coast of Brazil. Genet. Mol. Biol. 31, 487–492. doi:10.1590/S1415-47572008000300015
Rogers, A. R., and Harpending, H. (1992). Population Growth Makes Waves in the Distribution of Pairwise Genetic Differences. Mol. Biol. Evol. 9 (3), 552–569. doi:10.1093/oxfordjournals.molbev.a040727
Ruzzante, D. E., Taggart, C. T., and Cook, D. (1998). A Nuclear DNA Basis for Shelf- and Bank-Scale Population Structure in Northwest Atlantic Cod (Gadus morhua): Labrador to Georges Bank. Mol. Ecol. 7 (12), 1663–1680. doi:10.1046/j.1365-294x.1998.00497.x
Ryman, N., Utter, F., and Laikre, L. (1995). Protection of Intraspecific Biodiversity of Exploited Fishes. Rev. Fish. Biol. Fish. 5 (4), 417–446. doi:10.1007/BF01103814
Salzburger, W., Ewing, G. B., and Von Haeseler, A. (2011). The Performance of Phylogenetic Algorithms in Estimating Haplotype Genealogies with Migration. Mol. Ecol. 20 (9), 1952–1963. doi:10.1111/j.1365-294X.2011.05066.x
Schneider, S., and Excoffier, L. (1999). Estimation of Past Demographic Parameters from the Distribution of Pairwise Differences when the Mutation Rates Vary Among Sites: Application to Human Mitochondrial DNA. Genetics 152 (3), 1079–1089. doi:10.1093/genetics/152.3.1079
Shulman, M. J., Ogden, J. C., Ebersole, J. P., McFarland, W. N., Miller, S. L., and Wolf, N. G. (1983). Priority Effects in the Recruitment of Juvenile Coral Reef Fishes. Ecology 64 (6), 1508–1513. doi:10.2307/1937505
Slatkin, M., and Hudson, R. R. (1991). Pairwise Comparisons of Mitochondrial DNA Sequences in Stable and Exponentially Growing Populations. Genetics 129 (2), 555–562. doi:10.1093/genetics/129.2.555
Tajima, F. (1989). Statistical Method for Testing the Neutral Mutation Hypothesis by DNA Polymorphism. Genetics 123 (3), 585–595. doi:10.1093/genetics/123.3.585
Turner, T. F., McPhee, M. V., Campbell, P., and Winemiller, K. O. (2004). Phylogeography and Intraspecific Genetic Variation of Prochilodontid Fishes Endemic to Rivers of Northern South America. J. Fish Biol. 64 (1), 186–201. doi:10.1111/j.1095-8649.2004.00299.x
Voris, H. K. (2000). Maps of Pleistocene Sea Levels in Southeast Asia: Shorelines, River Systems and Time Durations. J. Biogeogr. 27 (5), 1153–1167. doi:10.1046/j.1365-2699.2000.00489.x
Wang, L., Liu, S., Zhuang, Z., Guo, L., Meng, Z., and Lin, H. (2013). Population Genetic Studies Revealed Local Adaptation in a High Gene-Flow Marine Fish, the Small Yellow Croaker (Larimichthys Polyactis). Plos One 8 (12), e83493. doi:10.1371/journal.pone.0083493
Wang, P., and Sun, X. (1994). Last Glacial Maximum in China: Comparison between Land and Sea. CATENA 23 (3), 341–353. doi:10.1016/0341-8162(94)90077-9
Ward, R. D., Zemlak, T. S., Innes, B. H., Last, P. R., and Hebert, P. D. N. (2005). DNA Barcoding Australia's Fish Species. Phil. Trans. R. Soc. B 360 (1462), 1847–1857. doi:10.1098/rstb.2005.1716
Xu, L., Li, H., Wang, L., and Du, F. (2019). Genetic Structure and Haplotype Pattern of Marine Planktonic Ostracod (Porroecia Spinirostris) from South China Sea Based on Mitochondrial COI Gene. Ocean Sci. J. 54 (1), 107–116. doi:10.1007/s12601-018-0057-4
Zhang, D., Shao, Y., Su, T., and Jiang, S. (2007). The Sequence Analysis of Mitochondrial Cytochrome B Gene and Molecular Phylogeny of Parargyrops Edita. South China Fish. Sci. 3 (2), 1–7. doi:10.3969/j.issn.2095-0780.2007.02.001
Zhang, K., Cai, Y., Liao, B., Jiang, Y. e., Sun, M., Su, L., et al. (2020). Population Dynamics of Threadfin Porgy Evynnis Cardinalis , an Endangered Species on the IUCN Red List in the Beibu Gulf, South China Sea. J. Fish. Biol. 97 (2), 479–489. doi:10.1111/jfb.14398
Keywords: haplotype pattern, genetic differentiation, demographic expansion, COI, South China Sea
Citation: Xu L, Wang X, Wang L, Ning J, Li Y, Huang D, Liu S and Du F (2021) Threadfin Porgy (Evynnis Cardinalis) Haplotype Pattern and Genetic Structure in Beibu Gulf, South China Sea. Front. Environ. Sci. 9:726533. doi: 10.3389/fenvs.2021.726533
Received: 17 June 2021; Accepted: 02 August 2021;
Published: 10 August 2021.
Edited by:
Wei Wu, University of Southern Mississippi, United StatesReviewed by:
Qiuqi Lin, Jinan University, ChinaShuai-Ying Zhao, Yunnan Normal University, China
Mianrun Chen, South China Sea Institute of Planning and Environmental Research, China
Copyright © 2021 Xu, Wang, Wang, Ning, Li, Huang, Liu and Du. This is an open-access article distributed under the terms of the Creative Commons Attribution License (CC BY). The use, distribution or reproduction in other forums is permitted, provided the original author(s) and the copyright owner(s) are credited and that the original publication in this journal is cited, in accordance with accepted academic practice. No use, distribution or reproduction is permitted which does not comply with these terms.
*Correspondence: Feiyan Du, feyanegg@163.com