Impact of Short-Term Emission Control Measures on Air Quality in Nanjing During the Jiangsu Development Summit
 Haoran Zhang1
  Hong Liao
 Nan Li
- 1Jiangsu Key Laboratory of Atmospheric Environment Monitoring and Pollution Control, Jiangsu Collaborative Innovation Center of Atmospheric Environment and Equipment Technology, School of Environmental Science and Engineering, Nanjing University of Information Science and Technology, Nanjing, China
- 2Shanghai Key Laboratory of Atmospheric Particle Pollution and Prevention (LAP3), Shanghai, China
This study analyzed the effectiveness of temporary emission control measures on air quality of Nanjing, China during the Jiangsu Development Summit (JDS). We employed a regional chemistry model WRF-Chem to simulate air pollutants in Nanjing and compared the results to surface observations and satellite retrievals. During the JDS, air pollutant emissions from industry and transportation sectors largely decreased by 50–67% due to the short-term emission control measures such as reducing coal combustions, shutting down factories, and partially limiting traffic. Benefiting from the emission control, the simulated concentrations of PM2.5, NO2, SO2, CO and VOCs in Nanjing decreased by 17%, 20%, 20%, 19%, and 15% respectively, consistent with the surface and satellite observations. However, both the observed and simulated O3 increased by 3–48% during the JDS, which was mainly due to the remarkable NOx emission reduction (26%) in the downtown of Nanjing where the O3 production regime was mainly VOC-controlled. In addition, the atmospheric oxidation capacity and further the sulfur oxidation ratio, were facilitated by the elevated O3, which led to variable mitigation efficiencies of different secondary PM2.5 compositions. Our study offers an opportunity for understanding the coordinated control of PM2.5 and O3 in typical city clusters, and can provide implications for future mitigation actions.
Introduction
In past several years, China has been threatened by severe air pollution mainly resulted from fine particulate matter (PM2.5, aerodynamic diameter is less than 2.5 μm) and ozone (O3). High PM2.5 concentration can induce haze events Huang et al. (2014), Wang et al. (2016), Li et al.( 2019), and further reduce visibility Zhang et al. (2015), Chen et al. (2016), adversely affect human health Hu et al. (2017), Zhang et al. (2017) and climate change (Bond et al., 2013; IPCC, 2013). Compared to PM2.5, O3 is a kind of gaseous pollutant with great oxidation. The oxidation of O3 may make damage to crops or plants as well as increases the risk of pulmonary function damage (Tao et al., 2012).
In order to alleviate the PM2.5 and O3 pollution, the Chinese government enacted a stricter air quality standard in 2013, i.e. National Ambient Air Quality Standard (NAAQS, GB3095-2012). At the same time, the Chinese State Council also promulgated a series of long-term projects to improve air quality such as Air Pollution Prevention and Control Action Plan and Three-year Action Plan on Defending the Blue Sky (Zhai et al., 2019). These specific projects include desulfurization and denitration of flue gas, elimination of backward industry and ban on high-emission motor vehicles (Li et al., 2017; Tang et al., 2019; Zhang et al., 2019).
At the same time, short-term emergency emission controls were also applied during some important conferences or activities for ensuring air quality. For example the Asia-Pacific Economic Cooperation (APEC) summit in 2016, the summit for the Group of Twenty (G20) in 2016 and the 19th National Congress of the Communist Party of China (NCCPC) in 2017. These case studies suggested that temporary control measures were effective in improving air quality (Xu et al., 2017; Ansari et al., 2019; Wang et al., 2019; Ma et al., 2020; Zhang et al., 2020). However, the internal mechanisms of pollution reduction may still be complicated. For example, based on in-situ field measurements, Chang et al. (2020) pointed out that secondary aerosols significantly increased during the coronavirus disease (COVID-19) outbreak. Although the nationwide lockdown reduced primary emissions unprecedentedly. Haze episodes were even observed in Beijing (Huang et al., 2020).
In this study, we examined the effectiveness of a short-term emission control case during the Jiangsu Development Summit (JDS). JDS was held from 20 to 22, May 2017 in Nanjing, the capital of Jiangsu province, China. Source apportionment of PM2.5 is crucial to air pollution control. Numerous studies about source apportionment were conducted in east Aisa (Ge et al., 2017; Jain et al., 2017; Ye et al., 2017; Jain et al., 2020; Jain et al., 2021). Previous literatures identified that vehicles and industrial processes contributed considerable PM2.5 in urban regions of China and India. In this study, local emission profile revealed that vehicles and industrial processes contributed 84% of primary PM2.5 in Nanjing. Temporary emission control measures were implemented in Nanjing by reducing coal combustions, shutting down high-emission factories, prohibiting construction and partially limiting traffic, etc. In addition, cooperative emission reductions were also carried out by the neighboring cities. Overall, the aim of this study is: 1) to investigate the effects of emission control measures on air quality during the JDS; 2) to explore mechanisms that drive changes due to emission control measures. This study provided a detailed analysis of the effectiveness and mechanisms based on a classic short-term emission control case. The results provide insights into further mitigation of air pollution in other urban areas.
Materials and Methods
The study period was from 17 to May 22, 2017. Based on the bottom-up emission inventory, we categorized air pollutants into five sectors, i.e. industry, power, residential, transportation and agriculture. In terms of air pollutants, nine species were included, such as SO2, NOx (x = 1, 2), CO, ammonia (NH3), non-methane volatile organic compounds (NMVOCs), elemental carbon (EC), organic carbon (OC), PM2.5. The local government mainly controlled emissions by limiting transportation and industrial activities. Industrial activities contributed 63% of SO2 emission as well as 70% of VOCs emission. During JDS, a total of 116 key petrochemical, chemical, steel and other enterprises in Nanjing were reduced emissions by more than 50%. Meanwhile, the implementation of production restrictions or phased shutdown program was also conducted (Yan, 2019). The specific proportions of emission reductions are listed in Table 1. Emissions from industry and transportation sectors were decreased by 50–67% and 11–79% for various air pollutants. The reduction in primary emission was estimated based on the statistics by calculating the limited emission activities, which was obtained from the local government (Yan, 2019).
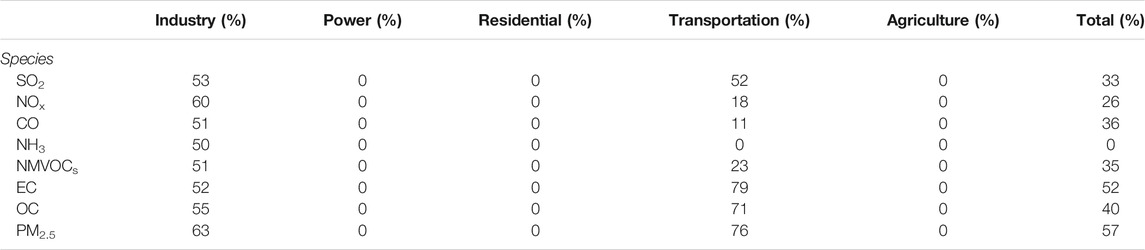
TABLE 1. Reductions of the air pollutant emissions in Nanjing during the First Jiangsu Development Summit.
To evaluate the effectiveness of short-term emission control measures, we obtained surface measurements (Surface Measurements) and satellite remote sensing products (Satellite retrievals) during the JDS and the spring (March, April and May 2017). The satellite retrievals contained the vertical column density (VCD) for gaseous species and the aerosol optical depth (AOD) for PM2.5. In this study, we referred spring to the normal period. The effects of emission control measures could be accessed by comparing the observations during the JDS and the normal period. In addition, we utilized Weather Research and Forecast coupled with Chemistry (WRF-Chem, WRF-Chem Model) model to quantitatively investigate the impacts and the internal mechanisms of short-term emission control measures.
Surface Measurements
The Chinese government has established a high spatio-temporal resolution air quality monitoring network since 2013. Data are available through the public website of the Ministry of Ecology and Environment of China (http://106.37.208.233:20035/). We collected hourly surface measurements of five criteria pollutants during the study period, including PM2.5, O3, NO2, SO2, and CO. In this study, we analyzed the records of nine monitoring sites in Nanjing. All monitoring sites in Nanjing are located in urban areas with the exception of the rural site, Pukou (PK). In addition to the surface observations of six criteria pollutants, we also obtained surface meteorological observations (http://www.meteomanz.com/) for temperature, relative humidity and wind vectors in Nanjing. More descriptions of these sites are provided in Supplementary Table S1. Geographical locations are also available in Supplementary Figure S1.
Satellite Retrievals
The satellite products used in this study include the VCD of gaseous species, i.e. SO2, NO2 and CO, as well as column AOD. The VCD profiles of CO were obtained from Infrared Atmospheric Sounding Interferometer (IASI, https://iasi.aeris-data.fr) based on the Metop-B satellite. AOD, SO2 and NO2 VCD were derived from The Ozone Monitoring Instrument (OMI) based on the Aura satellite Dobber et al. (2006), provided by NASA Goddard Earth Sciences Data and Information Services Center (GESDISC, https://urs.earthdata.nasa.gov). Detailed descriptions for satellite products are provided in Supplementary Table S2. These satellite retrievals have been optimized via the improved algorithms. For SO2, OMSO2003 was inversed on the basis of a principal component analysis (PCA) algorithm with more flexible Jacobians rather than a fixed factor or profile (Li et al., 2013; Li et al., 2017; Li et al., 2020). For NO2, this study selected the latest version of NO2 retrievals with the algorithm based on geometry-dependent surface Lambertian equivalent reflectivity (Lamsal et al., 2020). For AOD, the quality of the data was improved by (van den Oord et al., 2006). For CO, it was processed through the methods of Hurtmans et al. (Hurtmans et al., 2012).
WRF-Chem Model
WRF-Chem (v3.9.1) is an open-source regional chemical transport model (CTM) developed by the US National Center for Atmospheric Research (NCAR). WRF-Chem is capable of simulating air quality with fully coupled meteorology and chemistry (Grell et al., 2005). Initial and boundary meteorological conditions were derived from FNL reanalysis data (https://rda.ucar.edu/datasets/ds083.2/) by the National Centers for Environmental Prediction (NCEP). The anthropogenic emissions were based on the Multi-resolution Emission Inventory for China (MEIC, http://meicmodel.org/), which was developed by Tsinghua University (Li et al., 2017). Online biogenic and real-time biomass burning emissions were calculated from Model of Emissions of Gases and Aerosols from Nature (MEGAN, v2.1) tool (Guenther et al., 2006) and Fire INventory from NCAR (FINN, https://www2.acom.ucar.edu/modeling/finn-fire-inventory-ncar) respectively. WRF-Chem incorporates a variety of chemical parameterizations. We chose Statewide Air Pollution Research Center (SAPRC99) mechanism as the gas phase reaction scheme (Carter, 2000). SAPRC99 comprised 74 gases and 211 gaseous reactions. VOCs are lumped to describe O3 and SOA production processes. According to the previous studies, SAPRC showed superior performance in reproducing O3 and SOA concentrations (Li et al., 2011; Feng et al., 2016; Hu et al., 2016). Model for Simulating Aerosol Interactions and Chemistry (MOSAIC) was selected for the modeling of aerosols (Zaveri et al., 2008). MOSAIC places aerosol species, including sulfate (SO42-), nitrate (NO3−), ammonium (NH4+), EC, OC, sea salt (Na+ and Cl−) and other inorganic aerosol (OIN) into eight size bins (0.039–0.078, 0.078–0.156, 0.156–0.313, 0.313–0.625, 0.625–1.250, 1.250–2.500, 2.500–5.000 and 5.000–10.000 μm for dry diameter). We combined the mass concentrations of sea salt with OIN as the mass concentrations of dust. All aerosol species are assumed to be internally mixed within each size bin. Finally, the initial and boundary chemical conditions were determined by MOZART global model (Emmons et al., 2010).
The start date of the simulation was set on 15 May. The first 48 h was spin-up period. The domain of WRF-Chem model covers the Yangtze River Delta region (YRD, see Supplementary Figure S1A), with a horizontal resolution of 4 × 4 km. Vertically, 28 layers extended from the surface to a height of 50 hPa, with seven layers below the bottom 1 km (refer to the scale of planetary boundary layer). Details of the configuration of model are listed in Supplementary Table S3.
Results
Model Evaluation
We evaluated the model performance by comparing with surface meteorology and air pollutant observations, as well as satellite products. Comprehensive comparisons between observations and simulations are shown in Table 2. We adopted three statistical indexes, i.e. the index of agreement (IOA, varies from 0 to 1), the normalized mean bias (NMB, varies from −1 to +∞) and the root mean square error (RMSE, varies from 0 to +∞), to describe the performance of the model in simulating surface species. The equations for the calculations of these statistics are shown in Eqs 1–3, where s, o, C and N indicates the simulation, observation, concentration and total number of samples, respectively.
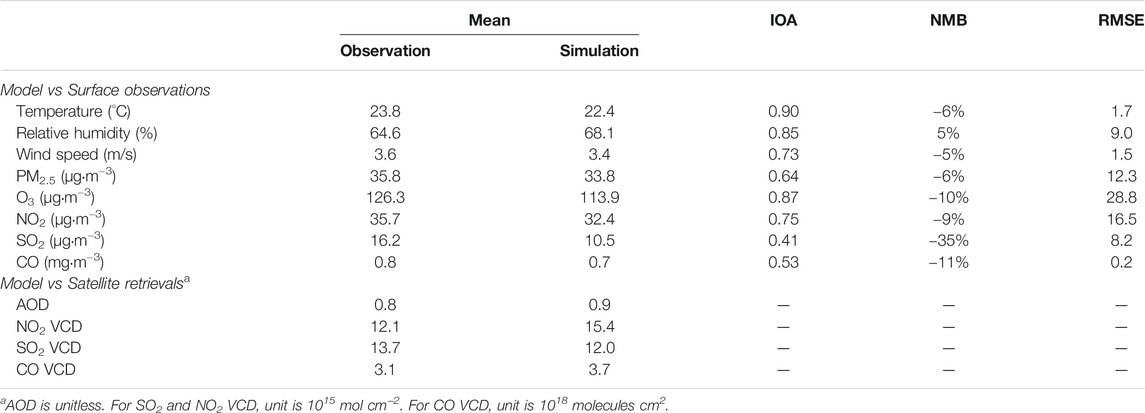
TABLE 2. The comparison between simulations against surface observations or satellite retrievals.
Meteorology
Firstly, we examined the agreement between observation and simulation in terms of meteorological parameters. The time series diagrams for temperature, relative humidity, wind direction and wind speed are shown in Figure 1. The average of the observed temperature, relative humidity and wind speed during the study period was 23.8°C, 64.6% and 3.6 m/s, respectively. The leading wind came from the southeast. WRF-Chem successfully captured both the magnitude and the varying trends for these meteorological parameters in general. Among these three meteorological parameters, the temperature had a maximum IOA, with the value is 0.9. Meanwhile, the NMB for all meteorological parameters were less than ±10%, emphasizing that WRF-Chem is capable to reproduce weather conditions. Precise simulated meteorology is crucial to reflect the real vertical diffusion and horizontal advection.
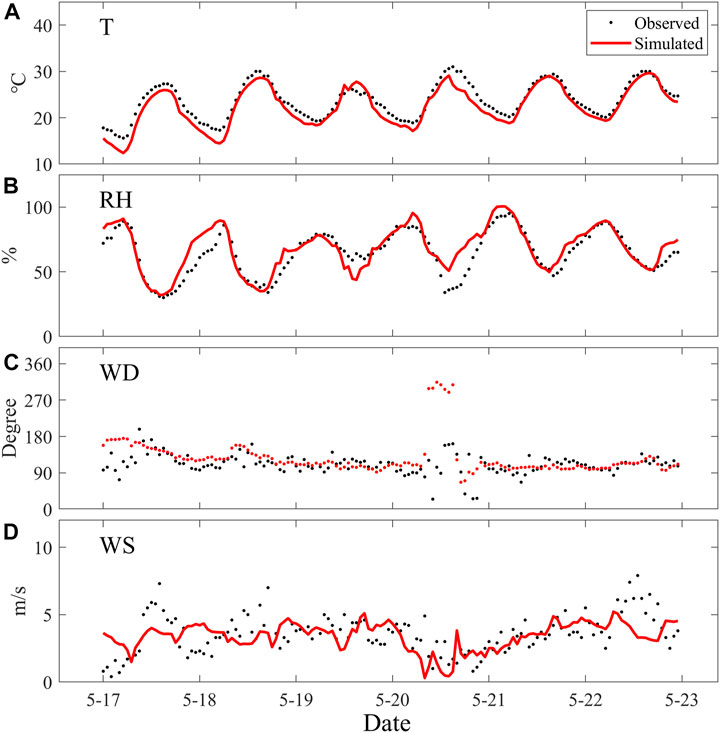
FIGURE 1. The time series variations of simulated and observed surface meterological parameters, including (A) temperature, (B) relative humidity, (C) wind direction and (D) wind speed (WS), during the study period.
Chemistry
Figure 2 illustrates the comparison between the simulated chemical species and the observed ones, including PM2.5, O3, NO2, SO2 and CO. The mean observation for these species was 35.8 μg m−3, 126.3 μg m−3, 35.7 μg m−3, 16.2 μg m−3 and 0.8 mg m−3 respectively. As Table 2 shown, all the chemical species were well predicted except for SO2, with a range of IOA from 0.53 (CO) to 0.87 (O3). The corresponding NMB varies from -11% (CO) to -6% (PM2.5). In addition, the diurnal patterns of two typical photochemical products (i.e. O3 and NO2) were also successfully simulated by model (Supplementary Figure S2).
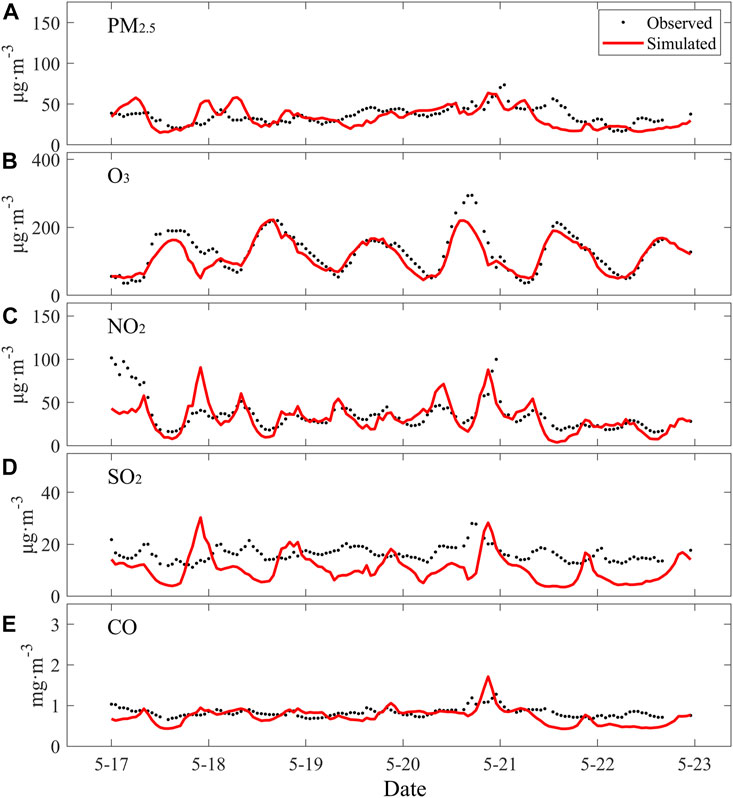
FIGURE 2. The same as Figure 1, but for air pollutants including (A) PM2.5, (B) O3(C) NO2, (D) SO2 and (E) CO.
Satellite Products
We also compared VCDs and AOD between the satellite retrievals and the model simulations. In WRF-Chem, the AOD properties were calculated at wavelengths of 300, 400, 600, and 999 nm. However, we adopted the OMI AOD products at a wavelength of 500 nm. Thus the simulated AOD at 500 nm should be derived from the simulated AOD at 300, 600, 999 nm based on the Ångström power law, see Eq. (4). (Kumar et al., 2014). In Eq. (4), A, λ and α denotes AOD, wavelength and Ångström exponent respectively. The calculation for α followed Eq. (5).
The comparisons between simulated and observed VCDs are provided in Table 2. The mean inversed VCD of NO2, SO2 and CO based on satellite remote sensing was 12.1×10¹⁵ molecules·cm−2, 13.7×10¹⁵ molecules·cm−2 and 3.1×10¹⁸ molecules·cm−2, respectively. For AOD, the mean value was 0.8. Model simulations were in good agreement with satellite retrievals in terms of magnitude. It was highlighted that WRF-Chem was capable to simulate reliable vertical diffusion as well.
Air Quality Improvement During the JDS
The corresponding diffusion condition of JDS was close to that in Spring because there was no obvious special weather process such as gale or precipitation during JDS. The seasonal mean concentrations could indicate the representative level of air pollutants. To evaluate the effectiveness short-term control measures, our study therefore compared the seasonal mean concentration and the average during JDS in terms of both surface concentrations and satellite retrievals. Figure 3 compares the air quality in Nanjing during the JDS control period and the spring of the same year. For surface observations, PM2.5, NO2, SO2 and CO posed a decreasing trend during the control period (Figure 3A–D). PM2.5, NO2, SO2 and CO decreased from 41.5 to 35.8 μg m−3 (14%), from 50.2 to 35.7 μg m−3 (29%), from 17.9 to 16.2 μg m−3 (9%) and from 1.1 to 0.8 mg m−3 (24%) respectively. The unifying declines indicated that short-term emission control measures were effective, particularly for NO2. However, O3 showed an increase. The mean 8h-O3 concentration during the JDS was 193.6 μg m−3, which was 48% higher than the seasonal mean value in spring (Figure 3E). We also assessed the air quality improvements from the perspective of satellite. As Figure 3F–I shown, AOD and gaseous VCD presented a decline of 3–29% which also can be attributed to the massive reduction of ground emissions.
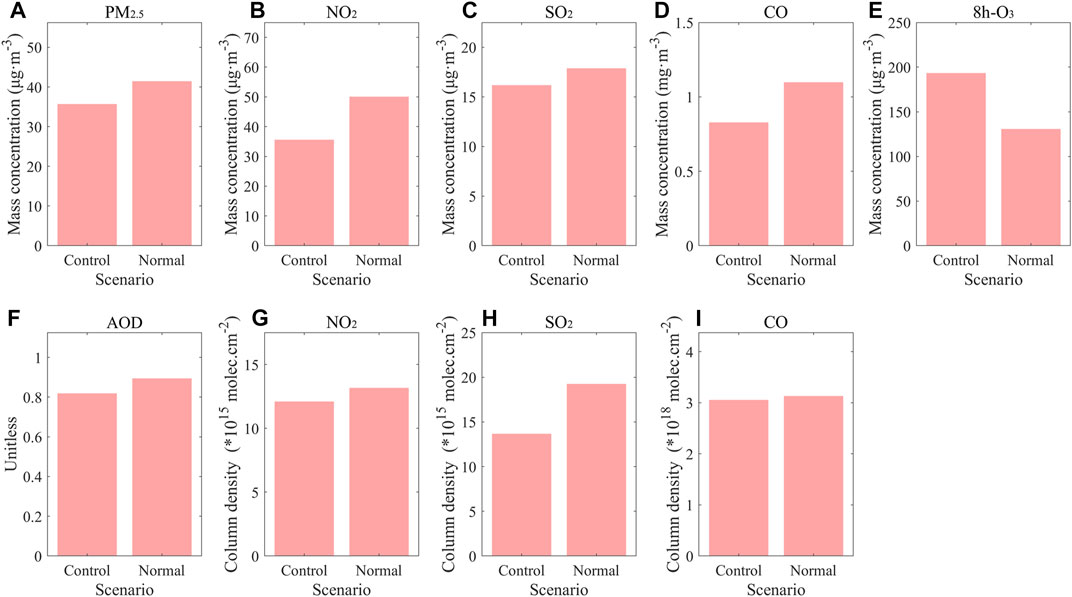
FIGURE 3. The comparison of during control period vs. normal period (spring) for surface observations (A–C) and satellite retrievals (F–I).
Impacts of the Short-Term Measures During the JDS
Five Criteria Air Pollutants and VOCs
We conducted two sensitivity simulations to assess the effectiveness of short-term emission control measures on the air quality during the JDS, emission control scenario (considering the emission control as shown in Table 1) and non-control scenario (none emission control). As shown in Figure 4, the concentrations of SO2, NO2, CO and VOCs decreased by 15–20% as the result of the emission control measures. The decrease in those four species could be explained by the reduction of emissions in transportation (11–52%) and industrial activities (51–60%). Especially for SO2, the strict control measures in industry, which was dominant source, induced 20% decline in its concentration. NO2 shows the highest mitigation efficiency. The 26% decline in NOx emissions resulted in a 20% decrease in NO2 concentrations. VOCs was the most difficult species to control, for which a 35% emission reduction only led to a 15% decrease in concentration. Similarly, PM2.5 concentration was reduced by 17% due to the emission control of its precursors, however, the magnitude of the PM2.5 decrease was relatively smaller compared to its precursors. The day-to-day variation of meteorology conduced the variations in air pollutant concentrations. We summarized the daily average of meteorological parameters in Supplementary Table S4. The variations of meteorological parameters, especially for the wind speed, determined the advection condition and further contributed to the difference in the pollutants from day to day. Unlike these air pollutants, the concentration of O3 slightly increased by ∼3% due to the impacts of emission reduction measures. The increase in O3 can be attributed by its nonlinear formation regime affected by NOx and VOCs (Wang et al., 2017). This evidence suggested that it was difficult to mitigate O3 pollution via current emission control measures. More effective controls should be considered for preventing photochemical pollution. The detailed differences in concentration between two scenarios and their relative changes are summarized in Supplementary Table S51.
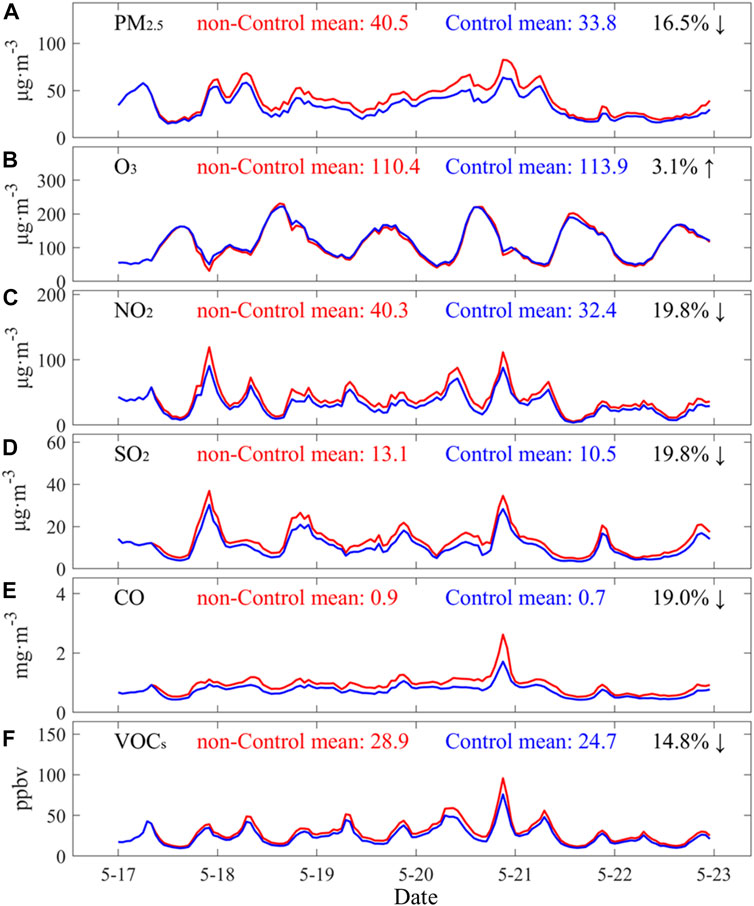
FIGURE 4. The time series variations of simulated chemical species in control and non-Control scenario, including (A) PM2.5, (B) O3, (C), NO2, (D) SO2, (E) CO2 and (F) VOCs.
Aerosol Compositions
We further analyzed the changes of each aerosol composition in the sensitivity simulations. As shown in Figure 5, we classified six types of aerosol species, including SO42-, NO3−, NH4+, organic aerosol (OA), EC and dust. Here the OA was inferred based on OC multiplied by an empirical ratio of 1.4 (Seinfeld and Pandis, 2006). In the case of implementing emission control measures, the secondary inorganic aerosol containing sulfate, nitrate and ammonium (SNA) contributed almost 80% of the total concentration of PM2.5. NO3− was the dominant chemical component of the SNA. The mean simulated nitrate concentration was 11.3 μg m−3, approximately occupied 43% of the SNA. On the other hand, EC accounted for the least fraction of PM2.5 (less than 3%).
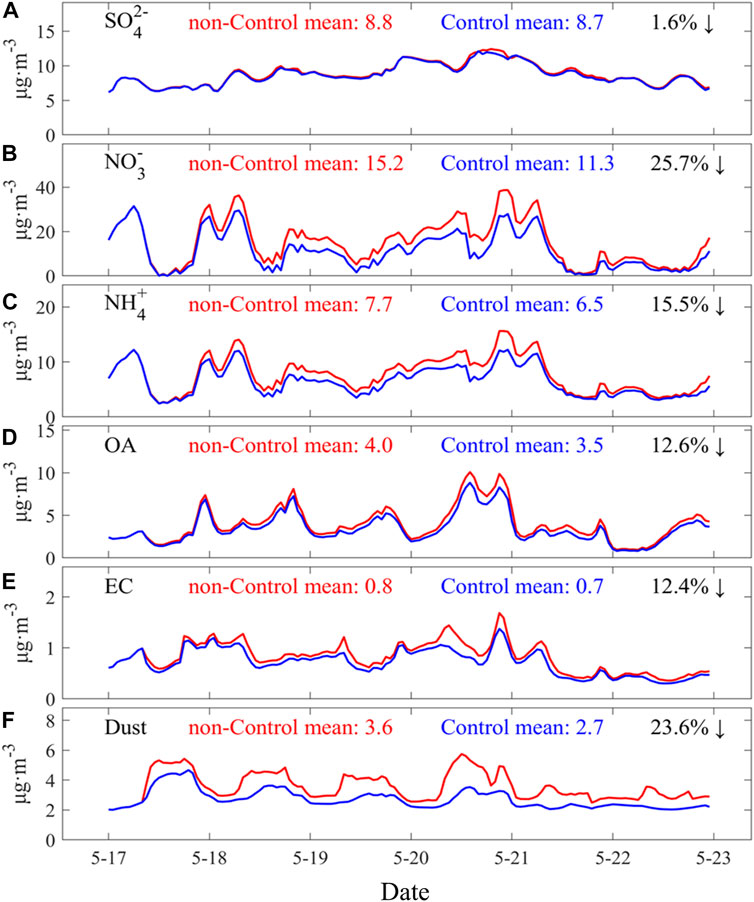
FIGURE 5. The same as Figure 4, but for acrosal compositions (A) SO42−, (B) NO3−, (C) NH4+, (D) OA, (E) EC and (F) Dust.
All these aerosol compositions showed a decline due to the control measures. The unifying decrease of PM2.5 concentration occurred serval hours later after the emission reduction pattern, indicating that the short-term control may not have an immediate effect on PM2.5. However the reduction in primary components such as EC and dust come earlier. The secondary components tend to have a lag of several hours in the decline of concentration due to the chemical processes. Dust and NO3− decreased most significantly among all PM2.5 compositions. Dust decreased by 24% owing to the short-term emission control such as banning construction. NO3− decreased by about 26%, which was attributed to the tremendous reduction of the precursor NOx. Compared to NO3−, the other two SNA, SO42- and NH4+, only decreased by 2 and 16%. Particularly for SO42-, the absolute decline in mass concentration under control was less than 0.1 μg m−3.
Discussion
Mechanisms of O3 Pollution Episode
O3 is the main pollutant during the study period. The maximum hourly concentration of the observed O3 was 294 μg m−3 (20 May), which far exceeded 200 μg m−3 (NAAQS level Ⅱ). The peak of O3 concentration tended to occur between 14:00 and 18:00 (local time, Supplementary Figure S2). This type of serious O3 pollution episode could be explained from the following two factors. One was the influences of weather conditions. During the periods of, the weather conditions were characterized as higher temperature and lower relative humidity. The mean temperature and relative humidity observed during O3 pollution episodes was 28°C and 46%, which is extremely favorable for the production of O3 (Liu and Wang, 2020).
The other cause related to the non-linear production regime of O3. Figure 6 illustrates the spatial changes of O3 (g-i) and its precursors NOx and VOCs (a-f). As shown in Figure 6A–B, the spatial high concentrations of NOx occurred along with the Yangtze River. This could reflect the spatial distribution pattern of transportation emissions, such as shipping and motor vehicles. For VOCs, the regional high concentrations tended to exist in the central of Jiangsu province. The emission control measures taken in Nanjing and its neighboring cities induced both NOx and VOCs spatially decease by 1.2 ppbv and 0.9 ppbv respectively. Meanwhile, the decrease was more significant in Nanjing. The decrease in NOx was more dramatic in terms of specific concentrations (Figure 6C–F). The control strategy about NOx and VOCs contributed to an increase in O3 concentration, particularly in the coastal regions and the southern areas of Jiangsu Province.
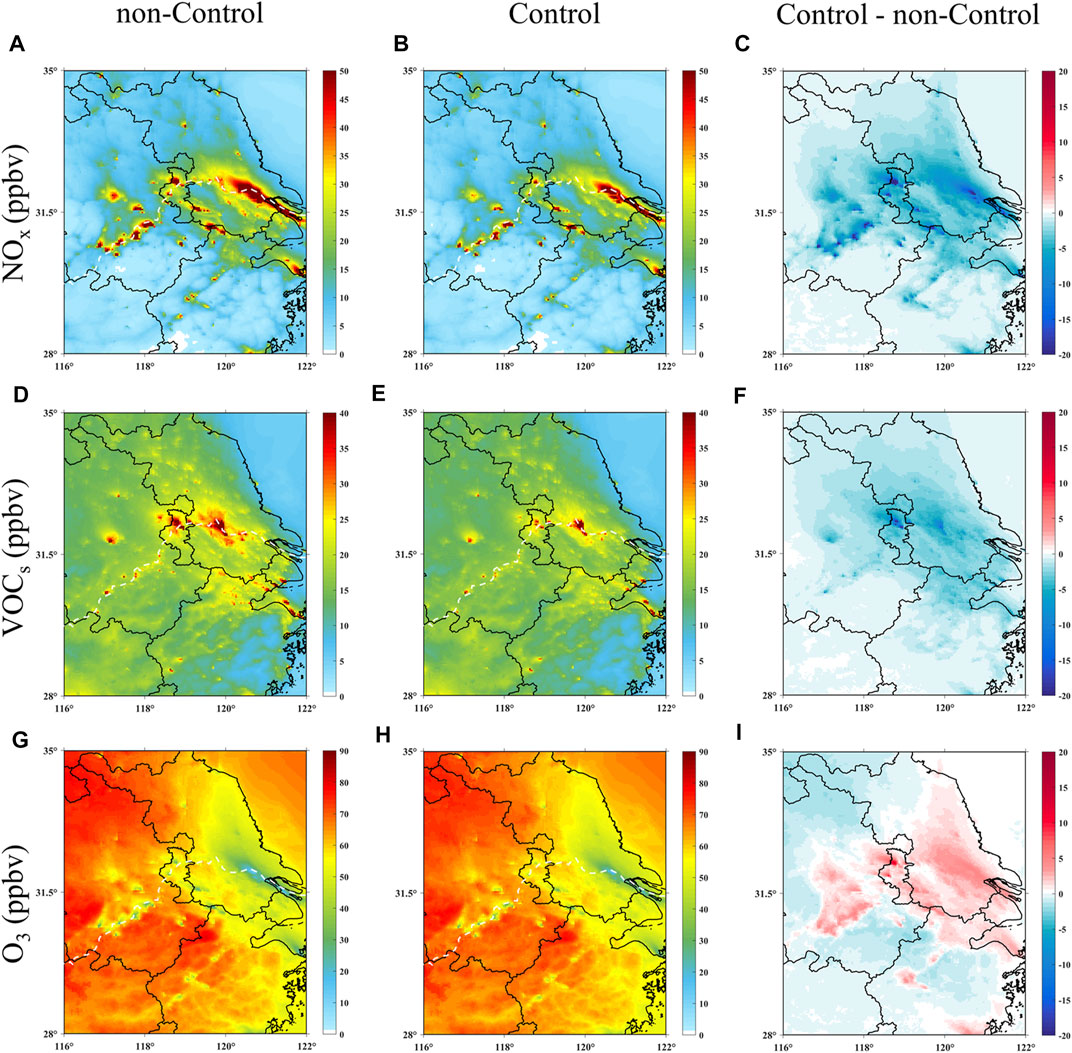
FIGURE 6. The spatial distribution of the simulated (A–C) NOx, (D–F) VOCs and (G–I) O3 in the non-Control or Control scenarios and their differences.
We applied an indicator method to further infer the O3 production regime. Ozone production efficiency (OPE) is one of the most useful indicators. OPE is defined as the ratio of ΔO3 to ΔNOz. NOz consists of nitrogenous compounds excluding NOx, such as HONO, HNO3, HO2NO2, N2O5, NO3, peroxy acetyl nitrate (PAN) and other organic nitrates. OPE is derived from the slope of the regression between O3 and NOz. It denotes the mean number of O3 molecules produced when a NO2 molecule is oxidized to be a NOz species. NOz therefore has a good linear correlation with O3. The O3 production regime is under VOCs-controlled in the case of OPE is less than 4. On the contrary, NOx is the predominant species of O3 formation if OPE is more than 7. The other OPE values between 4 and seven are correspond to the mixed-controlled status (Wang et al., 2017). Supplementary Figure S3 shows the scatter plots of O3 versus NOz based on the simulated results in Nanjing urban sites during the peak time of O3 formation. The OPE values in non-control and control scenarios were 3.76 and 3.42, respectively, highlighting that the O3 formation regime in urban areas of Nanjing was under VOCs-controlled, consistent with previous studies (Jin and Holloway, 2015; Wang et al., 2017; Li et al., 2018).
Aerosol Chemistry in PM2.5 Reduction
Previous simulations have confirmed that the emission control measures during the JDS reduced SO2 concentration by 20% but reduced SO42- by only 2%. This phenomenon could be one of the side effects of the elevated O3 (Figure 7B). First, sulfuric acid (H2SO4) has stronger capacity to neutralize NH3 compared with HNO3, which ensures that the production of (NH4)2SO4 or NH4HSO4 is prior to that of NH4NO3 (Seinfeld and Pandis, 2006). In addition, the universal increase in O3 across the YRD region induced stronger atmospheric oxidation capacity (AOC), and further facilitated SO2 to produce H2SO4 more efficiently. Subsequently, the efficiency of SO42- production was enhanced. To quantify the efficiency of SO42- production, we adopted sulfur oxidation ratio (SOR) as Eq. (6).
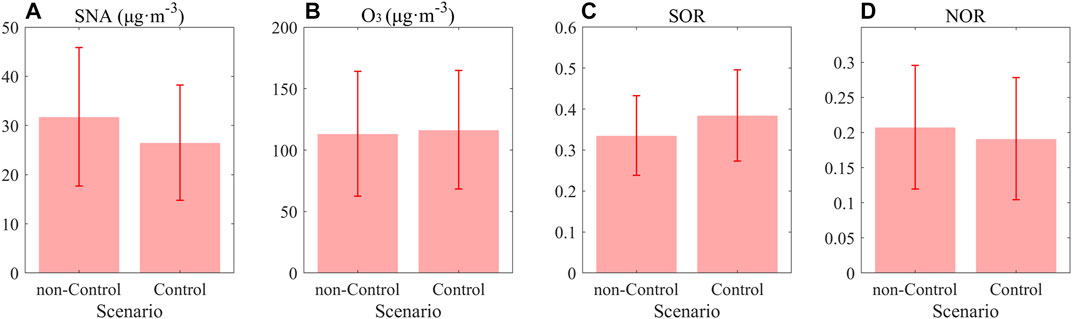
FIGURE 7. The comparison between in non-Control scenario versus Control for (A) SNA concentration, (B) O3 concentration, (C) SOR and (D) NOR.
The n in Eq. (6) stands for mole concentration (unit: mole). As shown in Figure 7C, the SOR in the control scenario was 0.38, 15% higher than that in the non-control scenario. The increased SO42- yields almost offset the impacts of SO2 concentration reduction. The similar results were also found in previous observational or modeling studies focusing on the COVID-19 (Chang et al., 2020; Huang et al., 2020; Le et al., 2020; Liu et al., 2021).
However, the efficiency of NO3− production could be relatively reduced. As shown in Figure 7D, the nitrogen oxidation ratio (NOR, which as defined in Eq. (7)) decreased by 8% owing to the emission control measures. The NOR was not promoted even though the ambient atmosphere was more oxidizing. This could be related to the limited concentration of NH3. According to the emission control measures, NH3 concentration held still in two scenarios. By calculating the mole ratio of total NH4+ to net SO42- and NO3− (PNR), we can assess whether or not the ambient NH3 is sufficient to neutralize all H2SO4 and HNO3. The calculation of the PNR followed Eq. (8). The simulated PNR was 0.23, much less than 1, indicating that ambient conditions in Nanjing are expected to be ammonia-poor (Yin et al., 2018). As the result, the more efficient SO42- production did impose negative impacts on the formation of NO3− because of the competitive relationship. Both the decrease of NOx concentration and the NO3− formation efficiency led to a significant decrease of 26% in NO3−.
Implications for Future Control Strategy
In this study, the emission control measures during the JDS are proved to be effective for aerosol mitigation but invalid for O3. The short-term control strategies during JDS reduced more NOx. Based on the nonlinear O3 formation regime, the decrease in NOx probably may fail to suppress O3 formation and even promote O3 concentrations under VOCs-controlled condition. To alleviate O3 pollution, we need a more reasonable ratio to reduce NOx and VOCs. In addition, the control of VOCs is another difficulty. Model results indicated that VOCs have the lowest mitigation efficiency. A more detailed plan for the reduction of VOCs should be taken into account on the basis of both their accurate local source profile and ozone formation potential (OFP) (Wu and Xie, 2017). It is also noted that secondary transformation as a result of elevated O3 can compensate for the reduction of PM2.5. If the offset effects due to worsen O3 are strong enough, the reduction of PM2.5 is likely to be ineffective such as the unexpected haze event during COVID-19. This enhancement in O3 was also witnessed in Europe and India during the COVID-19 outbreak Mertens et al. (2021), Zhang et al. (2021) which tends to be several months. Our study illustrated the similar internal mechanisms in O3 formation through the short-term case, and provided an insight for improving the understanding in secondary pollution episodes.
At the same time, Li et al. pointed out that PM2.5 can indirectly influence O3 formation through radical chemistry and photochemistry as well (Li et al., 2019b; Li et al., 2019c). There is therefore a complicated interaction between PM2.5 and O3. This interaction calls for a more synergistic strategy for both controlling PM2.5 and O3.
Conclusion
This study investigated the variations of air pollutants during the JDS with observations from surface monitors and satellite retrievals, and then examined the effectiveness of the short-term emission control measures using WRF-Chem. Results showed that the short-term emission control measures could effectively reduce the concentrations of NO2, SO2, CO, VOCs and PM2.5, but failed to suppress the O3 level. During the JDS, the surface concentrations of NO2, SO2, CO and VOCs decreased by 20%, 20%, 19% and 15% due to the control measures. In terms of PM2.5, the total concentration was reduced by 17%, but the different aerosol compositions show variable mitigation efficiency (2–26%) because of changes of AOC and competition for ammonia. For O3, OPE analysis showed urban areas of Nanjing was under VOC-limited. Thus 26% NOx reduction and 35% VOCs reduction in emissions led to an increasement of 3% for O3 concentration. Our study is important for understanding the coordinated control of PM2.5 and O3 in typical city clusters, and can provide useful information for future mitigation actions.
Data Availability Statement
The original contributions presented in the study are included in the article/Supplementary Material, further inquiries can be directed to the corresponding author.
Author Contributions
Data curation, model simulation, visualization and writing-original draft preparation, HZ and KT; Supervision, funding acquisition, writing-review and editing, NL and HL; Data curation, FW and XY. All authors have read and agreed to the published version of the manuscript.
Funding
This work was supported by the National Key Research and Development Program of China (2019YFA0606804), the National Natural Science Foundation of China (41975171), the Major Research Plan of the National Social Science Foundation (18ZDA052) and Opening Project of Shanghai Key Laboratory of Atmospheric Particle Pollution and Prevention (LAP3) (FDLAP17003).
Conflict of Interest
The authors declare that the research was conducted in the absence of any commercial or financial relationships that could be construed as a potential conflict of interest.
Publisher’s Note
All claims expressed in this article are solely those of the authors and do not necessarily represent those of their affiliated organizations, or those of the publisher, the editors and the reviewers. Any product that may be evaluated in this article, or claim that may be made by its manufacturer, is not guaranteed or endorsed by the publisher.
Acknowledgments
The numerical calculations in this paper have been done on the supercomputing system in the Supercomputing Center of Nanjing University of Information Science and Technology.
Supplementary Material
The Supplementary Material for this article can be found online at: https://www.frontiersin.org/articles/10.3389/fenvs.2021.693513/full#supplementary-material
References
Ansari, T. U., Wild, O., Li, J., Yang, T., Xu, W., Sun, Y., et al. (2019). Effectiveness of Short-Term Air Quality Emission Controls: A High-Resolution Model Study of Beijing during the Asia-Pacific Economic Cooperation (APEC) summit Period. Atmos. Chem. Phys. 19 (13), 8651–8668. doi:10.5194/acp-19-8651-2019
Bond, T. C., Doherty, S. J., Fahey, D. W., Forster, P. M., Berntsen, T., DeAngelo, B. J., et al. (2013). Bounding the Role of Black Carbon in the Climate System: A Scientific Assessment. J. Geophys. Res. Atmos. 118 (11), 5380–5552. doi:10.1002/jgrd.50171
Carter, W. P. L. (2000). Documentation of the SAPRC-99 Chemical Mechanism for VOC Reactivity Assessment. Report to the California Air Resources Board, Contract 92-329. 95-308.
Chang, Y., Huang, R. J., Ge, X., Huang, X., Hu, J., Duan, Y., et al. (2020). Puzzling Haze Events in China during the Coronavirus (COVID‐19) Shutdown. Geophys. Res. Lett. 47 (12), e2020GL088533. doi:10.1029/2020gl088533
Chen, W., Wang, X., Zhou, S., Cohen, J. B., Zhang, J., Wang, Y., et al. (2016). Chemical Composition of PM2.5 and its Impact on Visibility in Guangzhou, Southern China. Aerosol Air Qual. Res. 16, 2349–2361. doi:10.4209/aaqr.2016.02.0059
Dobber, M. R., Dirksen, R. J., Levelt, P. F., van den Oord, G. H. J., Voors, R. H. M., Kleipool, Q., et al. (2006). Ozone Monitoring Instrument Calibration. IEEE Trans. Geosci. Remote Sensing 44 (5), 1209–1238. doi:10.1109/tgrs.2006.869987
Emmons, L. K., Walters, S., Hess, P. G., Lamarque, J.-F., Pfister, G. G., Fillmore, D., et al. (2010). Description and Evaluation of the Model for Ozone and Related Chemical Tracers, Version 4 (MOZART-4). Geosci. Model. Dev. 3 (1), 43–67. doi:10.5194/gmd-3-43-2010
Feng, T., Li, G., Cao, J., Bei, N., Shen, Z., Zhou, W., et al. (2016). Simulations of Organic Aerosol Concentrations During Springtime in the Guanzhong Basin, China. Atmos. Chem. Phys. 16 (15), 10045–10061. doi:10.5194/acp-16-10045-2016
Ge, X., Li, L., Chen, Y., Chen, H., Wu, D., Wang, J., et al. (2017). Aerosol Characteristics and Sources in Yangzhou, China Resolved by Offline Aerosol Mass Spectrometry and Other Techniques. Environ. Pollut. 225, 74–85. doi:10.1016/j.envpol.2017.03.044
Grell, G. A., Peckham, S. E., Schmitz, R., McKeen, S. A., Frost, G., Skamarock, W. C., et al. (2005). Fully Coupled “Online” Chemistry within the WRF Model. Atmos. Environ. 39 (37), 6957–6975. doi:10.1016/j.atmosenv.2005.04.027
Guenther, A., Karl, T., Harley, P., Wiedinmyer, C., Palmer, P. I., and Geron, C. (2006). Estimates of Global Terrestrial Isoprene Emissions Using MEGAN (Model of Emissions of Gases and Aerosols from Nature). Atmos. Chem. Phys. 6, 3181–3210.
Hu, J., Chen, J., Ying, Q., and Zhang, H. (2016). One-Year Simulation of Ozone and Particulate Matter in China Using WRF/CMAQ Modeling System. Atmos. Chem. Phys. 16 (16), 10333–10350. doi:10.5194/acp-16-10333-2016
Hu, J., Huang, L., Chen, M., Liao, H., Zhang, H., Wang, S., et al. (2017). Premature Mortality Attributable to Particulate Matter in China: Source Contributions and Responses to Reductions. Environ. Sci. Technol. 51 (17), 9950–9959. doi:10.1021/acs.est.7b03193
Huang, R.-J., Zhang, Y., Bozzetti, C., Ho, K.-F., Cao, J.-J., Han, Y., et al. (2014). High Secondary Aerosol Contribution to Particulate Pollution During Haze Events in China. Nature 514 (7521), 218–222. doi:10.1038/nature13774
Huang, X., Ding, A., Gao, J., Zheng, B., Zhou, D., Qi, X., et al. (2020). Enhanced Secondary Pollution Offset Reduction of Primary Emissions During COVID-19 Lockdown in China. Nat. Sci. Rev. 8, nwaa137. doi:10.1093/nsr/nwaa137
Hurtmans, D., Coheur, P.-F., Wespes, C., Clarisse, L., Scharf, O., Clerbaux, C., et al. (2012). FORLI Radiative Transfer and Retrieval Code for IASI. J. Quantitative Spectrosc. Radiative Transfer 113 (11), 1391–1408. doi:10.1016/j.jqsrt.2012.02.036
IPCC (2013). Climate Change 2013: The Physical Science Basis. United Kingdom and New York, NY, USA: Cambridge University Press.
Jain, S., Sharma, S. K., Choudhary, N., Masiwal, R., Saxena, M., Sharma, A., et al. (2017). Chemical Characteristics and Source Apportionment of PM2.5 Using PCA/APCS, UNMIX, and PMF at an Urban Site of Delhi, India. Environ. Sci. Pollut. Res. 24 (17), 14637–14656. doi:10.1007/s11356-017-8925-5
Jain, S., Sharma, S. K., Vijayan, N., and Mandal, T. K. (2020). Seasonal Characteristics of Aerosols (PM2.5 and PM10) and Their Source Apportionment Using PMF: A Four Year Study over Delhi, India. Environ. Pollut. 262, 114337. doi:10.1016/j.envpol.2020.114337
Jain, S., Sharma, S. K., Srivastava, M. K., Chatterjee, A., Vijayan, N., Tripathy, S. S., et al. (2021). Chemical Characterization, Source Apportionment and Transport Pathways of PM2.5 and PM10 over Indo Gangetic Plain of India. Urban Clim. 36, 100805. doi:10.1016/j.uclim.2021.100805
Jin, X., and Holloway, T. (2015). Spatial and Temporal Variability of Ozone Sensitivity Over China Observed from the Ozone Monitoring Instrument. J. Geophys. Res. Atmos. 120 (14), 7229–7246. doi:10.1002/2015jd023250
Kumar, R., Barth, M. C., Pfister, G. G., Naja, M., and Brasseur, G. P. (2014). WRF-Chem Simulations of a Typical Pre-Monsoon Dust Storm in Northern India: Influences on Aerosol Optical Properties and Radiation Budget. Atmos. Chem. Phys. 14 (5), 2431–2446. doi:10.5194/acp-14-2431-2014
Lamsal, L. N., Krotkov, N. A., Vasilkov, A., Marchenko, S., Qin, W., Yang, E.-S., et al. (2020). OMI/Aura Nitrogen Dioxide Standard Product with Improved Surface and Cloud Treatments. Atmos. Meas. Tech. Discuss. 2020, 1–56. doi:10.5194/amt-2020-200
Le, T., Wang, Y., Liu, L., Yang, J., Yung, Y. L., Li, G., et al. (2020). Unexpected Air Pollution with Marked Emission Reductions During the COVID-19 Outbreak in China. Science 369, 702–706. doi:10.1126/science.abb7431
Li, G., Zavala, M., Lei, W., Tsimpidi, A. P., Karydis, V. A., Pandis, S. N., et al. (2011). Simulations of Organic Aerosol Concentrations in Mexico City Using the WRF-CHEM Model during the MCMA-2006/MILAGRO Campaign. Atmos. Chem. Phys. 11 (8), 3789–3809. doi:10.5194/acp-11-3789-2011
Li, C., Joiner, J., Krotkov, N. A., and Bhartia, P. K. (2013). A Fast and Sensitive New Satellite SO2retrieval Algorithm Based on Principal Component Analysis: Application to the Ozone Monitoring Instrument. Geophys. Res. Lett. 40 (23), 6314–6318. doi:10.1002/2013gl058134
Li, C., Krotkov, N. A., Carn, S., Zhang, Y., Spurr, R. J. D., and Joiner, J. (2017a). New-generation NASA Aura Ozone Monitoring Instrument (OMI) Volcanic SO2 Dataset: Algorithm Description, Initial Results, and Continuation with the Suomi-NPP Ozone Mapping and Profiler Suite (OMPS). Atmos. Meas. Tech. 10 (2), 445–458. doi:10.5194/amt-10-445-2017
Li, M., Liu, H., Geng, G., Hong, C., Liu, F., Song, Y., et al. (2017b). Anthropogenic Emission Inventories in China: A Review. Natl. Sci. Rev. 4 (6), 834–866. doi:10.1093/nsr/nwx150
Li, N., He, Q., Greenberg, J., Guenther, A., Li, J., Cao, J., et al. (2018). Impacts of Biogenic and Anthropogenic Emissions on Summertime Ozone Formation in the Guanzhong Basin, China. Atmos. Chem. Phys. 18 (10), 7489–7507. doi:10.5194/acp-18-7489-2018
Li, J., Liao, H., Hu, J., and Li, N. (2019a). Severe Particulate Pollution Days in China during 2013-2018 and the Associated Typical Weather Patterns in Beijing-Tianjin-Hebei and the Yangtze River Delta Regions. Environ. Pollut. 248, 74–81. doi:10.1016/j.envpol.2019.01.124
Li, K., Jacob, D. J., Liao, H., Shen, L., Zhang, Q., and Bates, K. H. (2019b). Anthropogenic Drivers of 2013-2017 Trends in Summer Surface Ozone in China. Proc. Natl. Acad. Sci. USA 116 (2), 422–427. doi:10.1073/pnas.1812168116
Li, K., Jacob, D. J., Liao, H., Zhu, J., Shah, V., Shen, L., et al. (2019c). A Two-Pollutant Strategy for Improving Ozone and Particulate Air Quality in China. Nat. Geosci. 12, 906–910. doi:10.1038/s41561-019-0464-x
Li, C., Krotkov, N. A., Leonard, P. J. T., Carn, S., Joiner, J., Spurr, R. J. D., et al. (2020). Version 2 Ozone Monitoring Instrument SO2 Product (OMSO2 V2): New Anthropogenic SO2 Vertical Column Density Dataset. Atmos. Meas. Tech. 13 (11), 6175–6191. doi:10.5194/amt-13-6175-2020
Liu, Y., and Wang, T. (2020). Worsening Urban Ozone Pollution in China from 2013 to 2017 - Part 1: The Complex and Varying Roles of Meteorology. Atmos. Chem. Phys. 20 (11), 6305–6321. doi:10.5194/acp-20-6305-2020
Liu, L., Zhang, J., Du, R., Teng, X., Hu, R., Yuan, Q., et al. (2021). Chemistry of Atmospheric Fine Particles During the COVID‐19 Pandemic in a Megacity of Eastern China. Geophys. Res. Lett. 48 (2), 2020GL091611. doi:10.1029/2020gl091611
Ma, Y., Fu, T.-M., Tian, H., Gao, J., Hu, M., Guo, J., et al. (2020). Emergency Response Measures to Alleviate a Severe Haze Pollution Event in Northern China during December 2015: Assessment of Effectiveness. Aerosol Air Qual. Res. 20 (10), 2098–2116. doi:10.4209/aaqr.2019.09.0442
Mertens, M., Jöckel, P., Matthes, S., Nützel, M., Grewe, V., and Sausen, R. (2021). COVID-19 Induced Lower-Tropospheric Ozone Changes. Environ. Res. Lett. 16 (6), 064005. doi:10.1088/1748-9326/abf191
Seinfeld, J. H., and Pandis, S. N. (2006). Atmospheric Chemistry and Physics: From Air Pollution to Climate Change. Third edition. New York: John Wiley.
Tang, L., Qu, J., Mi, Z., Bo, X., Chang, X., Anadon, L. D., et al. (2019). Substantial Emission Reductions from Chinese Power Plants after the Introduction of Ultra-low Emissions Standards. Nat. Energ. 4 (11), 929–938. doi:10.1038/s41560-019-0468-1
Tao, Y., Huang, W., Huang, X., Zhong, L., Lu, S.-E., Li, Y., et al. (2012). Estimated Acute Effects of Ambient Ozone and Nitrogen Dioxide on Mortality in the Pearl River Delta of Southern China. Environ. Health Perspect. 120 (3), 393–398. doi:10.1289/ehp.1103715
van den Oord, G. H. J., Rozemeijer, N. C., Schenkelaars, V., Levelt, P. F., Dobber, M. R., Voors, R. H. M., et al. (2006). OMI Level 0 to 1b Processing and Operational Aspects. IEEE Trans. Geosci. Remote Sensing 44 (5), 1380–1397. doi:10.1109/tgrs.2006.872935
Wang, G., Zhang, R., Gomez, M. E., Yang, L., Levy Zamora, M., Hu, M., et al. (2016). Persistent Sulfate Formation from London Fog to Chinese Haze. Proc. Natl. Acad. Sci. USA 113 (48), 13630–13635. doi:10.1073/pnas.1616540113
Wang, T., Xue, L., Brimblecombe, P., Lam, Y. F., Li, L., and Zhang, L. (2017). Ozone Pollution in China: A Review of Concentrations, Meteorological Influences, Chemical Precursors, and Effects. Sci. Total Environ. 575, 1582–1596. doi:10.1016/j.scitotenv.2016.10.081
Wang, Q., Liu, S., Li, N., Dai, W., Wu, Y., Tian, J., et al. (2019). Impacts of Short-Term Mitigation Measures on PM2.5 and Radiative Effects: a Case Study at a Regional Background Site Near Beijing, China. Atmos. Chem. Phys. 19 (3), 1881–1899. doi:10.5194/acp-19-1881-2019
Wu, R., and Xie, S. (2017). Spatial Distribution of Ozone Formation in China Derived from Emissions of Speciated Volatile Organic Compounds. Environ. Sci. Technol. 51 (5), 2574–2583. doi:10.1021/acs.est.6b03634
Xu, W., Song, W., Zhang, Y., Liu, X., Zhang, L., Zhao, Y., et al. (2017). Air Quality Improvement in a Megacity: Implications from 2015 Beijing Parade Blue Pollution Control Actions. Atmos. Chem. Phys. 17 (1), 31–46. doi:10.5194/acp-17-31-2017
Yan, X. (2019). “WRF-chem Simulation of Air Quality in Spring and Summer in Nanjing: Spatio-Temporal Characteristics and Analysis of Emission Reduction Effects,” (Nanjing, China: Nanjing University of Information Science & Technology). Master.
Ye, Z., Liu, J., Gu, A., Feng, F., Liu, Y., Bi, C., et al. (2017). Chemical Characterization of fine Particulate Matter in Changzhou, China, and Source Apportionment with Offline Aerosol Mass Spectrometry. Atmos. Chem. Phys. 17 (4), 2573–2592. doi:10.5194/acp-17-2573-2017
Yin, S., Huang, Z., Zheng, J., Huang, X., Chen, D., and Tan, H. (2018). Characteristics of Inorganic Aerosol Formation over Ammonia-Poor and Ammonia-Rich Areas in the Pearl River Delta Region, China. Atmos. Environ. 177, 120–131. doi:10.1016/j.atmosenv.2018.01.005
Zaveri, R. A., Easter, R. C., Fast, J. D., and Peters, L. K. (2008). Model for Simulating Aerosol Interactions and Chemistry (MOSAIC). J. Geophys. Res. 113 (D13). doi:10.1029/2007jd008782
Zhai, S., Jacob, D. J., Wang, X., Shen, L., Li, K., Zhang, Y., et al. (2019). Fine Particulate Matter (PM2.5) Trends in China, 2013-2018: Separating Contributions from Anthropogenic Emissions and Meteorology. Atmos. Chem. Phys. 19 (16), 11031–11041. doi:10.5194/acp-19-11031-2019
Zhang, Q., Quan, J., Tie, X., Li, X., Liu, Q., Gao, Y., et al. (2015). Effects of Meteorology and Secondary Particle Formation on Visibility during Heavy Haze Events in Beijing, China. Sci. Total Environ. 502, 578–584. doi:10.1016/j.scitotenv.2014.09.079
Zhang, Q., Jiang, X., Tong, D., Davis, S. J., Zhao, H., Geng, G., et al. (2017). Transboundary Health Impacts of Transported Global Air Pollution and International Trade. Nature 543 (7647), 705–709. doi:10.1038/nature21712
Zhang, Q., Zheng, Y., Tong, D., Shao, M., Wang, S., Zhang, Y., et al. (2019). Drivers of Improved PM2.5air Quality in China from 2013 to 2017. Proc. Natl. Acad. Sci. USA 116 (49), 24463–24469. doi:10.1073/pnas.1907956116
Zhang, G., Xu, H., Wang, H., Xue, L., He, J., Xu, W., et al. (2020). Exploring the Inconsistent Variations in Atmospheric Primary and Secondary Pollutants during the 2016 G20 summit in Hangzhou, China: Implications from Observations and Models. Atmos. Chem. Phys. 20 (9), 5391–5403. doi:10.5194/acp-20-5391-2020
Keywords: PM2.5, O3, emission control, WRF-Chem, satellite remote sensing
Citation: Zhang H, Tang K, Feng W, Yan X, Liao H and Li N (2021) Impact of Short-Term Emission Control Measures on Air Quality in Nanjing During the Jiangsu Development Summit. Front. Environ. Sci. 9:693513. doi: 10.3389/fenvs.2021.693513
Received: 11 April 2021; Accepted: 22 July 2021;
Published: 30 July 2021.
Edited by:
Long Cao, Zhejiang University, ChinaReviewed by:
Chandan Sarangi, Indian Institute of Technology Madras, IndiaSrishti Jain, Indian Institutes of Technology (IIT), India
Copyright © 2021 Zhang, Tang, Feng, Yan, Liao and Li. This is an open-access article distributed under the terms of the Creative Commons Attribution License (CC BY). The use, distribution or reproduction in other forums is permitted, provided the original author(s) and the copyright owner(s) are credited and that the original publication in this journal is cited, in accordance with accepted academic practice. No use, distribution or reproduction is permitted which does not comply with these terms.
*Correspondence: Nan Li, linan@nuist.edu.cn