Effects of Land Use and Climate Change on Siamese Eld's Deer (Rucervus eldii siamensis) Distribution in the Transboundary Conservation Area in Thailand, Cambodia, and Lao PDR
 Yongyut Trisurat
 Naris Bhumpakphan
- Department of Forest Biology, Faculty of Forestry, Kasetsart University, Bangkok, Thailand
The Emerald Triangle Protected Forests Complex (ETFC) is recognized as a globally outstanding area for transboundary biodiversity conservation. Eld's deer (Rucervus eldii) include three subspecies; R. eldii siamensis, R. eldii eldii, and R. eldii thamin. This research focused on Siamese Eld's deer (R. eldii siamense), which is one of the 10 critically endangered vertebrates found in the ETFC. Its habitats are threatened by forest conversion to agriculture and human settlements, as well as by future climate change. The objectives of this article were to predict Siamese Eld's deer distribution and to determine potential shifts in its suitable habitat as the results of different land use and climate change scenarios in 2030. Occurrence data for Siamese Eld's deer were gathered from literature and field surveys. The Maximum Entropy (Maxent) and logistic regression models were used to generate suitable habitats. The model that generated the greatest accuracy was selected for distribution mapping. The results showed 142 records of Siamese Eld's deer. The predicted distribution map generated from the logistic regression model provided greater accuracy (90%) than the Maxent (80%). The predicted habitats of Siamese Eld's deer covered 6.0% of the ETFC landscape by 2013. They were concentrated in the protected areas of the lowland forests of Cambodia and Lao PDR. The land use change only did not affect the distribution of Siamese Eld's Deer, but climate change would impact the distribution substantially. In addition, the combination of all future land use and climate changes would significantly reduce the current habitat to ~2.6% of the ETFC landscape, which is a decline 58.0%. The lowest extent of 2.5% was predicted for the combination of unsustainable land use and climate change scenario. Recommendations on biodiversity conservation cooperation among the three countries, habitat protection, and ex-situ conservation were proposed.
Introduction
The Emerald Triangle Protected Forests Complex (ETFC) is situated along the tri-national borders between Cambodia, Lao PDR, and Thailand. It is the largest contiguous and intact forest area of the Southeastern Indochina Dry Evergreen Forests and of the Central Indochina Dry Forests ecoregions in the Southeast Asia. More than two-thirds of the original habitat has been converted to agriculture and human settlement (Wikramanayake et al., 2002; Miles et al., 2006; McShea and Davies, 2011). The transboundary forest landscapes contain globally important habitats for more than 50 threatened mammal species (Round, 1998; Clements, 2004; Cambodia Forestry Administration, 2010; Bhumpakphan, 2015) such as Asian elephant (Elephas maximus), banteng (Bos javanicus), Siamese Eld's deer (Rucervus eldii siamese) and the clouded leopard (Neofelis nebulosa). These wide-ranging mammal species migrate across the tri-national boundaries depending on the seasonal variation of food and water availability (Round, 1998; Bhumpakphan, 2015).
According to FAO (2015), Southeast Asia region lost forest areas of ~31.3 million ha during 1990–2010 or 1.3 million ha per year. Deforestation reduces the extent of suitable habitats and causes habitat fragmentation (Sodhi et al., 2004; Ford et al., 2009). In addition, fragmentation provides accessibility for poaching and land encroachment. Usually, large-sized mammals are more sensitive than small mammals and will disappear from the areas. Kouprey (Bos sauveli) and Javan rhinoceros (Rhinoceros sondaicus) were once widespread along the tri-national borders, but they have been extinct from the ETFC almost for one century due to hunting pressure and habitat loss (Nabhitabhata and Chan-ard, 2005; Cambodia Forestry Administration, 2010). Besides, Siamese Eld's deer is a critically endangered cervid whose range across Southeast Asia has been reduced significantly in the late century and was recently categorized as extinct in the wild (Salter and Sayer, 1986; Gray et al., 2015). McShea et al. (2005) estimated that suitable habitat for all Eld's deer subspecies covered ~44,500 km2 in the Southeast Asia and that about 5,000 km2 were situated in protected areas. Of this figure, more than 90% were estimated in protected forests along the tri-national borders or ETFC and in eastern Cambodia (McShea et al., 2005).
There are three subspecies of Eld's deer; R. eldii siamensis, R. eldii eldii, and R. eldii thamin (McShea et al., 2005; Suzuki et al., 2017). All subspecies usually live in open forests and but occasionally in a wide range of moisture regimes. Siamese Eld's deer (R. eldii. siamensis) prefers dry, deciduous dipterocarp forests with an open understory similar to R. eldii thamin. Round (1998) found a single population in Dong Khanthung protected forest in Lao PDR and more population were reported in the Northern Plains or the Preah Vihear protected forest of Cambodia along the tri-national borders (Cambodia Forestry Administration, 2010; Suzuki et al., 2017). In contrast, R. eldii eldii inhabit more moisture habitats. The last remaining population of R. eldii eldii has been found within a small patch of floating mats of dense vegetation in Manipur, India (Geist, 1998).
Apart from deforestation, changes in climatic patterns will be the most significant threat to biodiversity by the end of 2100 (IPCC, 2007). All prediction models indicated that mean annual temperatures and maximum temperature in Southeast Asia will increase 2–4°C, and the amount of rainfall in dry months will substantially decrease. Altered temperature and rainfall patterns will drive current distributions of species to the climatically suitable areas. However, their migration will be probably limited as the result of fragmentation and land use change. In addition, they would be vulnerable to hunting if the new suitable areas are located outside protected areas (Williams and Middleton, 2008; Corlett, 2012; Trisurat et al., 2014b).
ICEM (2003) and Trisurat (2006) reported that Thailand has better capacity to manage and to protect biodiversity, but it contains less species richness than Lao PDR and Cambodia. Within the ETFC, the current concentration of species richness is largely located along the boundaries between Lao PDR and Cambodia, but both countries have limited capacity. There is only one ranger station for each protected area in Lao PDR and Cambodia, but more than 10 sites were established in Thailand. In addition, the continuing loss of lowland deciduous forest in Cambodia and Lao PDR, as the results of the rubber plantation land allocation program for the military will cause negative impacts on many wildlife species in these areas (Trisurat et al., 2014a). Therefore, the long-term existence of these landscape species requires a conservation partnership among the three countries based on a the context of transboundary biodiversity conservation framework as defined in the Convention on Biological Diversity's Strategic Plan for Biodiversity 2011–2020 and Aichi Targets, especially targets 5, 7, 10, 11, and 15 (Secretariat of the Convention on Biological Diversity, 2012).
In recent decades many spatially explicit models were developed in order to map species distributions in the landscape. They are broadly classified into three approaches, namely (1) cartographic overlay (Stoms, 1992), (2) species modeling using presence-absence data (e.g., generalized linear models, Elith et al., 2011), and (3) species modeling using presence-only data (e.g., maximum entropy or Maxent, Phillips et al., 2006). The cartographic overlay is simple and applicable to all species because the suitability map is derived from known habitat requirements and from expert opinion. However, the result is likely to overestimate the existing distribution range (Trisurat and Toxopeus, 2011). The remaining two approaches are more commonly used nowadays because they provide more accurate results, but the choice of selection is largely related to available occurrence data and survey efforts.
The objectives of this article are to predict Siamese Eld's deer distribution and to determine potential shifts in its suitable habitat as the results of different land use and climate change scenarios. Multi-stakeholders mainly park rangers working in the ETFC and project technical staff from three countries participating in the Species Distribution Modeling Workshop selected Siamese Eld's deer as a proxy species for conservation partnership among three countries according to four criteria. This workshop was one of joint collaborative activities among the three participatory countries. The selection was based on four criteria. These include (1) having transboundary territories; (2) internationally or nationally threatened status (Nabhitabhata and Chan-ard, 2005); (3) having adequacy records for modeling; and (4) listed with iconic or flagship conservation status in the ETFC.
Materials and Methods
Study Area
The study area covers a group of protected areas in the ETFC, together with remaining forest in the buffer zones and other land use types located within the rectangular extent. This is due to parts of the buffer zones are covered by forests and many wildlife species use these habitats (Bhumpakphan, 2015). The total area is 25,056 km2 (Figure 1). Thailand contributes the largest portion (13,038 km2), while 4,657 and 7,361 km2 are contributed by Cambodia and Lao PDR, respectively. The transboundary biodiversity conservation project in the ETFC started in 2000 with the financial support from the International Tropical Timber Organization (ITTO) in an attempt to conserve some of the world's most important biodiversity in protected areas along the tri-national borders. The project phase 1 (2000–2003) was physically implemented in the Pha Taem Protected Forest Complex (PPFC), Thailand, while the phases 2 (2008–2010), and 3 (2012–2015) were conducted across the ETFC.
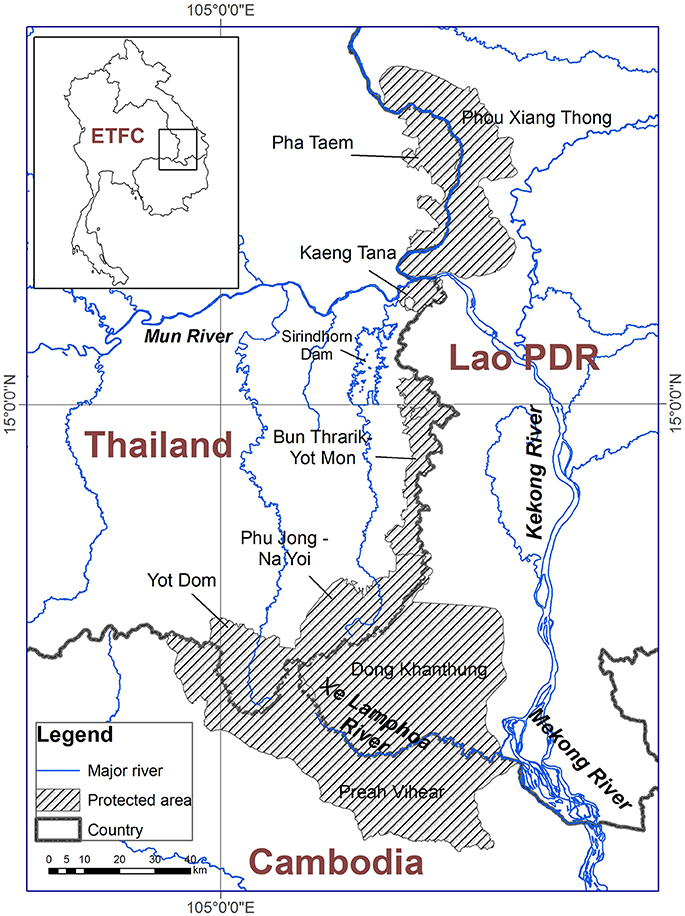
Figure 1. Location of the Emerald Triangle Protected Forests Complex (ETFC) in Thailand, Cambodia and Lao PDR Source: (Trisurat et al., 2014a).
The PPFC is a part of the ETFC in Thailand. It comprises three national parks and two wildlife sanctuaries. The general topography of the PPFC is mountainous and the area is sloping gentle toward Cambodia and Lao PDR. The Preah Vihear Protected Forest for Plant and Wildlife Genetic Resources Conservation in Cambodia covers the largest intact blocks of natural dry deciduous forest in the ETFC and contributes ~40% of the entire protected areas in the ETFC (Table 1). There are two isolated reserves in Lao PDR, namely Phou Xiang Thong National Biodiversity Conservation Area and Dong Khanthung Provincial Protected Area (Figure 1). Both Preah Vihear and Dong Khanthung are located on flat topography and rise toward the PPFC. Parts of the forested areas in these two protected areas and their buffer zones are inundated in the wet season.
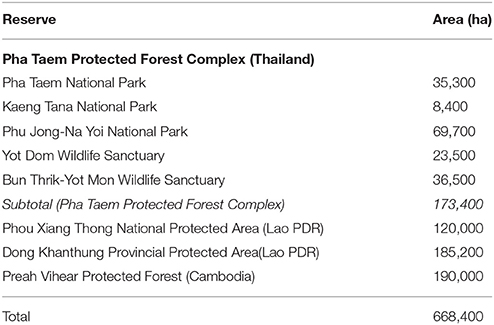
Table 1. Protected areas of the Emerald Triangle Protected Forests Complex among Thailand, Lao PDR, and Cambodia.
The result of the land use change assessments between 2003 and 2013 indicated that ~30.0% of the dry dipterocarp forest both inside and outside the ETFC landscape was converted to other land use classes largely due to clearing for agriculture (e.g., rice paddies, cash crops, and fruit tree orchards) by local communities (Trisurat et al., 2014a). In recent years, rubber plantations expanded substantially in the buffer zones of the PPFC and expand toward Lao PDR and Cambodia. During the implementation of the transboundary project, multi-stakeholders from the three countries defined four land use scenarios in 2030. Scenario 1: the sustainable poverty and stable resources scenario predicted a small amount of rubber and arable land expansion in the buffer zones while all protected areas are secured from land use change; scenario 2, the low economic decline and localized resource degradation, indicated future deforestation for agriculture in the remnant forests in the buffer zones of the PPFC and small patches in The Phou Xiang Thong. The two remaining scenarios, scenario 3: unsustainable economic development and serious resource degradation, and scenario 4: sustainable development and limited resources degradation, showed similar land use patterns, but greater extent of new agricultural land and rubber plantations, especially for the scenario 4 (Figure 2). Large scale conversion of dry dipterocarp forest in the Preah Vihear was expected as the result of the land allocation program for military and the infrastructure development for tourism activities (Trisurat et al., 2014a).
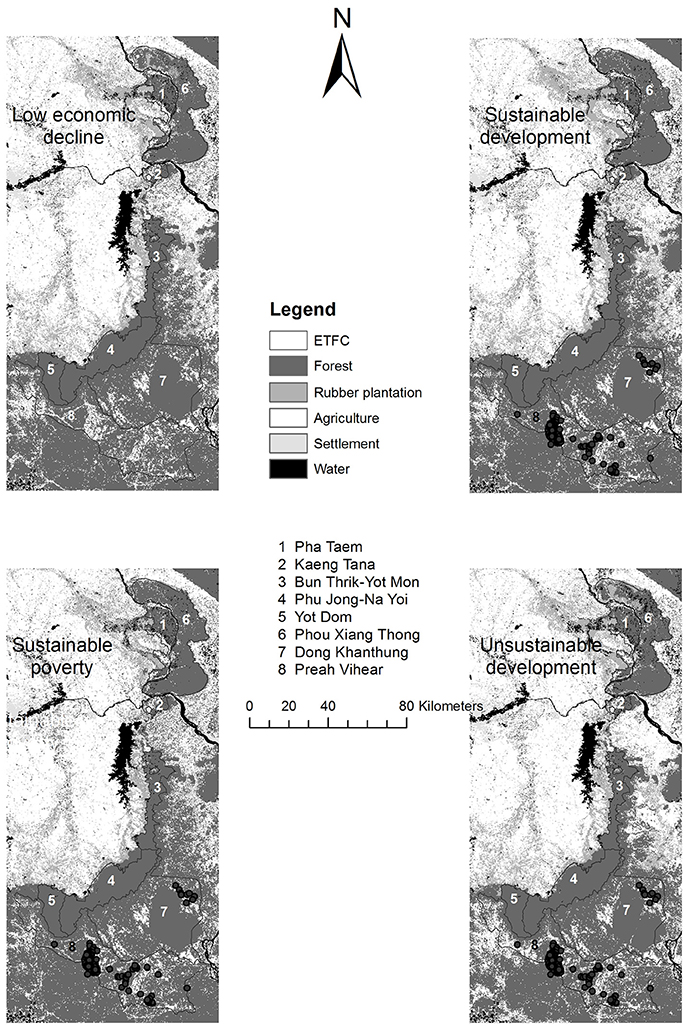
Figure 2. Predicted land use maps in 2030 based on different scenarios in 2030.
Mean annual rainfall in the study area measured at the Sirindhorn Dam is 1,864 mm, and more than 60.0% falls between June and September during tropical monsoons. The amount of rainfall in the driest quarter and the wettest quarter is 16 and 1,119 mm, respectively, and the average temperature is 26.6°C (19.7–27.2°C). The current climatic GIS layers throughout the study area were interpolated from long-term climatic data (1985–2005) located in the study areas and nearby by the Mekong River Secretariat. According to the World climate database (http://www.worldclim.org), annual rainfall will be reduced by 85 mm, while rainfall in the wettest quarter will decline by 61 mm from the baseline. In addition, mean temperature will be 29.1°C (22.2–29.8°C) in 2050.
There are nine land use/land cover types in the ETFC, namely dry evergreen forest, deciduous dipterocarp forest, mixed deciduous forest, forest plantation, rubber plantation, arable land, human settlement, bare soil and rock outcrop, and water body. The percentages of these land use/land types were 21.7, 14.5, 8.8, 0.5, 6.4, 41.0, 3.1, 0.9, and 3.2% of the ETFC area, respectively (Trisurat et al., 2014a). The buffer zones of ETFC have been used for unsustainable agriculture, raising cows and buffaloes in protected areas, and do wildlife poaching, which mostly cause a negative impact on biodiversity conservation. There is more population density in the buffer zones of the ETFC than those areas in Cambodia and Lao PDR mainly due to better accessibility and other infrastructure development. In addition, some parts of Preah Vihear are used by the military (Cambodia Forestry Administration, 2010). The conditions of rural communities surrounding Phou Xiangthong and Dong Khanthung in Lao PDR are similar to Cambodia. Local people depend on natural resources both inside and outside the reserves for their daily livelihood (Round, 1998).
Spatial Analyses
There were five main steps involved in quantifying land use and climate change impacts on Siamese Eld's deer distribution: (1) collection of Siamese Eld's deer occurrence; (2) development of habitat factors; (3) species distribution modeling; (4) validation and mapping distribution; and (5) assessment of land use and climate-change impacts (Figure 3).
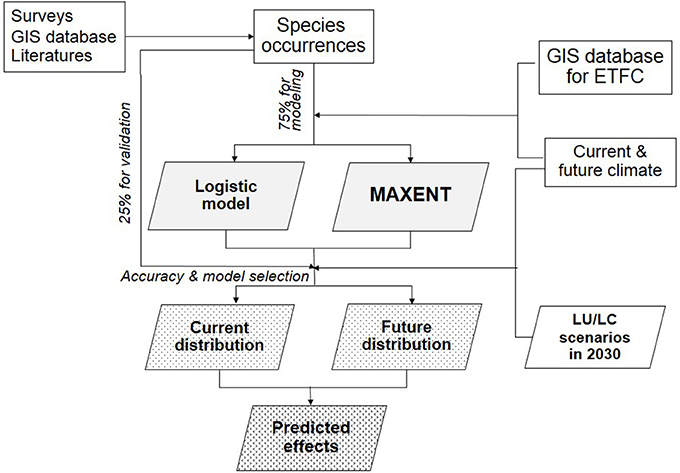
Figure 3. Main steps of species distribution modeling.
Siamese Eld's Deer Occurrence
The existing geo-referenced Siamese Eld's deer locations were collected in 2000–2010 by Cambodia's Forestry Administration in cooperation with the Cat Action Treasury and the Wildlife Conservation Society as part of biodiversity conservation surveys across the Northern Plains of Cambodia (Clements, 2004; Cambodia Forestry Administration, 2010). They used both camera-traps and visual sightings. In addition, a rapid wildlife assessment (limited ground survey and interview) was conducted in the Dong Khanthung proposed national biodiversity conservation area, Lao PDR (Round, 1998). Additional ground surveys were conducted in the PPFC in Thailand, the Preah Vihear in Cambodia, and the Dong Khanthung and Phou Xiang Thong National Biodiversity Conservation Area in Lao PDR during the project phase 3 (2012–2015) using camera-traps, visual sightings and interview. This was done through a joint research program on wide-ranging mammal species distributions in the ETFC (Bhumpakphan, 2015). Protected area staff and scientists were trained to identify Siamese Eld's deer footprints and how to set-up camera-traps. Altogether, there were 142 observations of Siamese Eld's deer largely found in open-woodland throughout the Preah Vihear and in the northeast part of Dong Khanthung. This species was rarely observed in the core area of Dong Khanthung and along Thailand-Lao PDR borders, because these areas are covered by evergreen forest and heavily disturbed by human activities.
Development of Habitat Factors
Environmental variables used to determine wildlife habitats consisted of biophysical and socio-economic factors. These variables were previously identified as direct or indirect factors affecting the patterns of abundance and distribution of wildlife at the regional and national levels (Bonilla-Sanchez et al., 2010; Trisurat et al., 2014b). The biophysical factors were: land use type; deciduous forest patch size; evergreen forest patch size; altitude; slope, distance to available water; annual mean temperature; annual rainfall; rainfall in the wettest quarter; and rainfall in the driest quarter. The socio-economic or human-associated factors that would influence Siamese Eld's deer distribution were distance to city; distance to main road; and population density by district. These variables were obtained from the GIS database generated during the project phase 2 (Trisurat, 2010). The land use map of 2013 and climatic variables were used to develop the wildlife distribution at the baseline, while predicted land use maps derived from four scenarios (Trisurat et al., 2014a) and future climate in 2050 (GMCs A2 scenario—www.worldclim.org/download) were used for future distributions. A correlation matrix between all possible pairs of independent variables (number data) was assessed to determine whether they were highly correlated and might cause problem arising from multi-collinearity (Graham et al., 2008; Lobo et al., 2008; Tognelli et al., 2009; Aranda and Lobo, 2011). The Pearson correlation coefficient (r) > 0.70 was chosen to address this problem (Peterson et al., 2007). In addition, the pixel resolution of 250 m was chosen for spatial analyses, because it was relevant to the minimum mapping unit of the land use derived from visual interpretation, as well as to environmental factors (except climatic variables-−1 km resolution).
Species Distribution Modeling
We used two common species distribution models for mapping distribution of Siamese Eld's deer. Logistic regression modeling is a branch of generalized linear models (GLM) that is used to correlate a binary dependent variables (presence and absence) with a set of independent variables (habitat factors) (Elith et al., 2011). Seventy-five percent of occurrence data (108 records) were treated as training presence data and the remaining 25.0% (34 records) were randomly selected from the presence data and used as testing presence data to validate the model results. In addition, a similar amount of absence data derived from occurrences of other species located more than 500 m from Siamese Eld's deer localities were randomly selected for running the logistic regression model. The probability values derived from the logistic regression range from 0.0 to 1.0. The higher the value is the greater the likelihood of occupancy of Siamese Eld's deer. Generally, any pixel containing the probability values equal or >0.5 was categorized as presence, below 0.5 was categorized as absence. In some cases, the cut-off value may be adjusted higher or lower than 0.5 (0.3, 0.4, 0.45, 0.55, and 0.60) in order to maximize the fit for field observations (Neter et al., 1996; Trisurat et al., 2014b). In this research we also determined the performance of logistic regression at the cut-off values of 0.3, 0.4, 0.5, and 0.6.
In addition, we also used a niche-based model or Maxent (see Phillips et al., 2006) to estimate the probability distribution of Siamese Eld's deer. Maxent is one of the strongest performing methods among presence-data only modeling techniques, particularly for species with a relatively low number of occurrences (Tognelli et al., 2009). We used the same set of habitat factors and the training presence data as input data in Maxent modeling. We run the model for five replications using a convergence threshold of 10 with 1,000 iterations as an upper limit for each run. Ten fixed value thresholds are generated from Maxent software (Phillips et al., 2006). In addition, the contribution of significant variables in the Maxent models were also provided. In this study, we used six threshold values (minimum training presence, 10 percentile training presence; equal training sensitivity plus specificity; maximum training sensitivity plus specificity; equal test sensitivity plus specificity; maximum test sensitivity plus specificity) because they are commonly applied for binary classification (e.g., Liu et al., 2005; Trisurat et al., 2014b).
The minimum training presence is designed to capture all occurrence samples. It is suitable for invasive species modeling for precaution approach, but not suitable to identify native suitable habitat, which probably causes over-estimates the range. The 10 percentile training presence identifies the top 90% of training samples. This threshold is advantage choice if there are less occurrences and it is suitable for native habitat estimation. Equal training sensitivity and specificity threshold predicts the same chance of suitable and unsuitable distribution range. Maximum training plus sensitivity threshold maximizes both the chance of omission and commission errors (not necessarily the same as the previous). Equal test and maximum test thresholds are the same as the two previous thresholds above, but refer to the test samples used in the models, not the training samples (Phillips et al., 2006).
Validation and Mapping Distributions
The performance of logistic regression and the six logistic thresholds derived from the Maxent was evaluated using both the area under curve (AUC) and the contingency table. The values of AUC rank from 0.0 to 1.0, the higher values imply the better performance (Hosmer and Lemeshow, 2000). Meanwhile, the contingency table includes commission, omission, and overall accuracy. Commission errors are misclassifications that do not belong to the actual class, and omission errors represent the opposite classification error (Lillesand and Kiefer, 1987). The 34 occurrences previously selected and 36 absences were used as independent dataset to validate the model accuracy in the contingency table. The model and/or logistic threshold that provides excellent performance and higher accuracy was chosen to generate Siamese Eld's deer distribution at the baseline and in the future (incorporating future land use map and future climatic data).
Assessment of Land Use and Climate-Change Impacts
Future distributions for Siamese Eld's deer were predicted by replacing the land use map from 2013 with four land use scenario maps (Trisurat et al., 2014a), and the current climatic data with future climatic data in 2050 (http://www.worldclim.org). It should be noted that the climatic data in 2030 are not available from the worldclim database. The analyses were done with only land use change and the combination of land use and climate changes.
The predicted presence or absence of Siamese Eld's deer at the baseline (S) was compared with the distribution of geographical species ranges under different land use and climate change scenarios (i.e., for each land use change scenario, and for a combined land use and climate change scenario) in terms of total extent, gained suitable habitat [G = a new suitable habitat that a species (taxa) will potentially move into] and lost suitable habitat (L = an area currently predicted as suitable but predicted not to exist in the future). Shift in the species distribution or turnover rate was calculated assessing distribution ranges as predicted for 2013 and 2030, [(G + L)/(S + G)*100] (Buytaert et al., 2011).
Results
Correlated Variables
The results of Pearson correlation analysis indicated that annual precipitation was highly correlated with the amount of precipitation during the wettest quarter (r = 0.96); and mean temperature was highly correlated with the altitude or digital elevation model (r = −0.94). See more details in Annex 1. This is due to the fact that the study area is influenced by the tropical monsoons during June–September. In addition, as altitude increases, temperature decreases, and the general rate of decrease of temperature is 6.5°C for each 1,000 m altitude increase. In order to avoid multi-collinearity problem, we did not include annual precipitation and mean temperature in the species distribution models.
Predicted Distributions
Logistic Regression Model
The results of the logistic regressions indicated that rainfall in the driest quarter, slope, distance to road, distance to stream, distance to city, and patch size of evergreen forests were significantly related to the distributions of Siamese Eld's deer. Rainfall in the wettest quarter, elevation, population density, and land use/land cover were excluded from the model. The logistic regression model for Siamese Eld's deer in the ETFC is shown below.
Where e = natural base (2.718); dry_q_rain = rainfall in the driest quarter; slope = percent slope; stream_dist = distance to stream; road_dist = distance to road; city_dist = distance to city; eve_patch = patch size of evergreen forests. Detailed statistic outputs are shown in Annex 2.
The probability values of the Siamese Eld's deer distributions were classified into two classes using the values of 0.3, 0.4, 0.5, and 0.6. Any pixel containing equal or greater than the assigned cut–off value was categorized as presence, while the lower values were classified as likely absence. For the cut-off values of 0.3, 0.4, 0.5, and 0.6, the predicted areas of presence covered 8.9, 7.3, 6.0, and 5.0% of the ETFC landscape (including areas outside the protected areas located within the rectangular extent), respectively (Figure 4A).
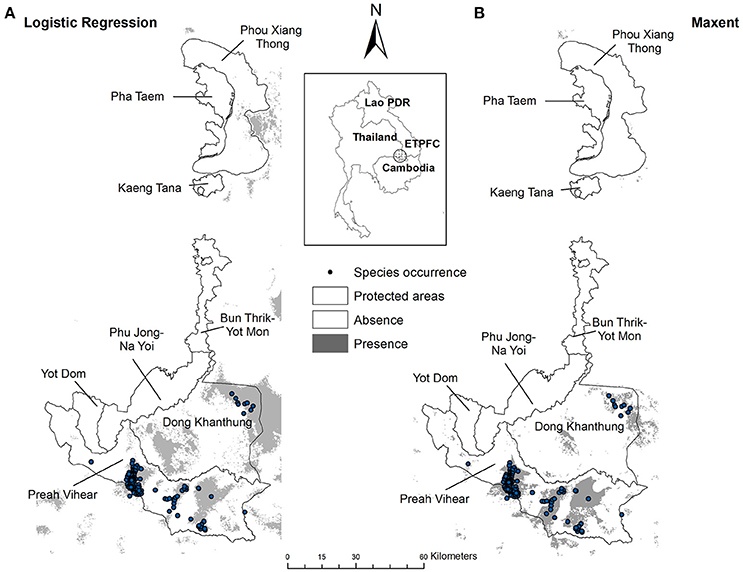
Figure 4. Suitable habitat for Siamese Eld's deer at the baseline: (A) generated from the logistic regression model with the cut-off value of 0.5; (B) generated from the Maxent using equal training sensitivity plus specificity logistic threshold at the baseline.
Maximum Entropy
All 11 predictor variables, except annual rainfall and annual mean temperature were included in the Maxent model. The contribution of distant to stream and distance to city was more than 33% for each. Rainfall in the wettest quarter and elevation had moderate contribution (9–12%), and the remaining variables had low contribution (0.1–2.4%) (Annex 3). The average AUC value for the 5 replicated runs derived from the six logistic thresholds was 0.99 (Table 2). These results indicated excellent performance of Maxent for the discrimination of presence and absence of Siamese Eld's deer (Hosmer and Lemeshow, 2000).
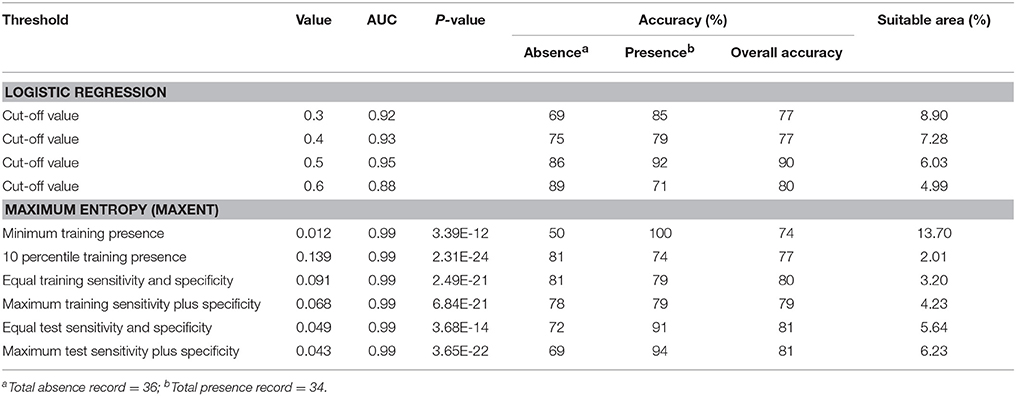
Table 2. Accuracy assessment of each species distribution model and predicted suitable area for Siamese Eld's deer.
The minimum logistic value of 0.01 was obtained for minimum training presence and the maximum value of 0.15 was for 10 percentile training presence. Using the six logistic thresholds above for binary classification, the results indicated that the predicted suitable habitat for Siamese Eld's deer covered 13.7, 2.0, 3.2, 4.2, 5.6, and 6.2% of the ETFC rectangular extent regarding: (1) the minimum training presence; (2) 10 percentile training presence; (3) equal training sensitivity plus specificity; (4) maximum training sensitivity plus specificity; (5) equal test sensitivity plus specificity; and (6) maximum test sensitivity plus specificity, respectively (Table 2).
The pattern of predicted distributions derived from the Maxent was substantially different from the logistic regression model. Large extents of suitable areas for Siamese Eld's deer were concentrated in Preah Vihear Protected Forest areas and the buffer zones of Dong Khanthung Provincial Protected Area. Moderate patch sizes were also predicted in the core area of Dong Khanthuthung. While only few small patches were predicted in the south of Phou Xiang Thong National Protected Area. Basically, the suitable habitats were confined nearby the occurrence localities (Figure 4B). In contrast, the predicted ranges generated from logistic regression model expand to a wider extent, especially in Dong Khanthung and its buffer zones (Figure 4A).
Selected Species Distribution Models
The AUC values derived from the three cut–off values of logistic regression models (0.92–0.95) and the Maxent (0.99) were not substantially different and they were considered as excellent discrimination between likely presence and likely absence (Hosmer and Lemeshow, 2000).
The results of the contingency table showed that the overall accuracy for predicted Siamese Eld's deer distribution derived from the logistic regression model at a cut-off value of 0.5 generated the highest overall accuracy (90%), predicted presence (92%), and predicted absence (86%). Meanwhile, the accuracies of predicted distribution maps derived from Maxent ranked from 74% for minimum training threshold to 81% for equal test sensitivity plus specificity, and maximum test sensitivity plus specificity (Table 2). Although the last two later thresholds had an overall accuracy greater than the remaining thresholds, the percentage of absence prediction was substantially low. In contrast, the equal training sensitivity and specificity generated more balance between presence and absence predictions with high overall accuracy (80%).
We presented these predicted suitable maps derived from the logistic regression (cut-off value of 0.5) and the Maxent (equal training sensitivity and specificity threshold) to park rangers from Cambodia and Lao PDR where Siamese Eld's deer still remains. Based on the accuracy assessment and consultation with park rangers at the joint meeting among the three countries, the predicted distribution map generated from the logistic regression model was selected to map distribution for Siamese Eld's deer at the baseline and in the future. This was due to the overall accuracy obtained from the logistic regression model was 90%, while it was 80% derived from the Maxent models (Table 2).
Distribution Ranges and Patterns
At current the suitable ranges were covered ~1,511 km2 or 6% of the ETFC landscape (Table 3). Of this figure, 536 km2 (35%) were predicted in Lao PDR and the remaining 975 km2 (65%) was in Cambodia. These figures accounted ~13.24 and 11.5% of the total study area were located in Lao PDR and Cambodia, respectively. The species distribution models indicated that Thailand contained none suitable habitats for Siamese Eld's deer (Figure 4A).
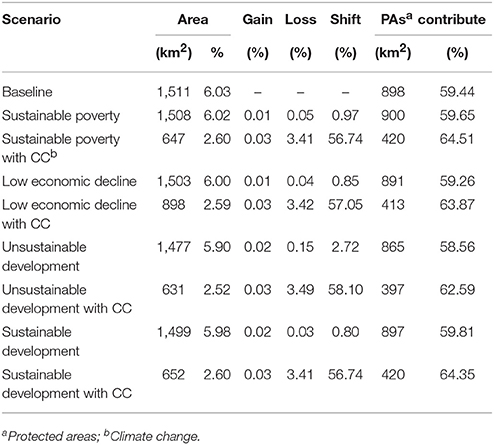
Table 3. Predicted suitable distributions for Siamese Eld's deer in the Emerald Triangle landscape.
The predicted habitats generated under the four land use scenarios were similar to the baseline and were quite stable among four future scenarios (Table 3 and Figure 5). The minimum habitat areas of 5.9% of the ETFC landscape, slightly different from the baseline, were expected under the unsustainable land use development scenario (Table 3). Besides the distribution of suitable habitats by country were also similar to the baseline. In contrast the predicted distributions for Siamese Eld's deer significantly declined from 6% to ~2.5–3.6% of the ETFC rectangular landscape when future climatic conditions (precipitation in the wettest quarter months and precipitation in the driest quarter months) were added. Substantial losses were defined in Cambodia in which suitable habitats were predicted to decline from 535 km2 or 11.5% of the total study area to ~98 km2 (2.1%) or 81.0% of the baseline (Figure 6). Meanwhile, suitable habitats in Lao PDR were predicted to be reduced from ~957 to ~552 km2 or 42% of the baseline. The vulnerable areas were located along the buffer zones of current distribution ranges (Figure 5). Besides reduction of suitable habitats, the extent of occurrences of Siamese Eld's deer would shift ~56–58% from the current distribution ranges. The highest percentage of 58% was predicted under the combination of unsustainable land use change and climate change (Table 3).
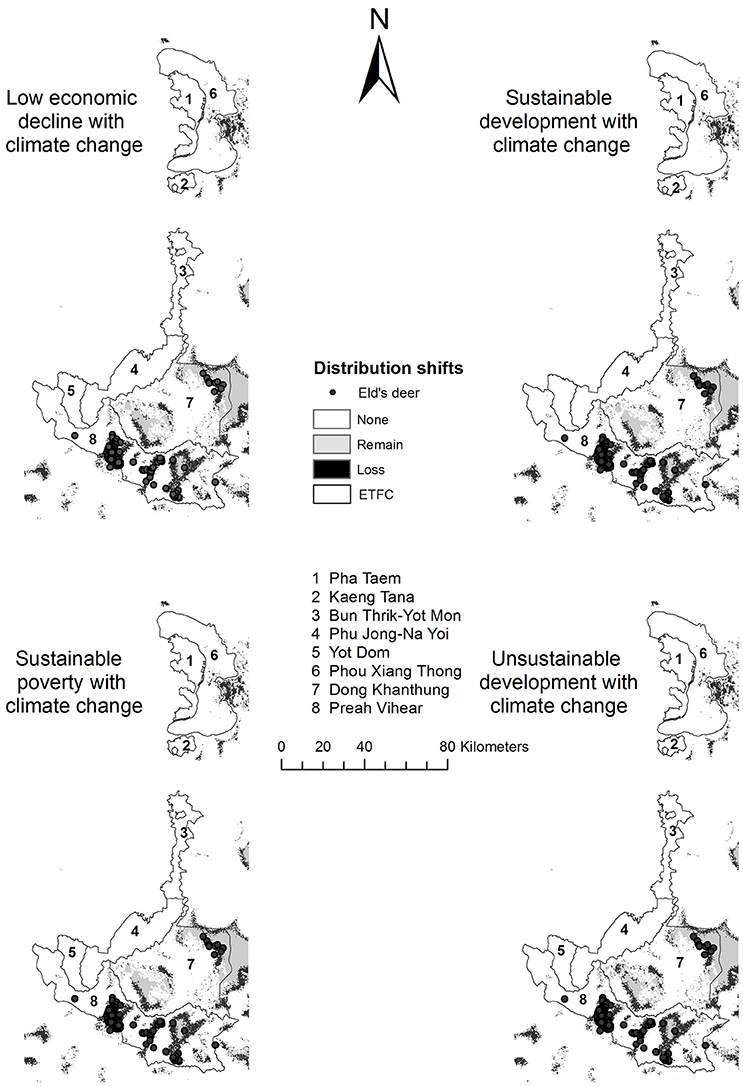
Figure 5. Predicted gained habitat and lost habitat under the combination of land use and climate change scenarios in 2030.
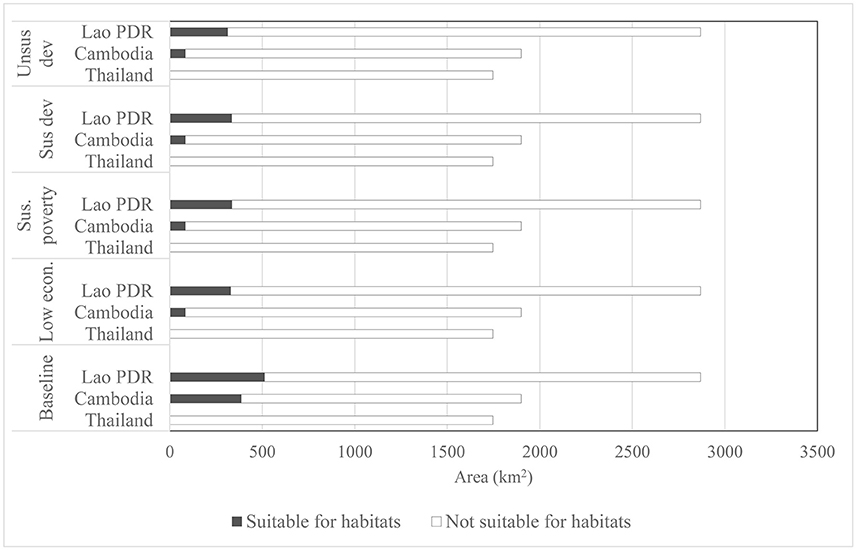
Figure 6. Contribution of protected areas in conserving suitable habitats for Siamese Eld's deer.
Contribution of Protected Areas
Protected areas in the Emerald Triangle landscape cover totally 668,400 ha or 26% of the ETFC rectangular landscape (Table 1). However, not all of the protected areas were predicted as suitable habitat for Siamese Eld's deer although strict protection measures had been implemented. The extents of current suitable habitats derived from the logistic model covered 1,510 and 898 km2 or 59% of the total suitable habitats were predicted to be in the protected areas. Of this figure, 386 km2 is located in the Preah Vihear protected forest in Cambodia; and 512 km2 was located in in Lao PDR's protected areas (Dong Khanthung and Phou Xiang Thong), which account at present for 20.3 and 17.8% of the protected areas, respectively (Figure 6). The model results indicated that there was no suitable habitat for Siamese Eld's deer found in the PPFC of Thailand. Similar to the entire range distribution in the ETFC landscape, the predicted suitable habitats in the protected areas generated under the four land use scenarios were not substantial different from the baseline (Table 3). The minimum habitat areas of 865 km2 or 58% of the total suitable habitats were predicted under the unsustainable land use development scenario.
The predicted suitable habitats for Siamese Eld's deer found in protected areas significantly decreased when future climate change was combined with land use change. The extent of current suitable habitats would decline more than 50% from the baseline. The minimum suitable area of 397 km2 or a decrease of 56% was determined under the combination of unsustainable land use development with future climate change. The predicted habitats under the remaining scenarios ranked from 413 to 420 km2. However, the percentages of suitable habitats found in protected areas relative to the total suitable areas slightly increased from 58 to 63–64% (Table 3), meaning that the proportion of habitat reduction outside protected areas is relatively greater than inside protected areas.
Discussion
Performance of Species Distribution Models
Model comparisons between presence-absence data models and presence-only data models for species distribution were evaluated in other regions (Wisz et al., 2008; Tognelli et al., 2009; Aranda and Lobo, 2011). In this study we compared two popular techniques, namely logistic regression model (Hosmer and Lemeshow, 2000) and Maxent (Phillips et al., 2006) in order to generate species distributions for Siamese Eld's deer in the ETFC. Both techniques belong to the inductive approach using presence and absence data, and presence-only data, respectively. We did not use the cartographic overlay or a kind of deductive approach because it generally overestimates the distribution range (Stoms, 1992; Trisurat and Toxopeus, 2011).
The species distribution models used in this study provided opportunities to test the model performance using the AUC as a standard method (Hosmer and Lemeshow, 2000) and the contingency table with independent presence and absence dataset (Lobo et al., 2008; Aranda and Lobo, 2011). The values of AUC indicated that the performance of both techniques was not substantially different. However, the percentages of correct and wrong predictions derived from the contingency table were relatively different between the two models and among various logistic thresholds of Maxent (Table 2).
Although the maximum test sensitivity plus specificity yielded few percentages greater than equal training sensitivity and specificity and the maximum test sensitivity plus sensitivity, this algorism uses less sample data in calculation. In addition, the maximum training (and test) sensitivity plus sensitivity thresholds maximize both the chance of erroneously assigning unsuitable distribution (commission error) and missing suitable distribution (omission error) (Phillips et al., 2006). Thus, they provided the highest presence prediction of 94%, while the equal training sensitivity and specificity attempt to balance and optimize the chance of commission and omission errors. In this study we selected the equal training sensitivity and specificity as a candidate to compare with the logistic regression.
The occurrences of Siamese Eld's deer in Cambodia were gathered from long-term monitoring (Clements, 2004; Cambodia Forestry Administration, 2010), while it was only briefly surveyed (1–2 years) in Thailand and in Lao PDR (Round, 1998; Bhumpakphan, 2015). The algorism of Maxent is largely based on actual and presence-only data (Phillips et al., 2006). These different sampling efforts are controversial for Maxent application (Kramer-Schadt et al., 2013) and result in narrow extents of the predicted presence. In contrast, the predicted suitable habitats for Siamese Eld's deer, derived from the logistic regression, cover wider extents. This is due to the likely presence derived from the logistic regression is dependent on correlation between dependence variables (presence-absence data) and a set of independent data (habitat factors) (Hosmer and Lemeshow, 2000; Elith et al., 2011). Based on comparison of model performance, accuracy assessment using independent datasets and consultation with park rangers, the logistic regression model at the cut-off value of 0.5 was selected for mapping species distributions at present and in the future. It should be noted that the overall accuracy obtained from this study (90%) was greater than most mammal species (68–84%, except elephant ~92%) previous study implemented in the western complex, Thailand (Trisurat et al., 2010). This is largely due detection probability of the elephant signs and visual sightings is easier than Siamese Eld's deer.
This study improved previous regional assessments of suitable Eld's deer habitats in the Southeast Asia because we used higher resolution datasets (250 m). Previous studies use course-resolution datasets of 1 km. In addition, all patches smaller than 25 km2 were eliminated in previous study (McShea et al., 1999, 2005). We focused on the ETFC situated along the tri-national borders between Thailand, Cambodia, and Lao PDR, which already were determined as important habitat for R. eldii siamense or Siamese Eld' deer (Lekagul and McNeely, 1988; Round, 1998; McShea et al., 2005; Weiler, 2005).
Impact of Individual and Combined Drivers
The results indicated that the predicted impacts of land use change on Siamese Eld's deer in the ETFC were not substantial different from the baseline (Table 3). These results were generally different from the results of other species where land use change caused substantial impacts on extent of distribution and range shift (e.g., Sodhi et al., 2004; Ford et al., 2009; Corlett, 2012; Trisurat et al., 2014b). This is due to the fact that Siamese Eld's deer is more likely to be found in lowland open woodlands or deciduous forests, and along the fringe of evergreen forest (riparian forest and dry evergreen forest). In addition, it avoids areas with dense evergreen forest and human settlements (McShea et al., 2005). This is not the case when protected areas are combined. Siamese Eld's deer inhabiting the buffer zones are more vulnerable than living inside protected areas. Approximately 60% of suitable habitats found in protected areas, except for Thailand. The results of predictions derived from both logistic regression and Maxent were in agreement with field observations in Lao PDR (Round, 1998) in Cambodia (Clements, 2004; Cambodia Forestry Administration, 2010) and with previous spatial modeling at regional level (McShea et al., 2005).
However, the combined land use and climate change drivers would have a stronger impact on species distributions than a single land use change. Suitable habitats under the combination of climate change with sustainable poverty and sustainable development scenarios would decline from 6% of the ETFC landscape at the current to 2.6% in the future. However, suitable habitats under the low economic decline and unsustainable development, in combination with climate change scenarios were slightly greater than under the above scenarios (Table 3). This is due to the fact that more paddy fields or grassland are expected, and these land use categories will provide more food sources or preferred habitat for Siamese Eld's deer (McShea et al., 2005; Bhumpakphan, 2015).
In general, medium- and large-mammals inhabit near water resources such as perennial streams or water bodies (Trisurat et al., 2014b). However, the logistic regression model and field observations indicated that the suitable habitat for Siamese Eld's deer was negatively correlated with distance to stream. The reason is that stream in Preah Vihear and Dong Khanthung is often associated with evergreen forest block (Suzuki et al., 2017). Although, Siamese Eld's deer prefers dry habitats and consumes much less water than sambar deer and can survive by consuming dew on leaves (Lekagul and McNeely, 1988; McShea et al., 1999), available food sources (mainly grass and young leaves) in open space and seasonal waterholes are also important factors for its survival (McShea et al., 2005; Bhumpakphan, 2015). The predicted climatic conditions in 2030 assume less annual rainfall and longer dry months (http://www.worldclim.org/version1) and these phenomena would affect food sources in the dry season. In addition, dry mud wallow will affect male Eld's deer and limited shade trees during dry season would minimize their resting areas.
Management Implications
Deforestation and land use change are the main threats to biodiversity loss in the Southeast Asia and the reduction of the Southeastern Indochina Dry Evergreen Forests ecoregion (Wikramanayake et al., 2002). About 16% of the original dry forest remained in Southeast Asia in 2001 (Miles et al., 2006) but only 5% was classified as intact forest (Myers et al., 2000). Large portions of lowland dry dipterocarp forest are prime target for conversion to rice production. In addition, it is not adequately included in the protected area system in Thailand (Santisuk et al., 1991; Trisurat, 2007) and other countries in Southeast Asia (McShea et al., 2005). In order to avoid parks and human conflicts, most protected areas in Southeast Asia are located in high altitude and rugged terrains covering mountain and evergreen forest and other forms of deciduous forests (ICEM, 2003; McShea et al., 2005; Trisurat, 2007). These areas are suitable for watershed protection so much, but not for biodiversity conservation, in particular for Eld's deer.
Future destruction of lowland dry dipterocarp forests in Cambodia as the result of land allocation programs for military and in Lao PDR as the results of unsustainable land uses, in combination with climate change will have severe impacts on the survival of Siamese Eld's deer and most likely other medium– and large–mammals (e.g., Sambar, elephant, and leopard). The extent of current suitable habitats is expected to decline more than 50% and be severely fragmented. If suitable patches smaller than 5 km2 were eliminated, the number of suitable patches will decline from 23 patches at the baseline to 9 patches under the combined low economy, sustainable land use with climate change scenarios, and to 8 patches under the combined unsustainable land use with climate change. These results were defined by using a similar approach as McShea et al. (2005). Therefore, the collaborative transboundary conservation efforts among the three countries to improve degraded habitats and facilitate connectivity of Siamese Eld's deer is very important, especially under the synergetic effect of climate change and land-use change. Trisurat et al. (2010) indicated that the viabilities of large mammals would be significantly improved through effective protection and habitat improvement in areas between isolated suitable habitats inside the western forest complex in Thailand.
Formulation of a transboundary biodiversity conservation framework and management plan among the three countries is essential to maintain Siamese Eld's deer population because the current and future predictions revealed that important habitats for Siamese Eld's deer are situated inside the Preah Vihear protected forest and adjoin the southwest part of Dong Khanthung, as well as its buffer zones in the northeast part along the tri-national borders. In addition, Siamese Eld's deer seasonally moves between the two countries, depending on food availability and rainfall (McShea et al., 2005; Bhumpakphan, 2015). Although, the model results did not determine suitable habitats in Thailand at present and future, previous report (Lekagul and McNeely, 1988; McShea et al., 2005) indicated that it used to live in the PPFC, Thailand. Thailand successfully bred and reintroduced Burmese Eld's deer (R. eldii thamin) in the wild in the north and central Thailand (Buranapim et al., 2008). Currently, there are ~50 individual Siamese Eld's deer in various Thailand's zoos. Based on this achievement, the three countries jointly conducted an Eld's deer reintroduction workshop, which aimed at increasing Siamese Eld's deer population in the ETFC landscape in the next 20 years in order to resolve inbreeding problem (Bhumpakphan, 2015). It is expected that the collaborative conservation efforts among the three countries through both in-situ and ex-situ conservation will maintain Siamese Eld's deer in long-term.
Conclusions
The results of this study showed that the predicted distributions of Siamese Eld's deer derived from the logistic regression model was more accurate than those from the Maxent. In 2013, suitable habitats for Siamese Eld's deer covered ~6% of the ETFC landscape, and were found especially in lowland deciduous forest areas. All four land use change change scenarios will not change suitable habitats for Siamese Eld's deer because most suitable habitats (60%) are located in protected areas, while deforestation most likely occurs in the associated buffer zones. In contrast, climate would impact the distribution substantially and the combination of land use with future climate change predicted severe impacts on Siamese Eld's deer. Thus, more than 50% from the current suitable habitat would be lost.
The predicted distribution maps at current and in the future generated by this study were generated largely from the long-term survey across the Northern Plains of Cambodia. Limited data were obtained from a rapid wildlife survey in the remaining areas. Therefore, unbalance survey efforts probably limit the choice of model selection. It is strongly recommended to continuously survey this species and other flagship species in order to improve biodiversity database and to monitor temporal and spatial changes in distribution. Nevertheless, the predicted maps are useful for parks rangers, decision makers, and local people for smart enforcement patrols and for developing conservation partnership framework through a transboundary biodiversity conservation cooperation in the ETFC landscape between Thailand, Lao PDR, and Cambodia.
Author Contributions
YT: analyse and draft a manuscript; NB: wildlife survey.
Conflict of Interest Statement
The authors declare that the research was conducted in the absence of any commercial or financial relationships that could be construed as a potential conflict of interest.
Acknowledgments
This research was supported by the ITTO project PD 577/10 Rev. 1 (F), Management of the Emerald Triangle Protected Forests Complex to Promote Cooperation for Trans-boundary Biodiversity Conservation between Thailand, Cambodia and Lao PDR (Phase III). We would like to thank the Government of Japan for financial support and the participating Superintendents and project staff from Thailand, Lao PDR, and Cambodia for their active cooperation during meetings and field observations. High appreciation was given to Dr. Hwak-On Ma (ITTO) and Mr. Kamol Wisulpakan (Project Manager-Thailand Component) for their guidance and support. We are grateful to the Royal Forest Department and Department of National Parks, Wildlife and Plant Conservation of Thailand, Cambodia Forestry Administration and the Mekong River Commission Secretariat (MRC) for providing the data. Palle Havmoller is thanked for technical editing. Special thanks were given to two reviewers and Guest Associate Editor (Dr. Nophea Sasaki) for the constructive comments for improving this manuscript. The opinions expressed or statements made herein are solely those of the authors and do not necessarily reflect the views of the above agencies.
Supplementary Material
The Supplementary Material for this article can be found online at: https://www.frontiersin.org/articles/10.3389/fenvs.2018.00035/full#supplementary-material
References
Aranda, S. C., and Lobo, J. M. (2011). How well does presence-only based species distribution modeling predict assemblage diversity? A case study of the Tenerife flora. Ecography 34, 31–38. doi: 10.1111/j.1600-0587.2010.06134.x
Bhumpakphan, N. (2015). Wildlife Resources. Final Technical Report; Management of the Emerald Triangle Protected Forests Complex to Promote Cooperation for Transboundary Biodiversity Conservation between Thailand, Cambodia and Laos (Phase III), Faculty of Forestry; Kasetsart University, Bangkok.
Bonilla-Sanchez, Y. M., Serio–Silva, J. C., Pozo–Montuy, G., and Byum, N. (2010). Population status and identification of potential habitats for the conservation of the endangered black howler monkey Alouatta pigra in northern Chiapas, Mexico. Oryx 44, 293–299. doi: 10.1017/S0030605310000025
Buranapim, N., Sukmasuang, R., and Bhumpakphan, N. (2008). Population Viability Analysis of Reintroducing Brow-antlered Deer (Cervus eldi thamin) in Huai Kha Khaeng Wildlife Sanctuary, Uthai Thanee Province. Thesis, Graduate School, Kasetsart University, Bangkok.
Buytaert, W., Cuesta-Camacho, F., and Tobon, C. (2011). Potential impacts of climate change on the environmental services of humid tropical alpine regions. Global. Ecol. Biogeogr. 20, 19–33. doi: 10.1111/j.1466-8238.2010.00585.x
Cambodia Forestry Administration (2010). Management plan of the Preah Vihear Protected Forest for Plant and Wildlife Genetic Resources Conservation 2010–2014. Phnom Penh: Cambodia Forestry Administration.
Clements, T. (2004). Mapping Biological and Human Landscapes in the Northern Plains, Cambodia. Phnom Penh: Wildlife Conservation Society. Cambodia Program.
Corlett, R. T. (2012). Climate change in the tropics: the end of the world as we know it? Biol. Conserv. 151, 22–25. doi: 10.1016/j.biocon.2011.11.027
Elith, J., Phillips, S. J., Hastie, T., Dudik, M., Chee, Y. E., and Yates, C. J. (2011). A statistical explanation of MaxEnt for ecologists. Divers. Distrib. 17, 43–57. doi: 10.1111/j.1472-4642.2010.00725.x
FAO (2015). Global Forest Resources Assessment 2015. Rome: Food and Agriculture Organization of the United Nations.
Ford, H. A., Walters, J. R., Cooper, C. B., Debus, S. J. S., and Doerr, V. A. J. (2009). Extinction debt or habitat change – ongoing losses of woodland birds in north-eastern New South Wales, Australia. Biol. Conserv. 142, 3182–3190. doi: 10.1016/j.biocon.2009.08.022
Geist, V. (1998). Deer of the World: Their Evolution, Behavior and Ecology. Mechanicsburg, PA: Stackpole Books.
Graham, C. H., Elith, J., Hijmans, R. J., Guisan, A., Petersin, A. T., and Loiselle, B. A. (2008). The influence of spatial errors in species occurrence data used in distribution models. J. Appl. Ecol. 45, 239–247. doi: 10.1111/j.1365-2664.2007.01408.x
Gray, T. N. E., Brook, S. M., McShea, W. J., Mahood, S., Ranjitsingh, M. K., Miyunt, A., et al. (2015). The IUCN red list of threatened species. Rucervus eldii. 2015: e.T4265A22166803. doi: 10.2305/IUCN.UK.2015-2.RLTS.T4265A22166803.en
Hosmer, D.W. Jr., and Lemeshow, S. (2000). Applied Logistic Regression, 2nd Edn. New York, NY: Wiley.
ICEM (2003). Thailand National Report on Protected Areas and Development; Review of Protected Areas and Development in the Lower Mekong River Region. Indooroopilly, QLD: The International Center for Environmental Management (ICEM).
IPCC (2007). Climate Change 2007: Synthesis Report. Contribution of Working Groups I, II and III to the Fourth Assessment Report of the Intergovernmental Panel on Climate Change (IPCC). Geneva: The Intergovernmental Panel on Climate Change.
Kramer-Schadt, S., Niedballa, J., Pilgrim, J. D., Schröder, B., Lindenborn, J., Reinfelder, V., et al. (2013). The importance of correcting for sampling bias in MaxEnt species distribution models. Divers. Distrib. 19, 1366–1379. doi: 10.1111/ddi.12096
Lillesand, T. M., and Kiefer, R. W. (1987). Remote Sensing and Image Interpretation. New York, NY: John Wiley & Sons, Inc.
Liu, C., Berry, P. M., Dawson, T. P., and Pearson, R. G. (2005). Selecting thresholds of occurrence in the prediction of species distributions. Ecography 28, 385–393. doi: 10.1111/j.0906-7590.2005.03957.x
Lobo, J. M., Jiménez-Valverde, A., and Real, R. (2008). AUC: a misleading measure of the performance of predictive distribution models. Global Ecol. Biogeogr. 17, 145–151. doi: 10.1111/j.1466-8238.2007.00358.x
McShea, W. J., and Davies, S. J. (2011). “Seasonally dry forests of tropical Asia: an ecosystem adapted to seasonal drought, frequent fire and human activity,” in The Ecology and Conservation of Seasonally Dry Forests in Asia, eds W. J. McShea, S. J. Davies, and N. Bhumpakphan (Washington, DC: Rowman & Littlefield Publishers, Inc.), 1–9.
McShea, W. J., Koy, K., Clements, T., Johnson, A., Vongkhamheng, C., and Aung, M. (2005). Finding a needle in the haystack: regional analysis of suitable Eld's deer (Cervus eldii) forest in Southeast Asia. Biol. Conserv. 125, 101–110. doi: 10.1016/j.biocon.2005.03.013
McShea, W. J., Leimgruber, P., Aung, M., Monfort, S., and Wemmer, C. (1999). Range collapse of a tropical cervid (Cervus eldii) and the extent of remaining habitat in central Myanmar. Anim. Conserv. 2, 173–183. doi: 10.1111/j.1469-1795.1999.tb00063.x
Miles, L., Newton, A. C., De Fries, R. S., Ravilious, C., May, I., Blyth, S., et al. (2006). A global overview of the conservation of tropical dry forests. J. Biogeogr. 33, 491–505. doi: 10.1111/j.1365-2699.2005.01424.x
Myers, N., Mittermeier, R. A., Mittemeier, C. G., de Fonseca, G. A. B., and Kent, J. (2000). Biodiversity hotspots for conservation priorities. Nature 403, 853–858. doi: 10.1038/35002501
Nabhitabhata, J., and Chan-ard, T. (2005). Thailand Red Data: Mammals, Reptiles and Amphibians. Bangkok: Office of Natural Resources and Environmental Policy and Planning.
Neter, J., Wasserman, W., Nachtsheim, C. J., and Kutner, M. H. (1996). Applied Linear Regression Models, 3rd Edn. Chicago, IL: Irwin.
Peterson, A. T., Papes, M., and Eaton, M. (2007). Transferability and model evaluation in ecological niche modeling: a comparison of GARP and Maxent. Ecography 30, 550–560. doi: 10.1111/j.0906-7590.2007.05102.x
Phillips, S. J., Anderson, R. P., and Schapier, R. E. (2006). Maximum entropy modeling of species geographical distributions. Ecol. Modell. 190, 231–259. doi: 10.1016/j.ecolmodel.2005.03.026
Round, P. D. (1998). Wildlife, Habitats and Priorities for Conservation in Dong Khanthung Proposed National Biodiversity Conservation Area, Champasak Province. Vientiane: Department of Forestry.
Salter, R. E., and Sayer, J. A. (1986). The brow-antlered deer in Burma; its distribution and status. Oryx 20, 241–245. doi: 10.1017/S0030605300020287
Santisuk, T., Smitinand, T., Hoamuangkaew, W., Ashton, P., Sohmer, S. H., and Vincent, J. R. (1991). Plants for Our Future: Botanical Research and Conservation Needs in Thailand. Bangkok: Royal Forest Department.
Secretariat of the Convention on Biological Diversity (2012). Strategic Plan for Biodiversity 2011–2020 and the Aichi Targets. Aichi Target. Newsletter 1. Available online at: https://www.cbd.int/doc/strategic-plan/2011-2020/Aichi-Targets-EN.pdf
Sodhi, N. S., Koh, L. P., Brooks, B. W., and Ng, P. K. L. (2004). Southeast Asian biodiversity: an impending disaster. Trends Ecol. Evol. 19, 654–660. doi: 10.1016/j.tree.2004.09.006
Stoms, D. M. (1992). Effects of habitat map generalization in biodiversity assessment. Photogramm. Eng. Remote Sens. 58, 1587–1591.
Suzuki, A., Thong, S., Tan, S., and Iwata, A. (2017). Camera trapping of large mammals in Chhep Wildlife Sanctuary, northern Cambodia. Cambodia J. Nat. Hist. 1, 63–75. Available online at: https://www.asafas.kyoto-u.ac.jp/MAIN/wp-content/uploads/2017/08/Suzuki-et-al.-2017.pdf
Tognelli, M. F., Roig-Junent, S. A., Marvald, A. E., Flores, G. E., and Lobo, J. M. (2009). An evaluation of methods for modeling distribution of Patagonian insects. Rev. Chile. Hist. Nat. 82, 347–360. doi: 10.4067/S0716-078X2009000300003
Trisurat, Y. (2006). Trans-boundary biodiversity conservation of the pha taem protected forest complex: a bioregional approach. Appl. Geogr. 26, 260–275. doi: 10.1016/j.apgeog.2006.09.010
Trisurat, Y. (2007). Applying gap analysis and a comparison index to assess protected areas in Thailand. Environ. Manage. 39, 235–245. doi: 10.1007/s00267-005-0355-3
Trisurat, Y. (2010). GIS Database Technical Final Report, The Emerald Triangle Protected Forests Complex to Promote Trans-boundary Biodiversity Conservation between Thailand, Cambodia and Laos Project (Phase II). Bangkok: Royal Forest Department/International Tropical Timber Organization.
Trisurat, Y., Bhumpakphan, N., Kalyawongsa, S., Boonsermsuk, S., Wisupakan, K., and Dechyosdee, U. (2014a). Predicting land use and land-cover patterns driven by different scenarios in the Emerald Triangle Protected Forests Complex. Thai J. For. 33, 56–74. Available online at: http://bioff.forest.ku.ac.th/PDF_FILE/JAN_2015/11.pdf
Trisurat, Y., Kanchanasaka, B., and Krefft, H. (2014b). Assessing potential effects of land use and climate change on mammal distributions in northern Thailand. Wildlife Res. 41, 522–536. doi: 10.1071/WR14171
Trisurat, Y., Pattanavibool, A., Gale, A., and Reed, R. H. (2010). Improving the viability of large mammal populations using landscape indices for conservation planning. Wildlife Res. 36, 401–412. doi: 10.1071/WR09110
Trisurat, Y., and Toxopeus, A. G. (2011). “Modeling species distribution” in Land Use, Climate Change and Biodiversity Modeling: Perspectives and Applications, eds Y. Trisurat, R. P. Shrestha, and R. Alkemade (Pennsylvania, PA: IGI Global), 171–198.
Weiler, H. (2005). “Survey and Conservation of Siamese Eld's deer in Cambodia,” in Proceedings Thai Wildlife Seminar 25th, December 2004 (Bangkok: Kasetsart University; Department of National Park, Wildlife and Plant Conservation & Wildlife Conservation Society).
Wikramanayake, E., Dinerstein, E., Loucks, C. J., Olson, D. M., Morrison, J., Lamoreux, J., et al. (2002). Terrestrial Ecoregions of the Indo-Pacific: A Conservation Assessment. Washington, DC: Island Press.
Williams, S. E., and Middleton, J. (2008). Climate seasonality, resource bottlenecks and abundance of rainforest birds: implications for global climate change. Divers. Distrib. 14, 69–77. doi: 10.1111/j.1472-4642.2007.00418.x
Keywords: Emerald Triangle Protected Forests Complex, range shift, Siamese Eld's deer, Rucervus eldii siamensis, distribution model, suitable habitat, transboundary biodiversity conservation area
Citation: Trisurat Y and Bhumpakphan N (2018) Effects of Land Use and Climate Change on Siamese Eld's Deer (Rucervus eldii siamensis) Distribution in the Transboundary Conservation Area in Thailand, Cambodia, and Lao PDR. Front. Environ. Sci. 6:35. doi: 10.3389/fenvs.2018.00035
Received: 05 December 2017; Accepted: 09 May 2018;
Published: 29 May 2018.
Edited by:
Nophea Sasaki, Asian Institute of Technology, ThailandCopyright © 2018 Trisurat and Bhumpakphan. This is an open-access article distributed under the terms of the Creative Commons Attribution License (CC BY). The use, distribution or reproduction in other forums is permitted, provided the original author(s) and the copyright owner are credited and that the original publication in this journal is cited, in accordance with accepted academic practice. No use, distribution or reproduction is permitted which does not comply with these terms.
*Correspondence: Yongyut Trisurat, fforyyt@ku.ac.th