Dynamic planning of edge sensing terminals in distribution network supporting distributed resources observable and controllable
 Xiaotong Ji1
  Yanyu Yan
- 1State Grid Hubei Electric Power Co. Ltd., Wuhan, China
- 2State Grid Hubei Electric Power Research Institute, Wuhan, China
- 3Key Laboratory of Intelligent Power Grid Ministry of Education, Tianjin University, Tianjin, China
With the advancement of low-carbon distribution networks, the heightened stochasticity introduced by a multitude of renewable energy sources in the power grid has significantly augmented the regulatory challenges faced by the power grid. Dispatching distributed resources emerges as an effective solution to this issue. However, these resources often lack observability and controllability, hindering their participation in power regulation services. To establish a reliable interaction between distributed resources and power grids, the deployment of numerous edge sensing terminals becomes essential, albeit incurring high costs. In light of this, our paper proposes a dynamic network planning method for edge sensing terminals based on node differentiation and resource observability criteria, aiming to facilitate real-time and dependable observation of distributed resources. Initially, the node weight, a metric to gauge the disparity among nodes, is computed, considering communication quality deviation, resource development synergy, and the distribution of distributed resources. Subsequently, an optimal configuration method is introduced, accounting for the terminal’s reliability under faults. Lastly, a method for dynamic terminal networking planning is presented, gradually reducing the depth of unobservable resources. An enhanced genetic algorithm is employed to address this challenge. This method was validated using an IEEE 33 node system and a 91 node actual system, demonstrating significant effectiveness in reducing terminal configuration costs.
1 Introduction
Due to the continuous depletion of traditional energy sources, nations worldwide are actively seeking alternative energy sources. The power system views wind energy, solar energy, and other forms of renewable power generation as the vital means to alleviate strain on conventional resources. With the establishment of low-carbon power grids and the proliferation of diverse loads, a substantial number of distributed photovoltaic systems, electric vehicle charging stations, and flexible controllable loads are interconnected with the power grid. The transformation from a traditional passive power grid to an active one is underway, accompanied by an increasing demand for power control and energy efficiency management within the distribution network (Fambri et al., 2022; Kong et al., 2022; Nouri et al., 2022; Kong et al., 2023). In the power system, robust sensing of distributed resources in the distribution network can facilitate various services such as dispatching, frequency modulation, demand response, and standby services, thereby enhancing the stability and security of the power system (Ji et al., 2018; Ferreira et al., 2020; Yang et al., 2022). Insufficient sensing may result in control delays, errors, or inadequate fault response, jeopardizing the overall stability of the system. The conventional centralized sensing system encounters challenges such as an extensive array of devices, diverse services, challenging communication environments, limited bandwidth, and certain devices being unmeasurable remotely. Consequently, it falls short of effectively achieving accurate panoramic sensing of distributed resources in the distribution network (Bangjun et al., 2022). The emerging sensing architecture based on edge sensing terminals provides a promising solution to these challenges. However, the characteristics of distributed generation, namely, small capacity, numerous installations, and scattered locations, necessitate the deployment of a considerable number of new edge sensing terminals, incurring high costs. To address these issues, there is an urgent requirement to propose a sensing terminal network planning technology that can efficiently reduce the configuration costs of sensing terminals within the new distributed intelligent sensing system of low-voltage power grids. This technology aims to support the reliable monitoring of distributed resources and facilitate the intelligent and digital transformation of medium- and low-voltage power grids.
Due to the recent emergence of edge sensing terminal products, there has been relatively limited research on their optimized layout both domestically and internationally. However, the principles and model-solving methods for their optimized layout bear similarity to those of other secondary information system terminals in distribution networks, such as feeder terminal units (FTUs) and synchronous phasor measurement units (PMUs). Wang (2019) calculated the probability of node voltage exceeding the limit using the probability model of load and distributed power output, establishing a PMU configuration planning model based on this weight. Li and Lu (2018) combined a state estimation method with a parallel belief propagation algorithm to establish a PMU measurement position optimization model, aiming to minimize the state estimation error of active distribution networks. The improved immune discrete particle swarm optimization algorithm was employed to solve the problem. Xu et al. (2015) employed an improved matrix to design a greedy algorithm with polynomial time computational efficiency, enhancing the power grid’s self-healing ability but without due consideration for economic factors. Babu et al. (2020) considered key components and key buses, proposing an optimal terminal configuration algorithm that takes into account the optimal substation and key components. Chen et al. (2019) constructed a switch optimization configuration model, aiming to minimize the sum of user outage loss and switch configuration life cycle cost, constrained by power supply reliability. Liu et al. (2020) proposed a bi-level optimization method for terminal configuration that addressed the significant dimensional differences in multiple indicators within existing configuration models. The upper optimization model determines the installation position of the distribution terminal, while the lower optimization model determines the installation type of the distribution terminal. Kong et al. (2019) suggested the use of the generalized Tellegen's theorem to analyze the economic indicators and robustness of the bus and branch of the power grid, addressing the configuration of measuring points, considering both the entire network and the N-1 situation. From the perspective of real-time identification and localization of fault transmission lines in distribution networks, Ding et al. (2021) determined the minimum number and configuration positions of PMUs with sufficient accuracy to achieve global observability, thereby facilitating network self-healing. Zhao et al. (2019) proposed a linear programming model for distributed state estimation, simultaneously considering PMUs, phasor data concentrator (PDC), and optimal prevention of communication connections, enhancing the state estimation in large-scale active distribution networks. Kong et al. (2024) focused on the impact of flexible resources on power grid frequency regulation and introduced an information physical system planning method considering the multidimensional uncertainty of virtual power plants. This method addresses the optimal solution for coordinating flexible resource pool composition, edge sensing terminal allocation, and communication. However, these studies often treat all nodes equally during configuration, overlooking the differences among individual nodes. When configuring edge terminals, the distribution of distributed resources directly impacts communication quality. Each node in the network holds a distinct status and should not be considered as an equally important factor. Additionally, existing research primarily focuses on one-time planning, falling short of achieving dynamic adaptive network planning.
The characteristics of small capacity, a large number, and scattered installation locations of distributed power supply necessitate the configuration of a considerable number of new edge sensing terminals, incurring high costs. Given the substantial one-time investment, it is often imperative to plan in stages. Numerous studies have addressed the phased planning of secondary information system terminals in the distribution network. Yi et al. (2023) proposed a monitoring criticality evaluation system based on the frequency-coupled impedance model of wind turbines. This system considers differences in importance between the evaluation indexes and probability of occurrence of oscillation conditions. A multistage optimal configuration model for subsynchronous phasor measurement units (SPMUs) is established, taking into account the criticality of node monitoring. The multistage optimal configuration scheme is solved using integer linear programming. Zeng et al. (2021) divided the PMU configuration into two stages. Indicators such as the correlation degree, tightness, and importance of the distribution network are utilized to derive the node centrality index of the distribution network. The first stage configuration is formed by combining the maximum observability under the constraint of the number of configurations. The second stage configuration scheme is formulated by employing multi-objective optimization, considering the minimum number of configurations and the minimum average interval width. Xi et al. (2022) determined critical loads based on the fast voltage stability index to monitor key buses. A phased decision on PMU positions was made using the modified analytic hierarchy process, comprehensively considering various observability indicators to rank the PMU buses. Razavi et al. (2018) introduced a mathematical linear model of probabilistic multistage PMU configuration that considers changes in network topology caused by long-term expansion during the planning period. Ali et al. (2018) proposed a mathematical linear expansion model of probabilistic multistage PMU configuration, considering the constraints of zero-injection nodes and communication channels. An auxiliary optimization technique, not accounting for the prevalence of each planning stage, ensured obtaining the global optimal solution in a broader and more comprehensive search space. Razavi et al. (2020) explored a multi-level PMU placement model under probabilistic and deterministic frameworks, reflecting a more realistic image of power system observability through the concept of probabilistic observability, thereby providing a more complete search space for optimization problems. Khare et al. (2021) aimed to reduce network vulnerability of the power system to network attacks by using forward dynamic programming to allocate the capital cost of PMUs over time. This approach ensures the critical observability of the grid in the first stage and increases the observability level in subsequent stages. While the above methods are rooted in observability, their different observation objects and criteria hinder direct application to achieve the observability and controllability of distributed resources. Additionally, these methods face challenges in coordinating with the expansion of distributed resources.
While the aforementioned research lays a theoretical foundation for observability, observation reliability, and economy discussed in this study, the terminal configuration of the distribution network primarily centers on the configuration of PMUs, FTUs, and similar elements. The overarching objective is to achieve observability across all nodes of the distribution network, with limited emphasis on edge sensing terminals responsible for sensing distributed resources. This lack of focus on edge sensing terminals can significantly impact the observable model. Furthermore, in practical engineering applications, a single terminal is often tasked with communicating with multiple distributed resources. The numerous challenges posed by these resources, such as their scattered locations, diverse types, substantial differences in data volume, extended communication distances, and random interference in communication links, can result in deviations in communication quality. These deviations, in turn, impede the reliability of data acquisition. In the realm of terminal configuration, it is essential to recognize that each node in the network holds a unique status and should not be treated as an equally important factor. Existing research tends to overlook the variations in communication quality and development potential among individual nodes within the system. It fails to prioritize the reliable observation requirements of high-risk nodes and lacks the capability to effectively cooperate with the expansion of distributed resources.
Therefore, in addressing the aforementioned challenges, this study introduces a distributed intelligent sensing system designed to enhance the observability and controllability of medium- and low-voltage distributed resources. The system aims to overcome issues such as scattered installation positions, random output, and communication congestion within distributed resources, ultimately supporting the comprehensive observability of these resources. Given the current state of research on terminal configuration, distribution system nodes are typically treated as entirely indistinguishable 0-1 variables. To address this limitation, this article takes into account the transformative impact of renewable energy on the distribution system. It considers differences in distributed resource distribution, communication quality disparities induced by the terrain, and the potential for future construction of distributed resources. Recognizing the distinctions between various nodes, a weight model is established to more effectively reflect the rationale behind the configuration. This study proposes a multistage planning method designed to gradually reduce the depth of unobservability. The objective is to guide the dynamic distributed networking of sensing terminals, acknowledging the challenges associated with the inability of a one-time edge sensing terminal configuration to meet the continuous expansion of distributed resources and adhere to funding constraints. The specific contributions of this research are outlined as follows:
1) The introduction of a distributed intelligent sensing system is proposed to tackle the challenges related to data transmission congestion and heightened burden on the main station within an intelligent sensing system encompassing numerous distributed power sources. This system leverages edge sensing terminals for preprocessing and compressing information, thereby enhancing the observability and controllability of resources.
2) In response to the complexities arising from diverse and widely distributed types of distributed resources, which lead to varying communication quality and distribution among nodes in the distribution network, and considering the high cost associated with overlooking resource potential, this research employs indicators such as node degree, resource development synergy, and communication severity as node weights in the optimization process.
3) Addressing the challenge of a high initial investment cost and the incapacity to adapt to the controllable expansion of distributed resources during configuration, a terminal dynamic networking method is proposed. This method aims to systematically reduce the depth of unobservability of resources and attain an optimal configuration sorting of equipment over time.
In Section 2, an intelligent sensing system supporting a multi-service distributed low-voltage power grid is proposed. In Section 3, a one-time configuration optimization method based on node weight is developed. Section 4 develops a multistage optimal configuration method. Section 5 tests the method, and the conclusion is given in Section 6.
2 Low-voltage distributed sensing system of digital power grids
2.1 Distributed smart sensing system
To achieve substantial and controllable support for a vast number of medium- and low-voltage distributed resources, especially following the integration of a high proportion of distributed generation, enabling efficient interaction with the power grid for participation in services such as dispatching, frequency modulation, and demand response, while addressing the heightened uncertainties introduced by a large volume of distributed generation and the increasing load on the power grid, an intelligent sensing system is proposed. This system is designed to support multi-service distributed low-voltage power grids. Figure 1 illustrates the architecture of the distributed intelligent sensing system for low-voltage power grids comprising four layers: the physical resource layer, terminal sensing layer, communication access layer, and cloud platform layer. This system facilitates the digital transformation of low-voltage power grids, providing robust support for various services such as power equipment condition monitoring and information energy management.
1) Physical resource layer: the low-voltage power grid, following extensive integration of distributed power sources, encompasses diverse distributed source–load–storage resources categorized into three main groups. The power-side resources exhibit coordinated and complementary characteristics, incorporating distributed photovoltaic and wind turbines. The load-side resources possess flexibility, distribution, and adjustability, typically involving terminal loads such as buildings and air conditioners. Energy storage-side resources include electric vehicles and base station energy storage, among others.
2) Terminal sensing layer (user sensing): this layer primarily comprises smart meters, low-voltage data monitoring terminals, intelligent inverters, and environmental sensors. These devices are tasked with collecting, uploading, and receiving superior control commands. They play a crucial role in gathering a diverse set of information indicators to fulfill multi-service requirements.
3) End sensing layer (edge computing side): this layer predominantly consists of wired or wireless edge sensing terminals. The edge computing method is employed to achieve regional autonomy functions, such as the plug-and-play capability of intelligent terminals, local analysis of collected data, and on-site processing of services. Notably, the intelligent edge sensing terminal serves as a crucial data support apparatus for medium- and low-voltage power grids with a high proportion of distributed power access. It is capable of analyzing and processing the received raw data, thereby alleviating the data processing burden on the server or cloud server. The intelligent edge sensing terminal stands as the core component of the sensing system.
4) Local communication layer: this layer is primarily responsible for transmitting the collected data to terminal equipment, employing wired transmission through RS232/RS485. Both wired transmission methods meet the majority of requirements for bandwidth, delay, and reliability. Consequently, buildings and air conditioning systems can leverage existing communication lines, in conjunction with the original wiring of the distribution network, to accomplish information collection. However, for resources like photovoltaic systems, wind turbines, electric vehicles, and others characterized by significant capacity differences, frequent location changes, and diverse types, additional wiring is impractical and wasteful. As a result, wireless communication serves as the primary method. Sensing terminals and monitoring equipment require two-way communication, and high-performance low power consumption (HPLC) + micro-power wireless communication is a suitable choice. This communication method adopts a dual-mode communication approach, enhancing communication coverage and reliability and facilitating automatic integration into a two-channel network. Additionally, long-range radio (LORA) wireless technology presents itself as a viable option for wireless communication due to its low power consumption, robust anti-interference capabilities, and minimal noise.
5) Remote communication layer: this layer manages communication between the terminal equipment and cloud platform, encompassing technologies such as industrial Ethernet, 4G/5G communication, and Ethernet passive optical network (EPON). Public network communication through 4G/5G operators is relatively convenient, yet the internet access rate may be lower (Fang et al., 2020). On the other hand, EPON technology, with its maturity, large capacity, and high security and reliability, proves suitable for scenarios with high reliability requirements, providing support for high bandwidth and low latency (Babaei et al., 2019).
6) Cloud platform layer: this layer encompasses the Internet of Things (IoT) management platform, technology platform, data platform, business platform, and application layer. The IoT management platform facilitates standardized and unified access, authentication, and protocol adaptation for intelligent terminal equipment and edge computing devices. The technology platform serves to provide public technical services. The data platform is responsible for realizing data fusion, storage, and analysis within the IoT system. The business platform is utilized for implementing services such as topology, graphics, and model services. Finally, the application layer integrates hierarchical distributed control, protection, self-healing control, panoramic simulation, and other functionalities to achieve specific business applications.
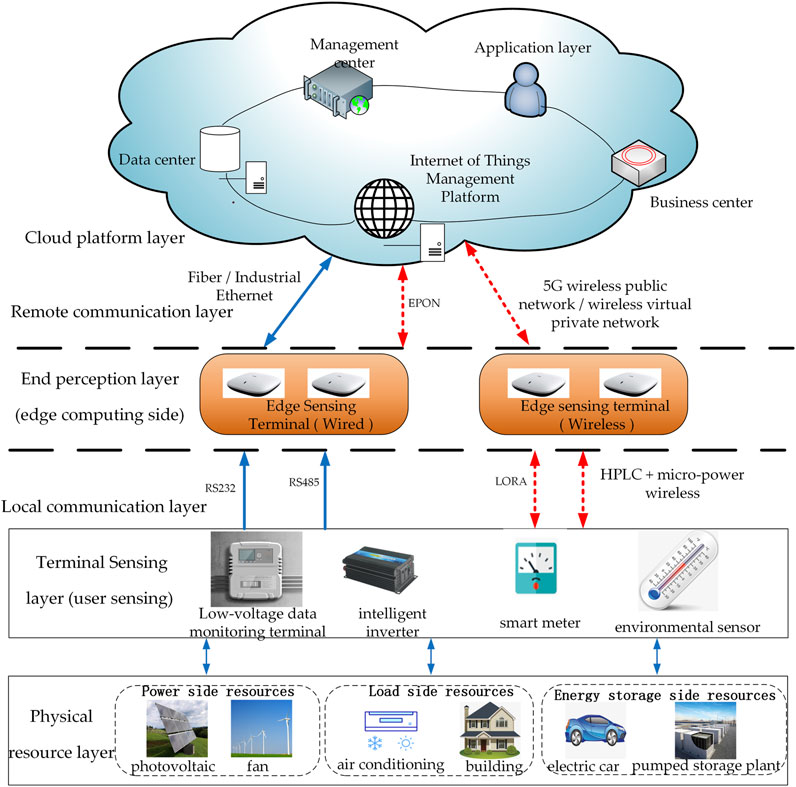
FIGURE 1. Distributed resource intelligent sensing system.
Through this distributed resource intelligent sensing system, a precise panoramic perception of distributed resources can be achieved, providing ample data support for scheduling distributed resources. The cloud platform layer can more accurately regulate distributed resources. For instance, as distributed resources become more prevalent, congestion issues may arise in the distribution network. Hence, the inherent coupling relationship between various energy carriers can be explored, and renewable energy generation can be optimized through the complementary consumption of electricity, heat, and cold. Leveraging the complementarity of various energy sources can help address distribution network congestion (Hu et al., 2021). The cloud platform layer is also capable of conducting day-ahead and real-time scheduling on a multi-energy system composed of multiple energy entities. By adapting to the distributed execution, asynchronous communication, and independent computing characteristics of the system, event-triggered distributed algorithms (Li et al., 2018) are employed to account for the different time-scale characteristics of electricity and thermal power. This approach achieves the goal of managing smooth real-time load changes and renewable resource fluctuations while considering the reduction of communication costs (Zhang et al., 2021). In specific scenarios, such a system can play a crucial role in scheduling distributed resources. For instance, in isolated islands where the inverse distribution of resources and limited energy transmission are the factors, adaptive energy management can be accomplished through reinforcement learning based on hybrid strategies to govern the energy of island clusters (Yang et al., 2023). Therefore, with a panoramic perception of distributed resources, the regulation of renewable energy can be more precise and effective, facilitating the interconnection and interaction between sources, networks, loads, and storage.
2.2 Distributed resource observability criterion considering edge sensing terminal distribution and fault
Ensuring comprehensive data monitoring is essential for the effective control of diverse distributed resources. When the visibility of distributed resources is optimized, cloud platforms can efficiently manage and regulate a substantial volume of distributed resources. The inherent characteristics of small capacity, large quantity, and dispersed installation locations of distributed energy resources necessitate the configuration of numerous new edge sensing terminals, incurring high costs. Therefore, it becomes imperative to devise an effective method to mitigate the configuration cost of edge sensing terminals. This is essential to support the reliable monitoring of distributed resources, as well as the intelligent and digitized transformation of medium- and low-voltage grids, along with other related technologies.
To achieve efficient and reliable monitoring of distributed resources, optimizing the configuration of edge sensing terminals based on the proposed sensing architecture in this study is crucial. This optimization aims to enhance the controllability and visibility of distributed resources. Consequently, it is imperative to introduce a distributed resource visibility criterion based on the distribution of edge sensing terminals. When optimizing the configuration of measurement devices such as PMUs in the power grid, invisibility depth is commonly employed to describe the sensing capability of the distribution network. Hence, this study also introduces a criterion based on invisibility depth. The invisibility depth of a distributed resource indicates whether it is monitored by edge sensing terminals. This depth is influenced by factors such as the position, quantity, type, and communication conditions of edge sensing terminals concerning each distributed resource. This study quantifies the visibility of distributed resources based on their invisibility depth, and the corresponding formula is detailed in Eq. 1. In this study, the observability of distributed resources is gauged by the unobservable depth, as expressed in Eq. 1. The significance of this unobservable depth extends beyond describing the observability of distributed resources; it is also instrumental in analyzing the observability of distributed resources under terminal failure.
In the formula,
Edge sensing terminals are susceptible to failures during operation due to their extended operating time, remote communication distances, and high processing demands. When a fault occurs, it can lead to the loss of monitoring and measurement data for connected distributed resources, impeding reliable resource interaction. Consequently, during the configuration of edge sensing terminals, it is essential to ensure that certain visibility requirements are met, even in the event of equipment failure, with the goal of minimizing losses caused by faults.
Considering the relatively low failure rate of edge sensing terminals and the presence of maintenance personnel capable of promptly repairing faults, the likelihood of multiple edge sensing terminals failing simultaneously is exceedingly low. In this model, only the scenario of a single edge sensing terminal failure is considered, corresponding to N − 1 reliability.
Assuming X vector represents the configuration plan of edge sensing terminals (Eq. 3),
In the equation,
Let the number of edge sensing terminals installed be N (Eq. 4).
If a single edge sensing terminal fails, there are N possible types of failures, and the set of failures can be represented as follows (Eq. 5):
In the equation,
When planning the configuration, consider O as the set of faulty edge sensing terminals.
Let Zi,j be the connection status between edge sensing terminals and distributed resources when no fault occurs, where 1 report that edge sensing terminal i is connected to the distributed resource j; otherwise, no connection exists. After a fault occurs, the cloud platform layer receives the fault information and feeds it back to each terminal. Each terminal then reallocates and reconnects the distributed resources to maximize coverage, with the connection status updated to
However, due to constraints on the number of connections and distances, it cannot be guaranteed that all distributed resources are still observable at this time. The distributed resources that have not established communication with any edge sensing terminal are denoted as
The depth of unobservability during a fault can be represented as follows (Eq. 8):
3 The optimization method for configuring distribution network edge sensing terminals considering node weights
The second section introduced an intelligent sensing system designed to support multi-business distributed operations in low-voltage power grids. Given the high cost associated with configuring a considerable number of new edge sensing terminals, it becomes imperative to propose a configuration optimization method capable of effectively reducing terminal configuration expenses. The proposed approach begins with the development of a distribution network node weight calculation method based on monitoring distributed resources. These weights serve as crucial parameters in the planning of each node’s terminal configuration. Subsequently, the section outlined the establishment of configuration constraints and objective function models for the terminal under both normal operation and fault conditions. To address this optimization problem, an improved genetic algorithm is employed for solution derivation.
3.1 Node weight degree
1) Node degree
In the distribution network, varying installation locations of distributed resources result in distinct levels of node importance. The node degree index serves as an indicator of the installation status of distributed resources around a specific node. For a given node, a higher node degree value implies a greater number of distributed resources installed in its vicinity. While conventional configuration methods are more likely to be applied in such cases, they concurrently increase the terminal failure rate for the node, thereby amplifying the risk associated with uncontrollable resources.
The definition of node degree
In the above equations,
2) Resource development synergy
During terminal configuration, it is crucial to thoroughly assess the potential for the development of distributed resources and integrate future plans into the configuration process. This study focuses on distributed resources, using photovoltaic power plants as an illustrative example. The power generation of photovoltaic power stations is intricately linked to the intensity of solar radiation, with higher radiation intensity corresponding to increased power generation. Consequently, areas with abundant sunlight exhibit a greater likelihood of future photovoltaic power station construction. By strategically configuring edge sensing terminals near these areas, it becomes possible to directly engage with resources following the construction of new photovoltaic power stations in the future, thus obviating the requirement for additional edge sensing terminals.
The initial step involves calculating the global total monthly average solar radiation (G0) (Duffie and Beckman, 2013). The calculation formula is as follows (Eqs 11, 12):
In the above formulae, G0 is the global solar radiation, unit J/m2; I0 is the solar constant; f is the correction factor for the solar distance;
The solar energy received by the object on the inclined surface is given by
In the above formulae,
The underlying assumption in this study posits that the solar panels in a photovoltaic power station consistently maintain a perpendicular orientation to the Sun’s rays. Nodes characterized by higher irradiation intensity signify a greater potential for future installations of new photovoltaic power stations in their vicinity. Consequently, if an edge sensing terminal is deployed at such a node, additional terminals are not required after the construction of new photovoltaic power stations.
Resource development synergy
3) Badness of communication
The effectiveness of perception can be significantly influenced by the communication quality between edge sensing terminals and distributed resources. However, variations in terrain and distances can introduce differences in communication quality. In practical engineering scenarios, it is advisable to prioritize nodes with minimal communication quality loss when configuring terminals. To predict the wireless transmission quality in urban and surrounding areas, the Okumura model is employed, providing an analytical formula for the median path loss in different terrains (Eq. 16):
In the formula,
Small- and medium-sized towns (Eq. 17):
Suburbs + correction factor (Eq. 20):
Add correction factor to the open ground (Eq. 21):
In the distribution network area, different terrains will cause differences in communication quality. The communication quality of each node in the maximum working distance communication (
Considering the
The three aforementioned indicators are treated as attributes, transforming the problem into a decision scenario with multiple attributes (Yu et al., 2013). Utilizing the entropy method, weights are assigned to the three indicators, assessing their roles and proportions.
Entropy, as an index measuring the disorder state of the system, reflects an increase in the disorder degree and the divergence between the state quantities within the system. Consequently, the entropy value serves to weigh the significance of a single index in the comprehensive node index. The entropy value for index j is defined in Eq. 23
In the formulae, n represents the number of distribution network nodes,
By using entropy to calculate the objective weight of the index, the differences in the degree of the nodes in the system under the index can be revealed, which has a more significant impact on the measurement of the comprehensive index. The weight
After obtaining the weight, the weight of the node
3.2 Objective function
Economic considerations take precedence in the planning problem, with costs comprising that of both investment and operation, as well as maintenance expenses, constituting the life cycle cost. The optimized objective function is formulated as Eq. 25
In the formula,
1) Operation and maintenance cost
The service life of edge sensing terminals is limited. In practical applications, variations in the number of distributed resources and the volume of connected data lead to distinct failure rates and lifetimes of edge sensing terminals (Ge et al., 2021). The operation and maintenance cost is determined by Eq. 26:
In the formula,
In the formula,
In the formula,
2) Investment cost
The investment cost
In the above formulae,
In the above formulae,
3.3 Constraint condition
The optimal configuration model for the terminals is subject to various constraints, outlined as follows:
1) Connection number constraint
The terminal’s capacity to connect with distributed resources is limited, and to prevent underutilization, the terminal must cater to at least one distributed resource. This constraint is expressed as Eq. 33:
2) Observability constraint
When all edge sensing terminals are functioning normally, it is required that all distributed resources be fully observable, that is, the unobservable depth is 0. Simultaneously, to prevent redundancy, each distributed resource should only be connected to one terminal. This constraint is expressed as Eqs 34, 35:
In the case of an O fault set, the unobservable depth is required to be less than
3) Communication distance constraint
In the intelligent sensing system described in the second section, a bidirectional connection can be established between the edge sensing terminal and the distributed resources through wireless communication. In practical applications, the distance between the edge sensing terminal and the distributed resource should not exceed the optimal communication range. The constraints are as Eq. 37:
4) Maximum quantity limit
Due to the spatial constraints of the distribution network, the number of terminals is limited as Eq. 38:
In the formula,
5) Maximum quantity limit
In this study, all terminals are configured on nodes, and each node is configured with a maximum of one terminal (Eq. 39).
In the formula,
3.4 Configuration process and solution method
Firstly, the index for evaluating the weight of each node is determined, and the comprehensive weight of the index is calculated using the entropy method. Subsequently, the comprehensive node weight of each node is calculated to optimize the terminal configuration. In this study, an improved adaptive genetic algorithm is employed as the solution algorithm. The fitness function for the edge sensing terminal optimization configuration problem is Eq. 40
The key steps in the genetic algorithm include selection, crossover, and mutation. In the selection process, the roulette method is employed, favoring the selection of excellent individuals. Let the crossover probability of global search be denoted as Pc, and the mutation probability of local search as Pm. The calculation formulas for crossover probability and genetic probability are as Eq. 41:
In the formulae,
If the average fitness value is equal to the maximum fitness value, the upper limit is chosen as the crossover probability, and the intermediate value is selected as the mutation probability. Such a choice can maintain a favorable evolutionary trend and simplify the mathematical calculation process. The solution process for the optimal configuration of the edge sensing terminal is illustrated in Figure 2.
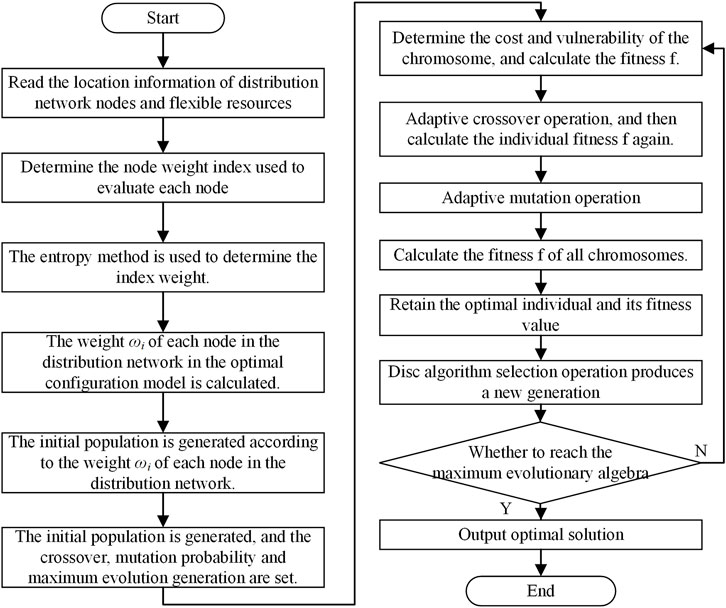
FIGURE 2. Edge sensing terminal optimization configuration solution flow chart.
4 Dynamic networking method of sensing terminal coordinated with controllable distributed resource expansion plan
The third section discussed the one-time configuration of edge sensing terminals considering node weights. However, it currently lacks the ability to dynamically adapt to changes in the network based on power grid planning, ensuring comprehensive information sensing under evolving conditions. As the integration of renewable energy and load demand rises, the demand for distributed controllable resources increases, leading to a continuous process of resource expansion. In practical engineering applications, more distributed resources are progressively integrated, forming a multistage resource planning selection process, as discussed in Liang and Ma (2021). Due to the characteristics of small capacity, large quantity, and scattered installation locations, newly constructed distributed resources must be gradually incorporated into the observable and controllable range of the power system. Additionally, financial constraints may limit the immediate configuration of edge sensing terminals for perceiving distributed resources, making it more feasible to install new terminals in multiple stages. Considering these aspects, configuring all distributed resources at once to achieve complete observability and controllability is not realistic. Hence, there is a pressing requirement for research on dynamic perception networking technology. The term “dynamic” implies the ability to stagewise configure edge sensing terminals according to plans for expanding distributed resources and the limitations of current terminal configuration funds. This ensures the maximum unobservable depth for each stage, obtaining the optimal ranking of configuration terminals for each stage and gradually expanding the perception of controllable distributed resources.
4.1 Dynamic networking model construction
The power company provides an advance comprehensive plan for the expansion of distributed resources in a specific area and derives the edge sensing terminal configuration scheme based on the planned solution for distributed resources. However, owing to the substantial volume of one-time construction, the expansion of distributed resources and the configuration of edge sensing terminals must be executed in batches according to the plan. Let the state variable indicate whether a specific location in the distributed resource scheme is extended to include sensing (Eq. 42).
In the formula, Y represents the construction scheme of all distributed resources.
The state variable
In the optimal configuration of the phased edge sensing terminal, it is necessary to minimize the unobservable depth of the distributed resource under the condition of fixed cost. In the case that the distributed resource j has to be included in the expansion, that is,
Assuming that the distributed resource planning is divided into q stages, the objective function of the dynamic networking model of the sensing terminal is Eq. 44
In the formula, Se is the terminal configuration before the current stage, where the element is defined as the same formula Eq. 44), S0 = 0; Xe is the decision variable phasor of the single-stage configuration edge terminal, which is defined in the same form Eq. 44);
The decision variable
In the formula, X represents the edge sensing terminal configuration scheme when the power company’s distributed resource construction scheme is Y.
The constraints of the model are as follows:
1) Cost constraints
The cost of each stage must not surpass the maximum value (Eqs 46, 47).
In the formulae,
2) State variable constraints
3) Connection number constraint
All edge sensing terminals must provide services for at least one distributed resource (Eq. 49).
In the formula,
4) The number of monitored constraints
Each distributed resource should be connected by only one edge sensing terminal, and the constraints are expressed as Eqs 50, 51:
In the formulae,
5) Communication distance constraint
The distance between the edge sensing terminal and distributed resources should not exceed the ideal range of communication (Eq. 52).
6) Maximum quantity limit
Due to the spatial limitations of the distribution network, there are certain constraints on the number of edge sensing terminals (Eq. 53).
In the formula,
4.2 Configuration process and solution method
In the dynamic networking of edge sensing terminals, the adaptive genetic algorithm is still employed. Initially, the comprehensive weight of each index is calculated based on the final distributed resource expansion plan. Subsequently, the weight index of each node is determined considering the overall weight of the nodes. The final configuration scheme X for edge sensing terminals is then obtained. Following this, iterative solutions using the genetic algorithm are performed according to the distributed resource expansion plan for each stage. The goal is to obtain the edge sensing terminal configuration scheme that minimizes the unobservable depth of distributed resources and establishes connections with them.
When applying the genetic algorithm to address the problem, the fitness function for the edge sensing terminal dynamic networking configuration problem is expressed as Eq. 54
The dynamic network configuration of edge sensing terminals is solved using the adaptive genetic algorithm, as illustrated in Figure 3.
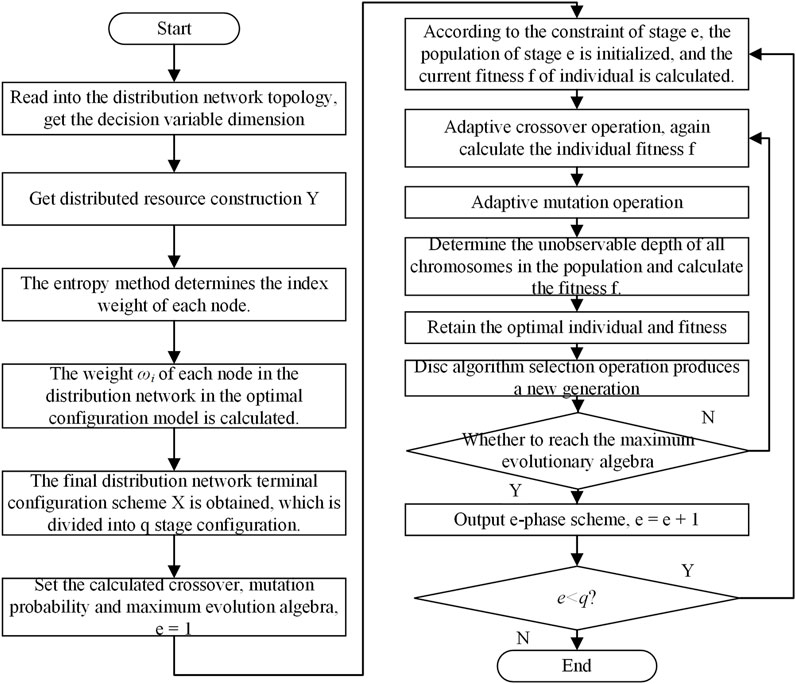
FIGURE 3. Sensing terminal dynamic networking solution flow chart.
5 Case study
5.1 IEEE 33 node system
The optimal configuration method for edge sensing terminals, as proposed, is implemented and validated on the IEEE 33-bus system and the Hubei Guangshui Ten North I loop 408 system using the model and solution approach outlined in this article, with verification performed through the MATLAB software.
The mathematical model parameters are detailed in Supplementary Data SA1, and certain parameters within it are chosen based on Ge et al. (2021). When determining resource development synergy, parameters are selected according to KLEIN (1976). For this study, the typical day parameters from March 16 are used, with the latitude setting for node 1 at 40° north latitude. Due to the small size of the IEEE-33 node system, the nodes are categorized as follows to reflect differences in the weight index of each node: nodes 1–5 and 19–22 are quasi-smooth terrain of large cities, nodes 6–10 and 29–33 are open terrain, nodes 11–18 are suburban terrain, nodes 26–28 are open terrain with the correction factor halved, nodes 23–25 are suburban terrain with the correction factor doubled, and a 0.2 times
The topology of the IEEE 33-bus system and the distribution of photovoltaic power stations are depicted in Figure 4. In the figure, the red points signify the locations of the photovoltaic power stations. While each photovoltaic power station is physically linked to its corresponding node, this connection is not illustrated for simplicity. Supplementary Data SA2 and SA3 provide the positional coordinates of each node and certain photovoltaic power stations, which are measured in kilometers.
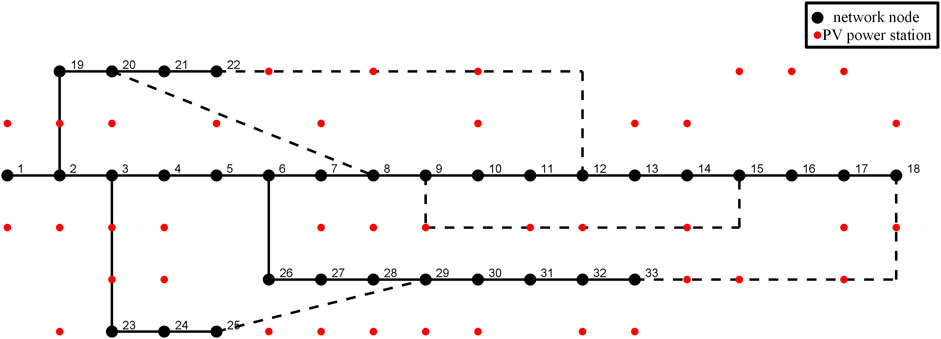
FIGURE 4. IEEE 33 node and photovoltaic power station topology diagram.
The three indices—node degree, resource development synergy, and communication quality—proposed above are collectively employed to assess the weight index of nodes. Through the entropy method, the objective weights (d1–d3) are determined, yielding comprehensive weight results for the calculated indices: δ1 = 0.4096, δ2 = 0.2933, and δ3 = 0.2971. The weights for each node are presented in Figure 5.
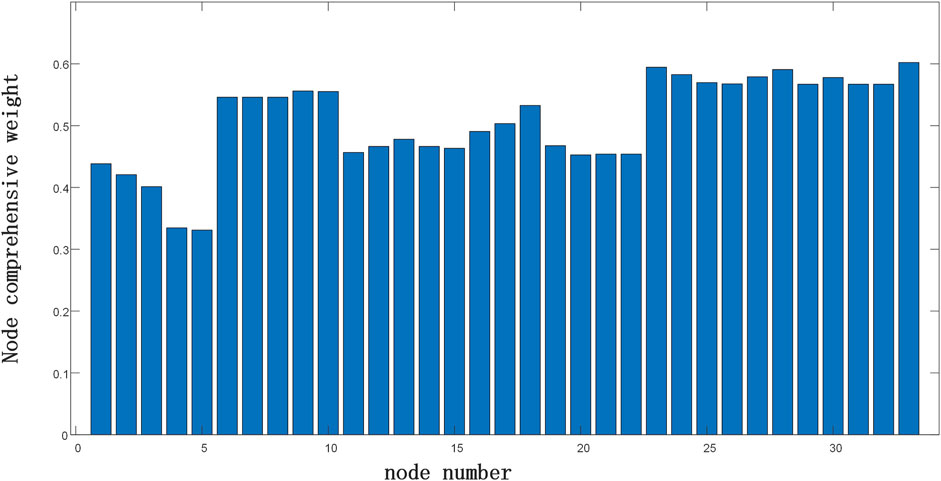
FIGURE 5. Comprehensive weight index of the IEEE 33 node system node.
The optimal terminal configuration scheme for the system is computed using the edge sensing terminal optimization configuration method proposed in this study. To assess the impact of node comprehensive weights in the optimization process, a simulation is conducted without considering the node weights. The optimal terminal configuration schemes calculated before and after these two simulations are presented in Table 1. Upon comparison, it is observed that incorporating node comprehensive weight indices does not lead to an increase in the required equipment count, and the cost of the configuration scheme remains the same, albeit with different node weights in the two schemes. Due to the different weights of nodes, the proposed solution in this article is more adaptable and universal and can ensure high reliability, achieving observability and controllability of distributed resources.
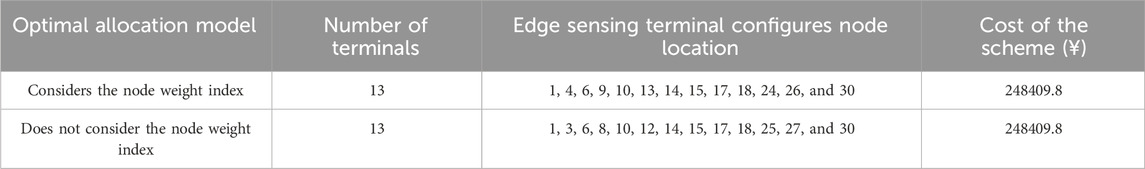
TABLE 1. Analysis of the influence of node comprehensive weight index.
To evaluate the effectiveness of the algorithm, the minimum spanning tree algorithm and the 0-1 integer programming method are employed to optimize the edge sensing terminal. The respective configuration schemes are presented in Table 2 for comparison.
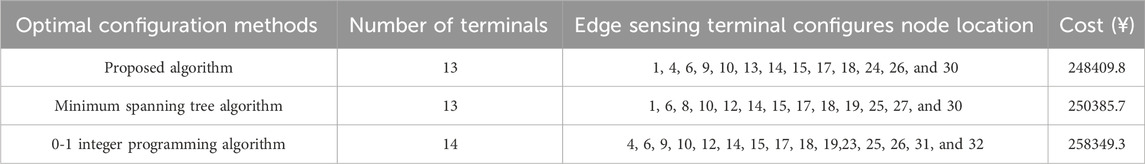
TABLE 2. Optimal configuration results of IEEE 33 node edge sensing terminals with different algorithms.
The results indicate that the algorithm proposed in this study yields the same number of terminals as the minimum spanning tree algorithm, which is fewer than the number obtained by the 0-1 integer programming algorithm. Moreover, the proposed algorithm minimizes the total cost. Considering the comprehensive weight of nodes, the configuration scheme becomes more feasible and adaptable for the future.
The terminal configuration scheme, taking into account the comprehensive weight of nodes, is illustrated in Figure 6.
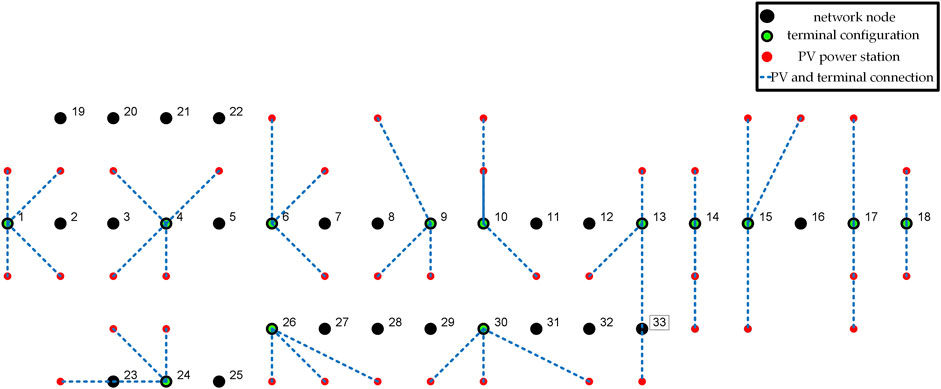
FIGURE 6. IEEE 33-bus system edge sensing terminal configuration scheme.
In this scheme, a single edge sensing terminal is connected to a maximum of four photovoltaic power stations, and each edge sensing terminal is linked to at least one photovoltaic power station. The distance between the terminal and the photovoltaic power station is within the set
Throughout the solution process, the unobservable depth progressively diminishes with each iteration, ultimately leading to the comprehensive observability of distributed resources. The unobservable depth during faults also gradually decreases and eventually drops below the predetermined threshold by 5%. The variation of unobservable depth and unobservable depth during faults is shown in Figure 7.
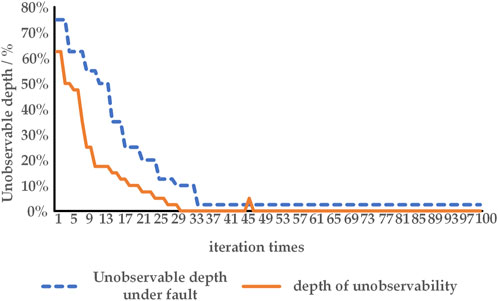
FIGURE 7. Unobservable depth change of the system during the iteration process.
It can be demonstrated that the method proposed in this study accurately accomplishes terminal configuration within the specified target, minimizing both the life cycle cost and node comprehensive weight.
5.2 Hubei Guangshui Ten North I loop 408 system
The terminal dynamic networking model proposed in this study is applied to the actual distribution network system, specifically the Hubei Guangshui Ten North I loop 408 system. The distribution system comprises a total of 91 nodes and 120 photovoltaic power stations. The location of each node and photovoltaic power station are depicted in Figure 8A, with detailed coordinates provided in Supplementary Data SA4 and SA5, which are measured in kilometers. The selection of parameters, aside from the comprehensive weight of nodes, follows the assignments provided in Supplementary Data SA1. After optimization using the method proposed in this study, the final configuration scheme and its connections with resources are illustrated in Figure 8B.
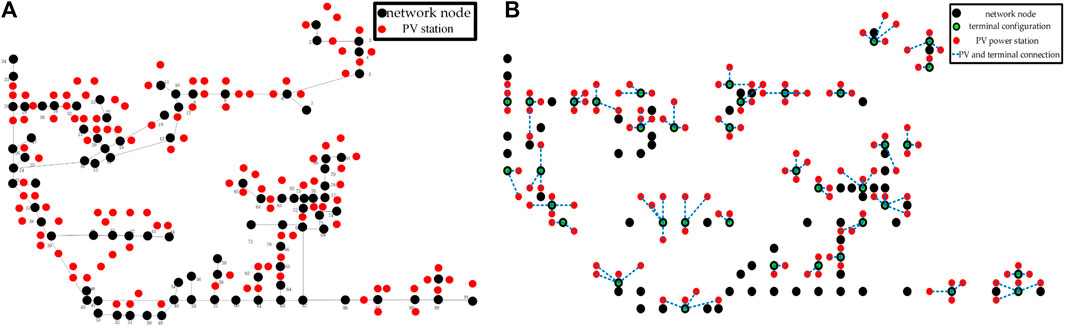
FIGURE 8. Schematic diagram of I loop 408 system. (A) Node and photovoltaic location; (B) Configuration scheme.
In the edge sensing terminal configuration scheme presented in Figure 9, a total of 37 edge sensing terminals are deployed across 91 nodes. In the simulation of the dynamic networking model, a four-stage planning is set, denoted as q = 4. Each stage involves the expansion of 30 photovoltaic power plants, with a maximum investment of ¥600,000 in the first stage and ¥540,000 in subsequent stages.
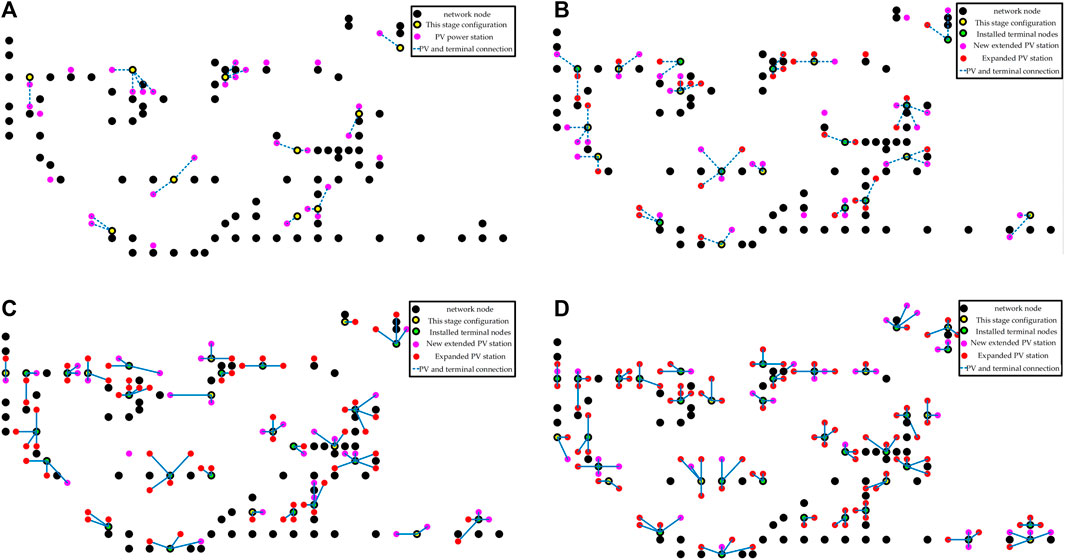
FIGURE 9. Dynamic networking results of 408 system of Guangshui Ten North I loop. (A) Results of Phase 1 Planning; (B) Results of Phase 2 Planning; (C) Results of Phase 3 Planning; (D) Results of Phase 4 Planning.
To validate the effectiveness of the example, MATLAB is utilized to randomly generate the locations of photovoltaic power stations expanded over the four planning stages. The construction planning of photovoltaic power stations for each stage is detailed in Supplementary Data SA6.
In the first stage of planning, edge sensing terminals are configured at nodes 5, 12, 23, 29, 42, 46, 62, 65, 80, and 84. The unobservable depth is 23.3%, and the unobservable depth under fault is 36.67%. At this stage, the number of terminals is small, and the extended photovoltaic power stations are more dispersed, resulting in a higher unobservable depth after a fault. For the second stage, terminals are configured at nodes 8, 20, 31, 36, 38, 44, 51, 73, and 90. The unobservable depth is 6.67%, and the unobservable depth under fault is 15%. In the third stage of planning, terminals are configured at nodes 2, 11, 13, 28, 32, 58, 75, 85, and 87. The unobservable depth is 2.22%, and the unobservable depth under fault is 6.67%. Finally, in the fourth stage, edge sensing terminals are configured at nodes 3, 6, 18, 35, 39, 41, 68, 81, and 89. The unobservable depth is 0, and the unobservable depth under fault is 3.33%.
The comprehensive configuration scheme is presented in Table 3.
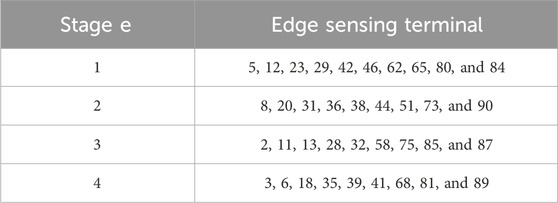
TABLE 3. Networking scheme calculated in this study.
The unobservable depth and unobservable depth under fault steadily decrease through the iterative process of the four-stage planning, ultimately achieving complete observability of low-voltage distributed resources. The evolving trend of unobservable depth and unobservable depth under fault is illustrated in Figure 10.
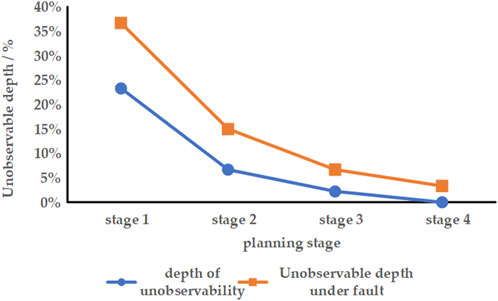
FIGURE 10. Unobservable depth and unobservable depth change under fault.
To validate the effectiveness of this method, it is essential to compare it with two other network planning strategies. The first strategy involves arranging nodes sequentially from small to large, denoted as “networking scheme 1.” The second strategy entails a randomly generated network configuration, labeled as “networking scheme 2.” The configurations of these two schemes are illustrated in Figure 11.
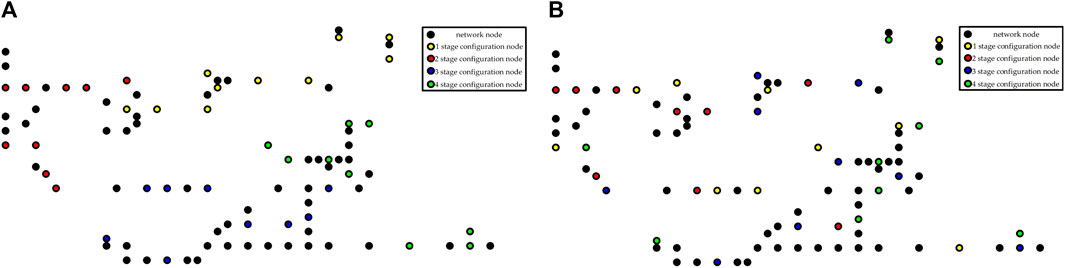
FIGURE 11. The configuration of the other two networking schemes. (A) Configuration of networking scheme 1; (B) Configuration of networking scheme 2.
The observability of networking scheme 1 and networking scheme 2 at each stage is computed, and the changes in the unobservable depth for all three schemes throughout the networking process are compared. The variations are depicted in Figure 12. By comparing the results, it becomes evident that the model and algorithm introduced in this study exhibit significant advantages in attaining the objective of minimizing the unobservable depth at each stage. The proposed approach effectively achieves dynamic networking of edge sensing terminals in alignment with the photovoltaic construction process.
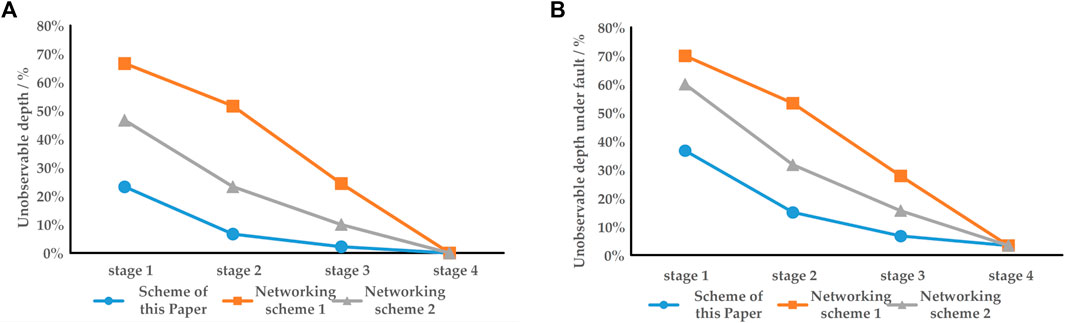
FIGURE 12. Unobservable depth comparison. (A) Unobservable depth of three schemes; (B) Unobservable depth under three schemes fault.
6 Conclusion
In this study, a dynamic networking method for monitoring terminals, which takes into account both node weight and unobservable depth while considering node differences, has been proposed to facilitate real-time and dependable monitoring of distributed systems. The key findings of the research are summarized as follows:
1) The proposed one-time configuration planning algorithm successfully achieves the minimum life cycle cost of the terminal while ensuring complete observability of distributed resources and accounting for node differences.
2) The proposed dynamic networking algorithm effectively achieves optimal configuration in phases, progressively reducing the unobservable depth of the system.
3) The comprehensive weight index, considering the differences in nodes, has a negligible impact on the number of monitoring terminals required and does not increase the installation cost.
Nevertheless, the model still has certain limitations that warrant improvement. Future research could consider a broader range of fault types to enhance the evaluation of unobservable depths under faults, moving beyond the current focus on single edge sensing terminal faults. Additionally, the inclusion of various renewable resources, such as the monitoring of wind turbines, could enhance the model’s comprehensiveness. Furthermore, considering the diverse data transmission requirements for distributed resource power plants with varying capacities, there is room for optimization to achieve a panoramic perception of distributed resources at the minimum lifecycle cost.
Data availability statement
The original contributions presented in the study are included in the article/Supplementary Material; further inquiries can be directed to the corresponding author.
Author contributions
XJ: data curation, validation, and writing–original draft. DL: investigation, supervision, visualization, and writing–original draft. YY: methodology, validation, writing–original draft, and writing–review and editing. PX: data curation, formal analysis, supervision, and writing–review and editing. YS: validation and writing–review and editing. ZY: supervision and writing–review and editing.
Funding
The author(s) declare that financial support was received for the research, authorship, and/or publication of this article. This research was funded by the Technical Project of State Grid Corporation of China; grant number 5400-202122573A-0-5-SF.
Conflict of interest
Author XJ was employed by State Grid Hubei Electric Power Co. Ltd.
The remaining authors declare that the research was conducted in the absence of any commercial or financial relationships that could be construed as a potential conflict of interest.
Publisher’s note
All claims expressed in this article are solely those of the authors and do not necessarily represent those of their affiliated organizations, or those of the publisher, the editors, and the reviewers. Any product that may be evaluated in this article, or claim that may be made by its manufacturer, is not guaranteed or endorsed by the publisher.
Supplementary material
The Supplementary Material for this article can be found online at: https://www.frontiersin.org/articles/10.3389/fenrg.2024.1323800/full#supplementary-material
References
Ali, Z. M., Razavi, S. E., Javadi, M. S., Gandoman, F. H., and Aleem, S. H. E. A. (2018). Dual enhancement of power system monitoring: improved probabilistic multi-stage PMU placement with an increased search space and mathematical linear expansion to consider zero-injection bus. Energies 11 (6), 1429. doi:10.3390/en11061429
Babaei, S., Zhao, C. Y., and Fan, L. (2019). A data-driven model of virtual power plants in day-ahead unit commitment. IEEE Trans. Power Syst. 34 (6), 5125–5135. doi:10.1109/tpwrs.2018.2890714
Babu, N. V. P., Babu, P. S., and Sarma, D. S. (2020). Critical elements based optimal PMU placement considering substation coverage. Int. J. Electr. Eng. Inf. 12 (3), 418–430. doi:10.15676/ijeei.2020.12.3.2
Bangjun, W., Feng, Z. L., Feng, J., Yu, P., and Cui, L. Y. (2022). Decision making on investments in photovoltaic power generation projects based on renewable portfolio standard: perspective of real option. Renew. Energy 189, 1033–1045. doi:10.1016/j.renene.2022.02.112
Chen, R. Z., Chen, H., Yang, S. Y., and Chen, Y. B. (2019). Optimal configuration model of distribution system switch. Smart Power 47 (07), 76–83. doi:10.3969/j.issn.1673-7598.2019.07.013
Ding, W., Xu, M., Huang, Y., Zhao, P., and Song, F. (2021). Cyber attacks on PMU placement in a smart grid: characterization and optimization. Reliab. Eng. Syst. Saf. 212, 107586. doi:10.1016/j.ress.2021.107586
Duffie, J. A., and Beckman, W. A. (2013). Solar engineering of thermal processes. John Wiley and Sons.
Fambri, G., Diaz-Londono, C., Mazza, A., Badami, M., Sihvonen, T., and Weiss, R. (2022). Techno-economic analysis of Power-to-Gas plants in a gas and electricity distribution network system with high renewable energy penetration. Appl. Energy 312, 118743. doi:10.1016/j.apenergy.2022.118743
Fang, D. W., Guan, X., Lin, L., Peng, Y., Sun, D., and Hassan, M. M. (2020). Edge intelligence based economic dispatch for virtual power plant in 5G internet of energy. Comput. Commun. 151, 42–50. doi:10.1016/j.comcom.2019.12.021
Ferreira, D. M. V. P., Carvalho, P. M. S., and Ferreira, L. A. F. M. (2020). Optimal meter placement in low observability distribution networks with Der. Electr. Power Syst. Res. 189, 106707. doi:10.1016/j.epsr.2020.106707
Ge, L. J., Liu, J. H., Yan, J., and Rafiq, M. U. (2021). Improved harris hawks optimization for configuration of PV intelligent edge terminals. IEEE Trans. Sustain. Comput. 7 (3), 631–643. doi:10.1109/tsusc.2021.3125016
Hu, J., Liu, X., Shahidehpour, M., and Xia, S. (2021). Optimal operation of energy hubs with large-scale distributed energy resources for distribution network congestion management. IEEE Trans. Sustain. Energy 12 (3), 1755–1765. doi:10.1109/tste.2021.3064375
Ji, H. R., Wang, C. S., Li, P., Ding, F., and Wu, J. Z. (2018). Robust operation of soft open points in active distribution networks with high penetration of photovoltaic integration. IEEE Trans. Sustain. Energy 10 (1), 280–289. doi:10.1109/tste.2018.2833545
Khare, G., Mohapatra, A., and Singh, S. N. (2021). Strategic PMU placement to alleviate power system vulnerability against cyber attacks. Energy Convers. Econ. 2 (4), 212–220. doi:10.1049/enc2.12038
Klein, S. A. (1976). Calculation of monthly average insolation on tilted surfaces. Sol. energy 19 (4), 325–329. doi:10.1016/0038-092x(77)90001-9
Kong, X. Y., Liu, C., Wang, C. S., et al. (2022). Demand response potential assessment method based on deep subdomain adaptation network. Proceeding CSEE 42 (16), 5786–5797. doi:10.13334/j.0258-8013.pcsee.210903
Kong, X. Y., Ma, Y. Y., Ai, Q., et al. (2023). Review on electricity consumption characteristic modeling and load forecasting for diverse users in new power system. Automation Electr. Power Syst. 47 (13), 2–17. doi:10.7500/AEPS20230313005
Kong, X. Y., Sun, Y., Khan, M. A., Zheng, L., Qin, J., and Ji, X. (2024). Cyber-physical system planning for VPPs supporting frequency regulation considering hierarchical control and multidimensional uncertainties. Appl. Energy 353, 122104. doi:10.1016/j.apenergy.2023.122104
Kong, X. Y., Wang, Y. T., Yuan, X. X., and Yu, L. (2019). Multi objective for PMU placement in compressed distribution network considering cost and accuracy of state estimation. Appl. Sci. 9 (7), 1515. doi:10.3390/app9071515
Li, W. G., and Lu, J. L. (2018). PMU measurement location optimization in active distribution network based on immune discrete PSO algorithm. Electr. Meas. Instrum. 55 (21), 14–18+30. doi:10.3969/j.issn.1001-1390.2018.21.003
Li, Y., Zhang, H., Liang, X., and Huang, B. (2018). Event-triggered-based distributed cooperative energy management for multienergy systems. IEEE Trans. Industrial Inf. 15 (4), 2008–2022. doi:10.1109/tii.2018.2862436
Liang, H. S., and Ma, J. (2021). Data-driven resource planning for virtual power plant integrating demand response customer selection and storage. IEEE Trans. Industrial Inf. 18 (3), 1833–1844. doi:10.1109/tii.2021.3068402
Liu, X. C., Wu, H. C., Li, Y. X., Wang, L., and Wang, C. (2020). A bi-level optimization model of distribution automation terminal configuration. Power Syst. Prot. Control 48 (24), 136–144. doi:10.19783/j.cnki.pspc.200170
Nouri, A., Jafarian, M., and Keane, A. (2022). Efficacious models of discrete control devices for convex optimization in distribution systems. IEEE Trans. Power Syst. 38 (5), 4682–4696. doi:10.1109/tpwrs.2022.3208751
Qiao, Q. J. (2016). The calculation method of ground objects receiving solar radiation quantity. Technol. Vis. (22), 177–178. doi:10.19694/j.cnki.issn2095-2457.2016.22.122
Razavi, S. E., Falaghi, H., Azizivahed, A., Ghavidel, S., Li, L., and Zhang, J. F. (2018). Improved probabilistic multi-stage PMU placement with an increased search space to enhance power system monitoring. IFAC-PapersOnLine 51 (28), 262–267. doi:10.1016/j.ifacol.2018.11.712
Razavi, S. E., Falaghi, H., Esmaeel, N. A., Hadidian Moghaddam, M. J., and Gandoman, F. H. (2020). An effective approach for the probabilistic and deterministic multistage PMU placement using cuckoo search: Iran’s national power system. Iran. J. Sci. Technol. Trans. Electr. Eng. 44, 237–252. doi:10.1007/s40998-019-00236-0
Wang, S. (2019). Research on multi-objective optimal placement of pmu in smart distribution network considering the accuracy of state estimation. Master Thesis. Shanghai, China: Shanghai Jiaotong University.
Xi, Y., Yu, L., Jiang, W. H., Chen, B., Zhou, B., Liang, B., et al. (2022). Multi-stage optimal PMU configuration based on revised analytic hierarchy process. Guangdong Electr. Power 35 (09), 87–93. doi:10.3969/j.issn.1007-290X.2022.009.010
Xu, Y., Liu, C. C., Schneider, K. P., and Ton, D. (2015). Placement of remote-controlled switches to enhance distribution system restoration capability. IEEE Trans. Power Syst. 31 (2), 1139–1150. doi:10.1109/tpwrs.2015.2419616
Yang, F., Ling, Z. N., Zhang, Y. H., He, X., Ai, Q., and Qiu, R. (2022). Event detection, localization, and classification based on semi-supervised learning in power grids. IEEE Trans. Power Syst. 38 (5), 4080–4094. doi:10.1109/tpwrs.2022.3209343
Yang, L., Li, X., Sun, M., and Sun, C. (2023). Hybrid policy-based reinforcement learning of adaptive energy management for the Energy transmis-sion-constrained island group. IEEE Trans. Industrial Inf. 19, 10751–10762. doi:10.1109/tii.2023.3241682
Yi, S. J., Xiang, S., Su, P., Wang, Y., and Song, Z. H. (2023). A multi-stage optimal configuration method for SPMU of subsynchronous oscillation monitoring system under high proportion of wind power. Mod. Electr. Power 40 (01), 18–26. doi:10.19725/j.cnki.1007-2322.2021.0239
Yu, H., Liu, Z., and Li, Y. J. (2013). Key nodes in complex networks identified by multi-attribute decision-making method. ActaPhysica Sin. 62 (02), 1–9. doi:10.7498/aps.62.020204
Zeng, S. Q., Wu, J. K., Li, X., Wang, R. D., and Zhang, H. Y. (2021). Multi-stage optimal configuration of PMU considering changes in distribution network topology. Guangdong Electr. Power 34 (09), 51–59. doi:10.3969/j.issn.1007-290X.2021.009.007
Zhang, N., Sun, Q., Yang, L., and Li, Y. (2021). Event-triggered distributed hybrid control scheme for the integrated energy system. IEEE Trans. Industrial Inf. 18 (2), 835–846. doi:10.1109/tii.2021.3075718
Keywords: low-carbon grid, edge intelligent sensing terminal, optimal configuration, node weights, genetic algorithm, unobservable depth
Citation: Ji X, Liu D, Yan Y, Xiong P, Sun Y and Yang Z (2024) Dynamic planning of edge sensing terminals in distribution network supporting distributed resources observable and controllable. Front. Energy Res. 12:1323800. doi: 10.3389/fenrg.2024.1323800
Received: 18 October 2023; Accepted: 14 February 2024;
Published: 06 March 2024.
Edited by:
Youbo Liu, Sichuan University, ChinaCopyright © 2024 Ji, Liu, Yan, Xiong, Sun and Yang. This is an open-access article distributed under the terms of the Creative Commons Attribution License (CC BY). The use, distribution or reproduction in other forums is permitted, provided the original author(s) and the copyright owner(s) are credited and that the original publication in this journal is cited, in accordance with accepted academic practice. No use, distribution or reproduction is permitted which does not comply with these terms.
*Correspondence: Yanyu Yan, yanyanyu@tju.edu.cn