Research on joint planning method of supply and demand considering users’ comprehensive energy consumption behavior and policy orientation
 Jiangnan Li
 Tao Wang2
 - 1Shenzhen Power Supply Company, China Southern Power Grid, Shenzhen, China
- 2Electric Power Research Institute, China Southern Power Grid, Guangzhou, China
Given the recent escalation of the energy and environmental crises, it is crucial to consider the evolution of various energy systems from a macro perspective in order to increase the overall efficiency of energy use and improve the environment. In order to tackle this issue, a wide-area integrated energy system planning method that takes into account consumers' comprehensive energy consumption behavior (CECB) and policy recommendations is provided in this study. First of all, according to the analysis of users’ CECB, the decision-making model of regional users' energy supply transformation is established. A game model is constructed to explore cooperative planning of an integrated electricity-natural gas energy system based on the profit models of various market participants. The government is considered as the main body of planning and decision-making, and the evaluation model of government’s pollution emissions from both supply and demand sides is established. A two-level dynamic game planning model for the wide-area IES is then created as a result of the examination of the game mechanism between users, the government, the integrated energy system (IES), and other market players. Finally, the model is solved using an iterative search approach. Results from simulations are used to validate the suggested method’s accuracy and efficacy.
1 Introduction
The development of various types of energy systems from to improve the overall energy efficiency has become an unanimous opinion of all nations in the world in recent years as the energy and environmental crises become worse (Zhu, 2003; Li et al., 2021a; Dai et al., 2021; Zhang et al., 2021; Li et al., 2023a). In this context, the traditional idea of planning different energy systems separately has become unable to meet the needs of today’s energy development. It is of great academic and engineering significance to break the barriers between heterogeneous energy systems and study the joint planning theory for wide-area various heterogeneous energy systems (Yang et al., 2022a; Zhang et al., 2022; Li et al., 2023b).
The IES planning methodology is currently the subject of some works, which primarily consider the coupling characteristics of various energy sources in the IES (Li et al., 2020; Chen et al., 2021; Shen et al., 2021). By studying the conversion relationship among various energy sources and focusing on minimizing the investment and operation cost or maximizing the income (Wang et al., 2017; Qu et al., 2018; Zhang and Lv, 2018), planning models that consider the mutual influence among various energy systems are built, and the related algorithms are used to solve them (Yang et al., 2018a; Hao et al., 2018; Liu et al., 2018). The regional integrated energy systems are the main focus of this type of planning models (Yang et al., 2018a; Liu et al., 2018; Zhang and Luo, 2018; Yang et al., 2021a). On the one hand, integrated energy systems involve relatively small range of energy supply, mostly industrial parks or towns, and generally does not involve large-scale energy transmission between provinces, and on the other hand, its energy coupling nodes are generally concentrated on the energy supply side, such as gas turbines, gas boilers, air energy heat pumps, etc., and there is a physical coupling between different energy types (Yang et al., 2019; Ding et al., 2021; Ma et al., 2021; Wang et al., 2022). Therefore, its energy conversion relationship is clear and explicit and it can be considered that the existing IES planning methods are more for rigid and strong coupling regional IES.
In fact, from the macro point of view of the whole society, in the process of energy consumption, people can choose more and more energy forms, such as natural gas, electricity, coal and so on (Yang et al., 2018b; Fang et al., 2022). In a larger time scale, influenced by market environment, policy orientation, and other factors, users’ choice of different forms of energy is not unchanged, and users’ energy consumption demand tends to be relatively stable (Xu et al., 2023; Yu et al., 2023). Therefore, from the standpoint of energy demand, the energy load may be distributed among various forms of energy over the course of the medium and long term. Additionally, this implies that several heterogeneous energy source types will be connected on the user side (Yu et al., 2022). Therefore, it is different from the traditional regional IES that emphasizes the rigid strong coupling of physical nodes on the energy supply side. From a macro point of view, the energy system of the whole society is based on the comprehensive energy consumption behavior of users on the demand side, and has flexible weak coupling between different forms of energy, which can be called flexible weak coupling wide area IES. For this kind of energy system, the traditional planning method of regional IES that is oriented to rigid and strong coupling is no longer applicable, which mainly displays in the following two aspects:
(a) The research objects in the wide-area integrated energy system consist of two main bodies: users and integrated energy systems. This is in contrast to the traditional regional IES, which can directly construct its energy conversion model based on the physical characteristics of the coupling nodes on the energy supply side (Yang et al., 2022b). Not only the strong coupling relationship between source sides in traditional IES is considered, but also the correlation between source charges is considered (Yang et al., 2020; Gao et al., 2021). In other words, a flexible weak coupling relationship between different energy forms is formed by the comprehensive energy consumption behavior (CECB) on the user side. At present, most of the works on regional IES are based on the analysis of strong coupling between different energy systems on the supply side (Wang et al., 2021). However, there are limited research findings on the investigation of weak coupling mechanisms between supply and demand sides from the perspectives of source and load combined with the CECB of users. A joint optimization strategy for both the supply and demand sides is presented in reference (Zheng et al., 2018). It considers the behavior analysis of demand-side customers. The joint planning of users and energy systems has not been well investigated. To this end, this study mainly focuses on addressing the joint planning between the supply side and the demand side from the standpoint of system operation optimization.
(b) The CECB of demand-side users and the investment and construction of various energy companies on the supply side are affected by the government’s policy guidance. Especially in projects such as power supply transformation and electric energy substitution, the role of the government is particularly significant. Many of the existing works also adequately account for the impact of various environmental policies. As is shown in reference (Zheng et al., 2018), a decentralized scheduling model of multi-regional IES in account of carbon trading costs is built. Reference (Zhou and Zhao, 2013) considers environmental protection as one of the indicators for the evaluation of the microgrid in the park and establishes a multi-criteria evaluation system for the IES. The above studies simply deal with the relevant policy standards formulated by the government as the basic parameters in the model, and then evaluate the social and environmental benefits of the planning scheme (Liao et al., 2018; Wang et al., 2023; Zhang et al., 2023). There are limited works consider the government as an independent decision-making body, giving full play to the initiative of the government, and optimize the planning of various policy standards (Yang et al., 2021b; Fu et al., 2023; Zhu et al., 2023).
To sum up, this paper deeply analyzes the comprehensive energy use behavior of users, and considers the government as the decision-making body into the planning model, and proposes a wide-area IES planning method based on game theory, which considers the comprehensive energy use behavior of users and policy guidance (Li et al., 2021b). Firstly, by analogy with the regional IES with rigid and strong coupling characteristics, a wide-area IES with users' integrated energy consumption behavior as weak coupling nodes is proposed, and the users' integrated energy consumption behavior is analyzed. Then, the planning benefit models of various market players in the IES are constructed respectively, and the government’s assessment model of pollution emissions from both supply and demand sides is established based on the environmental benefits of energy supply transformation. On this basis, a two-level dynamic game planning model for wide-area IES is created based on the analysis of the game mechanism involving users, the government, IES, and various market players. Finally, the model is solved using the iterative search approach. In comparison to current studies, this paper’s primary contributions are as follows:
(a) The concept of wide-area IES is proposed, which reveals a weak coupling relationship between various forms of energy based on the link of integrated energy consumption behavior of users. It is based on research of traditional regional IES and the analysis of integrated energy consumption behavior of demand-side users.
(b) A wide-area IES planning method considering users' integrated energy use behavior is proposed, and the utility model of users' energy use decision-making is used to evaluate the level of all kinds of new load in the region, so as to guide the planning and construction of IES.
(c) In the planning of wide-area IES, the government should be considered as the main body of planning and decision-making, and users should be guided to carry out energy supply transformation by adjusting the energy subsidy standards of users, so as to effectively improve the environmental benefits in the region.
2 Wide area integrated energy system
The wide-area integrated energy system couples many energy types, including electric, heat, and natural gas energy, in the production and consumption of energy. This system not only has strong coupling characteristics of various energy systems on the source side based on various energy conversion equipment, but it also includes various energy systems on the source-load side based on users. As shown in Figure 1.
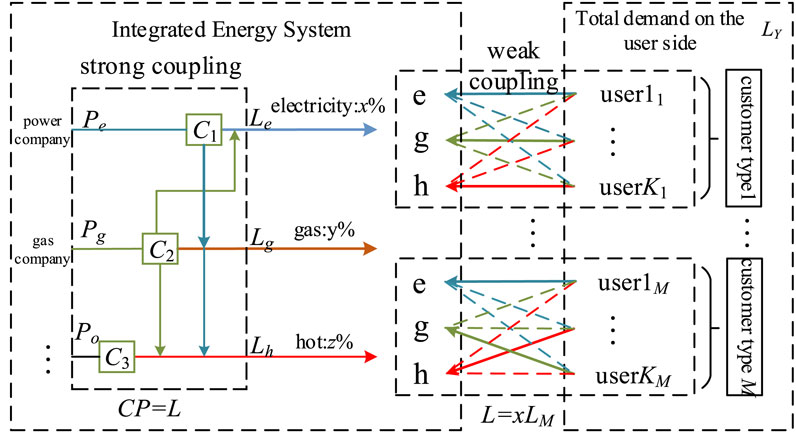
FIGURE 1. Schematic diagram of weak coupling relationship of wide-area integrated energy system.
2.1 Analysis of strong coupling characteristics of integrated energy system
At present, the analysis of the coupling relationship of the system containing electricity, gas and heat has been widely used in the related research of various integrated energy systems, and the concept of energy hub is introduced to depict the coupling relationship between different forms of energy at the source side, reflecting the static relationship between energy transmission and conversion. The energy hub can be equivalent to an energy multi-input and multi-output conversion structure. The input end is the energy vector
Because the coupling coefficient matrix C depends on the parameters of various energy conversion elements, once the coupling elements are selected, the energy conversion relationship is uniquely determined. Therefore, this paper calls it a strong coupling relationship between various forms of energy in the IES.
2.2 Analysis of weak coupling characteristics based on user’s comprehensive energy consumption behavior
The CECB of users, which displays the connection between the source and load sides, is the foundation upon which the coupling relationship between various kinds of energy is built in the wide-area integrated energy system. Because the CECB of users is affected by the energy price, there is a certain game relationship between the CECB of users and the pricing behavior of the energy system. Therefore, this coupling characteristic in the wide-area IES reflects the steady-state relationship between the production and consumption of energy.
By analogy with the energy conversion relationship in the IES, in the wide-area IES, since the total load of various users on the user side is relatively stable, the load demand of various types in the region depends on the proportional coefficient x of various energy supply modes selected by users.
In (2):
In (3): M is the number of user types;
Because the user’s behavior of choosing the way of energy supply is influenced by the user’s own characteristics and external factors such as energy prices, policy guidance and so on, and there is a game behavior between the user and the energy system, the proportional coefficient has a certain volatility, and this paper calls different forms of energy as a flexible weak coupling relationship linked by the user’s comprehensive energy use behavior.
2.3 Analysis of comprehensive energy use behavior of users
When selecting the energy supply mode, the user usually hopes to use the energy supply mode with the minimum energy cost and the maximum utility value while ensuring the user’s comfort. Therefore, this section makes a quantitative analysis and calculation of the energy cost and comfort under various energy supply modes, so as to calculate the deterministic utility value of each energy supply mode, and then incorporate the ambiguous usefulness in the user’s behavior in making choices. The utility model for deciding how much energy to utilize is established.
2.3.1 Economic indicators
The cost of various energy supply modes, including investment costs and energy consumption costs, as well as energy prices, government subsidies, and user energy consumption levels, are all included in the economic index.
In (5):
2.3.2 Comfort index
This section uses an exponential function that takes into account environmental elements to characterize the comfort of various energy supply modes for the user:
In (6):
The energy utility of users is modeled using the analytical hierarchy process (AHP). According to their own energy preferences, different types of users score the importance of various factors to obtain the weight value of each index (Zhang et al., 2021), so as to calculate the deterministic utility value of various energy supply modes selected by various types of users, and set the modified utility
In (7):
According to the utility maximization decision criterion, combined with the Logit model, the calculation method of probability distribution function can be used to deduce and calculate the probability of p-type users choosing energy supply mode q. The specific derivation process is detailed in literature (Ma et al., 2021). In this paper,
Based on the above analysis of energy consumption behavior of users, the proportional coefficient x of various energy supply modes selected by various users is determined, and then various load levels are determined in combination with the basic load in the region, so as to guide the planning and construction of the IES.
3 Planning model
This paper views the government as an independent decision-making body and collaborates on wide-area integrated energy system planning with the two main groups of users and integrated energy systems because the subsidy standard of government decisions will significantly influence the user’s choice of energy supply mode, further affecting the user’s load level and the planning and construction of various energy systems.
3.1 Integrated energy system planning model
The market investors in the IES will renovate, expand, and build new facilities for the energy supply system against the backdrop of energy substitution by demand-side users, to meet the demand of new electricity load and natural gas load in the region and respond to the requirements of energy saving and emission reduction. Power generation firms, grid firms, and natural gas firms are among the major IES investors taken into account in this study. To get the most out of gas-fired units, power production businesses want to minimize their investment, operation, and environmental expenses while maximizing their revenue from electricity sales. For grid firms, minimizing network loss of lines and investment costs will maximize benefits. In order to lower pipeline investment expenses and system operating costs, boost gas sales revenue, and maximize revenue are the goals of natural gas firms.
The revenue function of the generation company is as follows:
In (9):
The revenue function of the grid company is as follows:
In (10):
The natural gas company’s revenue function is as follows:
In (11):
Power balance constraints, power flow constraints, transmission capacity limitations for lines and pipelines, and output restrictions for units and gas source points are the main constraints of each subsystem in the IES. For more information, see reference (Yang et al., 2019). The relevant restrictions of gas-fired units serving as IES coupling nodes must also be taken into account.
(a) Gas-fired unit output constrain
In (12):
(b) Coupling node power balance constraint
In (13):
3.2 Government decision-making model considering environmental benefits
Users and integrated energy systems focus on economic benefits when making planning decisions, while the government pays more attention to social and environmental benefits. Taking the government as the main body of decision-making can comprehensively evaluate the environmental benefits brought about by the transformation of users' energy supply mode, so as to make planning decisions more reasonable. In this paper, a government planning model considering environmental benefits is constructed, which takes the minimum emission of user side and supply side as the optimization objective, and takes the transformation subsidy and the scale of energy supply transformation of user side affected by construction conditions as the constraints.
In (14): R is the total emission of the user and the energy system in the formula;
The constraints to be considered when the government decides on the subsidy standard are as follows:
(a) Government subsidy constraint
In (15):
(b) Constraints on the scale of energy supply transformation at the user side
In (16):
In (17):
3.3 Wide-area integrated energy system joint planning model based on two-level game
3.3.1 Game relationship analysis
The user, the government, and the IES are the decision-making subjects in the collaborative planning of a wide-area integrated energy system taking the influence of the government into consideration. The user can decide the way of energy supply transformation, the IES can decide the topology of each energy network and various energy prices, and the government can decide the subsidy standard for transformation. They include several power generation corporations, power grid companies, and natural gas companies, as well as other investors in the energy market. The transitive relationship of each subject in planning and decision-making is shown in Figure 2. In the planning and decision-making process of the outer wide-area IES, the user decides the energy supply transformation scheme according to the energy price determined by each energy company and the energy price subsidy of the government, and transmits the transformation result to the government, and feeds back various load increments to each energy company at the same time. According to various load data from the user side, each energy company in the IES determines the expansion, new construction, and pricing scheme of each energy system, transmits energy price information to the user, and reports to the government the pollution discharge situation of each energy company. The decisions of the new units of the power generating company and the new lines of the grid company in the source side and the grid side of the power system immediately affect each other during the inner IES decision-making process. The decision of the natural gas company to build a pipeline may have an impact on the new construction scheme of the gas-fired unit of the power generation company. Additionally, the node marginal gas price set by the IES’s economic and safe dispatch may have an impact on the power generation company’s plan to purchase gas. On the other side, the choice of the natural gas company to build a pipeline may be influenced by the newly constructed gas-fired unit of the gas generation company. The mixed power flow data sent by gas units has an indirect impact on the decision-making of power grid enterprises and natural gas corporations. As a result, the three energy market investors in the IES make their own decisions on their own, independently of one another, and have an influence on one another.
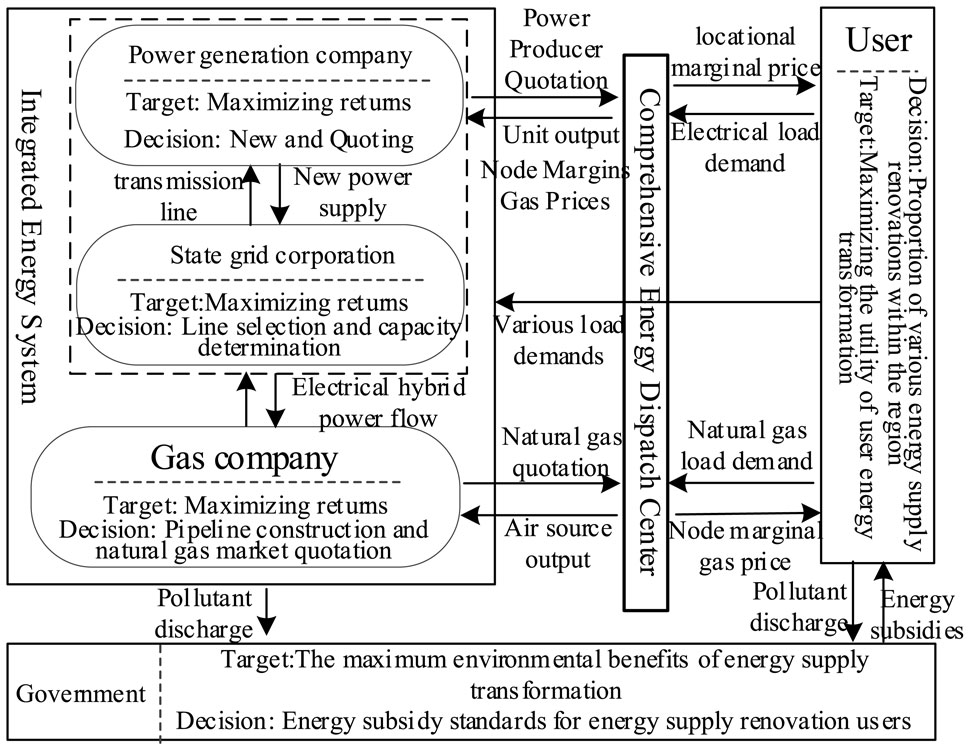
FIGURE 2. Transfer relationship diagram.
According to the pollution discharge of users and energy systems in the region, the government makes a comprehensive evaluation of the environmental benefits of the renovation project, and revises the subsidy standard to guide users and energy systems to make more reasonable planning decisions. The environmental benefits of the renovation project are comprehensively evaluated and the subsidy standards are revised to guide the users and the IES to make more rational planning and decision-making. Therefore, the user, the IES and the government make decisions independently and influence each other, which also constitutes a game relationship. Therefore, in this paper, the multi-agent in the wide area IES planning considering the influence of the government constitutes a two-level game framework.
3.3.2 Game behavior analysis
In the planning process, the electricity generating company, the grid company, and the natural gas company can all understand all of the strategic information of other firms. The user, the government, and the IES can all understand the strategic information of each other. This is because the planning and decision-making of the wide-area IES must be completed jointly under the premise of independent decision-making. In the planning of energy supply transformation project, the government should first formulate the subsidy standard, then the user decides the way of energy supply transformation according to the current energy price and policy, and finally the energy company decides the planning and construction of the system based on the load level, so the main body of the outer layer gives the decision-making scheme successively.
The electricity-gas mixed power flow is computed using the sequential solution approach in this study for the IES planning. Before calculating the natural gas network power flow based on data from gas-fired units and natural gas businesses, the power network power flow is first computed using data from power generation companies and grid companies. As a result, each investor makes their decisions in the inner IES one at a time. Therefore, all participants in the wide-area IES in this paper constitute a two-tier complete information dynamic game pattern. The game behavior diagram is shown in Figure 3.
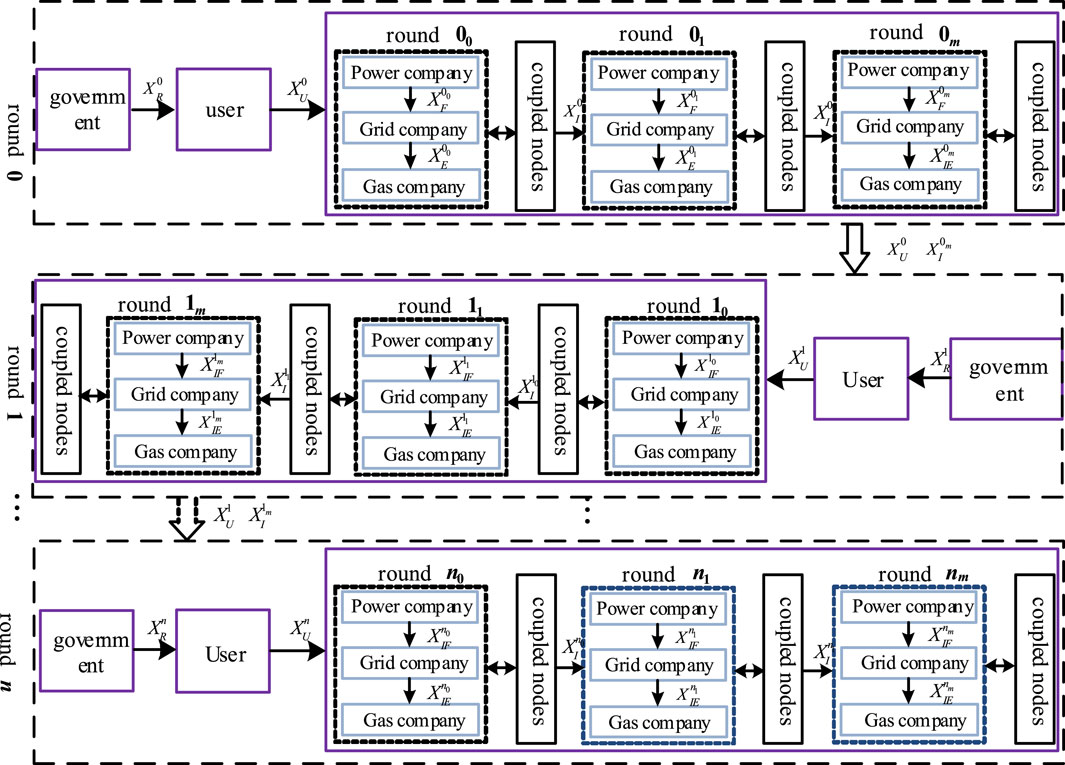
FIGURE 3. Schematic diagram of game behavior.
In an outer game round, the government first evaluates the environmental benefits of the current renovation project, adjusts the subsidy standard for energy supply renovation, and gives a decision
Among them, the game equilibrium state of each investor in the inner IES is described as follows:
The game equilibrium state of each participant in the outer wide-area IES is described as follows:
4 Model solving
The planning problem in multi-agent game environment is an independent optimization problem for each participant based on their own objectives, and it is hard to solve the problem by a unified optimization method. This study employs the iterative search approach to resolve the Nash equilibrium for the aforementioned game model, and Figure 3 illustrates the precise solution procedure. The following is a detailed presentation of the solution steps:
Step 1: Add the settings and raw data. Set up the necessary data, such as the load data, unit output data, and energy supply equipment data (price, energy consumption parameters, and sewage parameters).
Step 2: Generate the strategy space of the players in the inner and outer layer game. Wherein, strategy space of each participant in the outer layer: the government generates its planning strategy space according to the set of transformation subsidies to be selected; The user generates an energy supply transformation strategy space according to the user energy supply transformation candidate set in the whole region; The IES generates the system planning strategy space according to the set to be selected of new facilities construction and pricing of each energy company. Strategy space of each participant in the inner layer: the power generation company generates its strategy space according to the set of new units to be selected; Power grid company generates its strategy space according to the set of new transmission lines to be selected; The natural gas company generates its strategy space according to the set of the newly-built gas pipelines to be selected.
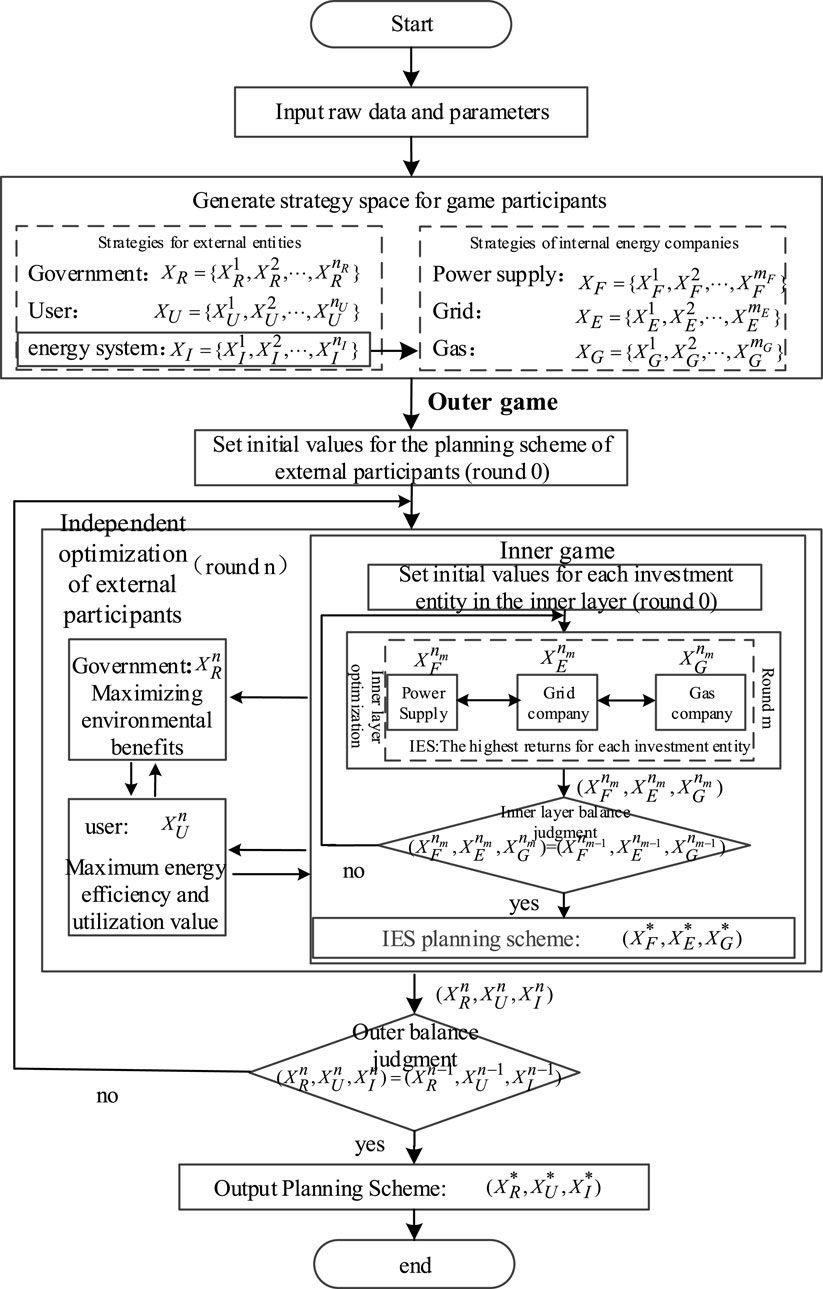
FIGURE 4. Solution flow chart.
Step 3: Set the initial value. Randomly pick a set of values
Step 4: Participants refine the plan. The government, the users, and the IES make decisions on their own planning schemes once more in the outer game round, and they calculate the ultimate benefits using the data from other players in the earlier round. The investors of the three companies alter the planning scheme in the inner game round based on information from other companies in the previous round and recalculate the final income based on the combined information on power flow and energy price.
Step 5: judge whether equilibrium state is reached. Outer equilibrium state: in the wide-area IES, the benefits of government, users and the IES are the same in two consecutive game rounds, that is,
Step 6: Output the final decision-making scheme
5 Example analysis
5.1 Parameter setting
A regional IES is made up of a modified IEEE24 power system (Ding et al., 2021) and a modified 17-node natural gas system (Wang et al., 2022), with the majority of the geographical overlap between the nodes of the two systems. And node 5′, 6′, 10′, 11′, 14′ of that natural gas network cover a plurality of electric pow network nodes as shown in Figure 5.
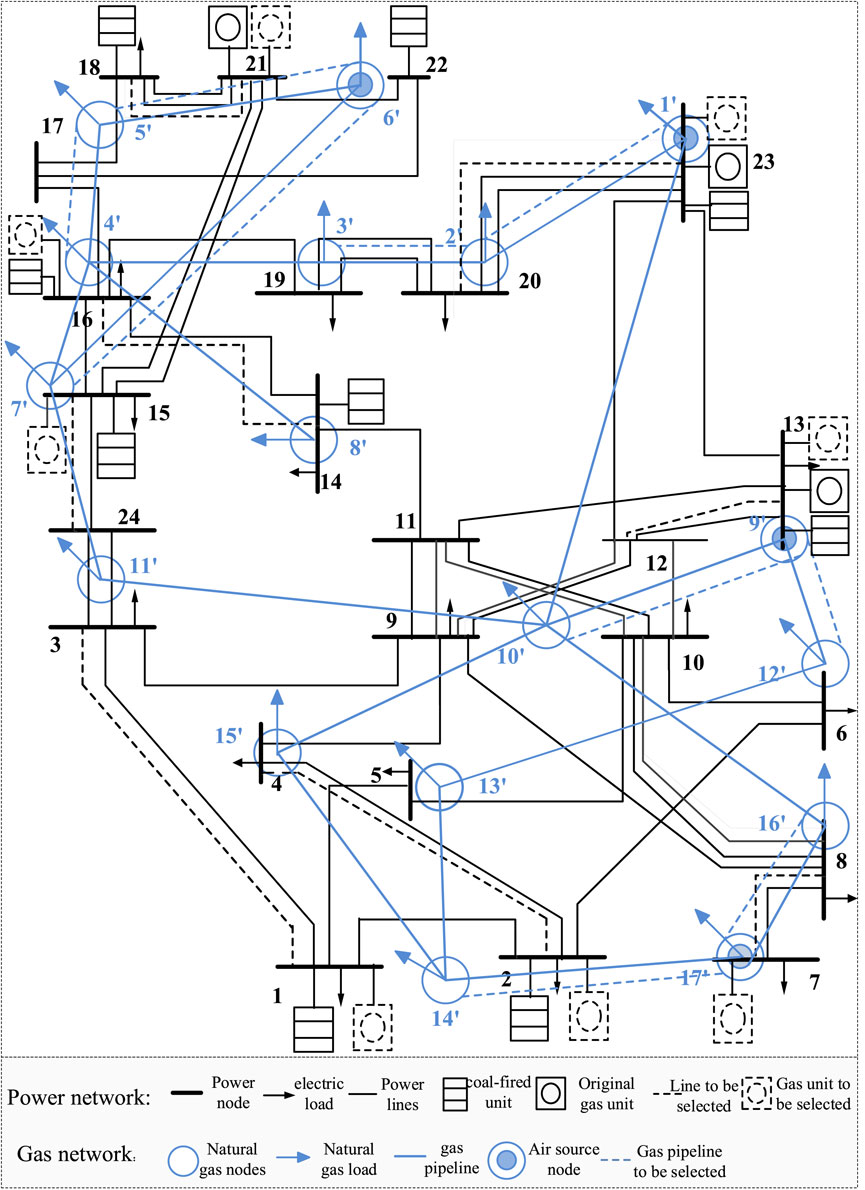
FIGURE 5. Topological structure diagram of integrated energy system.
The power system has three gas-fired units, and Tables A1, A2 in the appendix, respectively, provide specific information on the gas-fired units and transmission lines to be chosen; 15 traditional natural gas loads and 4 natural gas sources make up the natural gas system. Table A5 in the Appendix displays the natural gas network’s parameters. Table A3 in the appendix displays the information regarding the gas transmission pipeline that needs to be chosen as well as the pertinent natural gas network parameters. Among them, the transmission line’s unit investment cost per km is 680,000 yuan, and the gas transmission pipeline’s unit investment cost per km is 1.02 million yuan. If the area is divided into power nodes, the energy supply loads to be modified in each zone are shown in Table A4 of the Appendix. The electricity subsidy for users is 0.1 yuan/kw⋅h, and the gas subsidy is 1 yuan/m3. Different types of users have different preferences for the economy and comfort of energy supply modes. Based on the hierarchical structure of user utility, the judgment matrix is constructed, and the weights of various indicators for different types of users are obtained as shown in Table 1. The construction of judgment matrix and the determination of weight are analytic hierarchy process. The key to applying to the evaluation system. The steps of judgment matrix construction and weight solution are divided into. For the following sections:

TABLE 1. Weight coefficient of each type of user for each index.
Step 1: The problem is decomposed and combined to establish a hierarchical knot. Structure, clearly shows the relationship between the various levels.
Step 2: The three-scale method is used to compare the elements of the same layer. A comparison matrix A is established.
Using the three-scale method, we can get:
Step 3: Calculate the ranking index of the importance of each element of the comparison matrix. The comparison matrix is transformed into a judgment matrix.
In this paper, three scenarios are set up to solve the problem of wide-area IES planning considering the comprehensive energy use behavior of users and government participation in decision-making: scenario 1 is the IES planning without considering the analysis of comprehensive energy use behavior of users; Scenario 2 is the joint planning of wide-area IES considering the analysis of users' integrated energy consumption behavior; Scenario 3 is a wide-area IES planning that considers the analysis of users' integrated energy consumption behavior and the government’s participation in planning and decision-making.
5.2 Planning results
Under the three scenarios, the planning results of the outer participant users, the IES and the government are shown in Table 1, and the planning results of the inner energy investor power generation companies, power grid companies and natural gas companies are shown in Table 2.

TABLE 2. Planning results of each market investor in the integrated energy system.
The planning outcomes for each investment company in the IES under the three scenarios are different, as shown in Table 1, and there are several reasons for this. The CECB of customers is not taken into account in Scenario 1, only the strong coupling properties between various energy sources in the total energy system. Scenario 2 and Scenario 3 plan the wide-area IES based on the CECB of users. On the basis of Scenario 1, the weak coupling characteristics between different forms of energy sources formed by the CECB of users are further considered. However, the planning schemes in scenario 2 and scenario 3 are also different. The reason is that compared with scenario 2, scenario 3 considers the government as the main body of planning and decision-making to participate in the planning of wide-area IES. In order to maximize the environmental benefits of energy supply transformation, the company guides users to carry out coal-fired transformation by adjusting the subsidies for electric energy and natural gas energy consumption. The planning decisions of each company in the IES are adjusted with the changes of various loads on the user side.
5.3 Necessity analysis of considering user’s comprehensive energy use behavior
In order to validate the necessity of considering the CECB analysis of users in the wide-area IES planning, it is assumed that the total new load on the user side is the same in scenario 1 and scenario 2. In scenario 2, the analysis of customers' energy consumption patterns can be used to determine the new load for each zone, as shown in Table 3. A comparison of the benefits of the IES in Scenario 1 and Scenario 2 is shown in Table 4.
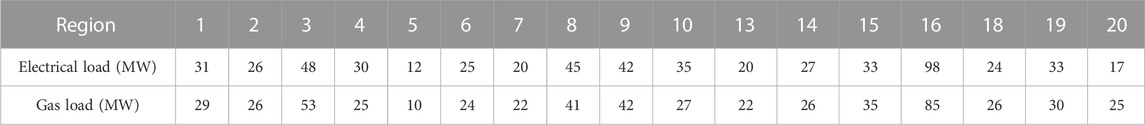
TABLE 3. Newly increased load of each area.
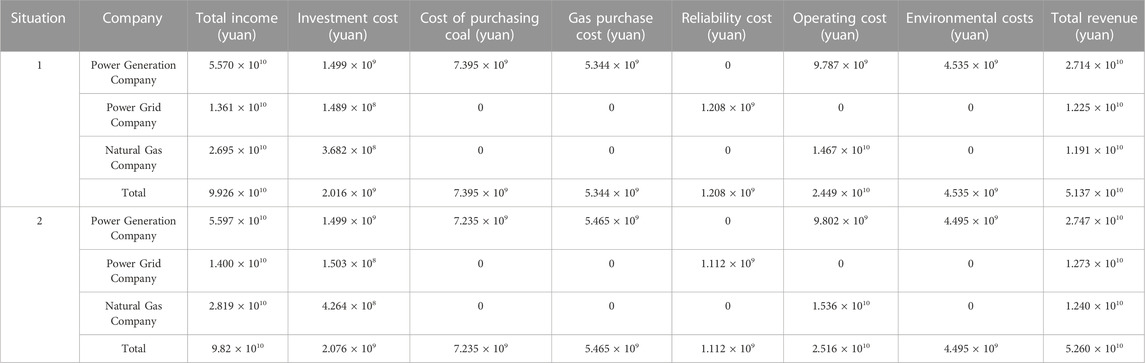
TABLE 4. Scenarios 1 and 2 integrated energy system benefits.
It can be seen from Table 3 that there is little difference among all kinds of new loads in each region, because compared with coal-fired energy supply, after considering government subsidies, the index values of electric energy and natural gas are more similar, and their comfort is better than coal-fired, but the economy is poor. Therefore, the proportion of electric energy and natural gas chosen by all types of users in each region is not much different. On the other hand, the new load in some areas is relatively high, such as node areas 3, 8 and 16, which is mainly due to the high coal load to be transformed, and is also affected by the energy price of each node to a certain extent.
The IES planning results under the two scenarios in Table 2 are further compared and analyzed in combination with Table 3. In Scenario 1 and Scenario 2, most of the new lines and pipelines are connected with gas-fired units, because the coupling characteristics of gas-fired units are considered, which effectively promotes multi-energy complementarity. Compared with Scenario 1, in Scenario 2, the power generation company adjusts Unit 23 to Unit 16, and the electrical load of Node 16 is higher; Some new lines 1-2, 7-8, 12-13 and 14-16 of the power grid company are connected with the new gas-fired units, and the natural gas company builds an additional pipeline 4′-5′ to connect with Unit 16, which is the result of source-network coordination planning and is more conducive to the realization of economic dispatch of the IES. Scenario 2 takes into account the user’s CECB analysis, fully considers the user’s own characteristics, energy prices, subsidies and other factors, so as to make a reasonable assessment of the load level of each region, which can improve the effectiveness of guiding the planning and decision-making of the IES.
Table 4 illustrates how little has changed between scenario 2 and scenario 1 in terms of overall income and investment costs for the two power firms. This is due to the fact that the total demand for power is the same in both scenarios, despite an increase in the natural gas company’s overall revenue of 1.24 × 10⁹ yuan and an increase in investment costs of 5.82 × 10⁷ yuan.
In Scenario 2, the gas purchases by the power production firm are increased, increasing the natural gas company’s revenue from gas sales. In Scenario 2, a new gas transmission pipeline is built concurrently due to an increase in the demand for natural gas. This results in an increase in the investment cost for the natural gas firm, and the operation cost also rises as the supply of gas grows. The operating cost of the power generation company increased by 107 yuan. This is due to the fact that the cost of purchasing coal has decreased for the power generation firm, and some thermal power unit power generation jobs have also been transferred to gas power units, while the operating costs of gas units are greater than those of thermal power units. The environmental cost of power generation firms is also decreased because gas-fired units have a lower environmental cost than thermal power units. As far as the reliability cost of the grid company is concerned, although the new transmission distance in scenario 2 is slightly increased from the perspective of investment cost, the reliability cost is reduced because the planning of gas-fired units and lines in scenario 2 is more reasonable. From the overall income point of view, the income of all investors has improved.
To sum up, comparing the planning results and the benefits of various subjects in scenario 1 and scenario 2, different from the traditional IES planning in scenario 1, which only considers the interaction of the source side and lacks the correlation analysis of source and load side, scenario 2 combines the CECB of users and takes into account the game behavior between users and various energy investors. In scenario 1, various loads on the demand side are reasonably evaluated and predicted, so as to guide the IES to carry out more refined planning and construction, and effectively enhance the income of each investor.
5.4 Analysis on the necessity of government participation in planning and decision-making
In order to validate that the method proposed considers the influence of the government’s participation in the planning as a game subject in the wide-area IES planning considering the analysis of users' energy consumption behavior, the planning results of scenario 2 and scenario 3 are compared and analyzed in this paper. The planning results of each subject in scenario 2 and scenario 3 are shown in Table 5, and the benefits of the IES are shown in Table 6. The government’s environmental benefits are shown in Table 7.
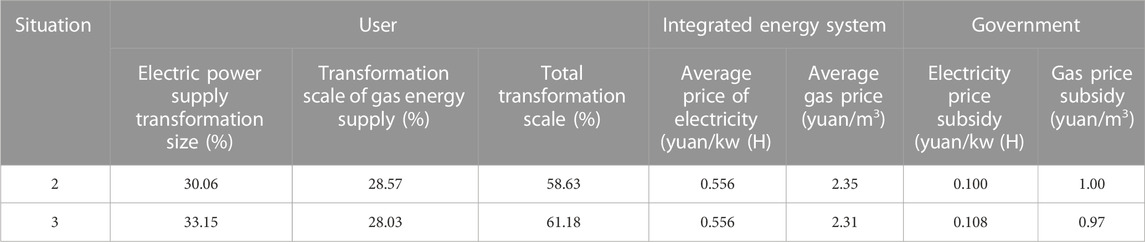
TABLE 5. Planning results of each participant in the outer layer.
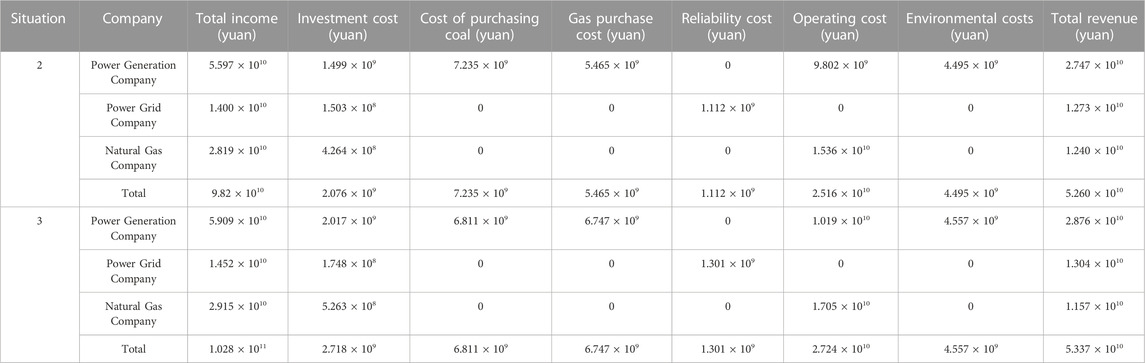
TABLE 6. Scenarios 2 and 3 integrated energy system benefits.
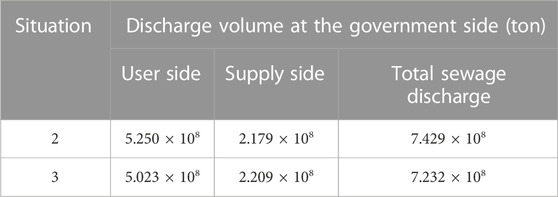
TABLE 7. Total user and government benefits for scenarios 2 and 3.
It can be seen from Table 5 that in Scenario 2 and Scenario 3, the energy supply transformation decisions of the main users, the pricing strategies of the IES and the government’s subsidy standards are different. This is because Scenario 3 considers the government as the main body of planning and decision-making, which leads to the adjustment of the user’s energy subsidy standards, thereby affecting the decision-making of users and energy systems.
According to Table 6, the total revenue in scenario 3 increases by 7.7 × 10⁸ yuan in terms of IES compared to scenario 2, with the revenue of two power companies increasing, the revenue of the power generation company rising by 1.29 × 10⁹ yuan, the revenue of the power grid company rising by 3.1 × 10⁸ yuan, but the revenue of the natural gas company falling by 8.3 × 10⁸ yuan. The reason is that, as shown in Table 5, the electricity price subsidy decided by the government is increased by 0.008 yuan/kw⋅h, and the gas price subsidy is reduced by 0.03 yuan/m3. Under this energy supply transformation subsidy policy, all energy companies choose the planning scheme that maximizes their gains or minimizes their losses in the equilibrium game process. The proportion of natural gas energy supply transformation only decreases by 0.54% as far as natural gas companies are concerned, and at the same time, it can also increase the demand of power generation companies for natural gas, as can be seen from the significant increase in the purchase cost of power generation companies. This decision is made on the basis of the decline of natural gas subsidies. Therefore, the income of natural gas companies increased by 9.6 × 10⁸ yuan, but due to the expansion of investment and production, the corresponding increase in investment costs and operating costs, the overall income of natural gas companies has declined. As for the power companies, the costs of investment and operation of power generation businesses as well as the revenue from electricity sales have increased due to the increase in subsidies for the transformation of the power supply as well as the increase in power load demand on the user side. The cost of coal purchase decreased by 4.13 × 10⁸ yuan while the cost of gas purchase increased significantly by 1.282 × 10⁹ yuan after the natural gas company reduced the price of gas. As a result, the cost of coal purchase decreased while the cost of gas purchase increased significantly. At the same time, more gas-fired units are used to undertake the task of power generation, which can also effectively control the environmental cost. However, due to the increase of total power generation, the environmental cost still increases slightly. Therefore, on the whole, the income of power generation companies is further improved. As far as the grid company is concerned, due to the increase of power users, the level of electricity load has been improved, and the grid company needs to improve the transmission capacity of the power network, so the investment cost of transmission lines has increased by 2.45 × 10⁷ yuan, and the transmission income has also increased by 5.2 × 10⁸ yuan. Because the increase of transmission distance also increases the reliability cost by 1.89 × 10⁸ yuan, the overall income of power grid companies has increased.
Table 7 shows that in the government’s case, in comparison to scenario 2, the total pollutant discharge in the area in scenario 3 is reduced by 1.97 × 10⁷ tons, with the pollutant discharge on the user side being reduced by 2.27 × 10⁷ tons and the pollutant discharge on the supply side being increased by 3 × 10⁶ tons. The reason is that the proportion of user-side electric energy supply and total energy supply transformation has increased, and more users choose pollution-free electric energy supply mode. On the other hand, from the environmental cost analysis of the above power generation companies, it can be seen that the increase in emissions on the supply side is not large, so the total emissions in the region can be reduced.
To sum up, Scenario 3 considers the government as the main body of the game to participate in the wide-area IES planning, and fully takes into account the impact of government policy guidance, which can effectively guide users to carry out energy supply transformation, thus improving the environmental benefits of user-side energy supply transformation. As far as the IES is concerned, under the adjustment of government subsidies, the investors effectively guarantee their own benefits or minimize losses through overall planning.
6 Conclusion
This article proposes a planning method for wide area IES, which considers the user’s integrated energy consumption behavior and policy guidance. The income optimization models are built separately for the users, the government, and various market participants in the large-area IES. This serves as the foundation for the establishment of a two-level game model for the joint planning of the wide-area IES, and the iterative search approach is used to solve the model. Finally, the model is validated using a simulation example. The simulation’s findings indicate that:
(a) Based on the correlation analysis of source and load side, this method fully considers the user’s CECB in the wide area IES planning, reveals the flexible weak coupling relationship between different forms of energy based on the user’s CECB as a link, and can realize the coordinated planning of users and IES. Based on the analysis of user’s CECB, the various loads on the demand side are reasonably evaluated and predicted, so as to guide the IES to carry out more refined planning and construction, and effectively enhance the income of each investor.
(b) This method fully takes into account the initiative of the government in the wide area IES planning, and considers the government as the main body of planning and decision-making, which can effectively guide users to carry out energy supply transformation, thus enhancing the environmental benefits of energy supply transformation on the user side. In the IES, joint planning among the investors can ensure their own interests.
Data availability statement
The original contributions presented in the study are included in the article/Supplementary Material, further inquiries can be directed to the corresponding author.
Author contributions
JL: Methodology, Writing–original draft, Writing–review and editing. TW: Conceptualization, Software, Writing–review and editing. GH: Conceptualization, Writing–original draft, MO: Conceptualization, Writing–original draft. WZ: Methodology, Validation, Writing–review and editing. TM: Methodology, Software, Validation, Writing–review and editing.
Funding
The authors declare that no financial support was received for the research, authorship, and/or publication of this article.
Conflict of interest
Authors JL, GH, and MO were employed by Shenzhen Power Supply Company.
The remaining authors declare that the research was conducted in the absence of any commercial or financial relationships that could be construed as a potential conflict of interest.
Publisher’s note
All claims expressed in this article are solely those of the authors and do not necessarily represent those of their affiliated organizations, or those of the publisher, the editors and the reviewers. Any product that may be evaluated in this article, or claim that may be made by its manufacturer, is not guaranteed or endorsed by the publisher.
References
Chen, J., Qi, B., Rong, Z., Peng, K., Zhao, Y., and Zhang, X. (2021). Multi-energy coordinated microgrid scheduling with integrated demand response for flexibility improvement. Energy 217, 119387. doi:10.1016/j.energy.2020.119387
Dai, Q., Deng, X., and Wu, X. (2021). Overview of comprehensive energy service business models under the energy internet. High. Volt. Appar. doi:10.13296/j.1001-1609.hva.2021.02.019
Ding, Y., Chen, H., and Wu, J. (2021). Multi-objective optimal dispatch of electricity-gas-heat integrated energy system considering comprehensive energy efficiency. Automation Electr. Power Syst. doi:10.7500/AEPS20200811002
Fang, P., Fu, W., Wang, K., Xiong, D., and Zhang, K. (2022). A compositive architecture coupling outlier correction, EWT, nonlinear Volterra multi-model fusion with multi-objective optimization for short-term wind speed forecasting. Appl. Energy 307, 118191. doi:10.1016/J.APENERGY.2021.118191
Fu, W., Jiang, X., Li, B., Tan, C., Chen, B., and Chen, X. (2023). Rolling bearing fault diagnosis based on 2D time-frequency images and data augmentation technique. Meas. Sci. Technol. 34, 045005. doi:10.1088/1361-6501/ACABDB
Gao, Q., Liu, C., and Jin, D. (2021). Optimizing the configuration of comprehensive energy systems in parks considering comprehensive demand response. High. Volt. Appar. doi:10.13296/j.1001-1609.hva.2021.08.022
Hao, R., Ai, Q., and Jiang, Z. (2018). Bi-Level game strategy for multi-agent with incomplete information in regional integrated energy system. Automation Electr. Power Syst. doi:10.7500/AEPS20170612013
Li, Q., Wang, L., and Zhang, Y. (2020). Review of coupling models and dynamic optimization methods for multi energy flow in energy internet. Power Syst. Prot. Control. doi:10.19783/j.cnki.pspc.191309
Li, W., Zhang, L., Qi, D., Chen, J., Wang, H., and Guo, Z. (2023a). Day-ahead optimal dispatch of electric-gas integrated energy systems considering zero-carbon emissions. Acta Energiae Solaris Sin. doi:10.19912/j.0254-0096.tynxb.2022-0206
Li, Z., Wu, L., and Xu, Y. (2021a). Risk-Averse coordinated operation of a multi-energy microgrid considering voltage/var control and thermal flow: an adaptive stochastic approach. IEEE Trans. SMART GRID 12, 3914–3927. doi:10.1109/TSG.2021.3080312
Li, Z., Wu, L., Xu, Y., Wang, L., and Yang, N. (2023b). Distributed tri-layer risk-averse stochastic game approach for energy trading among multi-energy microgrids. Appl. Energy 331, 120282. doi:10.1016/J.APENERGY.2022.120282
Li, Z., Yu, C., Abu-Siada, A., Li, H., Li, Z., Zhang, T., et al. (2021b). An online correction system for electronic voltage transformers. Int. J. Electr. Power Energy Syst. 126, 106611. doi:10.1016/j.ijepes.2020.106611
Liao, S., Xu, J., Sun, Y., Bao, Y., and Tang, B. (2018). Control of energy-intensive load for power smoothing in wind power plants. IEEE Trans. Power Syst. 33, 6142–6154. doi:10.1109/tpwrs.2018.2834940
Liu, X., Gao, B., and Li, Y. (2018). Review on application of game theory in power demand side. Power Syst. Technol. 42, 8. doi:10.13335/j.1000-3673.pst.2018.0039
Ma, H., Zheng, K., Jiang, H., and Yin, H. (2021). A family of dual-boost bridgeless five-level rectifiers with common-core inductors. IEEE Trans. Power Electron. 36, 12565–12578. doi:10.1109/TPEL.2021.3078533
Qu, K., Huang, L., Yu, T., and Zhang, Xi. (2018). Decentralized dispatch of multi-area integrated energy systems with carbon trading. Proc. CSEE. doi:10.13334/j.0258-8013.pcsee.170602
Shen, X., Ouyang, T., Yang, N., and Zhuang, J. (2021). Sample-based neural approximation approach for probabilistic constrained programs. IEEE Trans. neural Netw. Learn. Syst. 34, 1058–1065. doi:10.1109/TNNLS.2021.3102323
Wang, C., Chu, S., Ying, Y., Wang, A., Chen, R., Xu, H., et al. (2023). Underfrequency load shedding scheme for islanded microgrids considering objective and subjective weight of loads. IEEE Trans. Smart Grid 14, 899–913. doi:10.1109/TSG.2022.3203172
Wang, Q., Liu, D., Wu, J., Zhu, X., Luo, J., Chen, Y., et al. (2017). Comprehensive optimization including user behavior analysis for supply and demand sides of ies-mec. Electr. Power Autom. Equip. doi:10.16081/j.issn.1006-6047.2017.06.024
Wang, S., Zhang, S., and Cheng, H. (2022). Improved multi-energy flow calculation method for integrated energy system considering initial value optimization of natural gas system. Electr. Power Autom. Equip. doi:10.16081/j.epae.202109022
Wang, Z., Zhang, Z., Li, Y., Wang, T., and Liao, X. (2021). Coordinated scheduling method of integrated energy supply side under multi-energy complementary environment. Energy Environ. Prot. doi:10.19389/j.cnki.1003-0506.2021.12.030
Xu, P., Fu, W., Lu, Q., Zhang, S., Wang, R., and Meng, J. (2023). Stability analysis of hydro-turbine governing system with sloping ceiling tailrace tunnel and upstream surge tank considering nonlinear hydro-turbine characteristics. Renew. Energy 210, 556–574. doi:10.1016/J.RENENE.2023.04.028
Yang, H., Li, M., and Jiang, Z. (2020). Optimization of regional comprehensive energy system operation considering demand side electric and heating gas load response. Power Syst. Prot. Control. doi:10.19783/j.cnki.pspc.190774
Yang, N., Dong, Z., Wu, L., Zhang, L., Shen, X., Chen, D., et al. (2022b). A comprehensive review of security-constrained unit commitment. J. Mod. Power Syst. Clean Energy 10, 562–576. doi:10.35833/MPCE.2021.000255
Yang, N., Huang, Y., Dong, B., Xin, P., Liu, S., Ye, D., et al. (2019). Research on the joint planning method of electricity-gas integrated energy system based on multi-agent game. Zhongguo Dianji Gongcheng Xuebao/Proceedings Chin. Soc. Electr. Eng. doi:10.13334/j.0258-8013.pcsee.182021
Yang, N., Qin, T., Wu, L., Huang, Y., and Xing, C. (2022a). A multi-agent game based joint planning approach for electricity-gas integrated energy systems considering wind power uncertainty. Electr. Power Syst. Res. 204, 107673. doi:10.1016/j.epsr.2021.107673
Yang, N., Yang, C., Wu, L., Shen, X., Jia, J., Li, Z., et al. (2021a). Intelligent data-driven decision-making method for dynamic multi-sequence: an E-Seq2Seq based SCUC expert system. IEEE Trans. Industrial Inf. 18, 3126–3137. doi:10.1109/TII.2021.3107406
Yang, N., Yang, C., Xing, C., Ye, D., Jia, J., Chen, D., et al. (2021b). Deep learning-based SCUC decision-making: an intelligent data-driven approach with self-learning capabilities. IET Generation, Transm. Distribution 16 (4), 629–640. doi:10.1049/GTD2.12315
Yang, N., Ye, D., Zhou, Z., Jiazhan, C., Daojun, C., and Xiaoming, W. (2018b). Research on modelling and solution of stochastic SCUC under AC power flow constraints. IET Generation, Transm. Distribution 12 (15), 3618–3625. doi:10.1049/iet-gtd.2017.1845
Yang, Z., Peng, S., and Liao, Q. (2018a). Non-cooperative trading method for three market entities in integrated community energy system. Dianli Xit. Zidonghua/Automation Electr. Power Syst. doi:10.7500/AEPS20170915007
Yu, G., Liu, C., Tang, B., Chen, R., Lu, L., Cui, C., et al. (2022). Short term wind power prediction for regional wind farms based on spatial-temporal characteristic distribution. Renew. Energy 199, 599–612. doi:10.1016/J.RENENE.2022.08.142
Yu, Z., Qiao, Z., and Lei, W. (2023). Optimal operation of regional microgrids with renewable and energy storage: solution robustness and nonanticipativity against uncertainties. IEEE Trans. Smart Grid. doi:10.1109/TSG.2022.3185231
Zhang, L., and Luo, Y. (2018). Combined heat and power scheduling: utilizing building-level thermal inertia for short-term thermal energy storage in district heat system. IEEJ Trans. Electr. Electron. Eng. 13, 804–814. doi:10.1002/tee.22633
Zhang, M., Chen, J., Yang, Z., Peng, K., Zhao, Y., and Zhang, X. (2021). Stochastic day-ahead scheduling of irrigation system integrated agricultural microgrid with pumped storage and uncertain wind power. Energy 237, 121638. doi:10.1016/J.ENERGY.2021.121638
Zhang, S., and Lv, S. (2018). Evaluation method of park-level integrated energy system for microgrid. Power Syst. Technol. doi:10.13335/j.1000-3673.pst.2018.0693
Zhang, Y., Wei, L., Fu, W., Chen, X., and Hu, S. (2023). Secondary frequency control strategy considering DoS attacks for MTDC system. Electr. Power Syst. Res. 214, 108888. doi:10.1016/J.EPSR.2022.108888
Zhang, Y., Xie, X., Fu, W., Chen, X., Hu, S., Zhang, L., et al. (2022). An optimal combining attack strategy against economic dispatch of integrated energy system. IEEE Trans. Circuits Syst. II Express Briefs 70, 246–250. doi:10.1109/tcsii.2022.3196931
Zheng, G., Li, H., Zhao, B., Wu, B., and Tang, W. (2018). Comprehensive optimization of electrical/thermal energy storage equipments for integrated energy system near user side based on energy supply and demand balance. Dianli Xit. Baohu yu Kongzhi/Power Syst. Prot. Control. doi:10.7667/PSPC171221
Zhou, W., and Zhao, S. (2013). Quantitative analysis of traveler route choice behavior based on Mixed Logit model. J. Jilin Univ. Technol. Ed. doi:10.13229/j.cnki.jdxbgxb2013.02.040
Zhu, B., Liu, Y., Zhi, S., Wang, K., and Liu, J. (2023). A family of bipolar high step-up zeta–buck–boost converter based on “coat circuit”. IEEE Trans. Power Electron. 38, 3328–3339. doi:10.1109/TPEL.2022.3221781
Zhu, X. (2003). Implementing a global energy strategy and establishing a global supply system. Int. Pet. Econ. doi:10.3969/j.issn.1004-7298.2003.04.001
Appendix
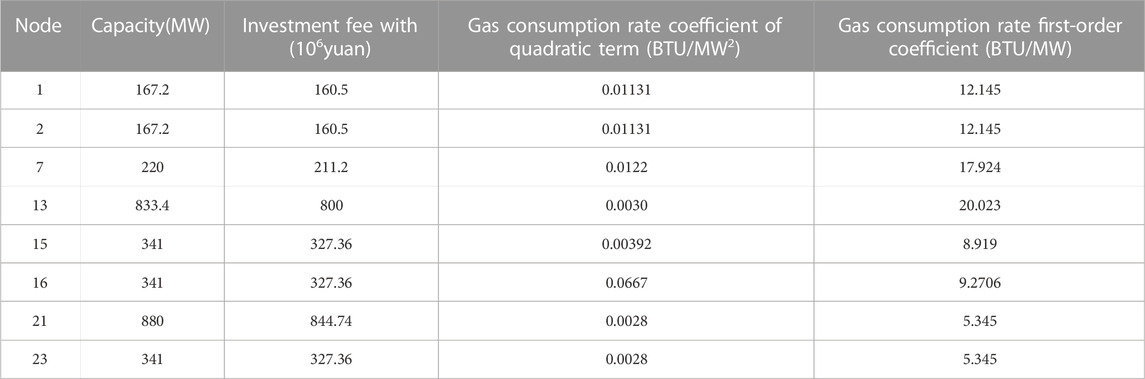
TABLE A1. Data of gas turbine units to be selected.
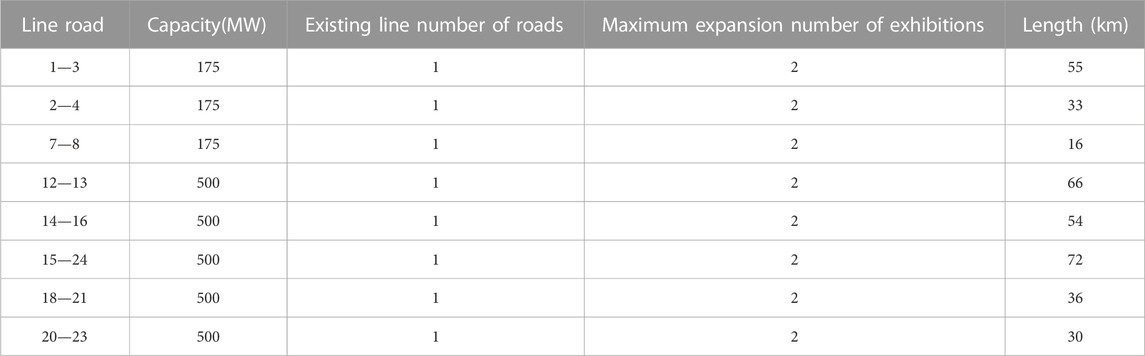
TABLE A2. Data of transmission lines to be selected.
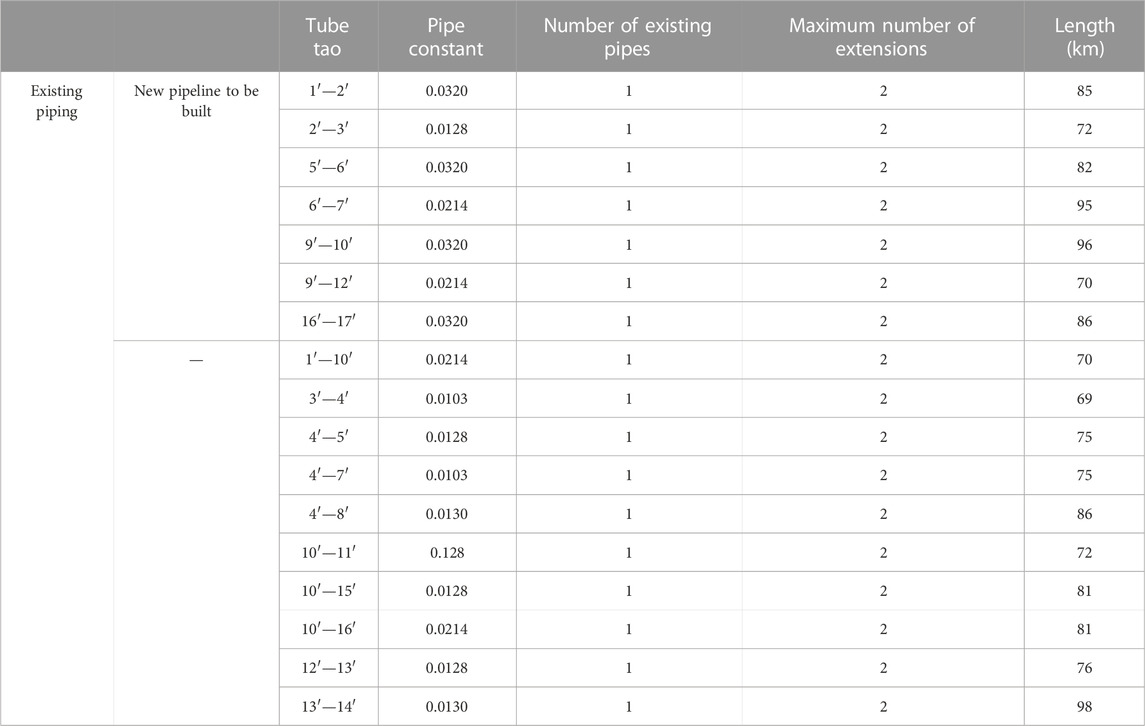
TABLE A3. Existing and candidate pipeline data.
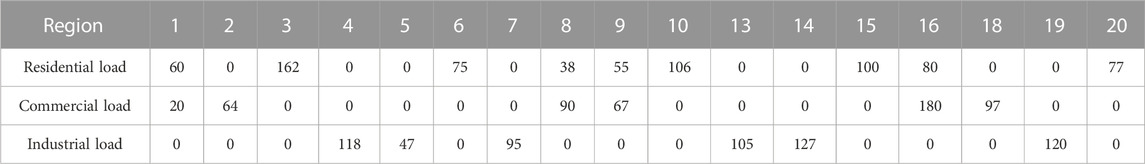
TABLE A4. Coal-fired load (MW) to be renovated for various types of users in each region.
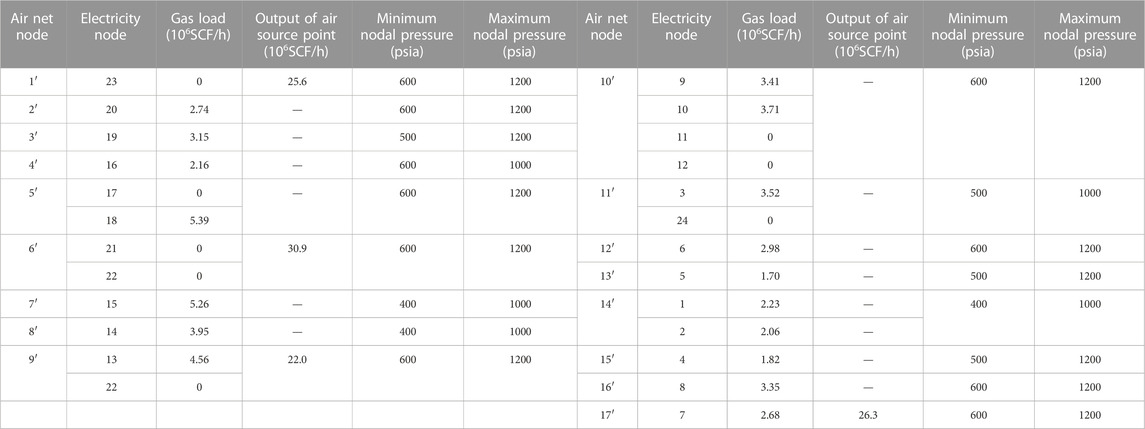
TABLE A5. Relevant parameters of natural gas network.
Keywords: wide area integrated energy system planning, comprehensive energy use behavior of users, weak coupling, government planning, game theory
Citation: Li J, Wang T, Huang G, Ou M, Zhao W and Mao T (2023) Research on joint planning method of supply and demand considering users’ comprehensive energy consumption behavior and policy orientation. Front. Energy Res. 11:1294287. doi: 10.3389/fenrg.2023.1294287
Received: 14 September 2023; Accepted: 13 October 2023;
Published: 08 November 2023.
Edited by:
Wenlong Fu, China Three Gorges University, ChinaReviewed by:
Yikui Liu, Stevens Institute of Technology, United StatesHengrui Ma, Qinghai University, China
Copyright © 2023 Li, Wang, Huang, Ou, Zhao and Mao. This is an open-access article distributed under the terms of the Creative Commons Attribution License (CC BY). The use, distribution or reproduction in other forums is permitted, provided the original author(s) and the copyright owner(s) are credited and that the original publication in this journal is cited, in accordance with accepted academic practice. No use, distribution or reproduction is permitted which does not comply with these terms.
*Correspondence: Jiangnan Li, x18871136145@163.com