Joint distribution of lightning and wind speed and its impact on the transmission system
 Yunfeng Xia1
  Sheng Su
- 1Hainan Power Transmission and Transformation Maintenance Branch of Hainan Power Grid Co., Ltd., Haikou, China
- 2College of Electrical and Information Engineering, Changsha University of Science and Technology, Changsha, China
Distribution of lightning plays a key role in lightning protection of transmission lines. The design of wind deviation under lightning overvoltage of the transmission tower is an empirical parameter in the transmission line design code. Meteorological data from Hong Kong are investigated to analyze the joint distribution of lightning and wind speed. It has been uncovered that daily cloud-to-ground (CG) flashes follow the Burr distribution, which is highly skewed toward a few days with notable lightning. The lightning and wind follow a Gumbel copula joint distribution. According to empirical and theoretical distribution, there are 239 days with more than 1,000 CG lightning flashes per day, and approximately 20% of these days have a maximum wind speed of approximately or over 15 m/s. In 5 days with the number of CG lightning flashes above 30,000, 3 days have a maximum wind speed of over 15 m/s and the other 2 days have a maximum wind speed of over 10 m/s, which suggests that the severe convection with a squall line contributes much to the likelihood of the days with high wind and lightning storms.
1 Introduction
Power utility companies face unprecedented challenges due to extreme weather. Enhancements in weather forecasting allow utilities to make data-driven decisions to both prevent and respond to uncontrolled weather conditions, which can significantly improve the reliability and resilience of power systems (Muhs et al., 2021). The statistical distribution of lightning data is an important basis for the lightning protection design of transmission lines. Traditionally, due to the limited means for lightning detection and the lack of lightning data, the research on lightning protection of power systems mostly relies on empirical formulas (IEEE, 2013). The lightning location system, which has been widely used since the 21st century, has accumulated a large amount of lightning data, which can provide detailed and accurate information such as lightning time, longitude and latitude, frequency, lightning type, and lightning current amplitude (Anderson and Eriksson, 1979; Li et al., 2013), laying a significant foundation for deepening the understanding of lightning and improving work on lightning protection. By integrating big data on lightning, researchers focused on in-depth analysis of topography, elevation, and lightning failure rate (Chen et al., 2004; Rodrigues et al., 2010; Ishimoto et al., 2019), which effectively promoted the progress of lightning protection. Researchers also used the laws governing thunderstorm movement to issue early warnings about the risk of line lightning trips and reduce their impact on power grids by implementing preventive measures (Miyazaki and Okabe, 2010; Michishita et al., 2012).
The existing lightning data research mainly focuses on analyzing the lightning data, with less consideration given to the impact of combined meteorological factors. In order to ensure the reasonable design of tower head insulation coordination under combined weather conditions, it is vital to comprehensively consider the internal and external overvoltage and select an appropriate wind speed for wind deviation calculation on the basis of taking the geographical and climatic differences into account (Michishita et al., 2012). Traditionally, the lack of high-density wind-speed data from meteorological stations resulted in only empirical parameters being used for wind deviation calculation when designing tower head insulation coordination (Michishita et al., 2012). In addition, it is generally believed that the frequent windage yaw flashover of transmission lines is caused by power frequency overvoltage or switching overvoltage, except for lightning overvoltage. However, the analysis of the 500-kV tower windage yaw flashover fault in the Jiangxi power grid in July 2014 suggests that the fault is caused by a windage yaw flashover of tower head gap under lightning overvoltage (Borghetti et al., 2017). Therefore, we should take the joint probability distribution of lightning and wind speed into account when tracing a lightning strike fault.
For further study, we have collected the data on lightning and wind speed in Hong Kong in this paper. The remainder of this paper is organized as follows: the statistical distribution characteristics of lightning and wind speed are analyzed in Section 2. Then, the joint empirical probability distribution of lightning and wind speed is analyzed in Section 3. Section 4 uses a binary copula joint distribution function to fit the joint probability distribution of lightning and wind speed, and the probability of a thunderstorm with high wind speed under theoretical distribution and empirical distribution is calculated. Finally, the formation mechanism of high concurrency of lightning and wind speed is analyzed in Section 5, and Section 6 concludes this paper.
2 Statistical analysis of lightning and wind
We collected historical lightning and wind speed data of Hong Kong from 2005 to 2013 using the information obtained from the Hong Kong Observatory (Kumaraswamy et al., 2011), including the lightning data of 113o35′E−114o36′E and 21o54′N−22o42′N recorded by six monitoring stations located in Macau, Sanshui, Yangjiang, and Huidong and the average wind speed at 10-min intervals recorded at 10 m altitude by the Changzhou meteorological station. The wind and lightning data are available in Su (2023). The lightning location network comprises six stations. They are located at Chung Hom Kok (22o12’43″N, 114o11’53″E), Tsim Bei Tsui (22o18’53″N, 114o09’40″E), Sha Tau Kok (22o32’33″N, 114o11’48″E), Sanshui (22o58’09″N, 112o53’31″E), and Huidong (22o53’10″N, 114o47’43″E) in Guangdong and Taipa (22o09′31″N, 113o33’49″E) in Macao. The accuracy in determining the location of cloud-to-ground lightning strokes is 500 m within the network when all stations are operational. Among the 1,148 lightning days investigated, the total number of lightning strikes was 1,994,067, including 1,385,980 CG flashes. Since CG flashes are the main factor affecting the security of power grids, if it is not clearly stated otherwise, the data represent CG flash data.
2.1 Temporal distribution of lightning
Lightning is often accompanied by rainfall, with strong seasonality and an obvious uneven distribution. The temporal and spatial distributions of lightning have been extensively investigated. However, there are few studies on the joint distribution of lightning and wind currently. The number of CG flashes on thunderstorm days and the wind speed on strong thunderstorm days have an impact on the lightning strike probability of transmission lines, which calls for a necessary study on the statistical distribution of CG flashes. After counting the number of daily CG flashes, the statistical distribution of CG flashes can be drawn, as shown in Figure 1. The x-axis denotes the number of CG flashes in a day, and the unit is 1000 flashes. The y-axis denotes the associated likelihood.
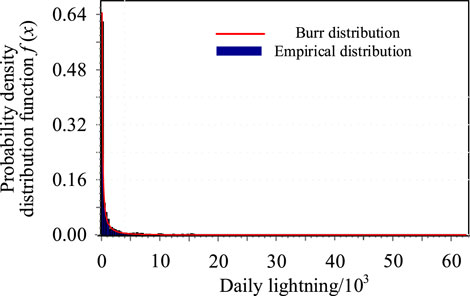
FIGURE 1. Probability distribution of daily lightning.
According to the goodness-of-fit test for each statistical distribution of CG flash frequency, the p-value of the Kolmogorov–Smirnov (KS) test (Irudayaraj et al., 2023; Rezapour and Jamali, 2023) under the Burr distribution is 0.082, which meets the requirement of significance level and ranks the highest in goodness-of-fit. Therefore, it can be considered that the CG flash frequency obeys the Burr distribution. As shown in Figure 1, the column denotes the empirical density distribution of the sample and the red line denotes the Burr distribution fitting line. It can be inferred from Figure 1 that the theoretical distribution curve is basically consistent with the empirical distribution.
Burr distribution (Zhang et al., 2022) is a type of fat-tailed distribution, which is mainly used to describe highly uneven statistical characteristics, and is widely applied to financial and insurance risk assessment. According to the Burr function, the probability density distribution of daily lightning frequency can be described as follows (1):
where fB(x) is the probability density of daily lightning frequency x; k = 4.9605 is the shape parameter; α = 0.4465 is a dimensionless factor;β = 8,718.4 is the scale parameter; and the dimension is the same as that of the daily lightning frequency.
Because the frequency of CG flashes obeys the Burr distribution with highly uneven distribution characteristics, the number of strong thunderstorm days is small, but CG flashes account for a relatively high proportion of the total. It can be seen from Table 1 that in the 21 days with the highest occurrences of CG flashes in Hong Kong, the total number of CG flashes was 491,774, accounting for 35.4% of the overall CG flash occurrences. The total number of CG flashes in 30 lightning days, with more than 10,000 CG flashes in a day, is 593,760, accounting for 42.8% of the total. The number of CG flashes on 9 September 2010 was 62,495, accounting for 4.5% of the total. In general, the number of CG flashes accounts for a high proportion on strong thunderstorm days, which is the major object of lightning protection.

TABLE 1. Days with most CG flashes.
2.2 Distribution of wind speed
Studies have shown that wind speed can generally be characterized by Weibull distribution (Khoubseresht et al., 2023), and the Weibull distribution function is given by
where fw(x) denotes the probability density of wind speed; k = 1.9550 denotes the dimensionless shape parameter; c = 7.9947 denotes the scale parameter; and the dimension denotes the same as that of velocity.
The fitting distribution of wind speed in Hong Kong is depicted in Figure 2. The blue stripe denotes the empirical density distribution, and the red curve denotes the fitted Weibull distribution probability density function. The fitting probability density distribution curve is basically consistent with the edge of the empirical distribution frequency histogram, and the p-value of the KS test is 0.293, which meets the requirement of the significance level, so the fitting distribution of wind speed obeys the Weibull distribution. It can be seen from Figure 2 that the wind speed in Hong Kong is mainly concentrated in the range of 3–12 m/s, and the cumulative probability of wind speed above 15 m/s is 2.97%.
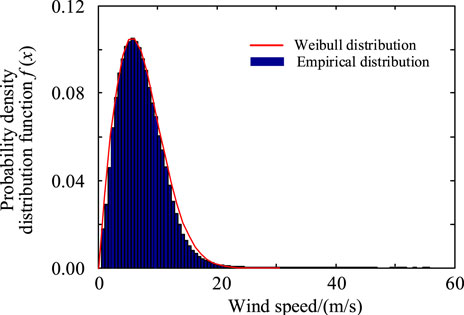
FIGURE 2. Probability distribution of wind in Hong Kong.
3 Joint empirical distribution of lightning and wind speed
According to the transmission line design manual, the insulation coordination design at the tower head chooses the insulator form, number of pieces, and air gap distance between the transmission lines and tower under corresponding wind speeds based on the power frequency overvoltage, switching overvoltage, and lightning overvoltage (Michishita, et al., 2012). Taking Figure 3 as an example, l is the length of the insulator string and φ and R are the wind deviation angle and air gap of the insulator string under the corresponding overvoltage, respectively. The wind deviation of the insulator string under various kinds of overvoltage depends on the corresponding value of the wind speed calculation.

FIGURE 3. Diagram of wind deviation flashover at the tower head.
The selection principle for the air gaps at the tower head is to consider that the insulator string can withstand three kinds of overvoltage after wind deviation. Among them, the gap of power frequency overvoltage is determined according to the maximum design wind speed of the transmission line. The gap of switching overvoltage is determined according to the wind speed of no less than 15 m/s. The gap of lightning overvoltage is determined according to the wind speed of 10 m/s in the inland region and 15 m/s in the coastal region (Michishita et al., 2012). However, the probability of the windage yaw flashover under lightning overvoltage depends on the joint probability distribution of lightning and wind speed. When a strong thunderstorm is accompanied by a high wind speed over that of the design code, the risk of the windage yaw flashover increases notably.
In order to master the overall situation of the wind speed deviation during strong thunderstorm days, 239 days are selected from 1,148 lightning days based on the standard of more than 1,000 times of CG flashes. The maximum wind speed of the day is found from the corresponding wind speed data, and the joint empirical probability distribution of lightning and wind speed is drawn, as shown in Figure 4. In this figure, the horizontal axis is the daily maximum wind speed, and the vertical axis is the year and month. Scatter points indicate the daily CG flashes and maximum wind speed. Thousand times of CG flashes in a day is taken as the red–green color dividing point. The larger the circle and the darker the color, the more the number of CG flashes. On the other hand, the smaller the circle and the greener the color, the fewer the number of CG flashes. To facilitate the classification, the daily maximum wind speed distribution diagram is divided into two parts with 15 m/s as the boundary. The shadow area on the right is strong thunderstorm days with wind speeds not lower than the design wind speed, which is the high-risk object increasing the probability of the windage yaw flashover under lightning overvoltage. According to Figure 4, it can be inferred as follows.
1) Strong thunderstorm days with daily CG flashes over 10,000 times are usually accompanied by strong winds, which are distributed in the high wind speed area on the right, while the days with fewer CG flashes tend to be in the low wind speed area on the left. There is an obvious correlation between CG flashes and wind speed.
2) Among the five strong thunderstorm days with more than 30,000 occurrences of CG flashes, 60% of them have a high wind speed of no less than 15 m/s, and the maximum wind speed in the left 2 days is also close to 10 m/s. Among the 27 strong thunderstorm days with more than 10,000 times of CG flashes, the wind speed of 21 days is more than 10 m/s, and the corresponding count of CG flashes is 397,981, accounting for 28.7% of the total. According to the statistical results of the samples, high wind speed and strong thunderstorms have certain concurrency.
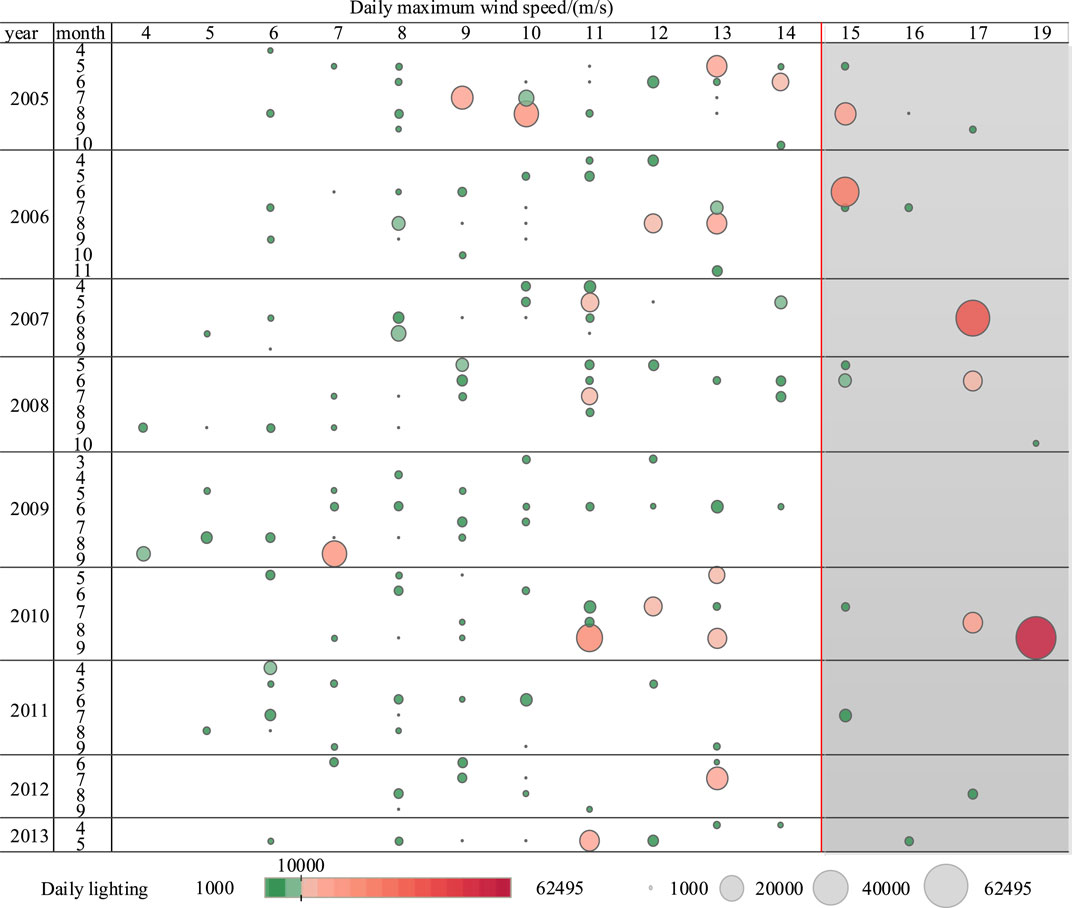
FIGURE 4. Joint distribution of daily lightning frequency and daily maximum wind speed.
Table 2 lists thunderstorm days with maximum wind speeds over the design speed. The days with the maximum value of CG flashes in a year are marked in bold. It can be seen from Table 2 that there are more than 10,000 CG flashes in 6 days among the 19 days with thunderstorms and strong winds. Except for 2009, the days with the most CG flashes from 2006 to 2010 belong to the days with thunderstorms and strong winds. As shown in Figure 2, although the days of thunderstorm and high wind with more than 1,000 times CG flashes and wind speed around/over the design wind speed are only 19 days, the number of CG flashes in this period is 216,656, accounting for 20.66% of the total of more than 10,000 times of daily CG flashes due to the fat-tailed distribution characteristic of lightning in the time domain. In the actual scenario, a considerable proportion of the windage yaw flashover of the transmission line may be with high wind speed when a thunderstorm occurs, which will adversely affect the safe operation of the transmission line.

TABLE 2. Days with thunderstorms and high winds.
4 Joint distribution of lightning and wind speed
4.1 Binary copula joint distribution function
When high winds are accompanied with strong thunderstorms, the risk of the windage yaw flashover under lightning overvoltage increases significantly, and the joint probability distribution of lightning and wind speed should be taken into account in the wind deviation design of the transmission tower so as to ensure the protection effect under the combined meteorological conditions of thunderstorms and high winds.
Under the influence of relevance, the statistical characteristics of the joint probability distribution of lightning and wind speed may be significantly different from the univariate distribution (Khoubseresht et al., 2023). Sklar proposed the copula theory, which can decompose the multidimensional joint distribution function into multiple marginal distribution functions and one copula function, and the copula function can describe the relevance characteristics among variables (Henderson et al., 2021). In recent years, relevant theories and methods have been developed rapidly and successfully applied to financial risk assessment and flood peak impact analysis.
According to the joint distribution of multi-dimensional random variables, the edge distribution can be determined, but it is difficult to determine the multi-dimensional joint distribution using the edge distribution. However, copula theory solves this problem to a certain extent. Copula function C (u1, u2, ···, uN) denotes the connection function of the joint distribution function F (x1, x2,···, xN) of multidimensional random variables and corresponding edge distribution functions F1 (x1), F2 (x2), ···, Fn(xn), where F (x1, x2,···, xN) = C [F1 (x1), F2 (x2), ···, Fn(xn)] (Khoubseresht et al., 2023). The definition of the binary copula function C(u, v) corresponding to the joint distribution of binary random variables is as follows (Henderson et al., 2021):
(1) The domain of C (u, v) is [0,1]2.
(2) If any variable (u, v) is taken from the closed interval [0,1]2, then C (u, 1) = u, C (1, v) = v.
(3) If any variable (u, v) is taken from the closed interval [0,1]2, then C (u, 1) = u, C (1, v) = v; that is, there is a zero base plane for C (u, v).
(4) Taking variables (u1, v1) and (u2, v2) from the closed interval [0,1]2, in [u1,u2]×[v1,v2], there is C (u2, v2)−C (u2, v1)−C (u1, v2) C (u1, v1) ≥ 0; that is, C (u, v) is a two-dimensional increment.
(5) For any variable (u, v) in [0,1]2, suppose that F(x) and G(y) are continuous univariate distribution functions, let u = F(x) and v = G(y), if u and v obey uniform distribution in [0,1], that is, C (u, v) is a bivariate distribution function whose marginal distribution obeys uniform distribution, and for any point (u, v) in the domain of definition, 0 ≤ C (u, v) ≤ 1.
4.2 Common copula function and model fitting
Copula functions are mainly divided into five categories: normal, t-, Gumbel, Clayton, and Frank copula (Khoubseresht et al., 2023). The detailed binary copula functions are shown in Table 3. Among them, ρ of normal copula and t-copula functions is the correlation coefficient among variables, Φ−1 is the inverse function of the normal distribution function, k is the degree of freedom, and tk−1 is the inverse function of the univariate t-distribution function when the degree of freedom is k. After the process of per-unit according to the maximum value, the fitting parameters of five functions can be calculated by taking the lightning and wind speed data of the daily lightning occurrences over 1,000. The KS test was conducted for the aforementioned five distributions, and all resulting p-values exceeding 0.05 were considered statistically significant.
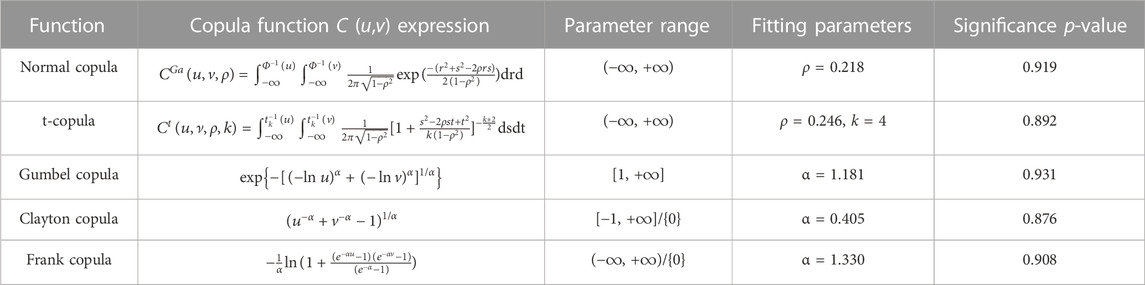
TABLE 3. Common binary copula function.
In order to evaluate which copula function is more suitable for the joint probability distribution of lightning and wind speed, the square Euclidean distance index is introduced to detect the goodness-of-fit (Henderson et al., 2021).
Let (xi, yi)(i = 1,2,···,n) be a sample taken from a two-dimensional sequence (X, Y), the empirical distribution functions of X and Y are marked as Fn(x) and Gn(y), respectively, and then the sample empirical function copula is defined as follows:
where, I [·] is a characteristic function and when Fn(xi)≤u,
After obtaining the empirical copula function according to Eq. 3, they are compared with the five fitting functions, and then the square Euclidean distance can be calculated according to Eq. 4, and the result is shown in Table 4. After comparing the distance between the empirical distribution function and the fitting distribution function, the Gumbel copula distribution function with the minimum square Euclidean distance is selected as the optimal evaluation model. According to the Gumbel copula distribution function and its distribution parameters, the fitting probability density function c(u, v) of the joint probability distribution of lightning and wind speed can be drawn, as shown in Figure 5.

TABLE 4. Euclidean distance of binary copula functions.
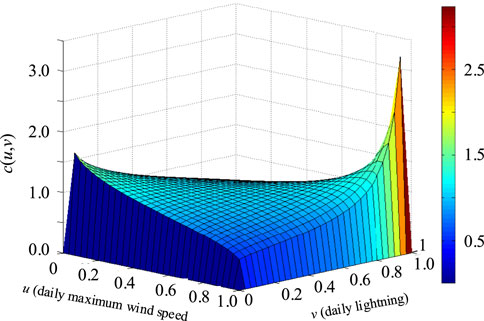
FIGURE 5. Binary Gumbel copula distribution of lightning and wind speed.
In the diagram of the binary Gumbel-copula probability distribution of lightning and wind speed, coordinates u and v denote the cumulative distribution functions of daily maximum wind speed x and daily lightning times y, respectively, and coordinate c(u,v) denotes the probability density under the daily maximum wind speed x and daily lightning times y. To facilitate identification, areas with a higher probability density in the joint distribution of lightning and wind speed are marked in red, while those with a lower probability density are marked in blue. As shown in Figure 5,
(1) The left and right ends are obviously tilting. The probability of strong thunderstorms and high winds on the right side is higher than that on the left side, which indicates that the maximum wind speed and daily lightning frequency have concurrent characteristics. In addition, in the 6 days when the wind speed is more than 15 m/s and CG flashes are more than 10,000 times, the lightning frequency reaches 182,807 times, accounting for 13.19% of the total. It can be considered that the lightning frequency of days with strong thunderstorms and high wind speeds significantly increases the probability of the windage yaw flashover under lightning overvoltage.
(2) The upper and lower sides of Figure 5 show obvious depressions, indicating that the probability of the occurrence of a strong thunderstorm with low wind speed or a strong wind with less lightning is low.
(3) Compared with Figure 4, it can be seen that most of the red spots of strong thunderstorms are distributed in the high wind speed area on the right side, while weak thunderstorms with fewer CG flashes are concentrated in the low wind speed area on the left side, which corresponds to the tilting situation of the left and right ends in the theoretical distribution of Figure 5.
According to the copula joint distribution function, the probability of lightning accompanied by high wind speeds can be calculated theoretically. Based on the analysis in the previous section, the cumulative distribution function of lightning F(x) and the cumulative distribution function of wind speed G(y) can be represented as (5) and (6), where x denotes wind speed and y denotes the number of daily lightning occurrences.
It can be seen from Table 3 that the Gumbel copula function CGum(F(x), G(y)) is given by
In order to verify the statistical characteristics of the empirical distribution of thunderstorms and wind speeds, (5)–(7) can be substituted into (8), and the probability of thunderstorm days over the design wind speed with more than 1,000 times CG flashes is 19.81%, which is close to 20.66% of the empirical distribution. Therefore, the theoretical distribution calculation can effectively verify the empirical distribution. Although the days of strong thunderstorms and high wind are numerable, the count of CG flashes in strong thunderstorm and high wind days accounts for a relatively high proportion of the total, which will increase the risk of the windage yaw flashover for lightning overvoltage in this period.
5 Mechanism explanation of joint distribution characteristics of lightning and wind speed
For the purpose of understanding the reasons for the high concurrency of lightning and wind speed in Hong Kong, we conducted an investigation by taking the concurrent days of lightning and wind speed listed in Table 2 as clues. Since the annual average wind speed in Hong Kong is approximately 5 m/s, excluding typhoon periods, there are few high-wind speed scenarios. However, in Table 2, the wind speed is approximately 20 m/s on days with thunderstorms, and high-wind scenarios are rare. After gaining a thorough understanding of the local weather conditions (Squall and Feng, 2005), it was found that the Shihu wind in the Pearl River Delta region might be the root cause contributing to days with strong thunderstorms and high wind speed.
From the meteorological point of view, Shihu wind is a strong gust caused by a squall line. As a small- and medium-scale weather system, the squall line is a strong thunderstorm belt formed by multiple thunderstorm areas or single-cell thunderstorms arranged laterally. Its horizontal length and width are between 1 km and hundreds of kilometers (Feldmann et al., 2023). Where the squall line sweeps, there will be instantaneous wind speed surges and sudden changes in wind direction, and the instantaneous wind speed can reach 40 m/s. The squall line is usually accompanied by thunderstorms, high winds (or tornadoes), hail, and short-term rainstorms, among which thunderstorms and high winds have the highest frequency, which is the main catastrophic convective weather in summer in China (Squall and Feng, 2005). The squall line affecting Southern China has evident meteorological characteristics. In early summer or early autumn, squall lines often appear in the front rain belt along the cold front going south or when tropical cyclones are close to Southern China (Squall and Feng, 2005). Table 2 shows that there are more than 10,000 days with strong thunderstorms and high winds during this period. It can be inferred that squall lines are the fundamental cause of thunderstorms and high winds in Hong Kong. In addition, because days with thunderstorms and high winds under squall lines are common in the whole country (Wang et al., 2012; Chong et al., 2015), it is possible that the same problems of wind speed over wind deviation design speed exist in other areas during strong thunderstorms.
6 Conclusion and future work
Aiming at the frequent occurrence of the windage yaw flashover at the transmission line tower head, the wind speed calculation parameters of wind deviation design under lightning overvoltage are always empirical, and the concurrence of thunderstorms and high winds is not fully considered. In order to fully characterize this relationship, we studied the joint distribution of lightning and wind speed in Hong Kong, which can be concluded as follows:
(1) Wind speed in Hong Kong follows the Weibull distribution, while the frequency of the daily number of lightning occurrences follows the Burr distribution, which is a fat-tailed distribution, in the time domain. Strong thunderstorm days with a higher frequency of daily lightning are concentrated in the tail, and 21 thunderstorm days with the largest number of lightning occurrences account for 35.4% of the total number of CG flashes.
(2) The joint distribution of lightning and wind speed in Hong Kong follows the bivariate Gumbel copula distribution function. In the theoretical distribution, 19.81% of the CG flashes are accompanied by a high wind speed higher than the wind deviation design speed (15 m/s), which is close to the empirical distribution of 20.66%. Under the conditions of thunderstorms and high winds, transmission lines have a higher risk of the windage yaw flashover under lightning overvoltage.
(3) Thunderstorms and high winds in the adverse climate of the squall line are the main reason for the high probability of wind speed over the speed of wind deviation design under thunderstorms. According to our study, it can be inferred that Hong Kong and other adjacent regions of the Pearl River Delta may have similar problems. Therefore, it is highly preferred to consider the joint distribution of lightning and wind speed and then optimize the calculation of wind speed of wind deviation of transmission towers.
(4) It should be noted that the gap setting of lightning overvoltage in the transmission line of the existing code was determined decades ago without sufficient lightning and meteorological data. We demonstrated its defects in Hong Kong. Since the joint distribution of wind speed and lightning is determined by the regional climate, the appropriate gap setting of other regions should be determined with an in-depth investigation of regional meteorological and lightning data
In addition, due to the lack of detailed historical meteorological data in power utilities, there are other similar problems with using empirical parameters without considering the joint distribution of relevant meteorological factors in the design of transmission lines. For example, several research studies believe that the icing thickness of the transmission line can be denoted by half of the maximum icing thickness observed during the years with the maximum wind speed, and the design load can be calculated at half of the maximum wind speed under the maximum icing condition, etc., which are also worthy of further investigation.
Data availability statement
The original contributions presented in the study are included in the article/Supplementary material; further inquiries can be directed to the corresponding author.
Author contributions
YX: writing–original draft and writing–review and editing. BL: data curation, investigation, methodology, software, conceptualization, and writing–review and editing. XZ: supervision, validation, and Writing–review and editing. SS: funding acquisition, resources, validation, and writing–original draft.
Funding
The author(s) declare that financial support was received for the research, authorship, and/or publication of this article. This research is supported by the National Natural Science Foundation of China (No. 51777015).
Conflict of interest
Author YX was employed by the Hainan Power Transmission and Transformation Maintenance Branch of Hainan Power Grid Co., Ltd.
The remaining authors declare that the research was conducted in the absence of any commercial or financial relationships that could be construed as a potential conflict of interest.
Publisher’s note
All claims expressed in this article are solely those of the authors and do not necessarily represent those of their affiliated organizations, or those of the publisher, the editors, and the reviewers. Any product that may be evaluated in this article, or claim that may be made by its manufacturer, is not guaranteed or endorsed by the publisher.
References
Anderson, R. B., and Eriksson, A. J. (1979). Lightning parameters for engineering applications. Council for Scientific and Industrial Research.
Borghetti, A., Napolitano, F., Nucci, C. A., and Tossani, F. (2017). Influence of the return stroke current waveform on the lightning performance of distribution lines. IEEE Trans. Power Deliv. 32 (4), 1800–1808. doi:10.1109/tpwrd.2016.2550662
Chen, S. M., Du, Y., and Fan, L. M. (2004). Lightning data observed with lightning location system in Guang-Dong Province, China. IEEE Trans. Power Deliv. 19 (3), 1148–1153. doi:10.1109/tpwrd.2004.829884
Chong, F., Yu, X., and Zhu, W. (2015). Characteristics of the thunderstorm gals process in hunan and Guangdong on 20 march 2013. Meteorol. Mon. 41 (11), 1305–1314. doi:10.7519/j.issn.1000-0526.2015.11.001
Feldmann, M., Hering, A., Gabella, M., and Berne, A. (2023). Hailstorms and rainstorms versus supercells—a regional analysis of convective storm types in the Alpine region. npj Clim. Atmos. Sci. 6, 19. doi:10.1038/s41612-023-00352-z
Henderson, S. B., Shahirinia, A. H., and Tavakoli Bina, M. (2021). Bayesian estimation of copula parameters for wind speed models of dependence. IET Renew. Power Gener. 15 (16), 3823–3831. doi:10.1049/rpg2.12297
Irudayaraj, A. X. R., Wahab, N. I. A., Veerasamy, V., Premkumar, M., Radzi, M. A. M., Sulaiman, N. B., et al. (2023). Decentralized frequency control of restructured energy system using hybrid intelligent algorithm and non-linear fractional order proportional integral derivative controller. IET Renew. Power Gener. 17 (8), 2009–2037. doi:10.1049/rpg2.12746
Ishimoto, K., Sato, T., and Nagashima, T. (2019). “Calculation of wire breaking rate of medium-voltage distribution line due to lightning,” in 2019 11th Asia-Pacific International Conference on Lightning (APL), Hong Kong, China, 12-14 June 2019, 1–4. doi:10.1109/APL.2019.8816007
Khoubseresht, O., Rajabinezhad, M., and Mousavi, S. Y. M. (2023). An analytical optimum method for simultaneous integration of PV, wind turbine and BESS to maximize technical benefits. IET Generation, Transm. Distribution 17 (10), 2207–2227. doi:10.1049/gtd2.12801
Kumaraswamy, B. G., Keshavan, B. K., and Ravikiran, Y. T. (2011). “Analysis of seasonal wind speed and wind power density distribution in Aimangala wind form at Chitradurga Karnataka using two parameter weibull distribution function,” in 2011 IEEE Power and Energy Society General Meeting, Detroit, MI, USA, 24-28 July 2011, 1–4.
Li, Y., Yang, Q., Sima, W., Li, J., and Yuan, T. (2013). Optimization of transmission-line route based on lightning incidence reported by the lightning location system. IEEE Trans. Power Deliv. 28 (3), 1460–1468. doi:10.1109/tpwrd.2013.2256473
Michishita, K., and Hongo, Y. (2012). Flashover rate of 6.6-kV distribution line due to direct negative lightning return strokes. IEEE Trans. Power Deliv. 27 (4), 2203–2210. doi:10.1109/tpwrd.2012.2212214
Miyazaki, T., and Okabe, S. (2010). Experimental investigation to calculate the lightning outage rate of a distribution system. IEEE Trans. Power Deliv. 25 (4), 2913–2922. doi:10.1109/tpwrd.2010.2053563
Muhs, J., Parvania, M., Nguyen, H. T., and Palmer, J. A. (2021). Characterizing probability of wildfire ignition caused by power distribution lines. IEEE Trans. Power Deliv. 35 (6), 3681–3688. doi:10.1109/tpwrd.2020.3047101
Rezapour, H., and Jamali, S. (2023). Postfault optimal islanding of smart grids using a reinforcement learning approach. IET Gener. Trans. amp;. Dist. 17 (11), 2471–2482. doi:10.1049/gtd2.12815
Rodrigues, R. B., Mendes, V. M. F., and Catalao, J. P. S. (2010). Lightning data observed with lightning location system in Portugal. IEEE Trans. Power Deliv. 25 (2), 870–875. doi:10.1109/tpwrd.2009.2037325
Squall, L., and Feng, S. H. (2005). What you want to know about the violent squalls hitting Hong Kong on 9 May 2005. Available at: https://www.hko.gov.hk/en/education/weather/thunderstorm-and-lightning/00030-squall-lines-and-shi-hu-feng-what-you-want-to-know-about-the-violent-squalls-hitting-hong-kong-on-9-may-2005.html (Accessed August 31, 2023).
Su, S. (2023). Joint distribution of lightning and wind dataset. Available at: https://github.com/pig-of-fang/Joint-distribution-of-cloud-ground-lightning-data.
Wang, X., Yu, X., and Zhou, X. (2012). Study on the formation and evolution of “6.3” damage wind. Plateau Meteorol. 31 (2), 504–514.
Keywords: lightning, joint distribution, wind speed, transmission system, lightning location system
Citation: Xia Y, Li B, Zhou X and Su S (2024) Joint distribution of lightning and wind speed and its impact on the transmission system. Front. Energy Res. 11:1293192. doi: 10.3389/fenrg.2023.1293192
Received: 12 September 2023; Accepted: 14 December 2023;
Published: 08 January 2024.
Edited by:
Gabino Jimenez-Castillo, University of Jaén, SpainReviewed by:
Leocadio Hontoria, University of Jaén, SpainGiuseppe Marco Tina, University of Catania, Italy
Claudio Francesco Nicolosi, University of Catania, Italy, in collaboration with reviewer GT
Copyright © 2024 Xia, Li, Zhou and Su. This is an open-access article distributed under the terms of the Creative Commons Attribution License (CC BY). The use, distribution or reproduction in other forums is permitted, provided the original author(s) and the copyright owner(s) are credited and that the original publication in this journal is cited, in accordance with accepted academic practice. No use, distribution or reproduction is permitted which does not comply with these terms.
*Correspondence: Sheng Su, eessheng@163.com