Energy finance risk warning model based on GABP algorithm
 Chao Nai
- School of Finance, Jiangsu Vocational College of Finance and Economics, Huaian, Jiangsu, China
Energy finance is the product of the close combination of the energy industry and the financial industry, and the two affect each other. The energy crisis may lead to a financial crisis, and the financial crisis may also lead to a energy crisis. Early risk warning for the energy financial crisis can effectively mitigate and reduce risks. This article used the GABP (Genetic Algorithm Back Propagation) algorithm model to systematically analyze and predict the risks of energy financial crises. After establishing indicators for energy finance risk warning, this article collected relevant data from 150 energy companies and 210 financial companies, and compared them with the GABP algorithm model and manual analysis model. The error value of the model is determined by the numerical expansion in the positive and negative directions based on zero scale values. The closer the zero scale value is, the smaller the error; the farther it is from the zero scale value, the greater the error. The results show that the average accuracy of the GABP model for energy finance risk warning is 85.2%, and the minimum error value is −0.23. The average accuracy of using manual analysis models for energy finance risk warning is 75.8%, with a minimum error value of 1.89. The GABP algorithm has advantages in constructing energy finance risk warning models.
1 Introduction
The two major industries of energy finance are interrelated, and in a steadily developing economic environment, they promote each other and together bring good social and economic benefits. In a turbulent economic environment, the interconnected relationship between energy and finance can lead to a chain reaction between the two, with one party’s crisis triggering the other. The development of the social economy is in a dynamic state of change, and timely warning of the risks of energy financial crises to avoid and solve risk problems can enhance the stability and security of the energy financial economy. This can avoid a series of social and economic problems such as economic downturn, corporate bankruptcy, increased unemployment rate, and asset evaporation caused by the energy financial crisis. The GABP algorithm is formed by optimizing and adjusting the genetic algorithm (GA) on the back propagation (BP) neural network (NN). The GABP algorithm can be used to establish an energy finance risk warning model. This model can save manpower, material resources, and time on the basis of traditional risk prediction by collecting a series of energy finance indicator data. The innovation of this article lies in the study of the energy finance risk warning model constructed by the GABP algorithm, analyzing various risk indicators, and substituting them into the model for validation calculations. The experimental part compares the traditional risk warning methods that use various risk indicators for operational analysis, and judges the performance advantages of the model used for energy finance risk warning. The BP neural network method based on genetic algorithm optimization can establish a more comprehensive and adaptable energy finance risk warning model. The model assigns reasonable weights to early warning indicators, effectively divides the critical values of early warning indicators, and has high accuracy in early warning results.
The importance of energy finance issues is reflected in various aspects such as environmental structure, national economic synergy, regional competitive development, and social and financial resource allocation. Kirikkaleli, Dervis explored and confirmed the long-term causal effects of financial development and renewable energy consumption on environmental sustainability. He proposed that the role of renewable energy and financial development should be further considered to improve the environment by implementing energy reform policies in both developed and developing countries (Kirikkaleli and Tomiwa, 2021). Dai, Xingyu payed attention to China’s goal and measures to break through the petrodollar system and establish a RMB led crude oil futures market to internationalize the energy finance market. He found that Chinese oil futures may not have a good price leadership position in the global spot market, but they have favorable price synergies (Dai et al., 2022). According to Jin, Jingyu, Sichuan Province is in a leading position in the development of energy finance in China, and there are significant differences in the development of energy finance among different regions (Jin et al., 2020). Cholibois, Tim explored the role of climate finance in Madagascar’s planned transition to renewable energy. By analyzing the expected energy financing flows and the financing strategies of the main financing parties, he revealed the shift from grant based climate financing to financial instruments with clear returns. He found that the choice of financial instruments affects the provision of supplementary social services in rural electrification plans (Cholibois, 2020). The research confirms the role of energy finance from different perspectives, whether positive or lateral, and the risk warning of energy finance crises also involves exploring and considering various factors.
The use of genetic algorithms, backpropagation NN, hybrid NN, and other algorithms or models for the development and research of energy finance is an attempt direction for many scholars. Li X, Wang J and Yang C mainly proposed an optimized BP neural system as a financial early warning model, ensuring its high prediction accuracy. In his research, they described the working principle and related reasoning process of the model, analyzed its shortcomings, and proposed solutions. Through analyzing the financial risks of listed companies from 2017 to 2020, they found that the accuracy of the optimized BPNN in predicting the financial distress of normal companies in the selected companies reached over 80%, which proves the effectiveness of the optimized BPNN (Li X. et al., 2023). In this work, given different query inputs, the confidence vector or top 1 confidence returned from the attacked model varies to a relatively large extent. Therefore, the rich internal information of MUA was leaked to the attacker, providing convenience for her to reconstruct alternative models. Therefore, Zhang, Jiliang suggested using adversarial confidence perturbations to hide these different confidence distributions for given different queries, in order to combat model theft attacks (known as APMSA). In other words, the confidence vectors returned now are similar to queries from specific categories, which greatly reduces information leakage in MUA (Zhang et al., 2023). Li, Xuetao, and Yi Sun established a prediction model based on SVM model that combines kernel parameters and parameter optimization. They used grid search method, genetic algorithm and Particle swarm optimization algorithm to optimize SVM parameters under various kernel functions such as radial basis function. This algorithm and Particle swarm optimization algorithm optimize the parameters of SVM, and enhance the applicability of the model in practice (Li and Sun., 2020). Huang, Xiao, Shoujun Huang, and Ailun Shui used data from the China Health and Nutrition Survey from 1989 to 2015 to evaluate the relationship between Chinese government expenditure and intergenerational income mobility (Huang et al., 2021). Due to the complexity and high dynamics of cloud environments, anomaly detection caused by irregular fluctuations in data and model robustness is challenging. To address these issues, Song, Yujia proposed a deep learning based multivariable time series based realistic operation cloud anomaly detection method: Correlation GNN (CGNN MHSA-AR) with multi head self attention and autoregressive ensemble method (Song et al., 2023). The research of these scholars provides a source of ideas and theoretical reference for the application of GABP algorithm in the construction of energy finance risk warning models in this article.
Energy financial risks can bring about energy financial crises, seriously affecting social economic development and security and stability. This article summarizes and summarizes various indicators and influencing factors of energy finance for real-time monitoring, analyzing and predicting the possibility and probability of energy finance crises. It can take effective prevention and control measures in a timely manner before the energy financial crisis occurs, eliminate the energy financial crisis or reduce the adverse consequences of the crisis. This article studies the energy finance risk warning model constructed by the GABP algorithm. By analyzing various risk indicators and substituting them into the model for validation calculations, this article compares traditional risk warning methods that use various risk indicators for operational analysis to determine the performance advantages of energy finance risk warning models (He et al., 2021).
1.1 Energy finance risk warning
1.1.1 Energy finance relations and crisis
The energy industry and the financial industry are interdependent, mutually reinforcing, and mutually supportive. Strong energy industry support can provide tremendous support and power for the flow and accumulation of financial capital, and reverse the decline in the volatile and unstable financial market environment. While the financial market is steadily developing, it can also ensure the rationality, effectiveness, and fairness of energy resource allocation. This can be beneficial for energy based enterprises to expand production in the social economy and promote rapid social development. The huge amount of financial capital can also provide backup for the implementation of the national energy strategy, and provide energy capital reserves for the operation of the enterprise’s industrial chain and capacity improvement. It drives investment in the energy industry, innovation in enterprise technology and structure, and upgrading of the social energy industry (Lu et al., 2023). The ways in which the energy industry combines with the financial industry include energy credit business, energy futures products, energy product settlement, energy enterprise stock financing business, and so on. By combining energy and finance, the energy and financial industries can prosper and develop. On the one hand, when the Energy crisis or financial crisis occurs, they will interact and produce joint reactions. On the other hand, they can also reduce and share the harmful consequences of the energy crisis and financial crisis through reasonable and wise risk transfer (Majid, 2020).
From Figure 1, it can see the close relationship between energy finance and the possible risks of energy industry and financial industry, including business cycle risk and monetary policy risk in finance, supply and demand risk and enterprise operation risk in energy industry. In addition, the institutional reform and capital expansion of the financial industry, as well as the structural adjustment and technological innovation of the energy industry, would bring significant changes to the industry itself, leading to a greatly increased risk of energy financial crises.
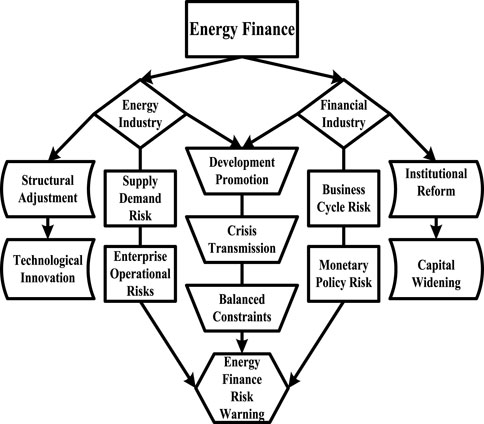
FIGURE 1. Energy finance relationship and risk map.
1.1.2 Risk warning indicator system
Due to the many related factors that affect energy finance risks, in order to better conduct energy finance risk warning, it is necessary to establish a relevant indicator system, which can use various indicator data to evaluate the status of energy finance enterprises and industries. Generally, the main indicators involved are GDP (Gross Domestic Product) growth rate, GDP deflator, exchange rate fluctuation, growth rate of money supply, financing amount of securities institutions, product price index, enterprise prosperity, non-performing loan ratio, asset liability ratio, provision coverage ratio, asset return ratio, interest protection multiple, etc. Table 1 shows the analysis of the impact of changes in various indicators on the risks of the energy finance industry (Zhang et al., 2019; Wang et al., 2023).
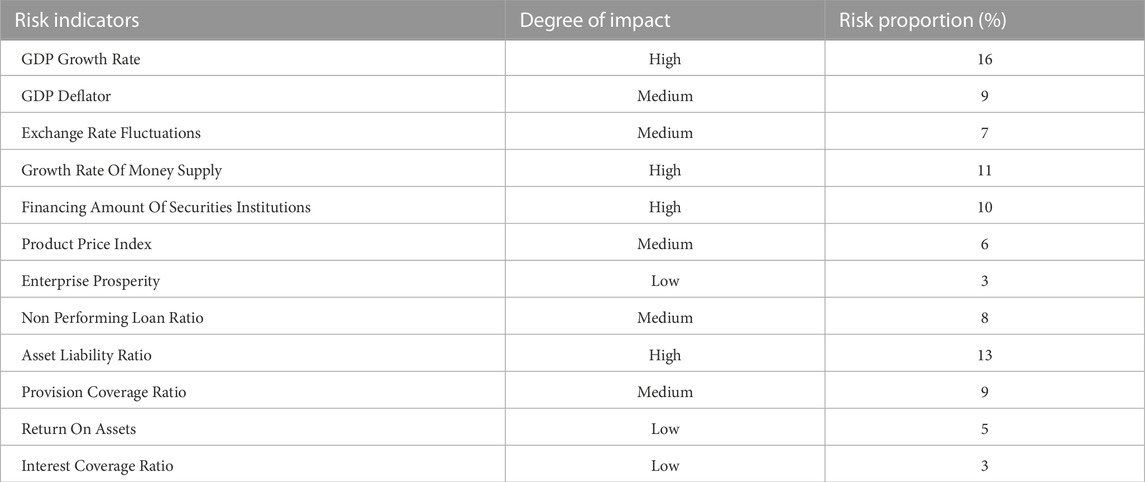
TABLE 1. Analysis of the impact of various risk indicators in energy finance.
1.1.3 Manual model
After obtaining relevant indicator data information based on the “Analysis Table of Impact Degree of Various Risk Indicators in Energy Finance”, the data is integrated and calculated based on the degree of impact of these indicators on energy finance risks. The commonly used methods for risk warning include decision tree method, financial statement analysis method, analytic hierarchy process, fuzzy comprehensive evaluation method, etc. (Ma et al., 2020). The traditional way of using manual analysis models for risk warning is to analyze financial statements and various indicator data to determine the level of risk in the event of an energy financial crisis.
2 GABP algorithm model
2.1 Genetic algorithm
As an iterative algorithm, genetic algorithm can be used for global optimization search. It is a computer optimization model that simulates the process of genetic selection and survival of the fittest. The application of genetic algorithms in quotient optimization, artificial NN, machine learning algorithms, and other aspects can play a good optimization mechanism role (Shanmugasundaram et al., 2019; Dharma, 2020).
Genetic algorithm simulates the process of survival of the fittest by dividing the computational process into three aspects: replication, crossover, and mutation. Firstly, it involves selecting and replicating strong and excellent genes, and then combining them with pairwise cross comparison to obtain a better result value through combined variation. After each iteration of genetic algorithm, there will be a set of solutions. Then this group of recipients will continue to calculate the process of survival of the fittest, step by step, to find the optimal value (Li et al., 2022).
The entire optimization process is robust, requiring genetic coding of operational elements during iteration and survival of the fittest. It is generally encoded in binary, followed by setting a randomly selected initial population for iterative optimization of the entire encoded initial population, using a fitness function.
The process of genetic algorithm for genetic selection and survival of the fittest requires continuous selection of chromosomes from the population. The rule is to use the disk selection method, which allows for cross selection after selection, inheriting excellent genes and chromosomes from parents to offspring, and optimizing them from generation to generation. The purpose of mutation after crossover operation is to compensate for the loss of some excellent gene chromosomes during the crossover process.
Figure 2 shows the genetic algorithm process.
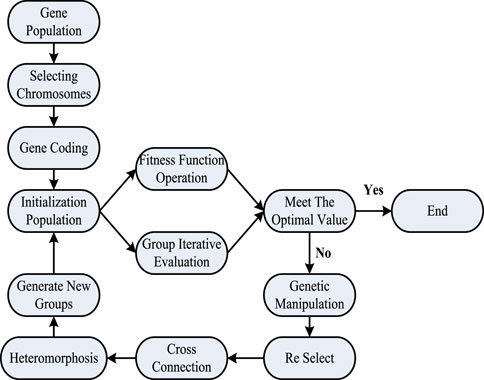
FIGURE 2. Flow chart of genetic algorithm.
Based on the characteristics and advantages of genetic algorithm, such as guiding search direction, adaptive environment, progressive optimization, parallel operation, and global optimization, this article applies it to the optimization of BP NN, which can effectively compensate for the two major shortcomings of slow convergence and local minima of BP NN (GarudSandip et al., 2021).
2.2 BP neural network model
BP NN generally has three parts: input layer, hidden layer and output layer. A hidden layer BP network can be used to approximate continuous function in any interval, while a three-layer BP network can map the specified X dimension to Y dimension (Li Xuetao et al., 2023). The BP algorithm used in BP neural network is a typical Semi-Supervised Learning algorithm. It can perform gradient search on known samples to make the final output value and expected output value of the neural network reach minimum mean square error (Yin et al., 2017). The structure and input signal operation process of the BP NN are shown in Figure 3.
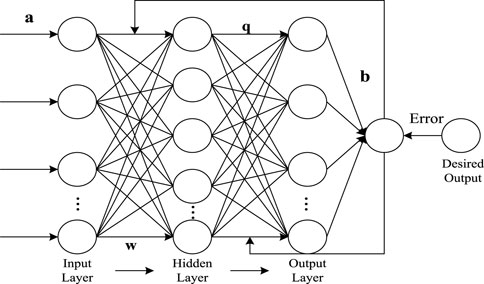
FIGURE 3. BP NN structure and operation process diagram.
In Figure 3, w is the neural connection weight value from the input layer to the hidden layer; Q is the connection weight from the hidden layer to the output layer, and
2.3 Optimization of BP neural network using genetic algorithm
Genetic algorithm can be applied to the BP NN to enhance its global search function, while optimizing the structural characteristics and neural connection weight coefficients of the NN based on genetic algorithm (Shijie, 2019; Wang et al., 2022). The GABP workflow diagram is shown in Figure 4.
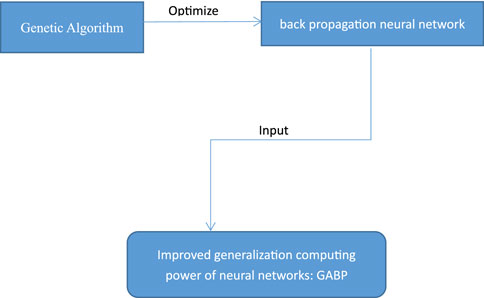
FIGURE 4. GABP workflow diagram.
After determining the samples to input into the GABP network, the number of input layer neural nodes and output layer neural nodes in the three-layer network is fixed. After optimizing the corresponding nodes using genetic algorithm, the generalization calculation ability of the NN can be improved. The characteristics of the GABP algorithm are expressed using the following formula.
In Formula (2),
After determining the number of times the model needs to be trained, the error value of the training samples is represented by
After applying the fitness function to the optimization of the model, the formula is:
In the process of genetic coding, control codes and weight coefficients need to be connected. The number of hidden nodes in the NN structure is connected into a string by control codes, with disconnected nodes represented by 0 and connected states represented by 1. The length of encoding concatenation can be determined based on a multiple of the number of nodes in the input layer NN. The length of the weight coefficient connection encoding is determined by the number of input layer nodes and output layer nodes. A genetic coding string corresponds to a set of control code network structures and connection weights.
When F represents the number of individuals in the initial population of the genetic algorithm, and these individuals are composed of random numbers with corresponding lengths of the coding string within the
In Formula (4), the individual before crossing is represented as
The
Under multiple cross mutation operations, population evolution is optimized to generate. The connection weight and number of nodes in the encoding individual with the highest fitness are used as input values for the model, ultimately obtaining the global optimal solution.
After obtaining the NN weighting coefficients and hidden nodes of the input
Through the model construction method, genetic algorithm can be successfully used to optimize and adjust the BP NN, and establish a GABP model. When applying this model to the risk analysis and warning of energy finance, it is necessary to use the relevant energy finance indicator data as a dataset and input it into the model for training and testing of data samples. The final output of the model would be used as the model itself to analyze and predict the effectiveness of energy finance risks. Due to the existence of certain errors in the operation of the model and the differences in the training and learning process of the data samples, it is necessary to consider the results of multiple iterations of the model on the data samples.
3 Comparative experiment of GABP model and manual model
The security of energy finance is related to all aspects of the economy, and the process of predicting, evaluating, and analyzing energy finance risks requires collecting and considering different energy industries and financial issues. The relationship between the energy industry and the financial industry is complementary, and when encountering an energy financial crisis, the two would also influence each other, and the crisis would be transmitted from one side to the other. The occurrence of an energy financial crisis is premonitory and can be influenced by the operational status and socio-economic forms of enterprises. This article evaluates and predicts the risk and likelihood of an energy financial crisis based on indicators collected from various aspects such as policy and technological updates and changes.
This article constructs a model for energy finance risk warning using the GABP algorithm, evaluates the performance of the model in all aspects, and compares the effectiveness of the GABP model with traditional manual analysis of energy finance risks through experiments. The energy finance indicator data used in the experiment were sourced from websites such as China Energy Network, Shanghai Stock Exchange, China Futures Association, China Banking Association, and China Coal Market Network. This article collects and analyzes indicators such as commodity product prices, profit liabilities, and financing loans from 150 energy companies and 210 financial companies. Based on the GDP growth rate, GDP deflator, monetary policy, energy regulation information and other data at the national level, this paper makes a comprehensive judgment on the degree of energy finance risks at the corporate and national levels according to the proportion of the degree of influence in the analysis table of the impact of energy finance risk indicators. There are four quantitative indicators, namely, the proportion of total green finance business, the proportion of total green finance business, the year-on-year growth rate of total green finance business, and the proportion of total risk of green finance business. There are three qualitative indicators in total, namely, the implementation of national and local green finance policies, the formulation and implementation of institutional green finance systems, and the financial support for the development of green industries, with weights of 30%, 40%, and 30%, respectively.
The sample data mainly comes from the website of the National Bureau of Statistics during 2020–2022. Partial missing data was filled in using the smoothing method, and all variables were seasonally adjusted using X12 addition. The seasonally adjusted data were standardized. This article conducts stationarity tests on standardized time series variables. This article uses the ARMA model to establish a regression model. This article tests whether the risk in the energy finance market is a stationary time series. If not, a difference is required before regression, and the future risk intensity of the energy finance market is predicted based on the regression results.
This article substitutes the risk indicator data of energy finance into the GABP model and the manual analysis model. It also compares the accuracy, stability, error value, and operation time of the model after 30 iterations of evolution. This article compares the advantages and disadvantages of two different models to determine whether the GABP algorithm model is efficient and applicable for risk warning of energy financial crises. Figure 5 shows the comparison of accuracy between the GABP model and the manual analysis model for energy finance risk warning.
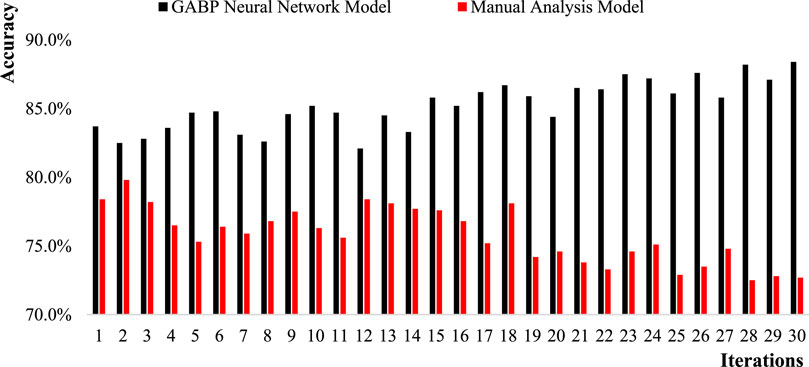
FIGURE 5. Accuracy chart of energy finance risk warning for GABP model and artificial analysis model.
From Figure 5, it can be seen that the accuracy of the GABP model for energy finance risk warning is generally higher than that of the manual analysis model. The accuracy of the GABP model shows an overall upward trend with the increase of iteration times, and reaches the highest level at 88.4% at the 30th iteration. The 12th lowest was 82.1%. The average accuracy is 85.2%. The artificial analysis model shows a decreasing trend as the number of iterations increases, with the highest accuracy rate of 79.8% in the second iteration. In the 28th iteration, the accuracy was the lowest at 72.5%. The average accuracy is 75.8%.
After analyzing the accuracy of the model, it is necessary to further understand the stability of the model. Figure 6 shows a comparison of the model stability between the GABP model and the manual analysis model.
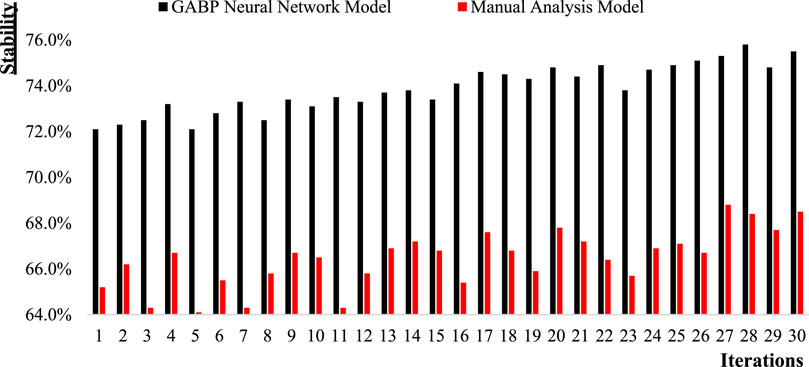
FIGURE 6. Model stability diagram of GABP model and manual analysis model.
From Figure 6, it can be seen that the stability of the GABP model is significantly higher than that of the manual analysis model, and the stability of both models shows an upward trend with the increase of iteration times. The stability of the GABP model was the highest in the 28th iteration, at 75.8%; The stability was the lowest at 72.1% in both the first and fifth iterations; The average stability of the GABP model is 73.9%. The stability of the manual analysis model was the highest in the 27th iteration, at 68.8%; The lowest stability of the model was in the 5th iteration, at 64.1%; The average stability of the manual analysis model is 66.4%.
By comparing the difference between the highest and lowest stability values of the GABP model and the manual analysis model, the relative stability of the model can be determined. The difference between the highest and lowest stability values of the GABP model is 3.7%; The difference between the highest and lowest stability values of the manual analysis model is 4.7%; From this, it can be seen that the results of the GABP model after multiple iterations are more stable compared to the manual analysis model, and the data fluctuation difference is smaller.
Model stability and data error are important parameters for evaluating model performance. Figure 7 shows the comparison of model error values between the GABP model and the manual analysis model.
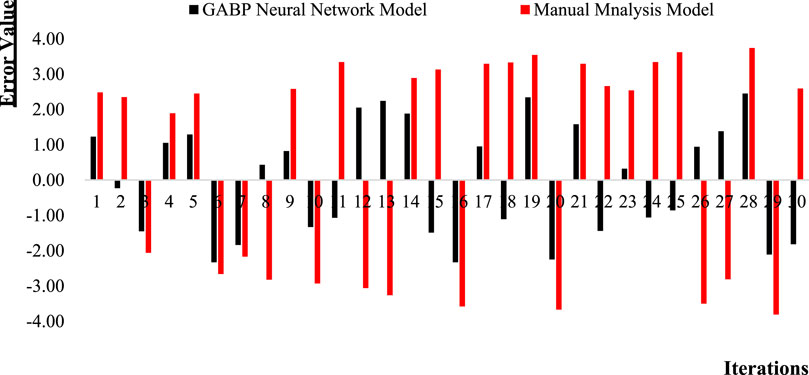
FIGURE 7. Comparison of errors between GABP model and manual analysis model.
In Figure 6, the performance of the model is inversely proportional to the error value. The larger the error, the lower the performance, while the smaller the error, the higher the performance. The error value of the model is determined by the numerical value extended in both positive and negative directions based on the zero scale value. The closer the zero scale value is, the smaller the error is, and the farther it is from the zero scale value, the greater the error is. Through intuitive comparison, it can be seen that the overall error of the GABP model is lower than that of the manual analysis model. The error of the GABP model is the smallest in the second iteration, at −0.23; The maximum error occurred at the 28th time, at 2.45. The manual analysis model had the smallest error margin of 1.89 in the fourth iteration; The maximum error value was −3.81 on the 29th attempt.
The operation time of the model is related to the efficiency of data calculation. The comparison of the operation time between the GABP model and the manual analysis model is shown in Figure 8.
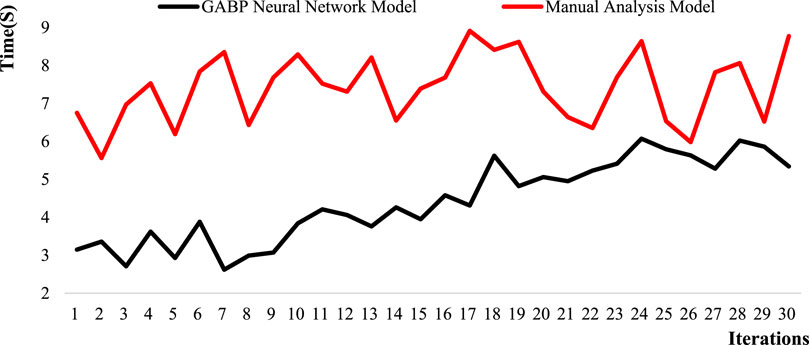
FIGURE 8. Comparison of operation time between GABP model and artificial analysis model.
In Figure 8, the operation time of the GABP model is significantly shorter compared to the manual analysis model as a whole. The operation time of the GABP model is the longest in the 24th iteration, at 6.07 s. The shortest calculation time for the 7th iteration is 2.62 s. The average operation time is 4.41 s. The calculation time of the manual analysis model is the longest at the 17th time, which is 8.91 s. The shortest computation time is in the second iteration, which is 5.56 s, with an average computation time of 7.42 s.
In order to verify the effectiveness of the method proposed in this article, based on the test samples, the accuracy and error rates of the accounting resource sharing management risk assessment of the evaluation model, the Logistic based manufacturing enterprise financial risk warning evaluation model, and the FAHP based small and medium-sized enterprise financial risk assessment model can be compared. In order to verify the actual effectiveness of the improved algorithm, this article uses Matlab7.0 software to train and test the financial risk warning model. The comparison results are shown in Table 2.
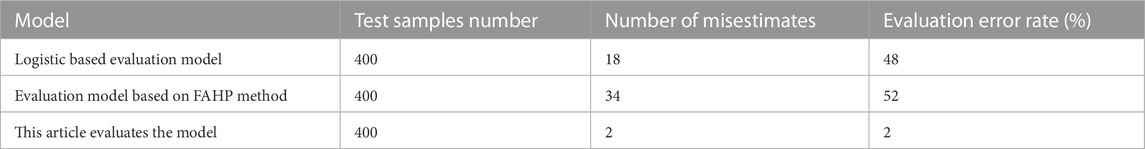
TABLE 2. Evaluation results of three models.
In order to further validate the effectiveness of the method proposed in this article (marked as model C), a comparative analysis was conducted on the accuracy of accounting resource sharing management risk assessment among the evaluation model, the Logistic based manufacturing enterprise financial risk warning evaluation model (marked as model A), and the FAHP based small and medium-sized enterprise financial risk assessment model (marked as model B). The result is shown in Figure 9.
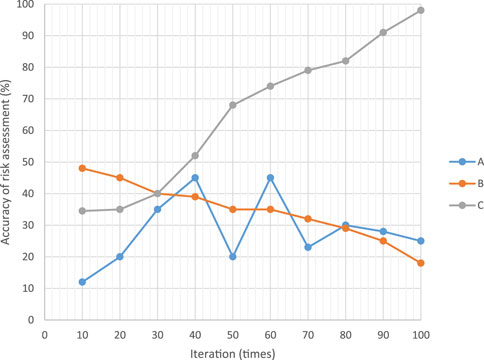
FIGURE 9. Comparison results of risk assessment accuracy among three models.
The accuracy of the accounting resource sharing management risk assessment of the evaluation model in this article gradually increases with the increase of iteration times, reaching a maximum of 98%. However, the accuracy of the accounting resource sharing management risk assessment based on the Logistic manufacturing enterprise financial risk warning evaluation model is relatively unstable, with a maximum of only 45%. The accuracy of accounting resource sharing management risk assessment based on the FAHP method for small and medium-sized enterprise financial risk assessment model shows a decreasing trend with the increase of iteration times, which is the lowest among the three models.
4 Results and discussions
This article compares the accuracy of three models for risk assessment: the GABP method proposed in this article, the logistics based financial risk early warning assessment model for manufacturing enterprises, and the FAHP based financial risk assessment model for small and medium-sized enterprises. The results showed that the accuracy of accounting resource sharing management risk assessment in the evaluation model in this article gradually improved with the increase of iteration times, reaching a maximum of 98%. This also proves the feasibility of the model proposed in this article, and the GABP algorithm has advantages in constructing energy finance risk warning models.
This article aims to establish an energy finance risk warning model using the GABP algorithm, which can save manpower, material resources, and time on the basis of traditional risk prediction by collecting a series of energy finance indicator data. This article aims to quickly and accurately analyze and judge energy financial risks, and predict the probability of energy financial crises occurring. Studying the GABP algorithm model for energy finance risk warning can help analyze and summarize the various factors that are interconnected between the energy and financial industries, innovate and optimize the models and methods of energy finance risk warning.
5 Conclusion
Energy finance is related to market economy, resource development and utilization, and social order stability. Encountering an energy finance crisis can affect various industries, causing inflation, deflation, a large number of enterprise closures, social unrest, and other problems. Timely risk warning for energy finance crises can effectively prevent crises from occurring, but it is necessary to use relevant information and collect relevant data indicators for estimation and analysis. Different analytical and operational models have different characteristics, and the effectiveness of energy finance risk warning models needs to be determined through data comparison after specific applications. This article establishes an energy finance risk warning model based on the GABP algorithm. Compared with the manual analysis model, the operation time of the GABP model is significantly shorter overall. The operation time of the GABP model is the longest in the 24th iteration, at 6.07 s. The Mean operation time is 4.41 s. There is still room for further exploration in the application of the GABP model in energy finance risk warning in the article. Also, due to the differences between the simulation environment of MATLAB and the actual situation, there are also some deviations in the experimental data of the model. In order to obtain more accurate experimental conclusions, further optimization research is needed to construct the model.
Data availability statement
The original contributions presented in the study are included in the article/Supplementary Material, further inquiries can be directed to the corresponding author.
Author contributions
The entire work of this article was completed by CN.
Conflict of interest
The author declares that the research was conducted in the absence of any commercial or financial relationships that could be construed as a potential conflict of interest.
Publisher’s note
All claims expressed in this article are solely those of the authors and do not necessarily represent those of their affiliated organizations, or those of the publisher, the editors and the reviewers. Any product that may be evaluated in this article, or claim that may be made by its manufacturer, is not guaranteed or endorsed by the publisher.
References
Cholibois, Tim. (2020). Electrifying the ’eighth continent’: Exploring the role of climate finance and its impact on energy justice and equality in Madagascar’s planned energy transition. Clim. Change 161 (2), 345–364. doi:10.1007/s10584-019-02644-x
Dai, Xingyu., Xiao, L., Li, M. C., and Wang, Q. (2022). Toward energy finance market transition: Does China’s oil futures shake up global spots market?Front. Eng. Manag. 9 (3), 409–424. doi:10.1007/s42524-022-0207-3
Dharma, Faisal. (2020). Prediction of Indonesian inflation rate using regression model based on genetic algorithms. J. Online Inform. 5 (1), 45–52. doi:10.15575/join.v5i1.532
GarudSandip, Kunal, Simon, Jayaraj, and Lee, Moo-Yeon (2021). A review on modeling of solar photovoltaic systems using artificial neural networks, fuzzy logic, genetic algorithm and hybrid models. Int. J. Energy Res. 45 (1), 6–35. doi:10.1002/er.5608
He, Qizhi, Xia, Pingfan, Li, Bo, and Liu, Jia-Bao (2021). Evaluating investors’ recognition abilities for risk and profit in online loan markets using nonlinear models and financial big data. J. Funct. Spaces 2021, 1–15. doi:10.1155/2021/5178970
Huang, Xiao, Huang, Shoujun, and Shui, Ailun (2021). Government spending and intergenerational income mobility: Evidence from China. J. Econ. Behav. Organ. 191, 387–414. doi:10.1016/j.jebo.2021.09.005
Jin, Jingyu., Zhang, N., Li, F., Chuan, M., and Yang, Y. (2020). Energy finance development research of maritime silk road. J. Coast. Res. 107 (SI), 443–448. doi:10.2112/jcr-si107-098.1
Kirikkaleli, Dervis, and Tomiwa, S. A. (2021). Do renewable energy consumption and financial development matter for environmental sustainability? New global evidence. Sustain. Dev. 29 (4), 583–594. doi:10.1002/sd.2159
Li, Mengci., Gao, Z., Qiu, B., Zhang, J., Mu, Y., Xiang, G., et al. (2021). Photometric redshifts estimation for galaxies by using FOABP-RF. Mon. Notices R. Astronomical Soc. 506 (4), 5923–5934. doi:10.1093/mnras/stab2040
Li, X., Wang, J., and Yang, C. (2023a). Risk prediction in financial management of listed companies based on optimized BP neural network under digital economy. Neural Comput. Appl. 35 (3), 2045–2058. doi:10.1007/s00521-022-07377-0
Li, X. T., Wang, J., and Yang, C. Y. (2022). Risk prediction in financial management of listed companies based on optimized BP neural network under digital economy. J. Manuf. Process. 35, 2045–2058. doi:10.1007/s00521-022-07377-0
Li, Xuetao, and Sun., Yi (2020). Stock intelligent investment strategy based on support vector machine parameter optimization algorithm. Neural Comput. Appl. 32, 1765–1775. doi:10.1007/s00521-019-04566-2
Li, Xuetao, Wang, Jia, and Yang, Chengying (2023b). Risk prediction in financial management of listed companies based on optimized BP neural network under digital economy. Neural Comput. Appl. 35 (3), 2045–2058. doi:10.1007/s00521-022-07377-0
Lu, Lu., Liu, Z., Mohsin, M., and Zhang, C. (2023). Renewable energy, industrial upgradation, and import-export quality: Green finance and CO2 emission reduction nexus. Environ. Sci. Pollut. Res. 30 (5), 13327–13341. doi:10.1007/s11356-022-22629-1
Ma, Liyi., Wang, Y., Ren, C., and Li, H. (2020). Early warning for internet finance industry risk: An empirical investigation of the P2P companies in the coastal regions of China. J. Coast. Res. 106 (SI), 295–299. doi:10.2112/si106-069.1
Majid, M. A. (2020). Renewable energy for sustainable development in India: Current status, future prospects, challenges, employment, and investment opportunities. Energy, Sustain. Soc. 10 (1), 1–36. doi:10.1186/s13705-019-0232-1
Shanmugasundaram, N., Sushita, K., Kumar, S. P., and Ganesh, E. (2019). Genetic algorithm-based road network design for optimising the vehicle travel distance. Int. J. Veh. Inf. Commun. Syst. 4 (4), 344–354. doi:10.1504/ijvics.2019.103931
Shijie, T. A. N. G. (2019). Catalyst volume design in SCR denitrification system based on Genetic Algorithm optimized BP neural network. Power Gener. Technol. 40 (3), 246–252. doi:10.12096/j.2096-4528.pgt.19102
Song, Yujia., Xin, R., Chen, P., Zhang, R., Chen, J., and Zhao, Z. (2023). Identifying performance anomalies in fluctuating cloud environments: A robust correlative-GNN-based explainable approach. Future Gener. Comput. Syst. 145, 77–86. doi:10.1016/j.future.2023.03.020
Wang, Z., Ahmadi, A., Tian, H., Jafari, S., and Chen, G. (2023). Lower-dimensional simple chaotic systems with spectacular features. Chaos, Solit. Fractals 169, 113299. doi:10.1016/j.chaos.2023.113299
Wang, Zeng, Liu, Weidong, and Yang, Minglang (2022). Data-driven multi-objective affective product design integrating three-dimensional form and color. Neural Comput. Appl. 34 (18), 15835–15861. doi:10.1007/s00521-022-07232-2
Yin, L., Li, X., Gao, L., Lu, C., and Zhang, Z. (2017). A novel mathematical model and multi-objective method for the low-carbon flexible job shop scheduling problem. Sustain. Comput. Inf. Syst. 13 (3), 15–30. doi:10.1016/j.suscom.2016.11.002
Zhang, Jiliang., Peng, S., Gao, Y., Zhang, Z., and Hong, Q. (2023). Apmsa: Adversarial perturbation against model stealing attacks. IEEE Trans. Inf. Forensics Secur. 18, 1667–1679. doi:10.1109/TIFS.2023.3246766
Keywords: energy finance, risk warning, genetic algorithm, back propagation neural network, GaBP algorithm
Citation: Nai C (2023) Energy finance risk warning model based on GABP algorithm. Front. Energy Res. 11:1235412. doi: 10.3389/fenrg.2023.1235412
Received: 06 June 2023; Accepted: 13 July 2023;
Published: 28 July 2023.
Edited by:
Mohit Bajaj, Graphic Era University, IndiaReviewed by:
Hafiz Mudassir Munir, Sukkur IBA University, PakistanPradeep Vishnuram, SRM Institute of Science and Technology, India
Copyright © 2023 Nai. This is an open-access article distributed under the terms of the Creative Commons Attribution License (CC BY). The use, distribution or reproduction in other forums is permitted, provided the original author(s) and the copyright owner(s) are credited and that the original publication in this journal is cited, in accordance with accepted academic practice. No use, distribution or reproduction is permitted which does not comply with these terms.
*Correspondence: Chao Nai, 19870246@jscj.edu.cn