A pore-scale study on the dynamics of spontaneous imbibition for heterogeneous sandstone gas reservoirs
 Mingchuan Wang
 Ran Wang1
  Shuai Yuan
- 1Petroleum Exploration and Production Research Institute, SINOPEC, Beijing, China
- 2State Key Laboratory of Petroleum Resources and Prospecting, China University of Petroleum-Beijing, Beijing, China
The underlying mechanism for spontaneous imbibition in a water–gas system plays a significant role in hydraulic fracturing in sandstone gas reservoirs. The objective of this study is to characterize the heterogeneity of low-permeability sandstones and investigate their effect on spontaneous imbibition from the perspective of the pore scale. We selected different cores with various pore structures and heterogeneity to evaluate their impact on the dynamics of spontaneous imbibition. The heterogeneities of the cores are contributed from the clay mineral distribution and are characterized through CT scans. The results show that clay minerals have higher CT numbers than the core matrix and that micropores are predominantly distributed in clay particles rather than in the core matrix. Additionally, the water imbibition rate of micropores is larger than that of the macropores, and when the porosities are similar, the water imbibition rate is increased with decreasing permeability. Moreover, the results of 1D frequency scans show that the distribution of water at different locations in the core is governed by the distribution of clay particles. These findings can help us further understand the distribution of fracturing fluids in the heterogeneous low-permeability sandstone reservoirs.
1 Introduction
Hydraulic fracturing is the most essential technology for the development of low-permeability sandstone gas reservoirs. Complex artificial fracture networks are generated by injecting large amounts of fracturing fluid into the formation at extremely high pressures. The fracturing fluid is spontaneously imbibed into the matrix pores during fracture propagation. However, the flow back efficiencies of low-permeability sandstone gas reservoirs are generally lower than 50% (Alkouh and Wattenbarger, 2013). The flow back fluid mainly contributes to the fracture rather than the matrix pores. This results from the fracturing fluid imbibition which are promoted by the high capillary pressure in matrix pores, and the capillary pressure can also prevent the outflow of fracturing fluids from matrix pores. In addition, the residual fracturing fluid can lead to severe formation damage by reducing the relative gas permeability and forming aqueous phase trapping. Therefore, it is important to clarify the water distribution and spontaneous imbibition mechanism in low-permeability sandstone gas reservoirs. Numerous studies have been performed to investigate the spontaneous imbibition in the gas–water system from different perspectives, including the boundary conditions (Yang et al., 2016), permeability differences (Meng et al., 2015), initial water saturations (Li and Horne, 2001), and water block damages (Zhou et al., 2016; Zhang et al., 2019). Additionally, computed tomography (CT) scans, nuclear magnetic resonance (NMR) scans, and microfluidic models are selected as new methods to monitor the spontaneous imbibition (Bao et al., 2017; Liang et al., 2017; Liu et al., 2017; Shen et al., 2017; Liang et al., 2018; Yuan S. et al., 2019; Liang et al., 2020). Through these microstructure characterization techniques, the water distribution in different pores can be quantified and analyzed, and thus, it can clarify the effects of different factors on spontaneous imbibition. The water distribution and flow morphology during spontaneous imbibition in cores have been depicted based on CT scans and NMR scans (Standnes, 2003; Mirzaei et al., 2016; Akbarabadi et al., 2017). Li and Horne (2001) characterized the process of spontaneous water imbibition into gas-saturated rocks, and they demonstrated a linear relationship between the imbibition rate and the gas recovery by water imbibition. They also found that the imbibition rate and the ultimate gas recovery are decreased with the initial water saturation. Dutta et al. (2014) investigated the spontaneous imbibition in the low-permeability Berea sandstones by using CT scans. They show that the water saturation distribution along the length of the rock sample is changed with imbibition time, and they indicate that the heterogeneity of these samples plays an important role in the spreading and final saturation of the imbibition front. There is a linear relationship between the imbibed volume and the square root of imbibition time, but during the later period of imbibition, the imbibed water volume is not proportional to the square root of imbibition time (Washburn, 1921; Handy, 1960; Li and Horne, 2001).
The previous studies mostly focused on the spontaneous imbibition in homogenous core samples. There are a few studies to comprehensively consider the difference in the pore structure caused by heterogeneity of cores and its effects on the spontaneous imbibition. Also, the water distribution in heterogeneous cores and the effects of clay mineral distribution on the heterogeneity of spontaneous imbibition are still not clear.
In this study, three core samples with different clay mineral distribution patterns are selected to investigate the spontaneous imbibition in the heterogeneous sandstones. The clay mineral distribution and heterogeneity of core samples are characterized through CT scans. NMR scans are used to monitor the changes of water distribution in different pores. The relationship between the clay mineral distribution and water saturation is established based on the results of CT scans and NMR scans. This study has a great significance in further understanding the water distribution in the formation matrix and the mechanism of spontaneous imbibition in tight gas reservoirs.
2 Methodology
2.1 Experimental materials
Three core samples were obtained from the same well in a low-permeable sandstone gas reservoir in the Ordos Basin of the Changqing Field in China. These core samples were carefully drilled from the different depths. The basic properties of the core samples were analyzed using the Chinese petroleum industry standard (Table 1). All core samples were completely cleaned using the Soxhlet extraction device with petroleum ether and methanol. The mineral compositions of core samples are listed in Table 2. The core samples mainly consist of quartz and feldspar, and the main clay minerals are illite, kaolinite, and chlorite. According to the different distribution patterns of the clay mineral, the three core samples are distinguished and called the mixed-layer sandstone (MLS), matrix sandstone (MS), and clay-particle sandstone (CPS). The pictures of the core samples from different views are shown in Figure 1. To avoid permeability damage from clay swelling, 2 wt% KCl was selected as the aqueous phase to perform the spontaneous imbibition experiments in this study. Before conducting experiments, all core samples were dried at the temperature of 105°C until their weights were constant. The contact angles of core samples were measured using the sessile drop method. Also, the contact angles range from 10° to 20°, which indicates that the core samples are all strongly water-wet.
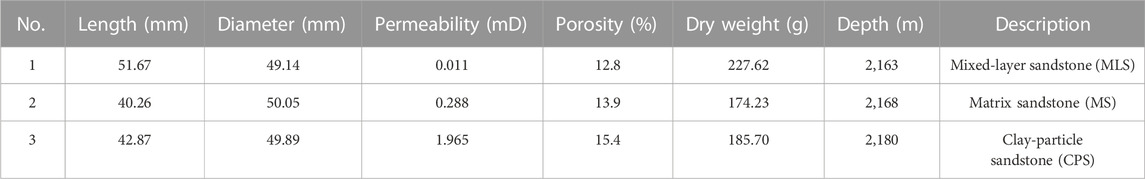
TABLE 1. Properties of the core samples.
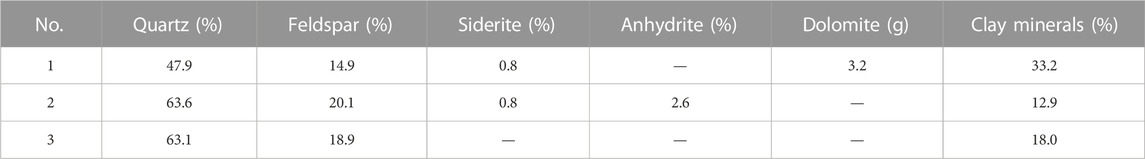
TABLE 2. Mineral compositions of the core samples.
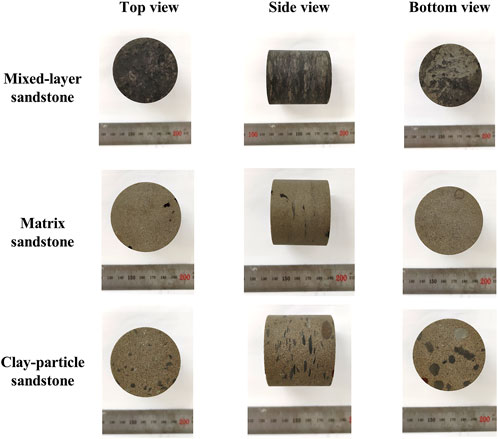
FIGURE 1. The pictures of core samples.
2.2 CT scans
A CT scan is an effective method to investigate the mineral distributions and internal structures of the core samples. Due to the density difference, the CT number is different for different minerals. Therefore, a GE Brivo 385 CT scanner is used to characterize the heterogeneity due to clay mineral distribution. Helical scans are set on 120 kV and 140 mA with a rotation time of 1 s and a slice thickness of 0.625 mm. Then, these data were analyzed using Avizo 2019 software. The data processing procedures mainly include the following steps: 1) Data of CT scans are loaded through Avizo software; 2) the interactive threshold module is selected to separate the clay minerals and core matrix with appropriate threshold value; 3) the label analysis module is selected to analyze the properties of clay minerals, including space coordinates, areas, and volumes; 4) the volume-rendering module is used to display the clay mineral distribution in the 3D view.
2.3 NMR scans
NMR relaxation is a rapid and non-destructive tool to study the water distribution in the porous medium. The water-molecule relaxation time (
where
where
where
2.4 Spontaneous imbibition experiments
The spontaneous imbibition experiments are performed through the following steps: 1) After drying them to a constant weight, the core samples are weighted to obtain their dry weight. 2) The core samples are immersed in brine as shown in Figure 2. The boundary condition is considered an all-face open (AFO) condition. 3) The core samples are taken out from brine at a certain time interval and the NMR scans are conducted, including T2 scans and 1D frequency scans. In addition, the current weights of core samples are recorded. The spontaneous imbibition experiments are completed until the peak areas of T2 spectra and the weights of the core samples have changed by less than 1%. To obtain the T2 spectra of the core samples saturated with brine, the core samples are dried and vacuum saturated with brine under a pressure of 10 MPa for 48 h after the spontaneous imbibition experiments are completed. Then, the same scanning sequence and procedures are performed again.
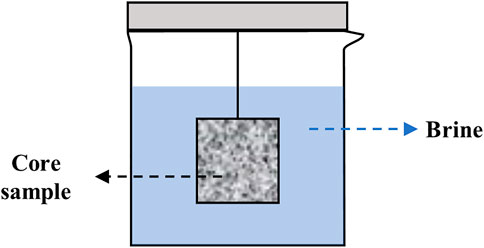
FIGURE 2. The diagram of spontaneous imbibition experiments.
3 Results and discussion
3.1 Heterogeneity characterization
The CT scanning images along the core samples are shown in Figure 3. The slice interval of CT scans for MLS, MS, and CPS are 6.459 mm, 5.033 mm, and 5.359 mm, respectively. There are notable differences among different the core samples. For the mixed-layer sandstone, there is a large area of high CT number in each scanning slice, which corresponds with the area of high clay-mineral content. The clay minerals are associated with other minerals such as quartz, feldspar, and dolomite, and this leads to high CT numbers in these areas. Additionally, the mixed-layer regions have CT numbers ranging from 2,300 to 2,600. This indicates that the distribution of clay minerals in MLS is not uniform, and this may have effects on the heterogeneity of spontaneous imbibition in different positions of this core. For the matrix sandstone, there are a few areas of high CT number. The small red areas in some slices are probably some clay particles formed by the aggregation of clay minerals. This is consistent with the lower clay mineral content of the matrix sandstone. The result of CT scanning shows that the matrix sandstone is more homogeneous along the length of the core than the mixed-layer sandstone. The CT number of MS ranges from 1,800 to 2,300. For the clay-particle sandstone, which has more evident differences between clay particles and matrix in each scanning slice, it is notable that the clay particles in these core samples are separated from the core matrix. Also, the CT numbers of clay particles and core matrix range from 2,300 to 2,600 and 1,800 to 2,300, respectively, which is consistent with the ranges of the CT numbers in MLS and MS. Additionally, the heterogeneity of CPS is more severe than MLS and MS. Finally, the sequence of core heterogeneity is CPS > MLS > MS. The different distribution patterns of the clay minerals may affect the pore structures of the core samples and thus the spontaneous imbibition performances along the length of the core samples.
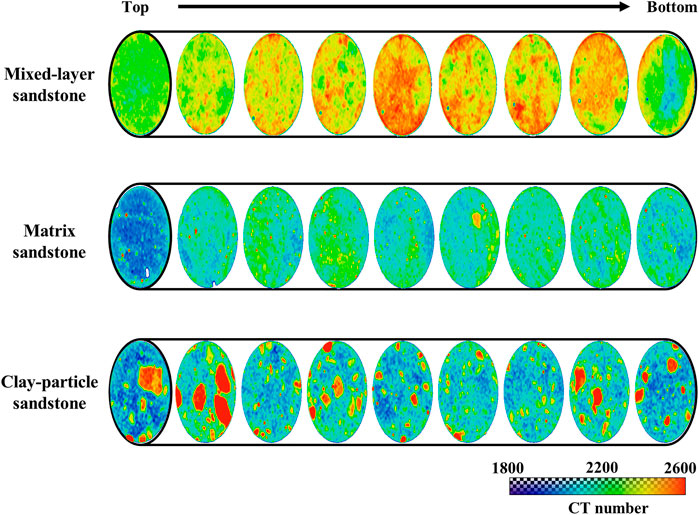
FIGURE 3. CT scanning slices in different positions for different cores.
3.2 Pore structure analysis
To correlate the water volume and peak area of the T2 spectrum, the weight differences and peak area differences in the spontaneous imbibition experiments are used to generate a standard curve. As shown in Figure 4, the water volumes in the core samples and the peak areas of the T2 spectra have a good linear relationship. This demonstrates that the water distribution in different pores can be reflected through the T2 spectra and the water volumes can be calculated through the fitting equation. Figure 5 shows the T2 spectra of the core samples saturated with brine, and they can also represent the pore structure of the core samples due to the correlation between T2 and the pore radius. It is found that the T2 spectrum of MLS mainly has one peak of 1.0 ms, and the T2 spectra of MS and CPS both have two peaks. The first peaks of these two samples are the same as that in MLS. The second peaks of MS and CPS are 18.74 ms and 32.75 ms, respectively. Therefore, the pores of the core samples can be divided into two types using the T2 spectra: micropores (1–10 ms) and macropores (10–1,000 ms). Additionally, this indicated that the pore structure of MLS mainly consists of micropores, and the MLS and CPS have both micropores and macropores. The pore volumes and proportions of micropores and macropores for the core samples are listed in Table 3. The proportion of macropores in CPS is larger than that of MS. In addition, CPS also has more macropores than MS. The results of the T2 spectra for different core samples are correlated with the core permeabilities. Also, the permeability of the core sample is increased with the proportion of macropores.
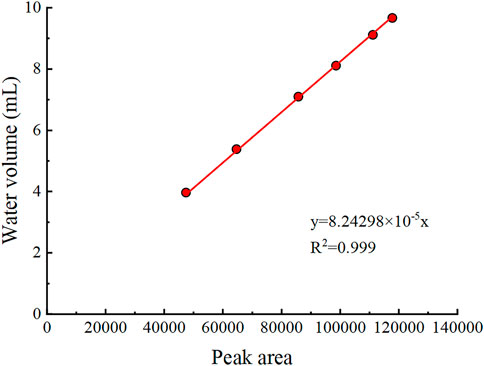
FIGURE 4. Standard curve between peak area and water volume.
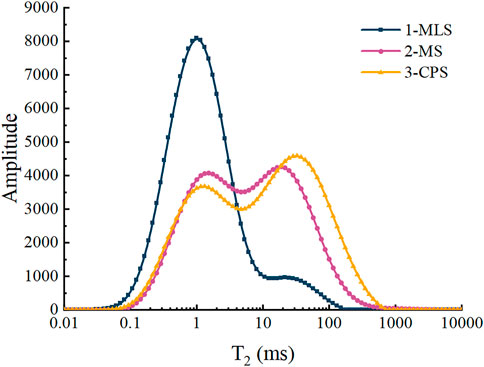
FIGURE 5. T2 spectrums for water-saturated cores.

TABLE 3. Pore volumes and proportions for different core samples.
3.3 Spontaneous imbibition experiments
The water saturation curves of the core samples are obtained using the weight differences at different times. In Figure 6, the water saturations of the core samples are rapidly increased in the early period and gradually reach plateaus. It is found that MLS has the highest water saturation of 81.8%, and the final water saturations of MS and CPS are 63.1% and 55.2%, respectively. Additionally, the sequence of time to reach imbibition equilibrium is CPS (222 h) > MS (96 h) > MLS (32 h). This indicates that higher clay mineral content of the core sample can make water imbibition faster. However, the results show that the final water saturations of the core samples decrease with core permeability. To further investigate the imbibition characteristics in different pores of the core samples, the changes of the T2 spectra for different cores are shown in Figure 7. It is found that the amplitudes of micropores in MLS gradually increase with time and reach equilibrium at around 24 h, as shown in Figure 7A. After that, the difference in the T2 spectra mainly results from the macropores. In Figure 7B, it is evident that the water mostly is imbibed into micropores rather than macropores, and the amplitudes of micropores increase more rapidly than those of macropores. The same tendency of amplitude changes is found in the case of CPS (Figure 7C). The amplitude of micropores in MS is larger than that of CPS, but the amplitude of macropores in MS is smaller than that of CPS. This probably results from the different pore structures of the two cores. CPS has a larger proportion of macropores but a smaller proportion of micropores than MS, which indicates the pore structures of core samples can dominate the spontaneous imbibition in different pores. Furthermore, there is a similar trend for these core samples that indicates that the imbibition rate of micropores is larger than that of macropores. For the homogenous cores, a larger pore size means a higher permeability and thus a higher imbibition rate (Washburn, 1921; Meng et al., 2017; Abd et al., 2019). However, there is crossflow between micropores and macropores due to the capillary pressure difference. Also, this can lead to the driven forces in micropores being larger than macropores, and thus, the imbibition fronts in micropores move faster than macropores (Dong et al., 2006; Li et al., 2019). A similar phenomenon is also observed in coals (Yuan X. et al., 2019) and low-permeability sandstones (Chen et al., 2018).
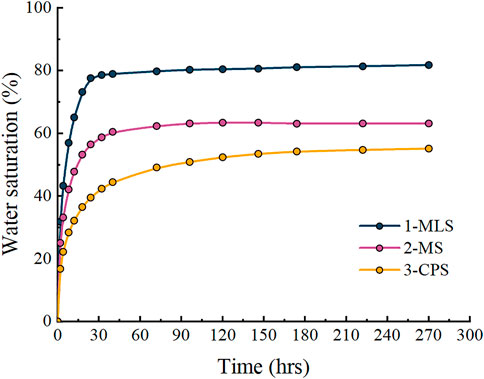
FIGURE 6. Water saturation curves for different cores changed with time.
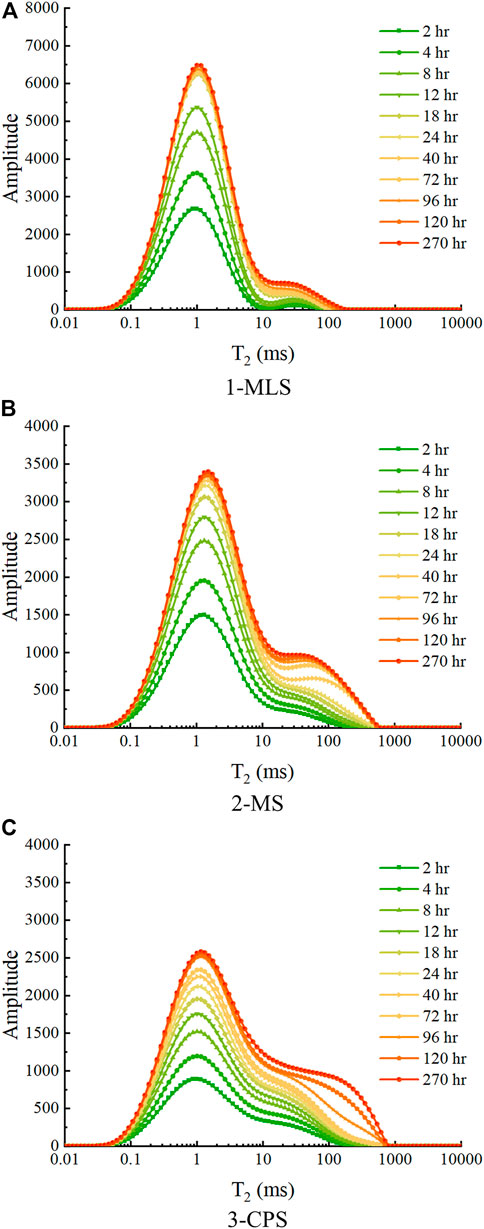
FIGURE 7. T2 spectrums of different cores changed with time: (A) MLS sample; (B) MS sample; (C) CPS sample.
3.4 Water distributions in different pores
To investigate the water saturation of different core samples, the comparisons of the T2 spectra when the cores are saturated with brine and reach imbibition equilibrium are shown in Figure 8. It is found that water saturation of micropores is much higher than that of macropores. The water saturation and water volumes in different pores are summarized in Figure 9. The sequence of water volumes in micropores is MLS > MS > CPS, which is consistent with the trend of clay mineral contents and micropore proportions. The sequence of water volume in macropores is CPS > MS > MLS, which is consistent with the trend of macropore proportions. This demonstrates that the differences in spontaneous imbibition mainly resulted from the differences of the pore structure. However, the water saturations in micropores and macropores have the same sequence: MLS > MS > CPS. The water saturation of micropores is increased with the increase in the micropore proportion. This indicates that the water volume of macropores for CPS is larger than that of MS, but the water saturation of macropores is still smaller than that of MS. This also demonstrates that the spontaneous imbibition is dominated by the micropores and the water saturation of different pores is increased with the micropore proportions.
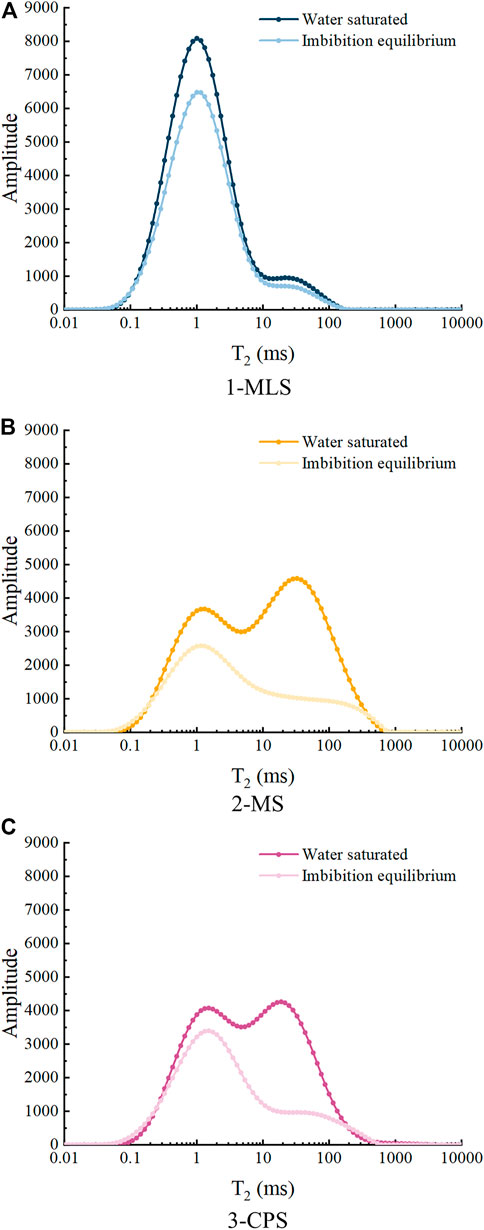
FIGURE 8. T2 spectrums in different conditions for different cores: (A) MLS sample; (B) MS sample; (C) CPS sample.
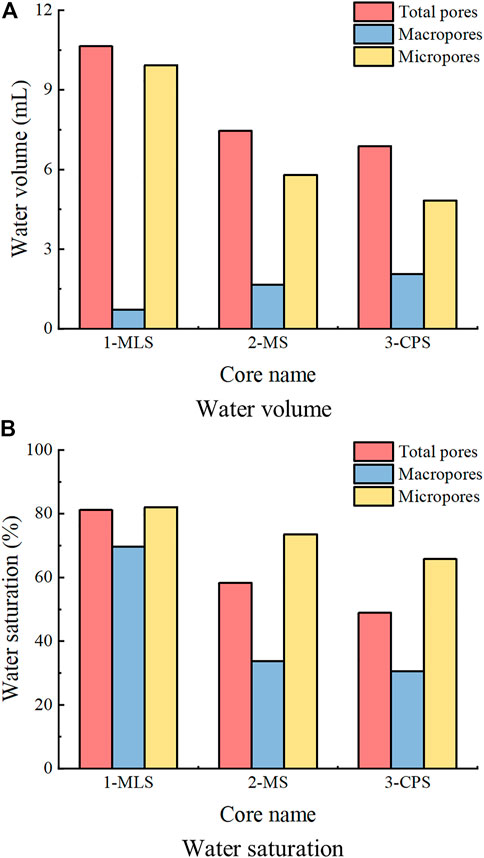
FIGURE 9. Water distribution in different pores for different cores: (A) water volume; (B) water saturation.
3.5 Effects of heterogeneity on spontaneous imbibition
To further understand the effects of the clay mineral distribution during spontaneous imbibition, the results of 1D frequency scanning are shown in Figure 10. For the mixed-layer sandstone, the amplitudes in different positions vary with the mixed-layer area, and the positions of high amplitude correspond with the positions that have high mixed-layer areas. For the matrix sandstone, the amplitudes of the water-saturated condition are more uniform than those in the mixed-layer sandstone. Also, the amplitudes of the imbibition equilibrium condition are much more uniform than those of MS. For the clay-particle sandstone, the amplitudes of different positions are mainly controlled by the positions of the clay particles. The clay particle positions are shown in Figure 11 from different perspectives. The colors of clay particles are generated from the label analysis module, and the different colors are used to distinguish the clay particles in different positions. It is evident that the clay particles are not uniformly distributed along the length of the core sample. Due to the significant difference between the clay particles and core matrix in CPS, the relationship between water saturations and clay particle volumes in the different positions are illustrated in Figure 12. There is the same tendency for water saturations and clay particle volumes changing with the positions. A high clay particle volume can lead to high water saturation, which demonstrated that the heterogeneity of the core samples can affect the water distribution. Also, water is mainly distributed in the clay minerals. These results have a good correlation with the changes of the T2 spectra.
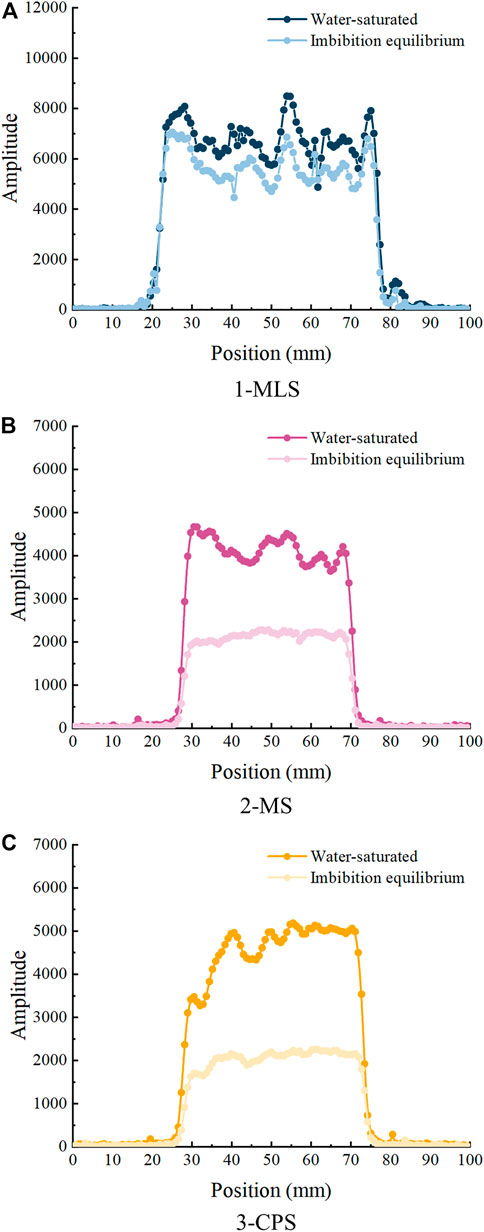
FIGURE 10. The results of 1D frequency scanning for different core samples: (A) MLS sample; (B) MS sample; (C) CPS sample.
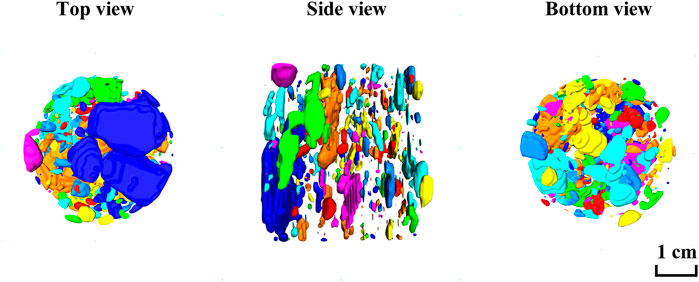
FIGURE 11. The clay particle distribution of CPS in 3D view.
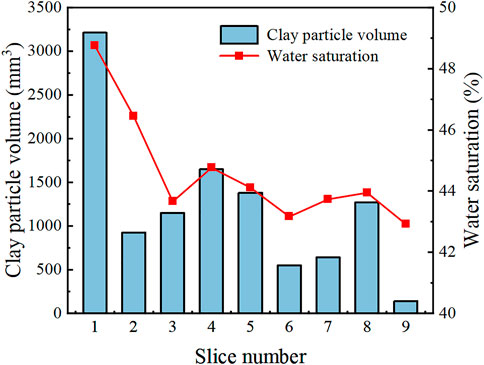
FIGURE 12. The water saturations and clay particle volumes at different position of CPS.
4 Conclusion
In this study, three kinds of heterogeneous sandstone cores are used to characterize the heterogeneity through CT scans and investigate the effects of the clay mineral distribution on spontaneous imbibition. The water distribution at different pores and positions of core samples are characterized and quantified through T2 scans and 1D frequency scans. The conclusion can be drawn as follows:
(1) The CT number of the clay minerals is higher than the core matrix; therefore, the clay mineral distribution can be characterized through CT scans. The sequence of heterogeneity of the core sample is CPS > MLS > MS. The different pore structures of core samples are related to the clay mineral distribution patterns, and the micropore proportion is increased with clay mineral content.
(2) The water saturation of the core samples is increased with the clay mineral content. The sequence of water saturation is MLS > MS > CPS. Water is mainly imbibed in the micropores, and this leads to a higher imbibition rate of micropores than that of macropores. The water saturations of different pores are increased with the corresponding pore proportions. This mainly results from the crossflow between micropores and macropores due to the capillary difference.
(3) The clay mineral distribution along the length of the core samples affects the water distribution. For CPS, the water saturation is correlated with the clay particle volume in different positions. This is because the micropores are mainly contributed by clay minerals. Also, this indicates that the water distribution is dominated by the clay mineral distribution in the heterogeneous sandstone.
Data availability statement
The original contributions presented in the study are included in the article/Supplementary Material; further inquiries can be directed to the corresponding authors.
Author contributions
MW: Experiments, Investigation, Writing original draft, Supervison. RW: Methodology, Writing reviewing & editing. SY: Experiments, Writing reviewing & editing. FZ: Methodology, Writing reviewing & editing.
Funding
This work is financially supported by Sinopec Fundamental Prospective Research Project (Grant number: P22205).
Conflict of interest
MW and RW were employed by SINOPEC.
The remaining authors declare that the research was conducted in the absence of any commercial or financial relationships that could be construed as a potential conflict of interest.
Publisher’s note
All claims expressed in this article are solely those of the authors and do not necessarily represent those of their affiliated organizations, or those of the publisher, the editors, and the reviewers. Any product that may be evaluated in this article, or claim that may be made by its manufacturer, is not guaranteed or endorsed by the publisher.
References
Abd, A. S., Elhafyan, E., Siddiqui, A. R., Alnoush, W., Blunt, M. J., and Alyafei, N. (2019). A review of the phenomenon of counter-current spontaneous imbibition: Analysis and data interpretation. J. Petroleum Sci. Eng. 180, 456–470. doi:10.1016/j.petrol.2019.05.066
Akbarabadi, M., Saraji, S., Piri, M., Georgi, D., and Delshad, M. (2017). Nano-scale experimental investigation of in-situ wettability and spontaneous imbibition in ultra-tight reservoir rocks. Adv. Water Resour. 107, 160–179. doi:10.1016/j.advwatres.2017.06.004
Alkouh, A., and Wattenbarger, R. A. (2013). “New advances in shale reservoir analysis using flow back data,” in SPE Eastern Regional Meeting, Pennsylvania, USA, August 20–22, 2013. doi:10.2118/165721-MS
Bao, B., Riordon, J., Mostowfi, F., and Sinton, D. (2017). Microfluidic and nanofluidic phase behaviour characterization for industrial CO 2, oil and gas. Lab a Chip 17 (16), 2740–2759. doi:10.1039/C7LC00301C
Chen, M., Dai, J., Liu, X., Qin, M., Pei, Y., and Wang, Z. (2018). Differences in the fluid characteristics between spontaneous imbibition and drainage in tight sandstone cores from nuclear magnetic resonance. Energy & Fuels 32 (10), 10333–10343. doi:10.1021/acs.energyfuels.8b01396
Dong, M., Dullien, F. A. L., Dai, L., and Li, D. (2006). Immiscible displacement in the interacting capillary bundle model Part II. Applications of model and comparison of interacting and non-interacting capillary bundle models. Transp. Porous Media 63 (2), 289–304. doi:10.1007/s11242-005-6530-4
Dutta, R., Lee, C-H., Odumabo, S., Peng, Y., Walker, S. C., Karpyn, Z. T., et al. (2014). Experimental investigation of fracturing-fluid migration caused by spontaneous imbibition in fractured low-permeability sands. SPE Reserv. Eval. Eng. 17 (01), 74–81. doi:10.2118/154939-PA
Handy, L. L. 1960. Determination of effective capillary pressures for porous media from imbibition data, january. Available at: https://www.onepetro.org/general/SPE-1361-G?sort=&start=0&q=Determination+of+Effective+Capillary+Pressures+for+ Porous+Media+From+Imbibition+Data&from_year=&peer_reviewed=&published_between=&fromSearchResults=true&to_year=&rows=10.
Lai, J., Wang, G., Fan, Z., Chen, J., Wang, S., Zhou, Z., et al. (2016). Insight into the pore structure of tight sandstones using NMR and HPMI measurements. Energy & Fuels 30 (12), 10200–10214. doi:10.1021/acs.energyfuels.6b01982
Li, K., and Horne, R. N. (2001). Characterization of spontaneous water imbibition into gas-saturated rocks. SPE J. 6 (04), 375–384. doi:10.2118/74703-PA
Li, Y., Li, H., Chen, S., Ma, Q., and Chang, L. (2019). Two-phase fluid flow characterizations in a tight rock: A fractal bundle of the capillary tube model. Industrial Eng. Chem. Res. 58 (45), 20806–20814. doi:10.1021/acs.iecr.9b04328
Liang, T., Longoria, R. A., Lu, J., Nguyen, Q. P., and DiCarlo, D. A. (2017). Enhancing hydrocarbon permeability after hydraulic fracturing: Laboratory evaluations of shut-ins and surfactant additives. SPE J. 22 (041), 1011–1023. doi:10.2118/175101-PA
Liang, T., Luo, X., Nguyen, Q., and DiCarlo, D. (2018). Computed-tomography measurements of water block in low-permeability rocks: Scaling and remedying production impairment. SPE J. 23 (03), 762–771. doi:10.2118/189445-PA
Liang, X., Zhou, F., Liang, T., Wang, C., Wang, J., and Yuan, S. (2020). Impacts of low harm fracturing fluid on fossil hydrogen Energy production in tight reservoirs. Int. J. Hydrogen Energy 45 (41), 21195–21204. doi:10.1016/j.ijhydene.2020.06.011
Liu, J., and Sheng, J. J. (2020). Investigation of countercurrent imbibition in oil-wet tight cores using NMR technology. SPE J. 25, 2601–2614. doi:10.2118/201099-PA
Liu, Y., Leung, J. Y., Chalaturnyk, R., and Virues, C. J. J. (2017). “Fracturing fluid distribution in shale gas reservoirs due to fracture closure, proppant distribution and gravity segregation,” in SPE Unconventional Resources Conference, Alberta, Canada, February 15–16, 2017. doi:10.2118/185043-MS
Meng, M., Ge, H., Ji, W., Wang, X., and Chen, L. (2015). Investigation on the variation of shale permeability with spontaneous imbibition time: Sandstones and volcanic rocks as comparative study. J. Nat. Gas Sci. Eng. 27, 1546–1554. doi:10.1016/j.jngse.2015.10.019
Meng, Q., Liu, H., and Wang, J. (2017). A critical review on fundamental mechanisms of spontaneous imbibition and the impact of boundary condition, FLuid viscosity and wettability. Adv. Geo-Energy Res. 1 (1), 1–17. doi:10.26804/ager.2017.01.01
Mirzaei, M., DiCarlo, D. A., and Pope, G. A. (2016). Visualization and analysis of surfactant imbibition into oil-wet fractured cores. SPE J. 21 (01), 101–111. doi:10.2118/166129-PA
Shen, Y., Ge, H., Su, S., Liu, D., Yang, Z., and Liu, J. (2017). Imbibition characteristic of shale gas formation and water-block removal capability. Sci. SINICA Phys. Mech. Astronomica 47 (11), 114609. doi:10.1360/sspma2016-00538
Standnes, D. (2003). Experimental study of the impact of boundary conditions on oil recovery by Co-current and counter-current spontaneous imbibition. Energy & Fuels - ENERG FUEL 18, 271–282. doi:10.1021/ef030142p
Washburn, E. W. (1921). The dynamics of capillary flow. Phys. Rev. 17 (3), 273–283. doi:10.1103/PhysRev.17.273
Wei, B., Gao, K., Song, T., Zhang, X., Pu, W., Xu, X., et al. (2020). Nuclear-magnetic-resonance monitoring of mass exchange in a low-permeability matrix/fracture model during CO2 cyclic injection: A mechanistic study. SPE J. 25 (01), 440–450. doi:10.2118/199345-PA
Yang, L., Liu, D., Ge, H., Shen, Y., Li, C., and Zhang, K. (2016). “Experimental investigation on the effects of flow resistance on the fracturing fluids imbibition into gas shale,” in SPE Asia Pacific Hydraulic Fracturing Conference, Beijing, China, August 24–26, 2016. doi:10.2118/181825-MS
Yuan, S., Liang, T., Zhou, F., Liang, X., Yu, F., and Li, J. (2019). “A microfluidic study of wettability alteration rate on enhanced oil recovery in oil-wet porous media,” in Abu Dhabi International Petroleum Exhibition & Conference, Abu Dhabi, UAE, November 11–14, 2019.
Yuan, X., Yao, Y., Liu, D., and Pan, Z. (2019). Spontaneous imbibition in coal: Experimental and model analysis. J. Nat. Gas Sci. Eng. 67, 108–121. doi:10.1016/j.jngse.2019.04.016
Zhang, L., Zhou, F., Zhang, S., Wang, Y., Wang, J., and Wang, J. (2019). Investigation of water-sensitivity damage for tight low-permeability sandstone reservoirs. Acs Omega 4 (6), 11197–11204. doi:10.1021/acsomega.9b01286
Zhou, Z., Abass, H., Li, X., and Teklu, T. (2016). Experimental investigation of the effect of imbibition on shale permeability during hydraulic fracturing. J. Nat. Gas Sci. Eng. 29, 413–430. doi:10.1016/j.jngse.2016.01.023
Nomenclature
Keywords: spontaneous imbibition, heterogeneous sandstone, hydraulic fracturing, pore structure, sandstone gas reservoir
Citation: Wang M, Wang R, Yuan S and Zhou F (2023) A pore-scale study on the dynamics of spontaneous imbibition for heterogeneous sandstone gas reservoirs. Front. Energy Res. 11:1135903. doi: 10.3389/fenrg.2023.1135903
Received: 02 January 2023; Accepted: 20 January 2023;
Published: 13 February 2023.
Edited by:
Debin Kong, University of Science and Technology Beijing, ChinaReviewed by:
Daobing Wang, Beijing Institute of Petrochemical Technology, ChinaChiyu Xie, University of Science and Technology Beijing, China
Dongjin Xu, Yangtze University, China
Copyright © 2023 Wang, Wang, Yuan and Zhou. This is an open-access article distributed under the terms of the Creative Commons Attribution License (CC BY). The use, distribution or reproduction in other forums is permitted, provided the original author(s) and the copyright owner(s) are credited and that the original publication in this journal is cited, in accordance with accepted academic practice. No use, distribution or reproduction is permitted which does not comply with these terms.
*Correspondence: Mingchuan Wang, wangmc.syky@sinopec.com