Multiphysics thermo-mechanical behavior modeling for annular uranium-plutonium mixed oxide fuels in a lead-cooled fast reactor
 Yutai Cai1
  Wenzhong Zhou
 Long Gu
- 1Sino-French Institute of Nuclear Engineering and Technology Sun Yat-Sen University, Zhuhai, China
- 2Department of Mechanical Engineering City University of Hong Kong, Hong Kong, China
- 3Institute of Modern Physics Chinese Academy of Sciences, Lanzhou, China
Understanding and predicting nuclear fuel behavior is the cornerstone for fuel design and optimization, and the safe and economic operation of nuclear reactors. Due to the excellent neutronic economy and safe operational characteristics of lead/lead-bismuth-based liquid metal coolant, lead-cooled fast reactor (LFR) has received much attention and has been regarded as one of the top candidate reactors for Generation IV nuclear power plants. Mixed oxide (MOX) fuel is beneficial to improve fuel cycle utilization and consume weapons-grade plutonium, among which hollow MOX fuel has excellent heat transfer advantages, which can further improve fuel economy and safety, and has good development prospects. In this work, an annular uranium-plutonium mixed oxide (MOX) fuel operating in a liquid lead/lead-bismuth cooled fast reactor is modeled and simulated to predict its behavior under transient and steady-state operation. This model has several modules working in a fully coupled approach based on COMSOL Multiphysics, such as heat transfer, fuel burnup, oxygen redistribution, plutonium redistribution, porosity evolution, fission gas release, JOG growth, and grain size evolution. The modeling results were benchmarked with the existing codes and experimental data, and the results were in satisfactory agreement. The parameters analysis was carried out in this work. Consistent with the solid MOX fuel, the O/M ratio (or deviation from the stoichiometry of oxygen) significantly affects temperature evolution, fission gas migration and release behavior, and plutonium redistribution. Linear power also has a significant influence on fuel performance.
Introduction
Understanding and predicting fuel behavior are essential for fuel design, operation, reprocessing, and reactor safety. The nuclear fuel operation involves coupling multiple thermal, mechanical, and chemical phenomena. Early fuel models, such as GAPCON (Singh, 1977), FALCON (Rashid et al., 2004), FEMAXI (Nakajima et al., 1994), FRAPCON (Berna et al., 1997), and FRAPTRAN (Geelhood et al., 2011), typically used many correlations formulas to predict fuel behavior and had limited coupling between the physical fields. TOUTATIS (Bentejac and Hourdequin, 2005) and ALCYONE (Thouvenin et al., 2007) used 2D/3D models and expressions based on mathematical and physical principles to describe fuel behavior. However, fuel codes are usually written in programming languages, making code changes extraordinarily complex and challenging to apply the source code to other applications.
BISON is a code for simulating fuel performance developed by Idaho National Laboratory (INL) based on the Multiphysics Object-Oriented Simulation Environment (MOOSE). It is designed to solve the axisymmetric 1D, 2D, and 3D problems for fuel performance. The MOOSE framework has a limited graphical user interface and lacks pre- and post-processing tools.
The FAST code is based on the COMSOL Multiphysics platform and was developed to simulate the behavior of the CANDU reactor fuel under transient and steady-state operating conditions. The FAST code includes heat transfer, burnup, fuel densification, fission gas swelling and release. It also includes creep, pellet-cladding interaction, and other mechanics modules. The simulation results of the FAST code were benchmarked with ELESIM (Notley, 1979), ELESTRES (Chassie et al., 2005), and ELOCA (Williams, 2005) codes (the three codes were also developed for CANDU fuel) and experimental data, and good agreement was obtained.
CityU Advanced Multiphysics nuclear fuel Performance with User-defined Simulations (CAMPUS) (Liu et al., 2016) is an LWR fuel model based on MATPRO (Hagrman et al., 1995), BISON (Hales et al., 2016), and FAST (Prudil, 2013) code using the COMSOL Multiphysics platform. The predicted performance of a UO2 fuel with zircaloy cladding in CAMPUS was compared with the results from BISON, ABAQUS, and FRAPCON, and good agreement was achieved. UO2, composite (UO2-10%volBeO), silicide (U3Si2), and mixed oxide [(Th0.9,U0.1)O2] fuel performance are calculated and compared, which proves the flexibility and utility of the CAMPUS code. The CAMPUS code includes the modules of heat generation and production, oxygen diffusion, fuel deformation, fission gas release and swelling, gap/plenum pressure, and other models under transient and steady-state operating conditions.
In this paper, the development of a fuel code is described. This model is based on the COMSOL Multiphysics platform. COMSOL Multiphysics is a computational platform based on the finite element method with a variety of built-in physical fields such as mechanics, thermal, acoustics, and optics. Users can also implement physical fields by establishing PDEs and ODEs. COMSOL Multiphysics has comprehensive pre- and post-processing capabilities, including geometry construction, mesh generation and result plotting.
The model is based on the FAST and CAMPUS code framework described previously and simulated the behavior of annular MOX fuel in a liquid lead-bismuth eutectic cooled fast reactor. The model contains heat transfer, fuel burnup, oxygen redistribution, plutonium redistribution, fission gas release, porosity variation, and grain growth modules.
Model development
Model geometry and mesh
The annular MOX fuel pellet used in this work is modeled based on the pellet and cladding dimensions in the experimental fuel rod numbered ACO-3 from the U.S. Department of Energy’s CDE (Core Demonstration Experiment) experiment.
Figure 1 shows a 2D axisymmetric geometry used in this work. Fuel specifications are listed in Table 1. During the pellet production, the edges of the pellet are chamfered to give space to the swelling of the fuel during operation and to reduce the interaction forces of the pellets in the axial direction. The chamfering dimensions in this work are based on the literature (Prudil, 2013).
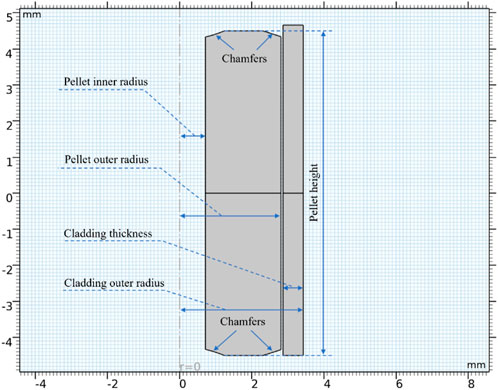
FIGURE 1. Schematic diagram of the annular MOX fuel used in this work.
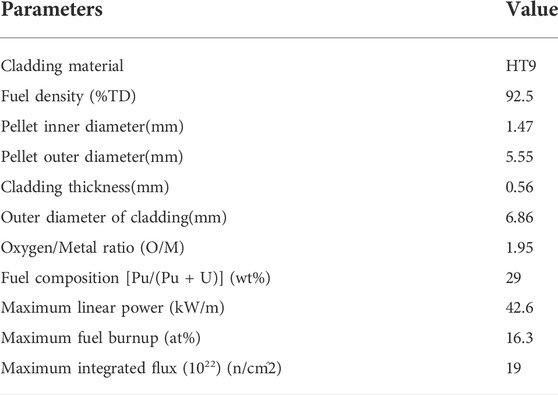
TABLE 1. Specifications of pellet in ACO-3 fuel rod (Bridges et al., 1993; Karahan and Buongiorno, 2010).
The COMSOL built-in “Adaptive Mesh Refinement” is used to save computational resources and obtain sufficient computational accuracy. Adaptive mesh refinement automatically refines the mesh when the local gradient is too large and retains the original mesh in areas with smaller gradients during the solving process. Figure 2 and Figure 3 demonstrate the mesh before and after refining.
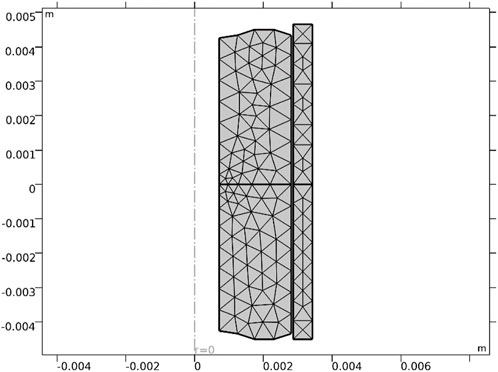
FIGURE 2. The mesh before refining.
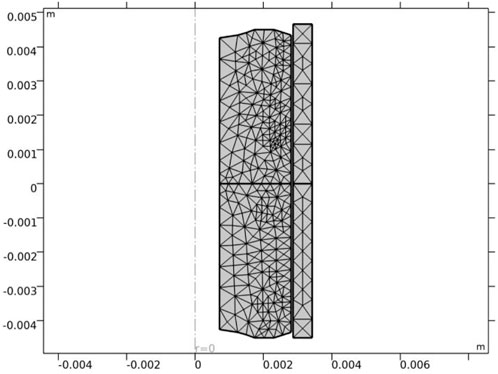
FIGURE 3. The mesh after refining.
Heat transfer module
To solve the temperature distribution of the fuel pellet, the transient heat transfer equation needs to be solved
where
Fuel burnup module
It is necessary to calculate the fuel burnup to accurately calculate properties such as thermal conductivity of fuels and predict fuel behavior. According to the literature (Morgan, 2007), the fuel burnup will be expressed through the ordinary differential equation and correlated with time and fuel power.
where
Oxygen redistribution module
Liquid metal-cooled fast reactors operate at higher linear powers and higher coolant temperatures than light water reactors (LWRs). In addition, the effective fuel density (smear density) and the initial oxygen/metal ratio are lower than those of LWRs. As a result, the operating fuel temperature is much higher than LWRs. The high temperatures and high-temperature gradients lead to a complex chemical environment (Karahan, 2009) where the migration of fuel components such as cesium, oxygen, molybdenum, and plutonium significantly impacts the overall fuel performance.
To control the chemical reaction between the fuel and the cladding, the initial oxygen/metal ratio of the oxide fuel in the fast reactor is designed to be less than 2. Deviation from stoichiometry
For the hypostoichiometric case, defining
Based on thermo-transport theory, the oxygen atom flux under temperature-driven
where
Bringing into the continuity equation
Under axisymmetric conditions, the gradient in the axial direction can be neglected. Eq. 4 becomes
Plutonium redistribution module
Plutonium migration mechanisms have been extensively investigated, and a large amount of basic information on plutonium migration mechanisms has been obtained. Bober (Bober et al., 1973) and Schumacher and Matzke (Glasser-Leme and Matzke, 1982) pointed out vapor transport and thermal diffusion as important mechanisms of plutonium migration, respectively. Vapor transport and thermal diffusion are mainly influenced by temperature, oxygen/metal ratio, and initial plutonium content (Olander, 1976).
Uranium and plutonium migrate under temperature gradients, especially in the radial direction where the temperature gradient is large (Ishii and Asaga, 2001). Such migration leads to local variations in plutonium concentration. The modeling of the radial distribution of plutonium is a critical issue for the design of MOX fuel pellets because the accumulation of plutonium in the central part of the fuel pellet during irradiation imposes significant limitations on the maximum fuel temperature, which affects the linear power of the fuel (Olander, 1976).
In this work, thermo-transport theory (Clement and Finnis, 1978; Ishii and Asaga, 2001) is used to simulate plutonium redistribution in the fuel pellet’s radial direction.
Diffusion flow
The continuity equation is
Combining the above two equations gives the variation of plutonium concentration with time in the radial distribution.
Fission gas release module
Since the Booth diffusion model (Booth, 1957) agrees well with the experimental data, it is used for the fission gas diffusion calculations in this work. The fission gas concentration
where
where
The fission gas atoms are released into the grain boundaries, and as the fuel burnup increases, the gas atoms saturate the grain boundaries, causing bubbles to interconnect, thus creating a diffusion path to the free volume of the fuel. The subsequent fission gas produced will be released into the free volume of the fuel. Grain boundary saturated gas density
where
Porosity variation module
Under the effect of the temperature gradient, the pores migrate toward the center of the fuel. The pores migrate toward the pellet center for solid MOX fuels, eventually forming a central void; for annular MOX fuels, they show an increase in porosity at the surface of the central hollow. The migration mechanism is vapor transport, where the fuel vaporizes on the hotter side of the pore and then condenses on the cooler side of the pore. The vapor transport results in the migration of the porosity to the center of the fuel, and the theoretical support for vapor transport comes from Nichols (Nichols, 1967) and Sens (Sens, 1972). The physical and mathematical models of the migration governing equations are well summarized in the literature (Vance, 2017).
During fuel production, pores are created, which are called initial porosity. Based on the initial porosity, the effect of fuel densification, fission gas, and solid fission product swelling on the porosity is considered.
where
The correlation of swelling caused by fission gas is taken from MATPRO nuclear fuel material properties database (Mihaila et al., 2012) as
Grain growth module
During the irradiation process, high temperatures cause grain growth. In this work, the effective size of the grain is assumed to be the average grain diameter, which is obtained by solving the equation given in the literature (Khoruzhii et al., 1999)
where
The effect of irradiation on grain growth
Results and discussions
The Heat Transfer Module in COMSOL was used to solve the heat transfer in fuel. The thermal deformation was calculated using the Solid Mechanics module in COMSOL. The modules of oxygen redistribution, plutonium, grain growth, and fission gas release are implemented with user-defined PDEs. The MUMPS (Multi-frontal Massively Parallel sparse) direct solver in COMSOL is used to solve the coupled multiphysics. In all calculations, except those with marked power, the rest are calculated with a linear power of
The migration of oxygen has a significant impact on the overall performance of the fuel. To control the chemical reaction of the pellet with the cladding, the initial oxygen/metal ratio of MOX fuel is designed to be less than 2. The oxygen is redistributed in the radial direction under the temperature gradient during operation.
Figure 4 and Figure 5 demonstrate the radial distribution of oxygen to the burnup for an initial oxygen/metal ratio of 1.99 and 1.90, respectively. The deviation from the stoichiometry of oxygen (devi_sto) is defined in the chemical expression of the fuel
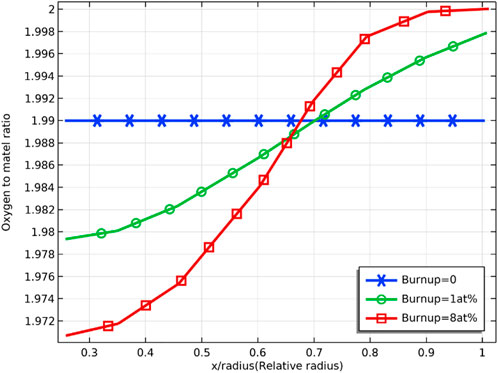
FIGURE 4. Radial distribution of oxygen/metal ratio at 0, 1 at% and 8 at% fuel burnup (with initial oxygen/metal ratio of 1.99)
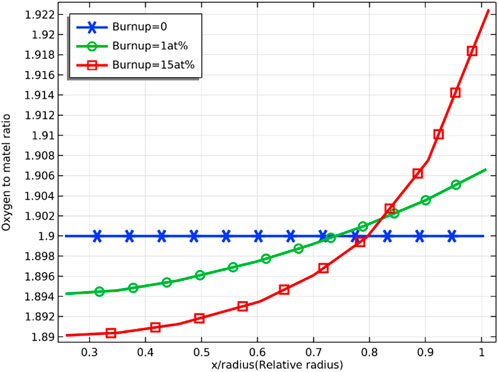
FIGURE 5. Radial distribution of oxygen/metal ratio at 0, 1 at% and 8 at% fuel burnup (with oxygen/metal ratio of 1.90)
As shown in Figure 6, the inner surface temperature of the pellet is sensitive to the deviation from the stoichiometry of oxygen. The fuel temperature rises faster when the deviation from the stoichiometry of oxygen increases, and the temperature difference between the inner surface of the pellet reaches the maximum value at the fuel burnup of about 4 at%, which are 1600 K and 1780 K for the deviation from the stoichiometry of oxygen of 0.001 and 0.1, respectively, the difference reaches 180 K.
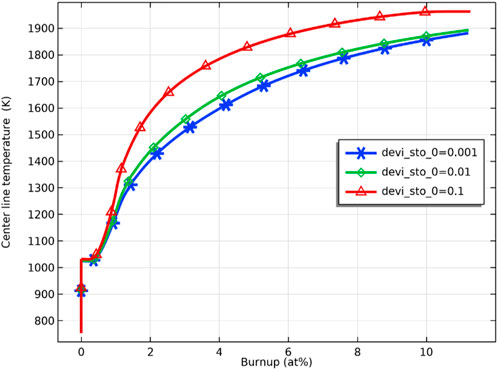
FIGURE 6. Pellet inner surface temperature against burnup for deviation from the stoichiometry of oxygen of 0.001, 0.01, and 0.1 (with Pu content = 29wt%).
As the burnup further increases, the difference in the fuel inner surface temperature due to different deviations from the stoichiometry of oxygen decreases, and the fuel temperature stabilizes. The difference in fuel temperature can be explained by the effect of the deviation from the stoichiometry of oxygen on the fuel thermal conductivity. The thermal conductivity of the pellet was plotted against different deviations from stoichiometry, as shown in Figure 7, where the thermal conductivity of the pellet decreases with an increase of deviation from the stoichiometry of oxygen. The decrease in thermal conductivity leads to higher fuel temperature. Plotting the thermal conductivity against temperature for different fuel burnups at the same deviation from the stoichiometry of oxygen, as shown in Figure 8, the thermal conductivity of the fuel decreases with an increase in burnup at the same temperature. On the other hand, the difference in thermal conductivity due to temperature difference decreases as burnup increases, resulting in a decrease in the difference in thermal conductivity of the inner and outer surfaces of the pellet. However, the difference in temperature increases with deepening burnup. As shown in Figure 9, the difference in thermal conductivity between the inner and outer surfaces of the pellet is about 6 W/m_K (5 W/m_K on the inner surface and 11.3 W/m_K on the outer surface) at 1 at% burnup. This value decreases to less than 2 W/m_K (1.7 W/m_K on the inner surface and 3.2 W/m_K on the outer surface) at 5 at% burnup. The temperature of the inner and outer surfaces of the pellet against burnup is shown in Figure 9, and the radial temperature at 1 at% and 5 at% is shown in Figure 10.
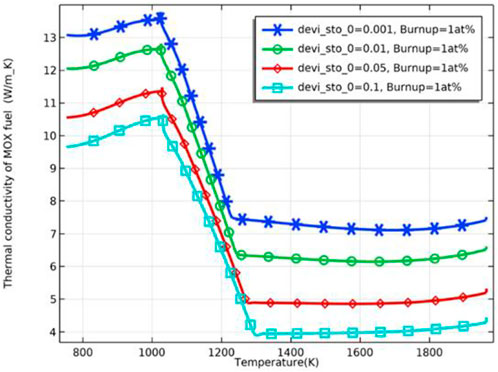
FIGURE 7. Fuel thermal conductivity against temperature for deviation from the stoichiometry of oxygen of 0.001, 0.01, 0.05 and 0.1 (burnup = 1 at%).
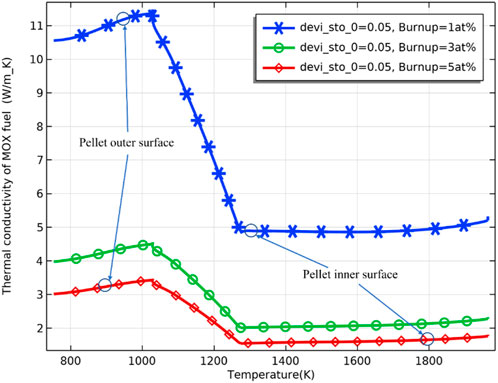
FIGURE 8. Fuel thermal conductivity against temperature for burnup of 1 at%, 3 at%, and 5 at% (deviation from the stoichiometry of oxygen = 0.05).
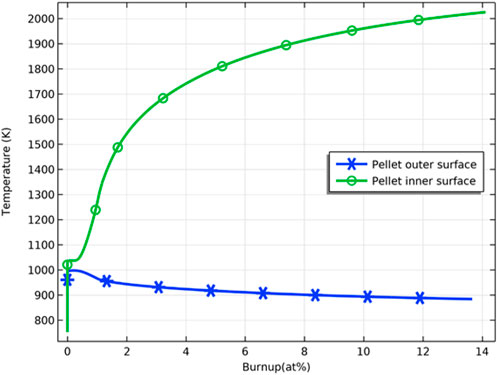
FIGURE 9. Pellet inner/outer surface temperature variation against burnup.
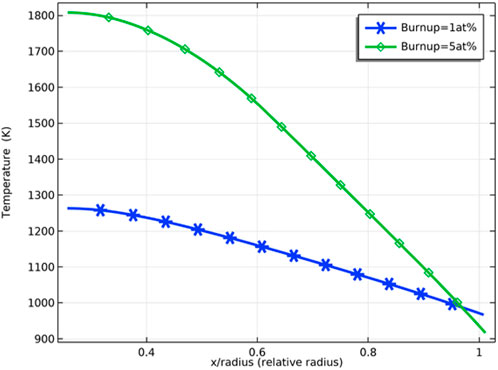
FIGURE 10. Pellet radial temperature for burnup = 1 at% and 5 at%.
As Figure 11 shows, the grain size increases rapidly with an increase in burnup in the initial stage. Then the grain size increase rate slows down due to reaching the maximum grain size allowed at the corresponding temperature (Eq. 16). The effect of deviation from the stoichiometry of oxygen on grain size is significant, with grain size increasing within 50% for deviation from the stoichiometry of oxygen of 0.001 and 0.01 at 6 at% fuel burnup. In contrast, grain size has increased to more than 4 times the original size for deviation from stoichiometry of oxygen of 0.1. With the further increase of fuel burnup, the grain size difference under different deviations from the stoichiometry of oxygen conditions decreases and tends to the maximum grain size.
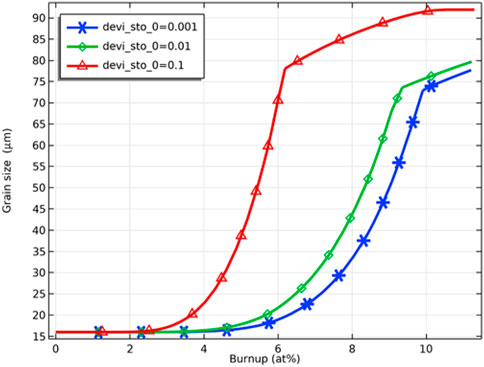
FIGURE 11. Variation of pellet inner surface grain size with fuel burnup for deviation from the stoichiometry of oxygen of 0.001, 0.01 and 0.1.
As Figure 12 shows, the grains grow in the range of relative radius less than 0.6, which is due to the fact that grain growth requires a temperature higher than 1300 K (Sari, 1986). At a fuel burnup of 8 at%, the grain size of the pellet inner surface is 30 and 40 μm at deviation from the stoichiometry of oxygen of 0.001 and 0.01, respectively, while at deviation from the stoichiometry of oxygen of 0.1, the grain size of the pellet inner surface reaches 85 μm. This can be explained by the fact that when the deviation from the stoichiometry of oxygen increases, the fuel thermal conductivity decreases, and the fuel temperature increases, resulting in an increase in the grain size.
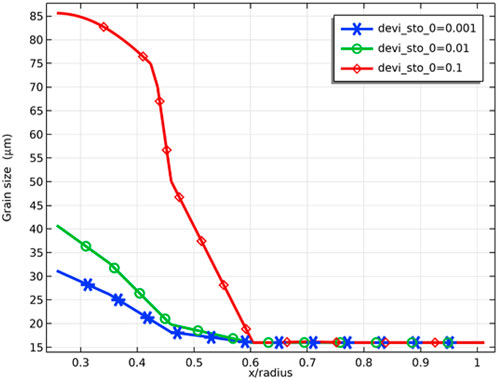
FIGURE 12. Radial variation of grain size at deviation from the stoichiometry of oxygens of 0.001, 0.01, and 0.1 (fuel burnup of 8 at%).
Figure 13 demonstrates the variation of the porosity of the fuel inner surface with increasing fuel burnup for different deviations from the stoichiometry of oxygen. At the initial stage, there is a slight decrease in porosity caused by fuel densification. The fuel porosity then increases rapidly and reaches saturation. After the fuel porosity saturation, the porosity decreases due to continued fission gas release, and the swelling of the solid fission products takes voids in the fuel matrix. The porosity increasing on the pellet’s inner surface was confirmed by the experiments. The microstructure around the hollow at different burnups is shown in Figure 14. The pores formed by the void migration and growth of fission gas bubbles moved to the hollow edge part and became coarsened (Ishimi et al., 2016). Compared with the porosities for different deviations from the stoichiometry of oxygen, the porosity of the pellet inner surface increases when the deviation from the stoichiometry of oxygen increases, which is caused by the rise in temperature and the swelling of fission gas. As Figure 15 shows, the increase in porosity leads to a decrease in fuel thermal conductivity and a further rise in pellet inner surface temperature. Because the thermal conductivity of the fuel decreases as the porosity increases, the fuel temperature is higher for the same fuel burnup when the initial porosity of the fuel increases, as Figure 16 shows.
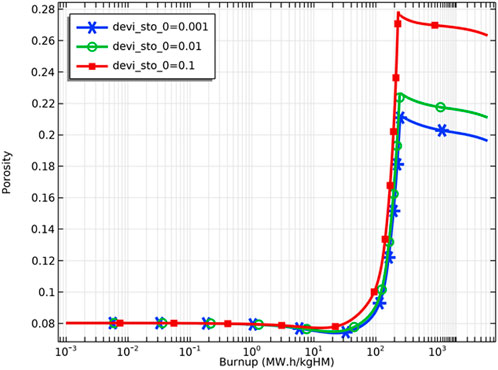
FIGURE 13. Variation of pellet inner surface porosity for deviation from the stoichiometry of oxygens of 0.001, 0.01 and 0.1.
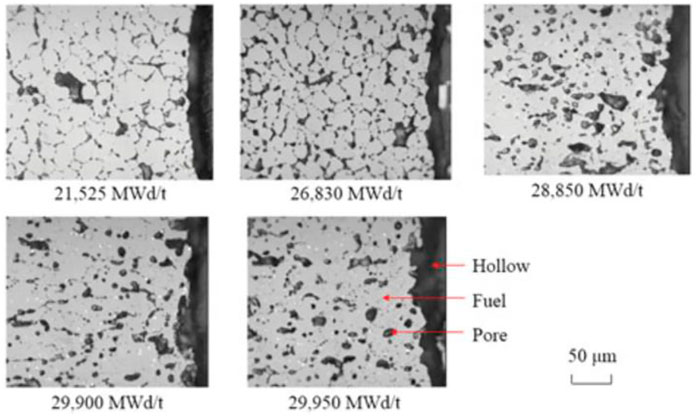
FIGURE 14. Microstructures of fuel region around the hollow fuel pellets at different burnups (Ishimi et al., 2016).
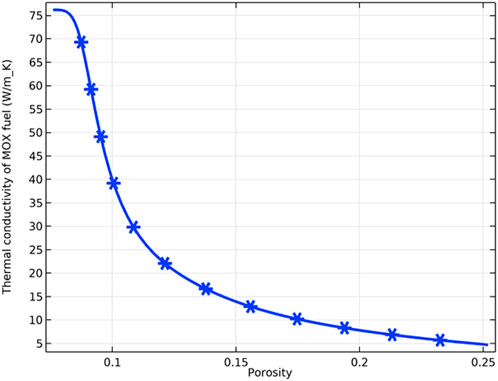
FIGURE 15. Variation of fuel thermal conductivity with porosity.
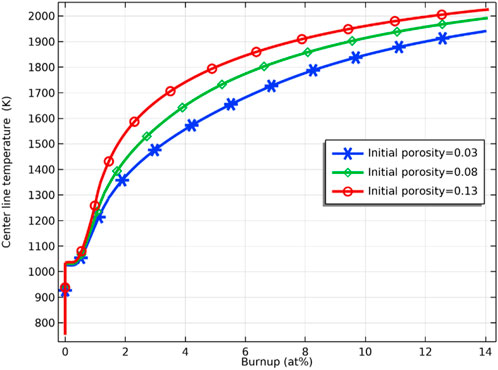
FIGURE 16. Variation of fuel inner surface temperature with fuel burnup for initial porosity of 0.03, 0.08 and 0.13.
As Figure 17 shows, no fission gas is released from the pellet at the initial stage of fuel irradiation because the fission gas in the grain boundaries does not saturate yet (Eq. 10), and no fission gas has escaped. When the fuel burnup reaches about 1 at%, the fission gas starts to be released from the pellet and increases logarithmically with the fuel burnup, which is consistent with the literature (Karahan and Buongiorno, 2010) (see Figure 17 ). Figure 17 demonstrates the effect of deviation from the stoichiometry of oxygen on fission gas release. There is an increasing trend of fission gas release with increasing deviation from the stoichiometry of oxygen. The effect of deviation from the stoichiometry of oxygen on fission gas release is significant from 2 at% to 8 at% fuel burnup, with the percentage of fission gas release at 4 at% fuel burnup being about 63% for deviation from the stoichiometry of oxygen of 0.1 and about 36% for a deviation from the stoichiometry of oxygen of 0.001. The release of fission gas leads to an increase in gap pressure, which increases the pressure on the cladding and thus increases the risk of breakage.
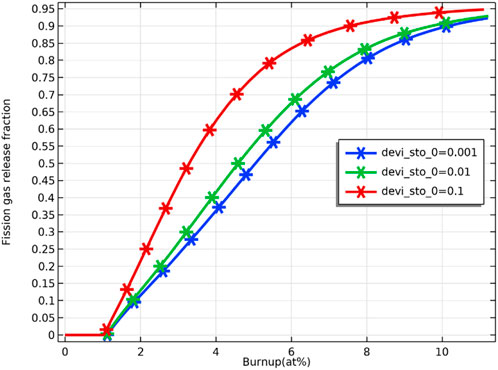
FIGURE 17. Variation of pellet inner surface fission gas release rate with fuel burnup for deviation from the stoichiometry of oxygen of 0.001, 0.01 and 0.1.
Figure 18 demonstrates the comparison of the fission gas release from the fuel pellet’s inner and outer surfaces of the fuel pellet. Since the temperature of the outer surface of the pellet is lower than that of the inner surface, the fission gas at the grain boundaries on the outer surface of the pellet saturates later in the initial stage of irradiation and therefore released later. Since the inner surface temperature of the pellet is higher than the outer surface temperature, the release of fission gas on the inner surface of the pellet is much larger than that on the outer surface.
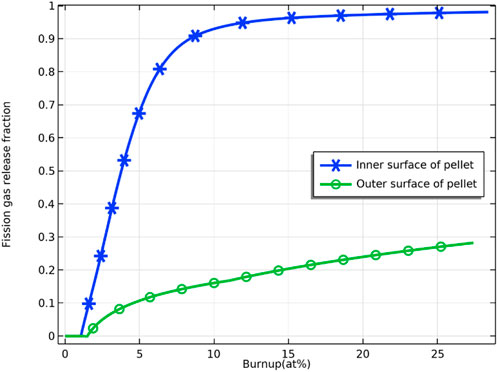
FIGURE 18. Variation of fission gas release ratio on the inner and outer surfaces of fuel pellets with fuel burnup.
Figure 19 compares the results of the FEAST model (Karahan (Karahan, 2009; Karahan and Buongiorno, 2010)), the OGRES model (Matthews and Wood (Matthews and Wood, 1980) ), and experimental data for fission gas release predictions. As shown in Figure 19, the fission gas release from the FEAST model, OGRES model, and experimental data all show a logarithmic trend, which is consistent with the trend predicted for fission gas release in this work. The differences in slope and maximum value may arise from temperature and fuel composition differences.
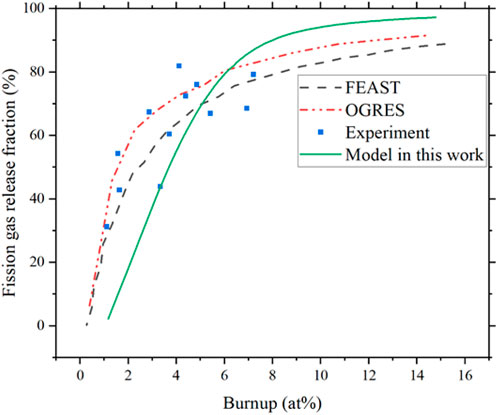
FIGURE 19. Fission gas release ratio from FEAST, OGRES model, experiment data (Karahan and Buongiorno, 2010), and compared with model in this work.
Plutonium migrates under a temperature gradient, especially in a zone with a significant temperature gradient. The distribution of plutonium is a slow process, as shown in Figure 20, with plutonium migrating toward the center of the fuel pellet during irradiation, which is consistent with the literature (Valentino et al., 2012). Since the diffusion of plutonium in uranium accelerates with the temperature increase, the plutonium content remains unchanged at 29 wt% in the outer part of the pellet, where the temperature is low. In the region where the relative radius is smaller than 0.7, plutonium migrates toward the center of the pellet.
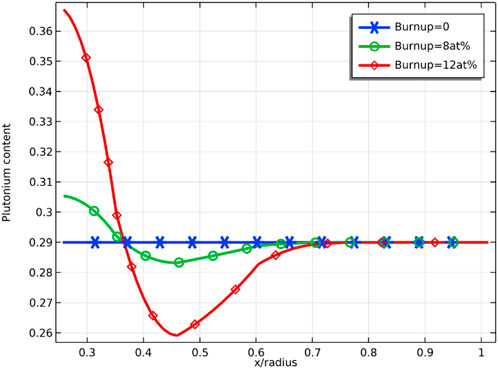
FIGURE 20. Radial distribution of plutonium at 0,8 at% and 12 at% fuel burnup.
Figure 21 demonstrates the radial distribution of plutonium content for different deviations from the stoichiometry of oxygen at a burnup of 8 at%. The radial distribution of plutonium is sensitive to the deviation from the stoichiometry of oxygen, and the difference in plutonium content in the radial direction is less than 0.5 wt% at deviation from the stoichiometry of oxygen of 0.001, while plutonium content difference is greater than 4 wt% at deviation from the stoichiometry of oxygen of 0.1. This can be explained by the fact that the increase in deviation from the stoichiometry of oxygen reduces the thermal conductivity of the fuel, which leads to an increase in fuel temperature and accelerates the migration of plutonium. The accumulation of plutonium leads to an increase in local power, so the swelling of solid fission products and the swelling of gas fission products will be more significant at these locations. In the case of uniform power distribution, the temperature at the center of the fuel is already higher due to the poor thermal conductivity of MOX fuel, and the power rise due to plutonium enrichment at the center of the pellet will further increase the temperature at the center of the pellet. Compared with a solid pellet, an annular pellet can avoid high pellet center temperature and leave some space for fuel swelling, delaying fuel failure.
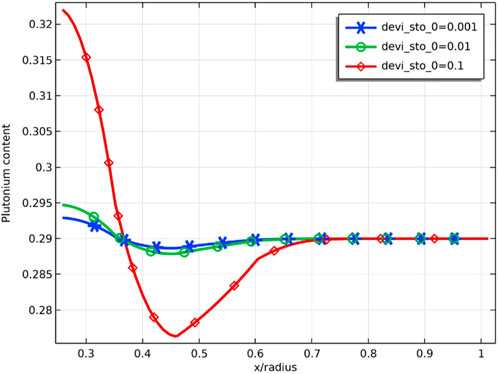
FIGURE 21. Radial distribution of plutonium content (mass fraction) for deviation from the stoichiometry of oxygens of 0.001, 0.01, and 0.1 (fuel burnup of 8 at%).
Figure 22 is taken from the CEDAR code developed by Japan Nuclear Cycle Development Institute (JNC) (Uwaba et al., 2014) and experimental measurements. The measurements were taken from XD0992 fuel rods with an initial linear power of 44 kW/m, and the plutonium distribution was obtained by electron probe microanalysis (EPMA) after running for 560 effective full power days (EFPD). Comparing the line of “Burnup = 12 at%" in Figure 20 and Figure 22, the distribution trend of plutonium is the same, showing a trend of enrichment against the temperature gradient and toward the center. Meanwhile, the plutonium content redistribution prediction in this model calculation agrees well with the CEDAR model and the experimental data. The plutonium content is close to 40% at the center of the fuel, while the plutonium content on the outer surface of the fuel is almost unchanged.
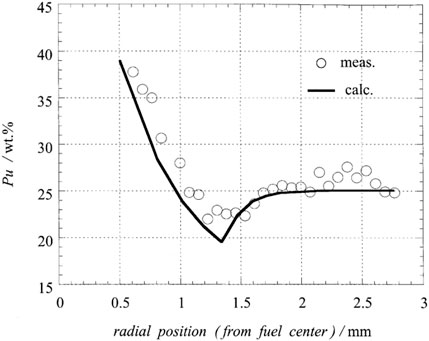
FIGURE 22. Radial distribution of plutonium predicted by CEDAR model and comparison of experimental data (experimental data from XD0992 fuel rod with 11 at% burnup, initial oxygen/metal ratio of 1.99, and initial plutonium content of 27 wt%) (Ishii and Asaga, 2001).
Three initial linear power (35 kW/m, 40 kW/m, and 43 kW/m) are simulated to investigate the effect of power increase on fuel performance. As shown in Figure 23, the temperature of the fuel inner surface increases with the increase of the initial linear power. The maximum fuel inner surface temperature at initial linear power of 35 kW/m, 40 kW/m, and 43 kW/m are 1820, 2000, and 2050 K, respectively, and the highest simulated linear power is 43 kW/m, at which the maximum fuel temperature does not reach the melting point.
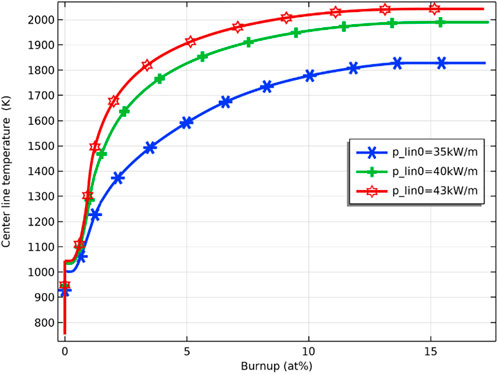
FIGURE 23. Variation of pellet inner surface temperature at initial linear power of 35 kW/m, 40 kW/m and 43 kW/m.
The effect of pellet thermal expansion and JOG growth in the gap closure process is considered. Figure 24 shows the gap closure process for initial linear power of 35 kW/m, 40 kW/m and 43 kW/m. As the linear power increases, the pellet-cladding closure is advanced. On the one hand, the rise in linear power causes an increase in fuel temperature, which in turn increases the thermal expansion of the pellet; on the other hand, as shown in Figure 25, the release of fission gas increases due to the rise in fuel linear power, which leads to faster growth of JOG. The increase in fuel linear power causes the pellet-cladding gap to close earlier due to the increased thermal expansion and the accelerated JOG growth.
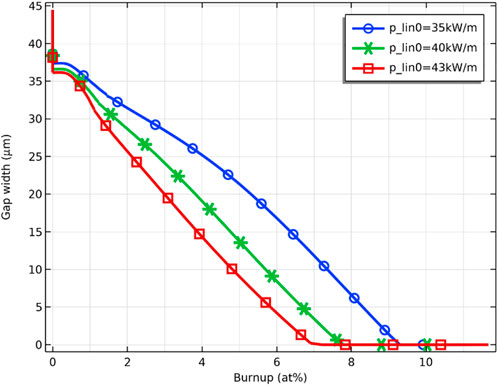
FIGURE 24. Gap closure process for initial linear power of 35 kW/m, 40 kW/m and 43 kW/m.
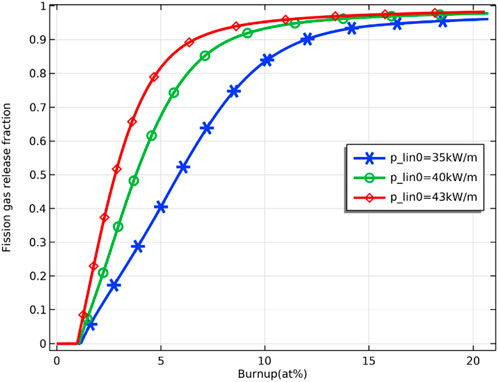
FIGURE 25. Fission gas release fraction at initial linear power of 35 kW/m, 40 kW/m and 43 kW/m.
Conclusion
A fuel performance simulation model based on the COMSOL Multiphysics platform was developed, which contains modules such as heat transfer, oxygen redistribution, plutonium redistribution, and fission gas release, which could be used for transient and steady-state simulation. In this work, a 2D axisymmetric model is developed for operating a single MOX fuel pellet and cladding in a liquid lead-bismuth eutectic cooled fast reactor. The material and geometry of the ACO-3 fuel were used. The simulation results are compared with existing codes and experimental data, and a good agreement is achieved. This model has a visual interface for easy modification and adjustment of parameters and is suitable for simulation and analysis of different fuel types and sizes.
The O/M ratio (or deviation from the stoichiometry of oxygen) significantly affects temperature evolution, fission gas migration and release behavior, and plutonium redistribution. In the initial stage of fuel operation, oxygen is redistributed in the radial direction and migrates from the center to the outer surface of the fuel. This effect is affected by the fuel’s initial oxygen/metal ratio. The oxygen/metal ratio of the fuel has a significant influence on the thermal conductivity, grain growth, fuel porosity, and fission gas release of the fuel. As the deviation from the stoichiometry of oxygen increases, the thermal conductivity of the fuel decreases, resulting in a higher fuel temperature. The fuel grain size tends to increase with increasing the deviation from the stoichiometry of oxygen, with the most pronounced grain size change on the inner surface of the fuel, where the temperature is highest. With the increase of the deviation from the stoichiometry of oxygen, the saturation value of the fuel porosity shows an upward trend, and the increase of the porosity results in a decrease in the thermal conductivity of the fuel, which in turn results in a higher fuel temperature. The fission gas release amount and release rate showed an upward trend with the increase of the deviation from the stoichiometry of oxygen. The release of fission gas occurs mainly on the inner surface of the fuel, whose temperature is highest. Plutonium shows a tendency to migrate toward the center during fuel operation, and this trend is exacerbated with the increase of the deviation from the stoichiometry of oxygen. Higher fuel temperature resulted in faster fission gas release, faster JOG growth, and earlier closure of the pellet-cladding as fuel line power rose.
The operation of nuclear fuel involves coupling many physical and chemical phenomena, and the model established in this work has many areas worthy of further improvement. In order to make the simulation results more in line with the actual operation of the reactor, improvements can be made, such as 1) considering the power history during reactor operation; 2) modeling multiple pellets, taking into account power differences at different positions of the fuel rods; 3) using a 3D model; and 4) enhancing the mechanics module, taking cracking and creep into consideration.
Data availability statement
The raw data supporting the conclusions of this article will be made available by the authors, without undue reservation.
Author contributions
The work is mainly done by YC. WZ is the advisor of YC. KC and LG contributed to the accomplishment of this work. All authors contributed to the article and approved the submitted version.
Funding
The financial support from the Nuclear Power Technology Innovation Center of China (No. 45000-41020012) and the Fundamental Research Funds for the Central Universities of China (No. 45000-18841210) is highly appreciated.
Conflict of interest
The authors declare that the research was conducted in the absence of any commercial or financial relationships that could be construed as a potential conflict of interest.
Publisher’s note
All claims expressed in this article are solely those of the authors and do not necessarily represent those of their affiliated organizations, or those of the publisher, the editors and the reviewers. Any product that may be evaluated in this article, or claim that may be made by its manufacturer, is not guaranteed or endorsed by the publisher.
References
Bentejac, F., and Hourdequin, N. (2005). Toutatis: An application of the CAST3M finite element code for PCI three-dimensional modeling. Proc. Pellet-clad Interact. Water React. Fuels 37, 9–11.
Berna, G. A., Beyer, G. A., Davis, K. L., and Lanning, D. D. (1997). FRAPCON-3: A computer code for the calculation of steady-state, thermal-mechanical behavior of oxide fuel rods for high burnup. Maryland, United States: US Nuclear Regulatory Commission. doi:10.2172/576110
Bober, M., Schumacher, G., and Geithoff, D. (1973). Plutonium redistribution in fast reactor mixed oxide fuel pins. J. Nucl. Mater. 47 (2), 187–197. doi:10.1016/0022-3115(73)90101-3
Booth, A. H. (1957). A method of calculating fission gas diffusion from UO2 fuel and its application to the X-2-f loop test. Chalk River, Canada: AECL.
Bridges, A. E., Waltar, A. E., Leggett, R. D., Baker, B., and Ethridge, J. L. (1993). A liquid-metal reactor core demonstration experiment using HT-9. Nucl. Technol. 102 (3), 353–366. doi:10.13182/nt93-a17034
Carbajo, J. J., Yoder, G. L., Popov, S. G., and Ivanov, V. K. (2001). A review of the thermophysical properties of MOX and UO2 fuels. J. Nucl. Mater. 299 (3), 181–198. doi:10.1016/s0022-3115(01)00692-4
Chassie, G. G., Sim, K.-S., Wong, B., and Papayiannis, G. (2005). ELESTRES code Upgrades. Vienna, Austria: International Nuclear Information System.
Clement, C., and Finnis, M. (1978). Plutonium redistribution in mixed oxide (U, Pu)O2 nuclear fuel elements. J. Nucl. Mater. 75 (1), 193–200. doi:10.1016/0022-3115(78)90044-2
Geelhood, K. J., Luscher, W. G., Beyer, C. E., and Cuta, J. M. (2011). Fraptran 1.4: A computer code for the transient analysis of oxide fuel rods. Maryland, United States: US Nuclear Regulatory Commission.
Glasser-Leme, D., and Matzke, H. (1982). Interdiffusion and chemical diffusion in the UO2 - (U, Pu)O2 system. J. Nucl. Mater. 106, 211–220. doi:10.1016/0022-3115(82)90350-6
Hagrman, D. T., Allison, C. M., and Berna, G. A. (1995). SCDAP/RELAP5/MOD 3.1 code manual: MATPRO, A library of materials properties for light-water-reactor accident analysis. United States: N: Web. doi:10.2172/100327
Hales, J. D., Novascone, S. R., Pastore, G., Perez, D. M., Spencer, B. W., and Williamson, R. L. (2016). BISON theory manual the Equations behind nuclear fuel analysis. INL/EXT-13-29930 rev. 3. Idaho Falls, Idaho: Idaho National Laboratory.
Hastings, I. J., and Evans, L. E. (1979). Densification algorithm for irradiated UO2 fuel. J. Am. Ceram. Soc. 62, 217–218. doi:10.1111/j.1151-2916.1979.tb19061.x
Ishii, T., and Asaga, T. (2001). An investigation of the Pu migration phenomena during irradiation in fast reactor. J. Nucl. Mater. 294, 13–17. doi:10.1016/s0022-3115(01)00445-7
Ishimi, A., Katsuyama, K., Kihara, Y., and Furuya, H. (2016). Fuel performance of hollow pellets for fast breeder reactors. J. Nucl. Sci. Technol. 53 (7), 951–956. doi:10.1080/00223131.2015.1085337
Karahan, A., and Buongiorno, J. (2010). Modeling of thermo-mechanical and irradiation behavior of mixed oxide fuel for sodium fast reactors. J. Nucl. Mater. 396 (2), 272–282. doi:10.1016/j.jnucmat.2009.11.021
Karahan, A. (2009). Modelling of thermo-mechanical and irradiation behavior of metallic and oxide fuels for sodium fast reactors. United States: Massachusetts Institute of Technology. Ph.D. thesis.
Khoruzhii, O. V., Kourtchatov, S. Y., and Likhanskii, V. V. (1999). New model of equiaxed grain growth in irradiated UO2. J. Nucl. Mater. 265 (1), 112–116. doi:10.1016/s0022-3115(98)00632-1
Liu, R., Prudil, A., Zhou, W., and Chan, P. K. (2016). Multiphysics coupled modeling of light water reactor fuel performance. Prog. Nucl. Energy 91, 38–48. doi:10.1016/j.pnucene.2016.03.030
Matthews, J. R., and Wood, M. H. (1980). A simple operational gas release and swelling model: II. Grain boundary gas. J. Nucl. Mater. 91 (2), 241–256. doi:10.1016/0022-3115(80)90224-x
Mihaila, B., Stan, M., and Crapps, J. (2012). Impact of thermal conductivity models on the coupling of heat transport and oxygen diffusion in UO2 nuclear fuel elements. J. Nucl. Mater. 430 (1), 221–228. doi:10.1016/j.jnucmat.2012.07.007
Nakajima, T., Saito, H., and Osaka, T. (1994). FEMAXI-IV: A computer code for the analysis of thermal and mechanical behavior of light water reactor fuel rods. Nucl. Eng. Des. 148 (1), 41–52. doi:10.1016/0029-5493(94)90240-2
Nichols, F. A. (1967). Theory of columnar grain growth and central void formation in oxide fuel rods. J. Nucl. Mater. 22 (2), 214–222. doi:10.1016/0022-3115(67)90031-1
Notley, M. (1979). Elesim: A computer code for predicting the performance of nuclear fuel elements. Nucl. Technol. 44 (3), 445–450. doi:10.13182/nt79-a32279
Prudil, A. A. (2013). Fast: A fuel and sheath modeling tool for CANDU reactor fuel. Kingston, Ontario, Canada: Royal Military College of Canada. Ph.D. thesis.
Rashid, Y., Dunham, R., and Montgomery, R. (2004). Fuel analysis and licensing code: Falcon MOD01. EPRI Report.
Sari, C. (1986). Grain growth kinetics in uranium-plutonium mixed oxides. J. Nucl. Mater. 137 (2), 100–106. doi:10.1016/0022-3115(86)90038-3
Sens, P. F. (1972). The kinetics of pore movement in UO2 fuel rods. J. Nucl. Mater. 43 (3), 293–307. doi:10.1016/0022-3115(72)90061-x
Singh, R. N. (1977). Isothermal grain-growth kinetics in sintered UO2 pellets. J. Nucl. Mater. 64 (1), 174–178. doi:10.1016/0022-3115(77)90021-6
Teague, M., Tonks, M., Novascone, S., and Hayes, S. (2014). Microstructural modeling of thermal conductivity of high burnup mixed oxide fuel. J. Nucl. Mater. 444 (1-3), 161–169. doi:10.1016/j.jnucmat.2013.09.035
Thouvenin, G., Michel, B., Sercombe, J., Plancq, D., and Thevenin, P. (2007). Multidimensional modeling of a ramp test with the PWR fuel performance code ALCYONE. United States: Web.
Uwaba, T., Mizuno, T., Nemoto, J., Ishitani, I., and Ito, M. (2014). Development of a mixed oxide fuel pin performance analysis code “CEDAR”: Models and analyses of fuel pin irradiation behavior. Nucl. Eng. Des. 280, 27–36. doi:10.1016/j.nucengdes.2014.08.032
Valentino, D. M., Arndt, S., Jacques, V. D., and Paul, V. U. (2012).Revision of the transuranus PUREDI model. Technical report for the JRC-ITU Action No. 52201 – Safety of Nuclear Fuels and Fuel Cycles.
Vance, I. (2017). Computer simulation of pore migration due to temperature gradients in nuclear oxide fuel. Arkansas, Fayetteville: scholarworks.uark.edu. Thesis.
White, R., and Tucker, M. (1983). A new fission-gas release model. J. Nucl. Mater. 118 (1), 1–38. doi:10.1016/0022-3115(83)90176-9
Williams, A. (2005). The ELOCA fuel modelling code: Past, present and future. Toronto, Ontario (Canada): International Nuclear Information System.
Appendix
TABLE A1. Summary of MOX
Keywords: mixed oxide (MOX) fuels, lead-cooled fast reactor (LFR), multiphysics, annular fuel, nuclear fuel performance
Citation: Cai Y, Chen K, Zhou W and Gu L (2022) Multiphysics thermo-mechanical behavior modeling for annular uranium-plutonium mixed oxide fuels in a lead-cooled fast reactor. Front. Energy Res. 10:993383. doi: 10.3389/fenrg.2022.993383
Received: 13 July 2022; Accepted: 05 September 2022;
Published: 27 September 2022.
Edited by:
Muhammad Saeed, East China University of Technology, ChinaReviewed by:
Mohammad Alrwashdeh, Khalifa University, United Arab EmiratesYufeng Lv, China Institute of Atomic Energy, China
Copyright © 2022 Cai, Chen, Zhou and Gu. This is an open-access article distributed under the terms of the Creative Commons Attribution License (CC BY). The use, distribution or reproduction in other forums is permitted, provided the original author(s) and the copyright owner(s) are credited and that the original publication in this journal is cited, in accordance with accepted academic practice. No use, distribution or reproduction is permitted which does not comply with these terms.
*Correspondence: Wenzhong Zhou, zhouwzh3@mail.sysu.edu.cn; Long Gu, gulong@impcas.ac.cn