Multiple detections of insulation defects partial discharge in gas-insulated equipment
 Fanjun Kong1*
  Ke Zhao2 Jingtan Ma2 Tianxin Zhuang2 Hongtao Li2 Shan Gao2 Jianjun Liu2 Chaohai Zhang1
- 1Department of Electrical Engineering, Nanjing University of Aeronautics and Astronautics, Nanjing, China
- 2State Grid Jiangsu Electric Power Research Institute, Nanjing, China
Gas-insulated equipment is an important part of the power system owing to its advantages of small footprint, large transmission capacity, and high reliability. Detection of insulation defects partial discharge (PD) is important for its operation and maintenance, and the combination of multiple detection methods can greatly improve the accuracy of PD detection. In this study, the three kinds of insulation defects, namely, floating defect, void defect, and surface defect, are set up on the PD simulation platform and detected using the ultra-high frequency (UHF) method, high-frequency current (HFCT) method, and acoustic emission (AE) method. The partial discharge inception voltage (PDIV) and phase-resolved partial discharge (PRPD) spectrum of defects measured by these three methods are recorded in the experiments. The experimental results show that the UHF method is effective for the detection of the three defects. The HFCT method is sensitive to floating defects but not to void and surface defects. Discharge signals of these two defects can be detected by HFCT when the discharge amplitude is large. The AE method can detect floating defects effectively but cannot detect void defects and surface defects.
Introduction
Gas insulation equipment includes gas-insulated switchgear (GIS) and gas-insulated transmission lines (GIL). With the development of power systems, gas insulation equipment is widely used owing to its advantages of small footprint, large transmission capacity, and high reliability (Metwally, 2004; Koch et al., 2018; Li et al., 2018). During the production, transportation, and installation of gas insulation equipment, various defects may form in the equipment. Common insulation defects include floating defects, void defects, surface defects, and tip defects (Stone, 2005; Ueta et al., 2012). The presence of these defects leads to distortion of the internal electric field of the equipment. When the electric field strength reaches the breakdown field strength, partial discharge (PD) occurs. With the development of PD, the insulation of equipment deteriorates. Therefore, timely and effective detection of insulation defects PD is important to ensure the safe and reliable operation of equipment.
The commonly used PD detection methods are the ultra-high frequency (UHF) method, high-frequency current (HFCT) method, and acoustic emission (AE) (Ilkhechi and Samimi, 2021; Jiang et al., 2021a; Jiang et al., 2021b; Zhang et al., 2014). The PD signal characteristics and propagation paths of various defects are different, so there are differences in the detection sensitivity of different detection methods for defects. Witos and Gacek (2008) used the pulsed current method and AE method to detect PD signal, and the research results showed that the defect scale had a great influence on the response speed of different detection methods. Chen et al. (2015) studied the applicability of the AE method and UHF method for different defect detection and compared the advantages and disadvantages of the two methods. Yang et al. (2016) compared the sensitivity of the UHF method and HFCT method and obtained the time-frequency characteristics of defect discharge signals measured by these two methods. Alvarez et al. (2015) proposed an optimized electromagnetic detection method, which combined wideband PD sensors to measure HF and UHF frequency bands, and built an experimental platform by combining GIS and cable to verify the feasibility of the method. Previous studies have mainly focused on the comparison between the UHF method and any other method but have not compared the sensitivity of the high-frequency current method and ultrasonic method for defect detection.
Meanwhile, for GIL with long distances, built-in sensors may not be reserved during the design to avoid insulation gas leakage (Xu et al., 2016; Liu et al., 2020), which limits the use of some PD detection methods. Therefore, it is necessary to use multiple detection methods to detect insulation defects to ensure the safety and reliability of equipment and to compare the sensitivity of various detection methods to provide a basis for the selection of detection methods and the optimal design of sensors.
In this study, the insulation defects of floating defects, void defects, and surface defects were set in the PD simulation device. The signals of PD were detected using the UHF method, HFCT method, and AE method. The partial discharge inception voltage (PDIV) of each defect and phase-resolved partial discharge (PRPD) spectrum measured by the three detection methods were recorded, and the effectiveness of the three detection methods for insulation defect detection was compared.
Experimental setup
According to IEC 60270, the experimental circuit shown in Figure 1 is composed of a regulating transformer, an isolated transformer and a non-local discharge transformer. The maximum experimental voltage can be increased to 160 kV. Ck is a coupling capacitance of 50 pF, and R is a detection impedance of 50 Ω. UHF, HFCT, and AE sensors are connected to a PD detector to monitor PD signals. The type of PD detector used in the experiment is MERK EC4000P. A wireless phase synchronizer is used to ensure that the phase of the PD detector is in phase with the applied voltage. Figure 2 shows the structure of the PD simulation device, where the defect models are installed in positions 5–8. The PD of the defect can be simulated by lowering the defect model before the experiment.
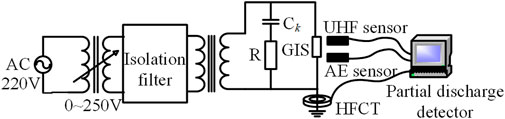
FIGURE 1. PD measuring circuit.
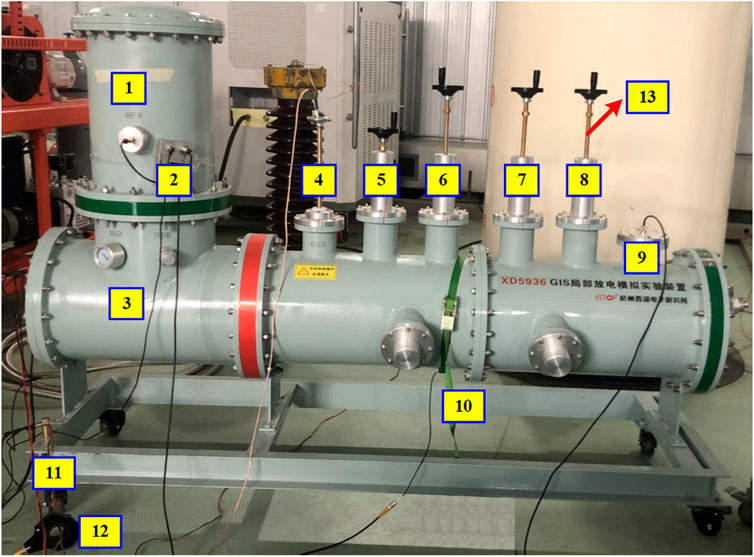
FIGURE 2. Structure of the partial discharge simulation device.
Figure 2 shows the structure of the PD simulation device: 1—coupling capacitance; 2—coupling capacitance; 3—non-partial discharge transformer; 4—pulse check lever; 5–8 defect models; 9—built-in UHF sensor; 10—AE sensor; 11—ground point; 12—HFCT sensor; 13—model lifting lever.
Figure 3 shows the images of the insulation defect model. Figure 3A shows the model of floating defect, which consists of three parts: the upper and lower metal columns and the middle epoxy support column, where the lower metal column is divided into two parts, part a and part b. Since part a and part b are connected by screws, poor contact occurs, and a floating potential is formed. Figure 3B shows the model of void discharge, which simulates an air gap by creating a circular cavity in an insulating material. The model is composed of three parts: the upper and lower metal columns and the middle epoxy column. The insulating cylinder is 57 mm high and 24 mm in diameter, and the circular cavity in the middle is a ball with a radius of 1 mm. Figure 3C is the model of surface discharge. The model is composed of three parts: the upper and lower metal columns and the middle main body, which consists of two layers of thin umbrella-like materials and an epoxy column in the middle. Due to the weak insulation between the upper and lower layers of thin umbrella-like materials, creepage charges are formed between them to simulate surface discharge. The umbrella plate is 1 mm high and 60 mm in diameter, and the epoxy column is 5 mm high and 40 mm in diameter.
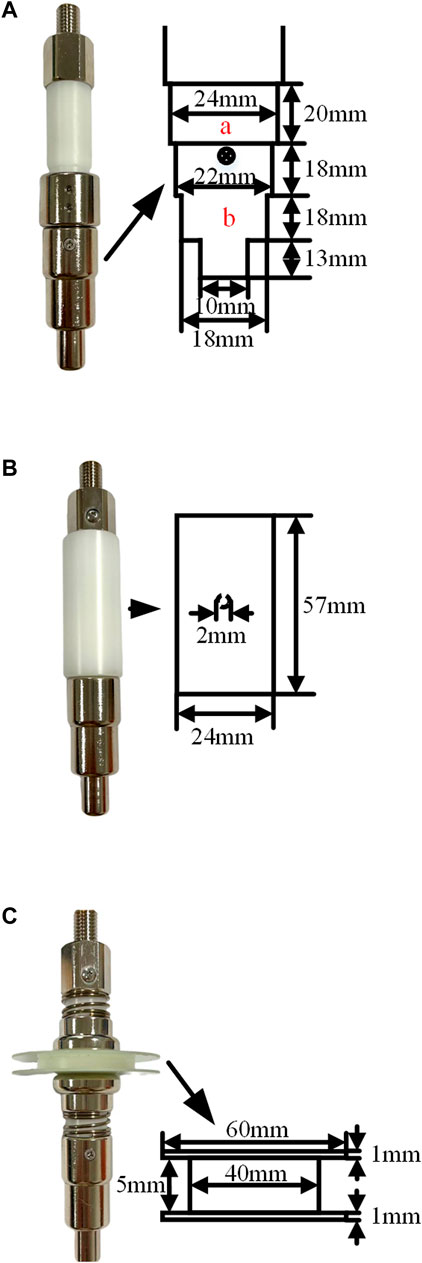
FIGURE 3. Images of insulation defect model: (A) suspension defect, (B) void defect, and (C) surface defect.
During the experiment, SF6 pressure in the PD simulation was maintained at 0.4 MPa. The voltage was gradually increased until the model began to discharge, and the discharge signal was recorded using the PD detector. The pattern recorded by the PD detector was the accumulated discharge signal over 10 s. Each experiment was repeated ten times.
Experimental results and discussions
Floating discharge
The PDIV of floating discharge is 36.17 kV. Figures 4–6 show the UHF, HFCT, and AE signals of the floating discharge at the PDIV. As can be seen from Figures 4A,B, the UHF discharge signals are distributed at 0°–90° and 180°–270°, with an amplitude of about 1 dBm. The maximum number of discharges is 79 times, which occurred on the positive half cycle. The PRPD pattern of the HFCT method and the number of discharges are shown in Figures 5A,B. It is clear that the discharge signals can be detected throughout 0°–90° and 270°–360°, with an apparent charge of about 1,200 pC. However, the maximum number of discharges measured by HFCT is only 15 times. From Figures 6A,B, in periodic mode, two clusters of signals can be seen in one power frequency cycle. In continuous mode, the effective value is 1.292 mV, the peak value is 35.481 mV, the 50 Hz component is 0.013 mV, and the 100 Hz component is 0.019 mV. The 100 Hz component is larger than the 50 Hz component.
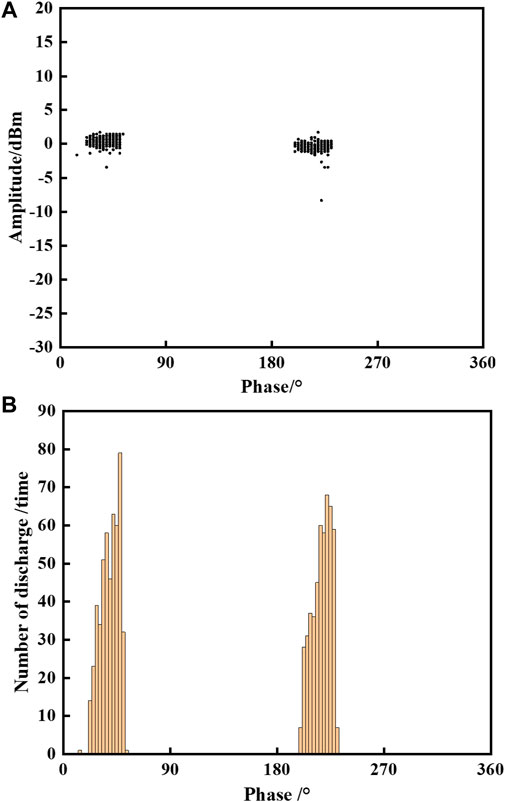
FIGURE 4. UHF signals of suspension discharge at 36.17 kV. (A) PRPD pattern. (B) φ − n.
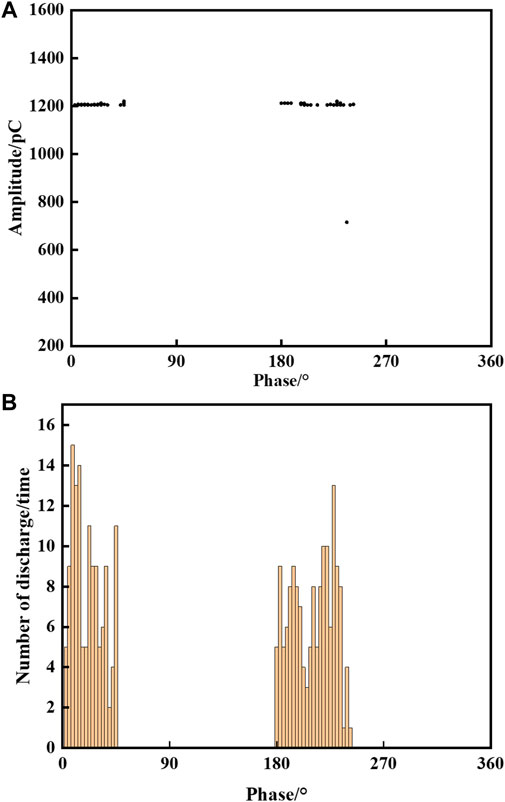
FIGURE 5. HFCT signals of suspension discharge at 36.17 kV. (A) PRPD pattern. (B) φ − n.
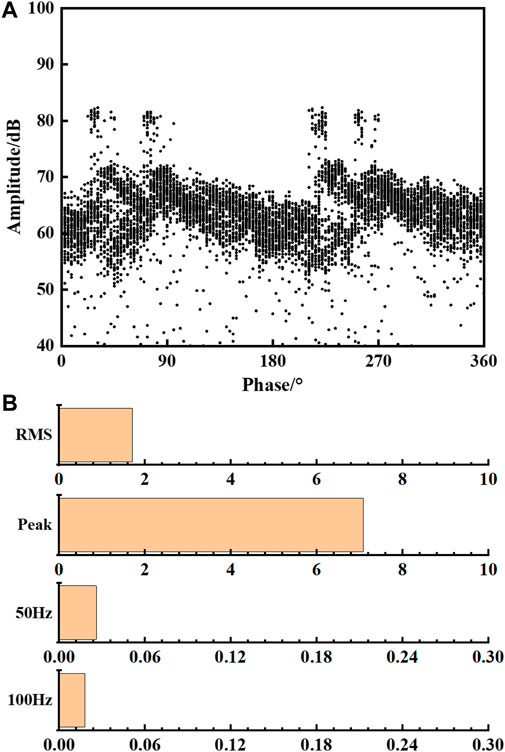
FIGURE 6. AE signals of suspension discharge at 36.17 kV. (A) Periodic mode. (B) Continuous mode.
Void discharge
As shown in Figures 7A,B, the PDIV of void discharge is 8.82 kV, and the UHF method can detect the PD signal. At this voltage, the HFCT and AE sensors cannot detect the discharge signals. The PRPD pattern of the UHF method looks like two rabbit ears, and the discharge is mainly concentrated at the peak of positive and negative half cycles. The discharge amplitude of the positive half cycle is larger than that of the negative half cycle. The positive half-cycle discharge amplitude is concentrated below −37.5 dBm, while the negative half-cycle discharge amplitude is concentrated below −55 dBm. The discharge frequency of the positive half cycle is also higher than that of the negative half cycle. As seen in Figures 8A,B, when the voltage rises to 15.24 kV, the PD can also be measured by the HFCT method. The PRPD pattern of the HFCT method is very similar to that of UHF. Discharge signals are present in both positive and negative half cycles. Discharge is large and intensive in the positive half cycle, while it is small and sparse in the negative half cycle. The maximum apparent charge was 182 pC, which occurred in the positive half cycle. The discharge times measured by HFCT are much less than those measured by UHF, and its maximum times reached only 17 times. No PD signal was detected by the AE method during the experiment.
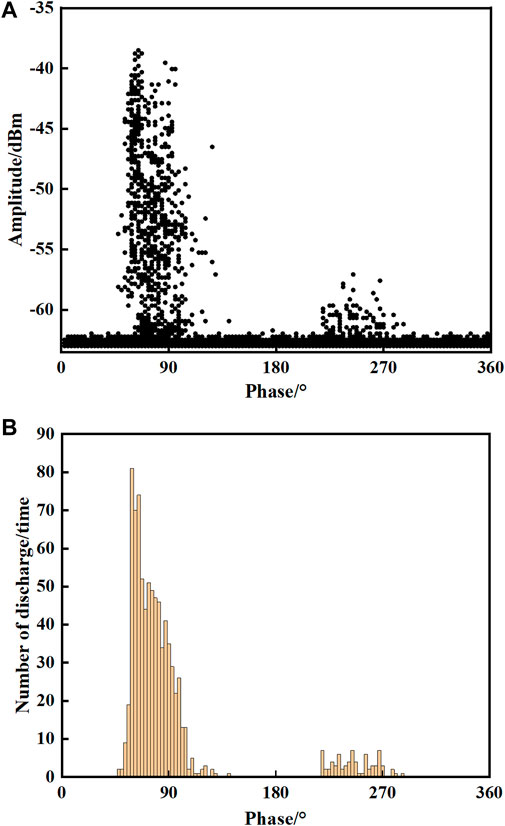
FIGURE 7. UHF signals of void discharge at 8.82 kV. (A) PRPD pattern. (B) φ − n.
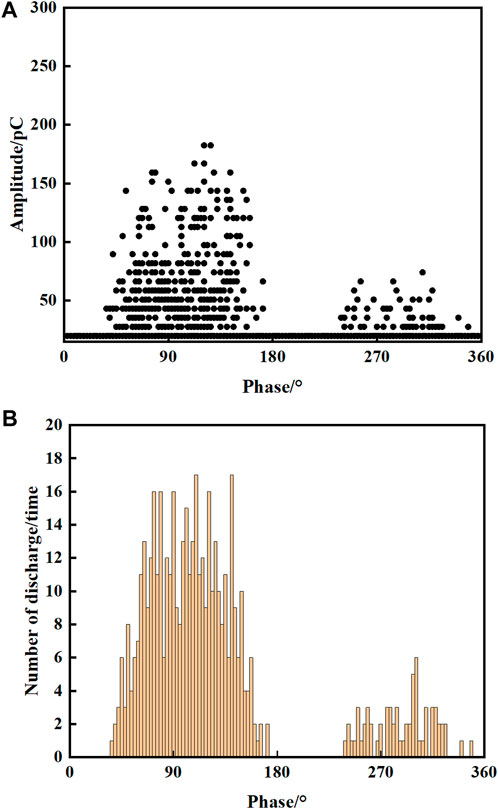
FIGURE 8. HFCT signals of void discharge at 15.24 kV. (A) PRPD pattern. (B) φ − n.
Surface discharge
As shown in Figures 9A,B, the UHF method can detect the PD signal at the inception voltage of PD of 45.7 kV, and the other two detection methods cannot detect the PD signal at this voltage. The PRPD pattern of the UHF method looks like two hills, and the discharge phase is symmetrical in the positive and negative half cycles. The amplitude of UHF signals is from −60 dBm to −45 dBm. The discharge frequency distribution in the positive and negative half cycles is basically the same, but the number of discharges in the positive half cycle is more than that in the negative half-cycle, up to 500 times. HFCT method can detect PD at 50.25 kV. Figures 10A,B show the PRPD pattern and number of discharges at the voltage, respectively. The patterns of the positive and negative half cycles are similar, and the discharges are also concentrated at 0°–90° and 180°–270°. The discharges of the positive and negative half cycles are sparse on both sides and dense in the middle. The discharge time measured by the HFCT method is smaller than that measured by the UHF method, and the maximum discharge times are about 70 times. The AE method cannot detect surface discharge signals.
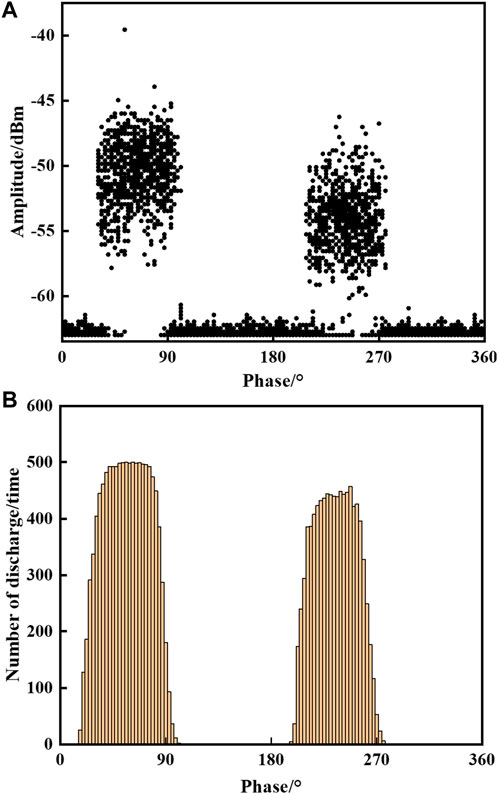
FIGURE 9. UHF signals of surface discharge at 45.7 kV. (A) PRPD pattern. (B) φ − n.
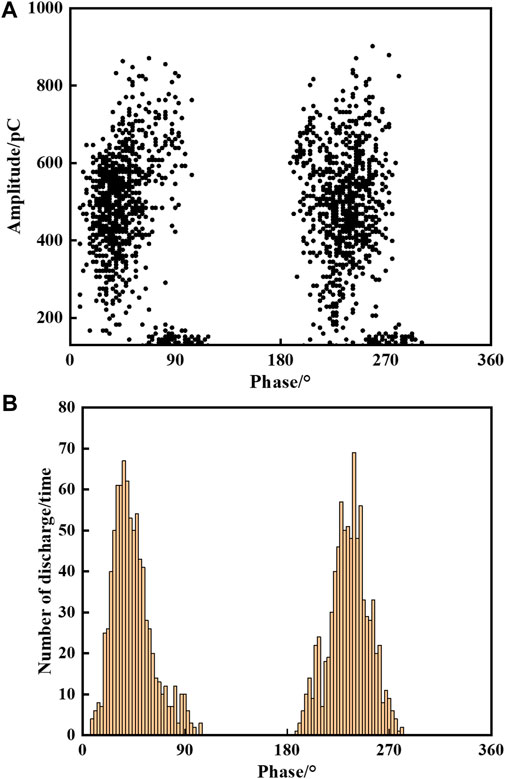
FIGURE 10. HFCT signals of surface discharge at 50.25 kV. (A) PRPD pattern. (B) φ − n.
Discussions
The UHF method is effective for the detection of these three kinds of defects, and the PD signals can be detected at the PDIV of the defect model. It is due to the PD simulation platform used being a linear unit and the electromagnetic wave signal having very little energy attenuation when propagating in a coaxial waveguide (Liu et al., 2010; Li et al., 2014).
The HFCT method can also detect PD signals of the three kinds of defects, but for the void defect and surface defect with small initial discharge, the HFCT method is less effective than the UHF method. When the HFCT sensor and the connection of the test system are unchanged, the output voltage of the HFCT sensor is related to the current flowing through the ground wire, which mainly depends on the defect discharge intensity (Tang et al., 2018). From the experimental results, it can be found that when the UHF signal reaches a certain intensity, that is, when the discharge energy reaches a certain intensity, can measure the discharge signal of the defect can be measured by the HFCT method. Floating discharge is a capacitive discharge. Once the discharge starts, the UHF amplitude is close to 1 dBm, and the discharge intensity is very high. Therefore, the HFCT method has a high sensitivity for floating discharge detection. Similarly, when the voltage is increased and the void and surface discharges reach a certain intensity, the HFCT method can also detect the discharge signals of both types of defects. The rule that the detection sensitivity of the HFCT method mainly depends on the discharge intensity may be applicable to GIS; however, for GIL with a long distance, there may be a certain attenuation of high-frequency current during propagation, which is the direction of future research.
The AE method is effective for floating defects, but it is not sensitive to the detection of void and surface defects. The detection sensitivity of the AE method is related to the attenuation and defect discharge intensity during ultrasonic propagation (Lundgaard et al., 1990; Lundgaard et al., 1992). The acoustic absorption rates of epoxy resin and SF6 are 100 dB/m and 26 dB/m (Lundgaard et al., 1990; Lundgaard et al., 1992). Floating defects belong to capacitive discharge with high initial discharge intensity. Even if the ultrasonic signal generated by the defect discharge passes through SF6, it can still be received by the ultrasonic sensor through the outer casing. Therefore, the AE method can detect the initial discharge of the floating discharge signal. However, the ultrasonic signal of the void defect discharge is difficult to be received through the casing after being absorbed and attenuated by epoxy resin and SF6. Similarly, even if the voltage increases and the surface discharge increases, the generated ultrasonic signal is still difficult to detect after passing through the SF6. Therefore, the AE method is not sensitive to void and surface defects.
Although the UHF method can effectively detect various defects in the experiment, field experience shows that the UHF method has a problem of misjudgment. Therefore, the HFCT method and AE method can be combined with the UHF method to effectively detect defects in the field. Once the UHF signal is detected, the measured UHF spectrum is first compared with the typical spectrum to preliminarily determine the defect type. Then, the shape of HFCT and AE spectrums are observed to determine if they were consistent with the previously determined defect, and finally, the defect type is determined. At the same time, interference needs to be excluded during field inspection.
Conclusion
In this study, the PD signals of floating defect, void defect, and surface defect were detected using the UHF method, HFCT method, and AE method in the PD simulation device. The PDIV and patterns measured by the three different PD detection methods were recorded in the experiment. The results show that the UHF method has high detection sensitivity for three kinds of defects. The HFCT method is sensitive to floating defects but not to void defects and surface defects. The AE method is effective for the detection of floating defects but cannot detect the signals of the other two defects.
Data availability statement
The original contributions presented in the study are included in the article/supplementary material; further inquiries can be directed to the corresponding author.
Author contributions
FK, KZ, JM, and CZ are responsible for methodology and writing—original draft. HL, SG, and JL are responsible for obtaining the experimental data and data curation. TZ is responsible for review and editing. All authors agree to be accountable for the content of the work.
Conflict of interest
Authors KZ, JM, TZ, HL, SG, and JL were employed by State Grid Jiangsu Electric Power Research Institute.
The remaining authors declare that the research was conducted in the absence of any commercial or financial relationships that could be construed as a potential conflict of interest.
The authors declare that this study received funding from the Science and Technology Program of the State Grid Jiangsu Electric Power Company under Grant J2021049. The funder had the following involvement in the study: methodology and writing—original draft. Obtaining the experimental data and data curation and review and editing.
Publisher’s note
All claims expressed in this article are solely those of the authors and do not necessarily represent those of their affiliated organizations, or those of the publisher, the editors, and the reviewers. Any product that may be evaluated in this article, or claim that may be made by its manufacturer, is not guaranteed or endorsed by the publisher.
References
Alvarez, F., Garnacho, F., Ortego, J., and Sanchez-Uran, M. A. (2015). Application of HFCT and UHF sensors in on-line partial discharge measurements for insulation diagnosis of high voltage equipment. Sensors (Basel) 15, 7360–7387. doi:10.3390/s150407360
Chen, M., Chen, J., Liu, C., and Lu, J. (2015). Applicability research with field applications on ultrasonic and UHF partial discharge detection methods for GIS. High. Volt. Appar. 51, 186–191. doi:10.13296/j.1001-1609.hva.2015.08.031Yang
Ilkhechi, H. D., and Samimi, M. H. (2021). Applications of the acoustic method in partial discharge measurement: A review. IEEE Trans. Dielectr. Electr. Insul. 28 (1), 42–51. doi:10.1109/tdei.2020.008985
Jiang, J., Chen, J., Li, J., Yang, X., Albarracin-Sanchez, R., Ranjan, P., et al. (2021a). Propagation and localisation of partial discharge in transformer bushing based on ultra-high frequency technique. High. Volt. 6 (4), 684–692. doi:10.1049/hve2.12075
Jiang, J., Chen, J., Li, J., Yang, X., Bie, Y., Ranjan, P., et al. (2021b). Partial discharge detection and diagnosis of transformer bushing based on UHF method. IEEE Sens. J. 21 (15), 16798–16806. doi:10.1109/jsen.2021.3066809
Koch, H., Goll, F., Magier, T., and Juhre, K. (2018). Technical aspects of gas insulated transmission lines and application of new insulating gases. IEEE Trans. Dielectr. Electr. Insul. 25 (4), 1448–1453. doi:10.1109/tdei.2018.007311
Li, T., Wang, X., Zheng, C., Liu, D., and Rong, M. (2014). Investigation on the placement effect of UHF sensor and propagation characteristics of PD-induced electromagnetic wave in GIS based on FDTD method. IEEE Trans. Dielectr. Electr. Insul. 21 (3), 1015–1025. doi:10.1109/tdei.2014.6832244
Li, X., Zhao, H., and Murphy, A. B. (2018). SF6-alternative gases for application in gas-insulated switchgear. J. Phys. D. Appl. Phys. 51 (15), 153001. doi:10.1088/1361-6463/aab314
Liu, J., Xu, M., Huang, C., Guo, C., Yao, L., and Jiang, X. (2010). Investigation on the attenuation characteristics of electromagnetic waves in GIS. Trans. China Electrotech. Soc. 25 (8), 52–58. doi:10.19595/j.cnki.1000-6753.tces.2010.08.009
Liu, Z., Wang, C., Lu, S., Sun, G., Wang, N., Li, P., et al. (2020). Key technical parameters of UHV GIL in sutong utility tunnel project. Power Syst. Technol. 44 (6), 2377–2385. doi:10.13335/j.1000-3673.pst.2019.2717
Lundgaard, L. E., Runde, M., and Skyberg, B. (1990). Acoustic diagnosis of gas insulated substations - a theoretical and experimental basis. IEEE Trans. Power Deliv. 5 (4), 1751–1759. doi:10.1109/61.103670
Lundgaard, L. E., Tangen, G., Skyberg, B., and Faugstad, K. (1992). Acoustic diagnoses of GIS - field experience and development of expert system. IEEE Trans. Power Deliv. 7 (1), 287–294. doi:10.1109/61.108920
Metwally, I. A. (2004). Status review on partial discharge measurement techniques in gas-insulated switchgear/lines. Electr. Power Syst. Res. 69 (1), 25–36. doi:10.1016/j.epsr.2003.07.006
Stone, G. C. (2005). Partial discharge diagnostics and electrical equipment insulation condition assessment. IEEE Trans. Dielectr. Electr. Insul. 12 (5), 891–903. doi:10.1109/tdei.2005.1522184
Tang, Z., Jiang, T., Zhang, L., Liu, C., and Wang, Q. (2018). Study on the detection sensitivity of high-frequency current method to capacitor partial discharge. High. Volt. Appar. 54 (6), 9–15. doi:10.13296/j.1001-1609.hva.2018.06.002
Ueta, G., Wada, J., Okabe, S., Miyashita, M., Nishida, C., and Kamei, M. (2012). Insulation performance of three types of micro-defects in inner epoxy insulators. IEEE Trans. Dielectr. Electr. Insul. 19 (3), 947–954. doi:10.1109/tdei.2012.6215098
Witos, F., and Gacek, Z. (2008). Application of the joint electro-acoustic method for partial discharge investigations within a power transformer. Eur. Phys. J. Spec. Top. 154, 239–247. doi:10.1140/epjst/e2008-00553-x
Xu, Y., Liu, W., Gao, W., Zhang, X., and Wang, Y. (2016). Comparison of PD detection methods for power transformers - their sensitivity and characteristics in time and frequency domain. Ieee Trans. Dielectr. Electr. Insulation 23, 2925–2932. doi:10.1109/tdei.2016.005728
Keywords: partial discharge detection, gas-insulated equipment, insulation defects, UHF method, HFCT method, AE method
Citation: Kong F, Zhao K, Ma J, Zhuang T, Li H, Gao S, Liu J and Zhang C (2022) Multiple detections of insulation defects partial discharge in gas-insulated equipment. Front. Energy Res. 10:937599. doi: 10.3389/fenrg.2022.937599
Received: 06 May 2022; Accepted: 17 August 2022;
Published: 13 September 2022.
Edited by:
Yiyi Zhang, Guangxi University, ChinaCopyright © 2022 Kong, Zhao, Ma, Zhuang, Li, Gao, Liu and Zhang. This is an open-access article distributed under the terms of the Creative Commons Attribution License (CC BY). The use, distribution or reproduction in other forums is permitted, provided the original author(s) and the copyright owner(s) are credited and that the original publication in this journal is cited, in accordance with accepted academic practice. No use, distribution or reproduction is permitted which does not comply with these terms.
*Correspondence: Fanjun Kong, 736698414@qq.com