Optimal Dispatching of Ladder-Type Carbon Trading in Integrated Energy System With Advanced Adiabatic Compressed Air Energy Storage
 Xia Wang
 Xin A2,3
  Qiwei Jia
 Linrui Ma
 Shengwei Mei
- 1Qinghai Key Lab of Efficient Utilization of Clean Energy (New Energy Photovoltaic Industry Research Center), Qinghai University, Xining, China
- 2Qinghai Building and Materials Research Co., Ltd., Xining, China
- 3The Key Lab of Plateau Building and Eco-Community in Qinghai, Xining, China
Advanced adiabatic compressed air energy storage (AA-CAES) is a promising form of CAES technology, which can realize multi-energy cascade storage and supply. Given the characteristics of cooling, heating, and power (CHP) load demand of regionally integrated energy system (IES) and the overall need to control the total carbon emission, this study first establishes the AA-CAES multi-energy storage model; second, based on analyzing the multi-energy characteristics of AA-CAES, a ladder-type carbon trading mechanism is introduced; furthermore, aiming for minimal system operating costs and carbon trading costs, an optimal dispatch model of an integrated energy system with AA-CAES as the energy hub for coupling multiple energy forms is established. Finally, an empirical study was conducted based on the energy use scenario of a provincial and ministerial university in Qinghai Province. This study analyzes the impact of the operation of AA-CAES and the introduction of ladder-type carbon trading on the operating costs and carbon trading costs of IES. The simulation results show that the total operating cost of the proposed model is reduced by 23.9%, and carbon emission is decreased by 14.5% compared to the conventional IES. It proves the validity of coupling AA-CAES and stepped carbon trading mechanisms to facilitate low-carbon economy in IES.
1 Introduction
Along with the fast development of our society, the energy demand is also increasing. How to use energy efficiently and promote green and low-carbon economic development is an urgent problem. Therefore, China has committed to “achieve peak carbon emissions by 2030 and carbon neutrality by 2060” (Xiao et al., 2021). The integrated energy system (IES) which is formed by the coupling and interconnection of multiple energy sources provides a solution for efficient energy use and reduction of carbon emissions. In addition, it is crucial to adjust the energy structure and promote energy transition by using clean and sustainable energy to meet multiple load needs, such as electricity, heat, cooling, and gas (Gu et al., 2014). However, the design and planning of an IES and its operating characteristics are more complex than single-energy systems, in which the subsystems need to be coupled and operated in concert with each other. As a result, among the most important study subjects in recent years have been the modeling and optimal dispatching of IES.
The coupling relationship between multiple energy demands and the uncertainty of renewable energy sources makes the energy management of IES very difficult. Therefore, optimal scheduling of IES to improve the energy utilization efficiency and reduce operating costs is necessary (Huang et al., 2022). Li G. et al. (2016) used a mixed-integer linear programming (MILP) model to optimize the dispatch of IES with the objective of minimizing operating costs, which reduced operating costs and increased the utilization of renewable energy sources. Zheng et al. (2020) established an optimal day-ahead dispatch model and used mixed-integer quadratic programming (MIQP) to solve the scheduling difficulties for IES systems caused by the intermittent nature of wind power, photovoltaic (PV), and other energy sources. Ding et al. (2021) suggested a two-stage optimal dispatch model on the user side that can guarantee the possibility of energy balance events to the maximum and improve the system economy compared to the conventional system. Chen et al. (Wang et al., 2016) used particle swarm algorithms in solving capacity allocation issues of multi-energy systems to increase the reliability of energy supply and also the amount of renewable energy integration. For the optimal scheduling of IES with multiple energy carriers, Wang et al. (Lingmin et al., 2020) proposed a robust optimal dispatch method with uncertainty expansion operations introduced in the dispatch process to decrease the total operation cost. However, most of the aforementioned studies focus on the optimization improvement of the IES system scheduling method, and the introduction of energy storage devices offers a new solution to solve the aforementioned problems.
Energy storage devices are involved in the management of optimal energy in IES systems, and the current research is mainly focused on chemical energy storage methods such as battery energy storage and hydrogen storage. In the studies by Zheng et al. (2015) and Sanjari and Karami (2020), the optimal dispatching method on the strength of model predictive control (MPC) and the optimal battery storage and energy release condition scheduling strategy grounded on the prediction error are proposed for the IES containing battery energy storage, which in turn optimizes the energy scheduling of the IES. In the studies by Wang et al. (2020) and Wang et al. (2021), low-carbon IES architecture with hydrogen energy storage as an energy hub was studied to verify the feasibility of two-stage optimization and low-carbon dispatch. However, compared with the energy storage methods mentioned earlier, the advantages of AA-CAES with long service life, low operating cost, and multi-energy co-sourcing (Zhang et al., 2021) can better meet the demand for IES.
The AA-CAES adds a heat storage device to the conventional CAES. It uses the heat generated in the compression stage to heat the compressed air that needs to be used for power generation. Therefore, the combustion heat generation from the make-up combustion system is removed, and carbon emissions from fossil fuel combustion are avoided (Li R. et al., 2016). A great deal of research has been carried out on the working principle, model building, and thermodynamic simulation of AA-CAES. Grazzini and Milazzo (2008) designed a combined AA-CAES scheme and proposed the operation of AA-CAES combined with renewable energy. Guo et al. (2017) established a thermodynamic model of A-CAES in MATLAB Simulink and studied the effect of time-varying temperature and air pressure on the system. Li et al. (2021) proposed a model of a cogeneration system coupled with AA-CAES and solar auxiliary heat and studied the optimal heat distribution programs with economics as the goal. Arabkoohsar et al. (2017) established a mathematical model of low-temperature AA-CAES and performed an economic analysis. Luo et al. (2016) carried out work on the optimization of key parameters and system structure in AA-CAES to improve the system efficiency. The aforementioned literature mainly focused on the study of mechanism design, parameter optimization, and system modeling of AA-CAES; however, the study of optimal scheduling of AA-CAES involved in the IES system was less. Yang et al. (2021) constructed an IES optimization dispatch model with non-supplementary combustion CAES and integrated heating and electric demand response to enhance the economy and flexibility of IES. The dispatch strategy of the non-supplementary combustion CAES participation in IES was considered in Yang et al. (2021), but the strategy is mainly proposed to improve the system economy.
The energy industry is an important force for saving energy and decreasing emissions, so it is essential to research the reduction of carbon emissions in energy systems. The carbon trading mechanism is a measure to cut down greenhouse gas emissions economically and effectively (Tan et al., 2022). There has been some research on modeling carbon trading mechanisms and the emission reduction effect on the multi-energy combined supply system. Zhang and Zhang (2020) developed a carbon trading model for the Chinese power industry, which verified the effectiveness of carbon trading in reducing pollution emissions. Zhang et al. (2016) introduced carbon trading to the smart grid to take full advantage of demand-side resources and analyzed the effects of the carbon trading price transmission mechanism. In the IES area, Lu et al. (2021) introduced a carbon trading mechanism into a community-integrated energy service system. The model considered rewards and penalties for both supply and demand, thus improving the carbon trading mechanism and reducing the operating costs of the system. Wei et al. (2016) proposed an economic operation strategy of an electricity–gas interconnection IES under a carbon trading mechanism. The influence of the carbon trading mechanism on carbon emissions and system generation costs is analyzed. Qu et al. (2018a) proposed a novel type of large-scale IES for distributed optimal multiple power flows and introduced a carbon trading mechanism. The aforementioned studies show that the carbon trading mechanism has a major role to play in reducing carbon emissions and improving environmental friendliness. However, they have only considered the situation of conventional carbon trading. The ladder-type carbon trading partitions carbon emissions in different intervals on the traditional carbon trading mechanism and calibrates different trading prices according to the size of carbon emissions, which allows for a better balance between economic and environmental aspects of the system (Wang et al., 2022). To achieve the reduction of IES carbon emissions, this study introduces the ladder-type carbon trading mechanism in the dispatch of the IES.
From the aforementioned analysis, it can be seen that there are fewer studies on AA-CAES participation in IES dispatching. In addition, the dispatch strategy of CAES participation in IES proposed in the current study is less than adequate for the environmental friendliness of the system. However, a major current focus in IES optimization dispatching is how to reduce carbon emissions. The ladder-type carbon trading mechanism is an approach that is valid for decreasing carbon emissions in IES. For the purpose of balancing the economy and environmental friendliness of IES, this study proposes an optimal dispatch structure and model for the IES considering AA-CAES and the ladder-type carbon trading mechanism and obtains the dispatch results for different scenarios. The main contributions of this study can be summarized as follows:
1) The IES optimal dispatching model with AA-CAES, which considers the ladder-type carbon trading mechanism, is established for the characteristics of CHP demand in the IES of the campus and the overall goal of low-carbon development.
2) AA-CAES serves as the energy hub of the IES and optimally distributes and converts the multi-energy sources generated by the energy units to meet each load demand at the lowest economic cost. The analysis of the AA-CAES charging and discharging process can reflect its ability to accommodate clean energy and low valley power.
3) A ladder-type carbon trading mechanism is introduced in IES to explore the impact on the proportion of grid output and gas equipment output in the system, and the varying carbon emission of each component is analyzed. We proposed the objective function based on environmental and economic indicators, which makes the optimization results closer to the actual scenario.
4) Three different application scenarios were constructed, and the results of each scenario scheduling were analyzed and compared. The effectiveness of AA-CAES and the ladder-type carbon trading mechanism in improving the economy and environmental friendliness of IES is verified.
The remainder of the article’s structure is organized as follows. Section 2 focuses on the architecture and working mechanism of the IES with AA-CAES and shows the mathematical modeling of each subsystem of AA-CAES. Section 3 describes the operation principle of ladder-type carbon trading and establishes its mathematical calculation model. Section 4 presents the optimal dispatching model for the IES, which contains the objective function and various constraints. Section 5 presented the case study and analysis of the results. The overall conclusion is given in Section 6.
2 Structure of the IES With AA-CAES
The campus IES architecture configured with AA-CAES proposed in this study is shown in Figure 1. It is obtained by expanding on the conventional park IES. The conventional park IES contains clean energy generation equipment, for instance, distributed PV power and wind power, as well as energy conversion equipment such as gas turbines (GTs), gas boilers (GBs), waste heat boilers (WHBs), electric refrigerators (ERs), and adsorption refrigerators (ARs). This study introduces AA-CAES into the conventional IES to build a low-carbon campus IES with AA-CAES as the energy hub for combined storage and supply of CHP. In Figure 1, the electrical load demand of the IES is mainly met by the grid, GT, wind farm, and PV. The heating load of the system is mainly provided by the GB burning gas and the WHB recovering the high-temperature flue gas discharged from the GT. The ER and AR convert the electric and thermal energy of the system into cold energy to meet the cooling load of the IES, respectively. As the energy hub, AA-CAES can interact with multiple energy sources in the system, and its combined storage and supply feature assists other equipment to meet the CHP loads of the IES. In a conventional IES, the electricity demand is mainly met by the electricity generation of the GT and the supply of the electricity grid, and the ability to consume clean energy such as solar energy and wind energy is relatively limited. Introducing AA-CAES into IES can strengthen the integration of multiple energy sources, increase the efficiency of using renewable energy, reduce wind curtailment, and lower system operating costs.
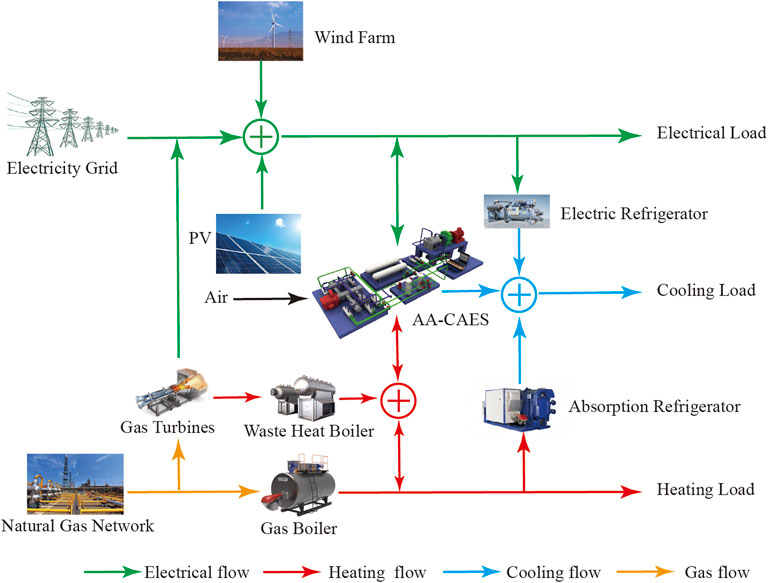
FIGURE 1. Design framework of the IES with the AA-CAES structure.
In conventional IES, the random nature of PV, wind power, and other clean energy leads to low efficiency of being consumed. When the system load demand is high, the cost of external power and gas purchases will increase while increasing the larger carbon emission. The structure of AA-CAES is shown in Figure 2; when storing energy, the system uses wind curtailment, solar curtailment, and low valley electricity to drive the compressor, and the heat energy generated in the process of compressing air is recovered through a thermal storage system, while the gas storage subsystem stores the potential energy of compressed air; when releasing energy, the high-pressure air in the storage reservoir passes through the expansion subsystem to release the pressure potential energy and thermal energy of compressed air, while the exhaust process of the turbo-generator can also provide part of the cold energy for the demand of electric, thermal, and cold loads in the IES (Mei et al., 2018). Therefore, AA-CAES can use clean energy and low valley electricity to achieve “peak shaving and valley filling” of the electric load. Therefore, AA-CAES can reduce the uncertainty of clean energy, reduce IES operating costs, and improve the comprehensive utilization efficiency of the power grid. The ability of AA-CAES multi-energy joint storage and supply can reduce the external demand for electricity and gas purchase in the IES and improve the environmental protection and economy of the system.
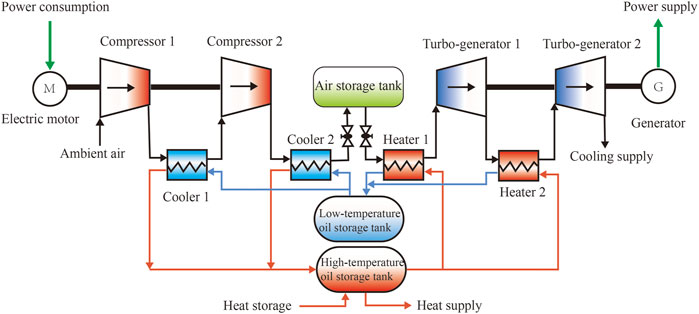
FIGURE 2. AA-CAES structural diagram.
In summary, the IES with AA-CAES proposed in this study, GT, GB, and WHB are mainly responsible for providing heating and electrical energy. The ER and AR are mainly responsible for providing the cooling energy required by the system, and the AA-CAES consisting of compressors, turbo-generators, and other equipment is used as the multi-energy storage and supply center of the IES.
2.1 AA-CAES Formulation
The AA-CAES used in this study is shown in Figure 2, which adopts the design method of “two-stage expansion, inter-stage heat transfer” and “two-stage expansion, inter-stage cooling.” The energy conversion part of the system mainly consists of the compression subsystem, heat circulation system, and expansion subsystem. In modeling AA-CAES, the following assumptions are required:
1) High-pressure air is an ideal gas and satisfies the ideal gas equation.
2) Excluding heat and pressure losses in the heat storage tank and piping.
3) Neglect the effect of phase change of the fluid.
2.1.1 Compression System
When the AA-CAES device is in the state of energy storage, the compressor compresses the air by consuming electrical energy, which is converted into potential and thermal energy of the high-pressure air, and its operating model is as follows (Mei et al., 2015):
where
According to the isentropic efficiency calculation, the temperature relationship between the outlet and inlet of the nth stage compressor can be depicted by the following (Dielmann and van der Velden, 2003; Hwang et al., 2012; Mei et al., 2015):
where
2.1.2 Heat Circulation System
The heat energy generated by the compressor is stored in the heat transfer oil through the heat exchanger in the energy storage process. The heat energy generated by the compressor is stored in the heat storage mass through a heat exchanger during the energy storage process. At present, the commonly used heat storage medium mainly includes water, heat transfer oil, and molten salt. Under standard conditions, the boiling point of water is 100°C, and the boiling point of the plateau environment in Qinghai Province is even lower, and the high temperature air discharged from the compressor will make the water vaporize. The molten salt has a high freezing point, so if the temperature is low, it will easily solidify in the pipeline and lead to blockage. Compared with the aforementioned two heat storage mediums, heat transfer oil has a larger heat capacity and is basically in the liquid state, so this study chooses heat transfer oil as the heat storage medium. During the nth stage of compression, the high-grade heat in the air discharged from the nth compressor is absorbed by the nth heat exchanger, and the air temperature is reduced and then enters the (n+1)th stage compressor. According to the heat transfer theory (Dielmann and van der Velden, 2003; Hwang et al., 2012; Budt et al., 2016), the heat energy recovered by the heat exchanger after the nth stage compressor in period t is described by the following:
where
Therefore, the sum of the total thermal energy of each cooler in the whole energy storage process at time t is illustrated as follows:
where
In the energy release process, the expansion process of AA-CAES is similar to the compression process, and the heat stored in the compression process is used to heat the high-pressure air through the multi-stage heater, which in turn drives the turbine to generate electricity. Similar to (4), the heat consumed by the mth stage heater to heat before the mth stage can be expressed as follows:
where
The total heat consumed by the heater during the whole energy release process can be represented as follows:
where
2.1.3 Expansion System
When AA-CAES is in the state of expansion and energy release, the high-pressure air in the storage tank is heated by the heater and then enters the turbo-generator to push the turbine to generate electricity. The turbo-generator converts the potential energy of high-pressure air into electrical energy, and its working process can be regarded as the inverse process of the compressor. According to (1), the working model of the turbo-generator is deduced as follows:
where
Similar to (3), the inlet and outlet temperatures of the turbo-generator are related as follows:
where
The cold air discharged from the final stage turbo-generator is used for cooling, so the maximum cooling capacity of AA-CAES at the time t described as follows (Zunft, 2015):
where
2.2 Gas-Fired Units
2.2.1 Gas Turbine
As the largest gas-fired equipment in the IES, the GT can realize combined heat and power supply. The GT generates electricity by spinning a turbine at a fast speed using high-temperature and high-pressure gas generated by burning natural gas. Meanwhile, the WHB receives heat from the high-temperature exhaust gases emitted from the turbine. Therefore, the electricity generation and heat production of GT can be expressed as follows (Wei et al., 2022):
where
2.2.2 Gas Boiler
The GB uses gas combustion to supply heat to the IES and can compensate for the lack of heat in the system, and the heat production power of GB is as follows (Wei et al., 2022):
where
2.3 Refrigeration Equipment
The ER and AR are the main cooling equipment in the IES. The ER is a device that transforms electrical energy to cold energy, and the AR converts thermal energy into cold energy using a binary solution of a mixture of a high boiling point absorber and a low boiling point refrigerant. The cooling supply models for both are expressed as follows (Yang et al., 2021):
where
3 Ladder-Type Carbon Trading Mechanism
China’s carbon trading mechanism considers carbon emissions as a marketable product. It allocates an unpaid carbon quota to individual facilities of the system according to a standard (Zhang et al., 2013). While the excess of the quota needs to be purchased, the excess carbon quota can be sold. This results in a carbon emissions trading market. Through economic benefits to constrain the carbon emissions of each system, the economy and environmental friendliness of the IES system are improved.
3.1 Carbon Emission Quota
In this study, the ladder-type carbon trading model is constructed assuming that all power purchased outside the system is provided by conventional coal-fired units. Therefore, the carbon emission quota of the IES mainly includes the GT, GB, and conventional coal-fired units. The carbon emission quota of the GT is converted according to the heat supply (Qin et al., 2018), and the sum of the heat supply converted to heat and the original heat production is used as the total heat for the quota; the GB is quantified according to its heat supply; the conventional coal-fired unit is quantified according to the purchasing power of the system. The carbon emission quotas for the GT, GB, and conventional coal-fired units and the total quotas in the IES are as follows (Qu et al., 2018b):
where
3.2 Ladder-Type Carbon Trading Calculation Model
The ladder-type carbon trading mechanism splits the carbon emission into multiple intervals on the basis of the traditional carbon trading, and the higher the carbon emission, the higher is the trading price of the interval, thus further controlling the carbon emission of the system. In this study, the carbon emission volume is divided into four intervals, each corresponding to a different carbon trading cost, as follows (Wang et al., 2022):
where
4 IES Optimal Scheduling Model With AA-CAES
4.1 Optimization Objective
The optimal scheduling model of the IES with AA-CAES can develop an optimal scheduling situation 24 h a day by considering the multi-energy complementary characteristics of the system in an integrated manner. In this study, the lowest total operating cost of the IES is taken as the objective function, which can be expressed as follows:
where
where
4.2 Constraints
The aforementioned scheduling model is subject to the following constraints:
4.2.1 System Constraints
1) Electrical power balance:
where
2) Heat power balance:
where
3) Cold power balance:
where
4.2.2 Equipment Power Constraints
1) AA-CAES power constraints:
where
2) GT and GB power constraints:
where
3) EC and AC power constraints:
where
4.2.3 Storage Unit Constraint
The storage units in the integrated energy system of this study mainly include AA-CAES gas storage units and heat storage units with the following constraints:
where
5 Case Study
5.1 System Data
The analysis of this study is based on the cooling, heating, and electricity demand data of a typical day at a provincial and ministerial university in Qinghai Province, and the IES with AA-CAES is used to provide electricity, heat, and cold energy for the campus’ living, teaching, and experiments. The forecast curves of the campus’ typical daily hot and cold electric load are shown in Figure 3, and the forecast of wind power output and PV generation are shown in Figure 4. The time-of-use electricity price and time-of-use gas price announced by the Development and Reform Commission of Qinghai Province are shown in Figure 5. The parameters of AA-CAES are depicted in Table 1, and the rated charging time and rated discharging time are 10 h. The internal equipment parameters of the IES are shown in Table 2.
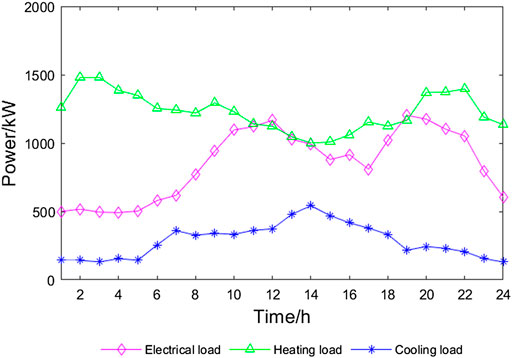
FIGURE 3. Typical daily load on campus.
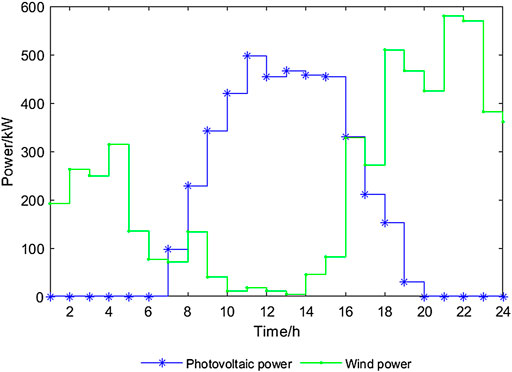
FIGURE 4. Typical day wind and PV generation forecast.
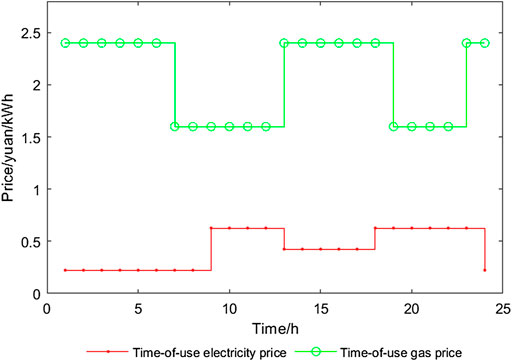
FIGURE 5. Hourly price changes in electricity and gas prices.
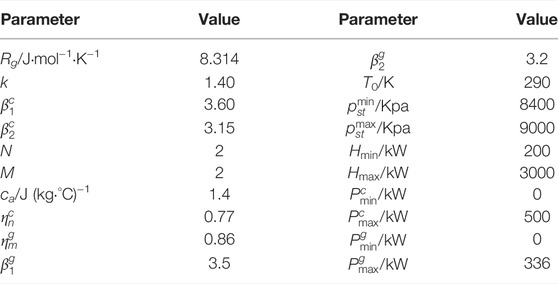
TABLE 1. Parameters of AA-CAES
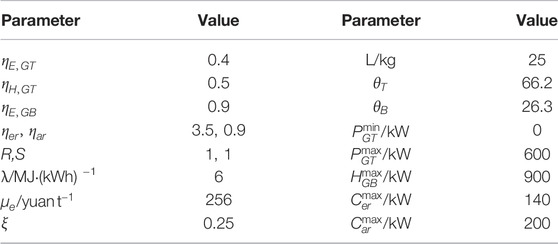
TABLE 2. Other device parameters in the IES.
5.2 Results and Discussion
To compare and analyze the impact of the introduction of AA-CAES and carbon trading mechanisms on the benefits of integrated energy system, the following three scenarios are designed and simulated separately:
Scenario 1: Studies the case of conventional IES energy supply, without considering the participation of AA-CAES and ladder-type carbon trading mechanisms.
Scenario 2: Studies the case of IES energy supply containing AA-CAES without considering a ladder-type carbon trading mechanism.
Scenario 3: Studies the case of IES energy supply with AA-CAES considering the ladder-type carbon trading mechanism.
5.2.1 Results of the Optimal Dispatching
In Figure 6, the comparison between scenario 1 and scenario 2 shows that after considering the participation of AA-CAES in scenario 2, the total energy consumption of the system will increase to a certain extent due to the lower efficiency of AA-CAES “electricity to electricity” conversion. Therefore, the cost of electricity purchase of the system will increase slightly. However, through the implementation of time-of-use electricity price and time-of-use gas price, AA-CAES can reduce the economic cost of the system with the operation strategy of “low price energy storage and high price energy release.” At the same time, AA-CAES has the characteristics of multi-energy combined supply, which reduces the heating pressure of the GT and GB, thus reducing the operation cost of the GT and GB. Therefore, after the AA-CAES power plant in Table 3 participates in the optimal dispatch of the IES, the total operating cost of the system in scenario 2 is reduced by 20% compared with scenario 1, which improves the economy of the IES. In addition, the participation of AA-CAES in scenario 2 reduces the wind curtailment of the system. In scenario 2, not only is the economic cost of the system reduced but also the adoption of clean energy reduces the system’s carbon emissions by 6%.

FIGURE 6. External power purchase and gas equipment output in each scenario.
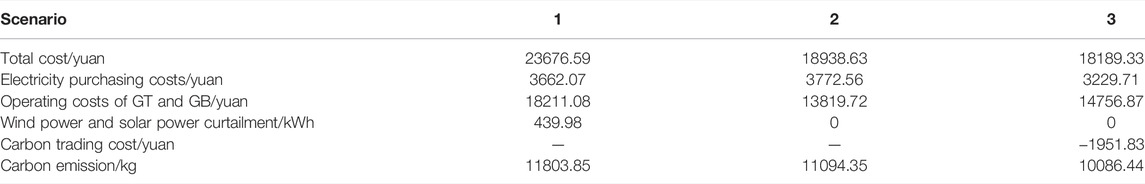
TABLE 3. Costs of each scenario.
The comparison between scenario 2 and scenario 3 in Figure 6 shows that scenario 3 under the constraint of the ladder-type carbon trading mechanism can gain additional benefits due to the smaller carbon emission of gas-fired equipment. Therefore, the external power purchase is decreased, and the output of gas-fired equipment is increased, thus reducing the total carbon emission of the system. As shown in Table 3, although the operating cost of gas-fired equipment is increased in scenario 3, the increase in the revenue from carbon trading and the decrease in the cost of purchased electricity result in a 14.1% decrease in the total operating cost compared to scenario 2. Compared with the conventional IES supply in scenario 1, the dispatching strategy proposed in this study results in a 23.1% decrease in the total operating cost, while the carbon emissions of the system are reduced by 14.5%. Thus, it can be seen that the introduction of the ladder-type carbon trading mechanism has improved both the economy and environmental protection of the IES.
5.2.2 Supply and Demand Balance Analysis
Figures 7A-C shows the CHP dispatch results for Scenario 1 (without AA-CAES and ladder carbon trading mechanism); Figures 7D-F shows the CHP dispatch results for Scenario 2 (with AA-CAES); Figures 7G-I shows the CHP dispatch results for Scenario 3 (with AA-CAES and ladder carbon trading mechanism). From Figure 7A, we can see that scenario 1 is mainly met by GT, wind power, PV generation, and externally purchased electricity to meet the electric load demand. From 2:00 to 4:00, the system is constrained by the “power based on heat” operation mode and the power has an excessive production capacity, thus generating the wind curtailment phenomenon. 8:00–12:00 and 19:00–21:00 are the peak periods of electricity consumption, and the gas price is low, so the GT output is larger, and the power grid assists the power supply. From 13:00 to 17:00, electricity prices are lower, so external power purchase is mainly used to supply energy at this time, and the GT assists the power supply. In Figure 7B, the gas price is lower during 8:00–12:00 and 19:00–21:00, so the GT and GB output are higher, which can generate excess heat for cooling. In Figure 7C, the cooling load is mainly satisfied by the ER and AR.
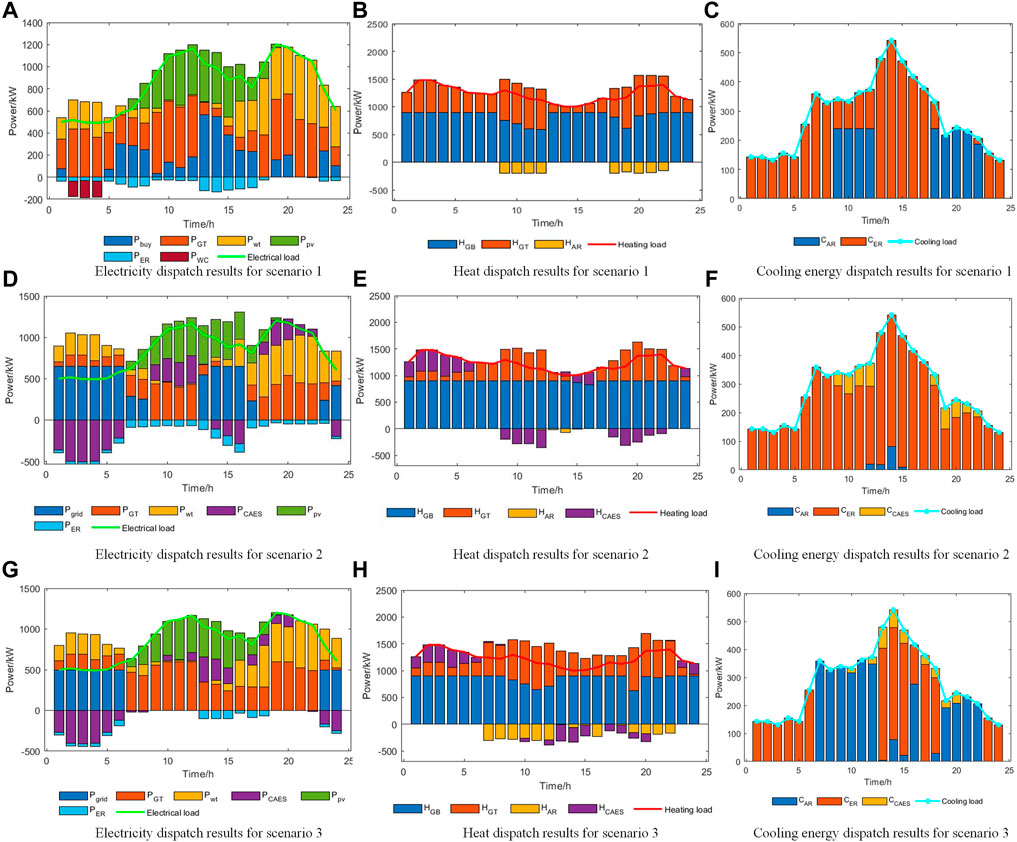
FIGURE 7. Electricity, heat, and cooling dispatch results for scenarios 1–3.
From Figure 7D, it can be seen that in scenario 2, when AA-CAES is added to the system, the original 439.98 kWh of wind curtailment power was completely absorbed. The wind curtailment phenomenon of the system is greatly improved, and the system’s consumption of clean energy is increased. Combined with Table 4, the AA-CAES power plant stores low valley power and clean energy by compressed air during low electrical load hours to be supplied for peak periods. From 24:00–6:00 and 14:00–16:00, AA-CAES stored 2638.36 kWh and 587.41 kWh, respectively, and produced a total of 2573.39 kWh of thermal energy. During the 7:00–8:00 h, PV generation increases, and the system meets the load demand through wind power, PV power, and GT generation, while the grid assists in supplying power. AA-CAES drives a turbine generator that releases 1947.11 kWh of electricity during peak demand periods of 9:00–12:00 and 18:00–22:00, reducing the pressure on equipment such as the GT. In Figure 7E, during 24:00–6:00, when both gas price and heat load are high, the compressed heat collected in the AA-CAES storage stage is used for heat supply, effectively reducing the output of gas equipment, therefore reducing gas cost. At the same time, more heat generated at lower gas prices can heat the high-pressure air and thus drive the turbo-generator to release energy. In Figure 7F, the absorption refrigerator output is smaller because AA-CAES achieves heat storage and release during heat load dispatch. However, the turbo-generator outlet temperature is lower during the AA-CAES energy release process, which can provide the system with cooling capacity. Thus, the participation of AA-CAES increases the flexibility of the IES system energy supply and improves the capacity of clean energy consumption, while the working mode of “low storage and high release” greatly reduces the operating cost of the system.
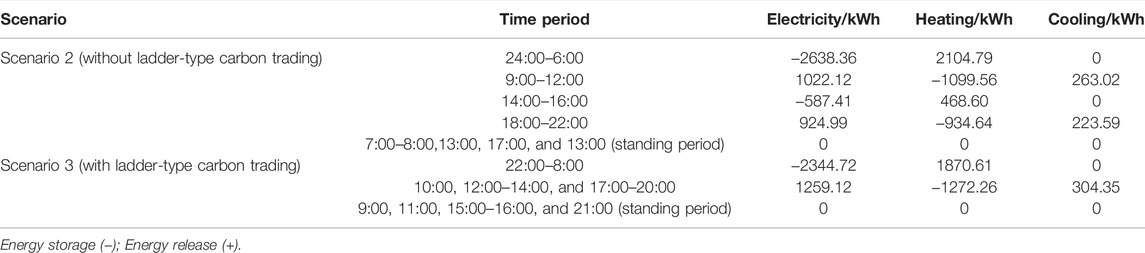
TABLE 4. Energy conversion of AA-CAES in scenarios 2 and 3
In Figures 7G, a ladder-type carbon trading mechanism is added to the AA-CAES participation in dispatching in scenario 3. In contrast to Figures 7D,G shows a reduction in system power purchase from 1:00 to 6:00 and an increase in GT output from 7:00 to 8:00 and 13:00 to 17:00 instead of external grid power purchase. The reduction in grid power purchases causes AA-CAES to change from storage in Figure 7D to generation in Figure 7G during the 13:00–17:00 period. In Figure 7H, with the incentive of the ladder-type carbon trading mechanism, compared to scenario 2, the heat output of gas-fired equipment increases, and therefore, more heat is used for cooling. In Figure 7I, compared to scenario 2, the amount of cooling supplied by absorption refrigeration equipment increases, and therefore, the amount of electric cooling is reduced, further reducing the carbon emissions from electricity purchases. It can be concluded that the introduction of the ladder-type carbon trading mechanism increases the operating cost of the gas-fired equipment, but the benefit from the reduction of carbon emissions makes the total operating cost of the system lower and, at the same time, improves the environmental friendliness of the system.
5.2.3 Analysis of the Operation of AA-CAES
Figures 8, 9 depict the mass flow over time for AA-CAES in scenarios 2 and 3. The variation of the mass flow rate reflects, to some extent, the output of AA-CAES. From Figures 8, 9, it can be seen that the nighttime energy storage time for scenario 2 is from 24:00 to 6:00; however, the energy storage time for scenario 3 is from 22:00 to 8:00. Scenario 3 has a longer nighttime energy storage time, especially due to the increased heat supply to the system due to the increased output of gas-fired equipment under the incentive of the ladder carbon trading mechanism, and the system replaces the ER with the AR. Therefore, the system stores the electricity that would have been used for the ER.
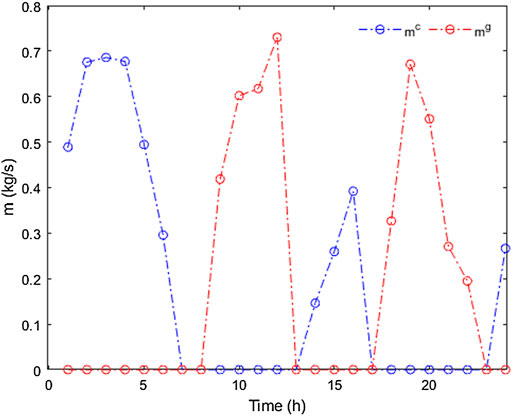
FIGURE 8. Mass flow of AA-CAES in scenario 2.
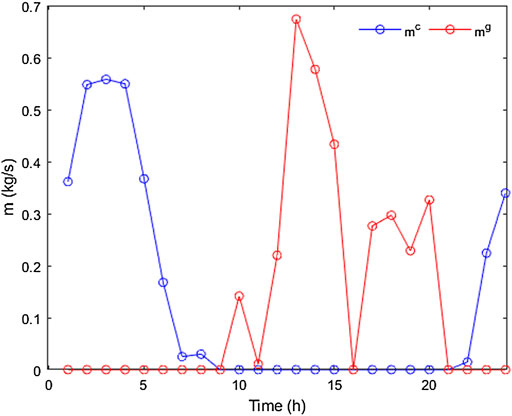
FIGURE 9. Mass flow of AA-CAES in scenario 3.
In Table 4, compared to scenario 2, the total amount of electricity stored in AA-CAES decreases from 3225.77 kWh to 2344.72 kWh, and the total amount of electricity generated decreases from 1947.11 kWh to 1259.12 kWh. This is primarily as a result of the fact that the ladder carbon trading mechanism limits the carbon emissions generated by external power purchases, which leads to a decrease in the amount of electricity stored in AA-CAES. This, in turn, leads to a reduction in power generation from AA-CAES.
6 Conclusion
This study presents an optimal scheduling strategy for the ladder-type carbon trading mechanism in IES with AA-CAES. The economy and effectiveness of the strategy are verified by establishing several scenarios for comparative analysis. The results of the simulation example lead to the following conclusions:
1) The multi-energy storage and supply feature of the AA-CAES power plant enables the IES to avoid the occurrence of wind curtailment and improve the system’s ability to consume clean energy. The AA-CAES power plant stores energy at low load demand and releases energy at peak load demand. It can operate with GTs and GBs and other equipment, which improves the flexibility of the IES energy supply.
2) After AA-CAES participates in the IES dispatch, the system’s total power consumption increases due to the power loss in the process of energy storage and release of AA-CAES power plants. However, the AA-CAES can benefit from the operation mode of “energy storage at a low price and energy release at a high price,” the absorption of wind curtailment, and the reduction of gas equipment operation cost. As a result, the overall operating cost of the system is decreased by 20%, which improves the economy of the IES.
3) The ladder carbon trading mechanism converts environmental indicators into economic indicators to participate in the optimization of the objective function, which makes the scheduling results more comprehensive. It also demonstrates the good compatibility of AA-CAES with the ladder carbon trading mechanism.
4) The introduction of the ladder-type carbon trading mechanism can stimulate the system to reasonably allocate the output of each piece of energy supply equipment; thus, the carbon emission of the system is reduced by 14.5%. In addition, the total operating cost of the system is decreased by 23.9% by trading the excess carbon emission quotas to gain revenue. The economic and environmental performance of the IES is greatly improved, which proves the effectiveness of the operation strategy proposed in this article.
Data Availability Statement
The original contributions presented in the study are included in the article/Supplementary Material; further inquiries can be directed to the corresponding author.
Author Contributions
XW: conceptualization, writing—original draft, software, and visualization. XA: project management and manuscript review. XC: conceptualization, methodology, funding acquisition, validation, and writing—reviewing. LF: data curation and software. QJ: investigation and revised the manuscript. LM: resources and project administration. LC: formal analysis and manuscript review and supervision. SM: data curation and manuscript review. All authors have read and agreed to the published version of the manuscript.
Funding
This work has been supported by the special fund project of The Key Lab of Plateau Building and Eco-community in Qinghai, China. (Research and engineering demonstration of plateau living environment improvement technology based on clean energy hub) No. KLKF-2020-004 and supported by the Basic Research Program Fund of Science and Technology Project of Qinghai Province (No. 2021-ZJ-938Q).
Conflict of Interest
Author AX was employed by Qinghai Building and Materials Research Co., Ltd.
The remaining authors declare that the research was conducted in the absence of any commercial or financial relationships that could be construed as a potential conflict of interest.
Publisher’s Note
All claims expressed in this article are solely those of the authors and do not necessarily represent those of their affiliated organizations, or those of the publisher, the editors, and the reviewers. Any product that may be evaluated in this article, or claim that may be made by its manufacturer, is not guaranteed or endorsed by the publisher.
References
Arabkoohsar, A., Dremark-Larsen, M., Lorentzen, R., and Andresen, G. B. (2017). Subcooled Compressed Air Energy Storage System for Coproduction of Heat, Cooling and Electricity. Appl. Energy 205, 602–614. doi:10.1016/j.apenergy.2017.08.006
Budt, M., Wolf, D., Span, R., and Yan, J. (2016). A Review on Compressed Air Energy Storage: Basic Principles, Past Milestones and Recent Developments. Appl. energy 170, 250–268. doi:10.1016/j.apenergy.2016.02.108
Dielmann, K., and van der Velden, A. (2003). “Virtual Power Plants (VPP) - a New Perspective for Energy Generation?,” in Proceedings of the 9th International Scientific and Practical Conference of Students, Postgraduates Modern Techniques and Technologies, Tomsk, Russia, 7-11 April 2003 (Piscataway, New Jersey, United States: IEEE), 18–20. doi:10.1109/SPCMTT.2003.1438108
Ding, Y., Xu, Q., Xia, Y., Zhao, J., Yuan, X., and Yin, J. (2021). Optimal Dispatching Strategy for User-Side Integrated Energy System Considering Multiservice of Energy Storage. Int. J. Electr. Power Energy Syst. 129, 106810. doi:10.1016/j.ijepes.2021.106810
Grazzini, G., and Milazzo, A. (2008). Thermodynamic Analysis of CAES/TES Systems for Renewable Energy Plants. Renew. Energy 33 (9), 1998–2006. doi:10.1016/j.renene.2007.12.003
Gu, W., Wu, Z., Bo, R., Liu, W., Zhou, G., Chen, W., et al. (2014). Modeling, Planning and Optimal Energy Management of Combined Cooling, Heating and Power Microgrid: A Review. Int. J. Electr. Power Energy Syst. 54, 26–37. doi:10.1016/j.ijepes.2013.06.028
Guo, C., Xu, Y., Zhang, X., Guo, H., Zhou, X., Liu, C., et al. (2017). Performance Analysis of Compressed Air Energy Storage Systems Considering Dynamic Characteristics of Compressed Air Storage. Energy 135, 876–888. doi:10.1016/j.energy.2017.06.145
Huang, Y., Wang, Y., and Liu, N. (2022). Low-Carbon Economic Dispatch and Energy Sharing Method of Multiple Integrated Energy Systems from the Perspective of System of Systems. Energy 244, 122717. doi:10.1016/j.energy.2021.122717
Hwang, T., Choi, M., Kang, S., and Lee, I. (2012). “Design of Application-Level Reference Models for Micro Energy Grid in IT Perspective,” in Proceedings of the 2012 8th International Conference on Computing and Networking Technology (INC, ICCIS and ICMIC), Gyeongju, Korea, 27-29 Aug. 2012 (Piscataway, New Jersey, United States: IEEE), 180–183.
Li, G., Zhang, R., Jiang, T., Chen, H., Bai, L., Cui, H., et al. (2016). Optimal Dispatch Strategy for Integrated Energy Systems with Cchp and Wind Power. Appl. Energy 192, 408–419. doi:10.1016/j.apenergy.2016.08.139
Li, P., Hu, Q., Sun, Y., and Han, Z. (2021). Thermodynamic and Economic Performance Analysis of Heat and Power Cogeneration System Based on Advanced Adiabatic Compressed Air Energy Storage Coupled with Solar Auxiliary Heat. J. Energy Storage 42, 103089. doi:10.1016/j.est.2021.103089
Li, R., Chen, L., Yuan, T., and Li, C. (2016). Optimal Dispatch of Zero-Carbon-Emission Micro Energy Internet Integrated with Non-Supplementary Fired Compressed Air Energy Storage System. J. Mod. Power Syst. Clean. Energy 4 (4), 566–580. doi:10.1007/s40565-016-0241-4
Lingmin, C., Jiekang, W., Fan, W., Huiling, T., Changjie, L., and Yan, X. (2020). Energy Flow Optimization Method for Multi-Energy System Oriented to Combined Cooling, Heating and Power. Energy 211, 118536. doi:10.1016/j.energy.2020.118536
Lu, Q., Guo, Q., and Zeng, W. (2021). Optimization Scheduling of an Integrated Energy Service System in Community under the Carbon Trading Mechanism: A Model with Reward-Penalty and User Satisfaction. J. Clean. Prod. 323, 129171. doi:10.1016/j.jclepro.2021.129171
Luo, X., Wang, J., Krupke, C., Wang, Y., Sheng, Y., Li, J., et al. (2016). Modelling Study, Efficiency Analysis and Optimisation of Large-Scale Adiabatic Compressed Air Energy Storage Systems with Low-Temperature Thermal Storage. Appl. Energy 162, 589–600. doi:10.1016/j.apenergy.2015.10.091
Mei, S., Li, R., Chen, L., and Xue, X. (2018). An Overview and Outlook on Advanced Adiabatic Compressed Air Energy Storage Technique. Proc. CSEE 38 (10), 2893–2907. doi:10.13334/j.0258-8013.pcsee.172138
Mei, S., Wang, J., Tian, F., Chen, L., Xue, X., Lu, Q., et al. (2015). Design and Engineering Implementation of Non-Supplementary Fired Compressed Air Energy Storage System: TICC-500. Sci. China Technol. Sci. 58 (4), 600–611. doi:10.1007/s11431-015-5789-0
Qin, T., Liu, H., Wang, J., Feng, Z., and Fang, W. (2018). Carbon Trading Based Low-Carbon Economic Dispatch for Integrated Electricity-Heat-Gas Energy System. Autom. Electr. Power Syst. 42 (14), 8–13. doi:10.7500/AEPS20171220005
Qu, K., Huang, L., Yu, T., and Zhang, X. (2018). Decentralized Dispatch of Multi-Area Integrated Energy Systems with Carbon Trading. Proc. CSEE 38 (3), 697–707. doi:10.13334/j.0258-8013.pcsee.170602
Qu, K., Yu, T., Huang, L., Yang, B., and Zhang, X. (2018). Decentralized Optimal Multi-Energy Flow of Large-Scale Integrated Energy Systems in a Carbon Trading Market. Energy 149, 779–791. doi:10.1016/j.energy.2018.02.083
Sanjari, M. J., and Karami, H. (2020). Optimal Control Strategy of Battery-Integrated Energy System Considering Load Demand Uncertainty. Energy 210, 118525. doi:10.1016/j.energy.2020.118525
Tan, J., Li, Y., and Zhang, X. (2022). Optimization and Trading of District Multi-Energy System in University Community Considering Carbon Emission. Int. J. Electr. Power Energy Syst. 137, 107450. doi:10.1016/j.ijepes.2021.107450
Wang, C., Ding, X., Guo, C., Yang, B., Pan, J., Zhang, H., et al. (2020). “Optimal Configuration of Hydrogen Storage System and Hydrogen Supply Chain Equipment for Regional Integrated Energy System,” in Proceeding of the 2020 IEEE 3rd Student Conference on Electrical Machines and Systems (SCEMS), Jinan, China, December 2020 (IEEE), 976–981. doi:10.1109/scems48876.2020.9352250
Wang, L., Li, Q., Sun, M., and Wang, G. (2016). Robust Optimisation Scheduling of CCHP Systems with Multi‐energy Based on Minimax Regret Criterion. IET Gener. Transm. Distrib. 10 (9), 2194–2201. doi:10.1049/iet-gtd.2015.1344
Wang, R., Wen, X., Wang, X., Fu, Y., and Zhang, Y. (2022). Low Carbon Optimal Operation of Integrated Energy System Based on Carbon Capture Technology, LCA Carbon Emissions and Ladder-type Carbon Trading. Appl. Energy 311, 118664. doi:10.1016/j.apenergy.2022.118664
Wang, Z., Hu, J., and Liu, B. (2021). Stochastic Optimal Dispatching Strategy of Electricity-Hydrogen-Gas-Heat Integrated Energy System Based on Improved Spectral Clustering Method. Int. J. Electr. Power Energy Syst. 126, 106495. doi:10.1016/j.ijepes.2020.106495
Wei, Z., Ma, X., Guo, Y., Wei, P., Lu, B., and Zhang, H. (2022). Optimized Operation of Integrated Energy System Considering Demand Response Nder Carbon Trading Mechanism. Electr. Power Constr. 43 (01), 1–9. doi:10.12204/j.issn.1000-7229
Wei, Z., Zhang, S., Sun, G., Xu, X., and Chen, S. (2016). Carbon Trading Based Low-Carbon Economic Operation for Integrated Electricity and Natural Gas Energy System. Automation Electr. Power Syst. 40 (15), 9–16. doi:10.7500/AEPS20151109004
Xiao, J., Li, G., Xie, L., Wang, S., and Yu, L. (2021). Decarbonizing China's Power Sector by 2030 with Consideration of Technological Progress and Cross-Regional Power Transmission. Energy Policy 150, 112150. doi:10.1016/j.enpol.2021.112150
Yang, D., Wang, M., Yang, R., Zheng, Y., and Pandzic, H. (2021). Optimal Dispatching of an Energy System with Integrated Compressed Air Energy Storage and Demand Response. Energy 234, 121232. doi:10.1016/j.energy.2021.121232
Zhang, H., and Zhang, B. (2020). The Unintended Impact of Carbon Trading of China's Power Sector. Energy Policy 147, 111876. doi:10.1016/j.enpol.2020.111876
Zhang, N., Hu, Z., Dai, D., Dang, S., Yao, M., and Zhou, Y. (2016). Unit Commitment Model in Smart Grid Environment Considering Carbon Emissions Trading. IEEE Trans. Smart Grid 7 (1), 420–427. doi:10.1109/TSG.2015.2401337
Zhang, S., Miao, S., Li, Y., Yin, B., and Li, C. (2021). Regional Integrated Energy System Dispatch Strategy Considering Advanced Adiabatic Compressed Air Energy Storage Device. Int. J. Electr. Power Energy Syst. 125, 106519. doi:10.1016/j.ijepes.2020.106519
Zhang, X., Yan, K., Lu, Z., and He, S. L. (2013). Carbon Trading Based Low-Carbon Economic Dispatching for Power Grid Integrated with Wind Power System. Power Syst. Technol. 37 (10), 2697–2704. doi:10.13335/j.1000-3673.pst.2013.10.034
Zheng, L., Zhou, X., Qiu, Q., and Yang, L. (2020). Day-ahead Optimal Dispatch of an Integrated Energy System Considering Time-Frequency Characteristics of Renewable Energy Source Output. Energy 209, 118434. doi:10.1016/j.energy.2020.118434
Zheng, Y., Hill, D. J., Meng, K., Luo, F. J., and Dong, Z. Y. (2015). Optimal Short-Term Power Dispatch Scheduling for a Wind Farm with Battery Energy Storage System. IFAC-PapersOnLine 48 (30), 518–523. doi:10.1016/j.ifacol.2015.12.432
Keywords: AA-CAES, ladder-type carbon trading, integrated energy system, optimal dispatching, low-carbon energy
Citation: Wang X, A X, Chen X, Fang L, Jia Q, Ma L, Chen L and Mei S (2022) Optimal Dispatching of Ladder-Type Carbon Trading in Integrated Energy System With Advanced Adiabatic Compressed Air Energy Storage. Front. Energy Res. 10:933786. doi: 10.3389/fenrg.2022.933786
Received: 12 May 2022; Accepted: 20 June 2022;
Published: 05 August 2022.
Edited by:
Xiaohu Yang, Xi’an Jiaotong University, ChinaReviewed by:
Baomin Dai, Tianjin University of Commerce, ChinaZhan Liu, Qingdao University of Science and Technology, China
Copyright © 2022 Wang, A, Chen, Fang, Jia, Ma, Chen and Mei. This is an open-access article distributed under the terms of the Creative Commons Attribution License (CC BY). The use, distribution or reproduction in other forums is permitted, provided the original author(s) and the copyright owner(s) are credited and that the original publication in this journal is cited, in accordance with accepted academic practice. No use, distribution or reproduction is permitted which does not comply with these terms.
*Correspondence: Xiaotao Chen, chenxiao_qhu@foxmail.com