Improving Power Grid Resilience Under Extreme Weather Conditions With Proper Regulation and Management of DERs—Experiences Learned From the 2021 Texas Power Crisis
 Weiqi Pan
  Yang Li*
- Department of Electrical Engineering, Southeast University, Nanjing, China
Due to climate change in the past few decades, extreme weather conditions have become more frequent and caused power outages with enormous damage to the well-being and the economy. Affected by extremely cold weather, the 2021 Texas power crisis deployed the most significant firm load shedding in US history, costing the economy $10 billion to $20 billion via direct and indirect loss. The North American Electric Reliability Organization (NERC), Federal Energy Commission (FERC), and other literature studies conducted post-event analysis from the perspective of conventional power systems’ planning and operation, and little discussion was made on the distributed energy resources (DERs). Based on the actual data on the 2021 Texas power crisis, this study analyzed the role of DERs in this event and showed the importance of effective regulation and management in improving power grid resilience under such extreme weather conditions.
1 Introduction
In the past few decades, extreme weather conditions have occurred frequently due to climate change. Such weather conditions pose challenges to the power system reliability and have become the leading causes of large-scale power outages, causing enormous damage to the well-being and the economy (Jufri et al., 2019). From February 8th to 20th, 2021, the severe winter storm Uri swept across Texas and the south-central areas in the US and caused the 2021 Texas power crisis in the bulk electric system (BES) operated by the three independent system operators and regional transmission organizations (ISO/RTOs), namely, the Electric Reliability Commission of Texas (ERCOT), the Southwest Power Pool (SPP), and the Midcontinent Independent System Operator (MISO) (Federal Communications Commission, 2021).
In the south-central US, this event is the fourth major power system event caused by extreme weather conditions over the past 10 years, following the event in February 2011, January 2014, and January 2018. As shown in Figure 1, the 2021 Texas power crisis is more destructive and long-lasting than the previous cold weather events (Sperstad et al., 2020). Figure 1A shows the lowest temperature is 28°C below the average daily local temperature, and the largest unavailable generation due to cold weather is over 60 GW during the event in the affected area. Meanwhile, Figure 1B shows the high magnitude and the long-lasted time of the power interruption in the 2021 event as compared to the previous events. It needs to be noted that the manual firm load shed is the largest in US history over 24 GW, and a few areas were without power for 4 days (Federal Energy Regulatory Commission, 2021).
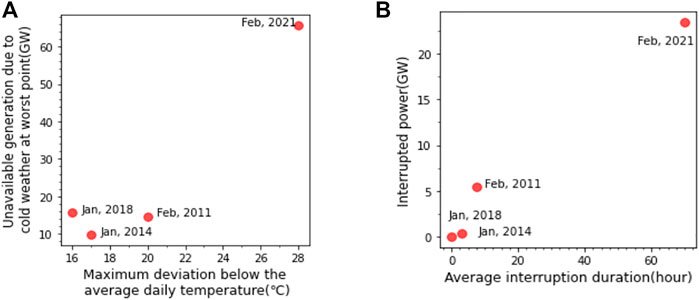
FIGURE 1. Consequence diagrams comparing the four power outages in the previous 10 years in south-central US by unavailable generation VS tempearture (A), and interrupted power VS interruption duration (B).
Regarding the unprecedented damaging results and negative cascading impacts, the 2021 Texas power crisis has drawn significant attention from the both power industry and academia. The North American Electric Reliability Organization (NERC) and the affected ISO/RTOs have already published the official reports revealing the event’s details. In addition, the Federal Energy Commission (FERC) has investigated and released an official report (Midcontinent Independent System Operator, 2021a; Southwest Power Pool, 2021a; the University of Texas at Austin and Energy Institute, 2021). The official reports attribute the direct reasons for massive generation outages to the inadequate winter operation preparedness of generation units and natural gas production infrastructure. Meanwhile, in academia, researchers have examined this event from multiple aspects. Busby et al. (2021) analyzed the subsequent cascading effects after load shedding on Texas’ economy and politics. Yan et al. (2021) showed the importance of power grid safety management, emergency response, power grid differentiation planning, and emergency material reserves in preventing such power system outages under extreme weather conditions. Wu et al. (2021) quantitatively provided access to the impact of generator weatherization, demand response, and energy storage on mitigating this power outage. Zhang et al. (2022) identified this event as the energy insufficiency-caused power outages which are primarily caused by the insufficient fuel supply of natural gas. Hence, official reports and the literature analysis of this event are provided from the perspective of conventional power systems’ planning and operation.
Meanwhile, in south-central US systems which had a high penetration of renewables, natural gas generators take major responsibilities in maintaining the real-time balance between power supply and demand. However, as those generators are expensive, their limited capacity can hardly cope with the increased uncertainties from both supply and demand sides in the near future. In addition, for long-lasting extreme weather conditions such as in February 2021, natural gas generators may suffer from the issue of gas supply as what has happened in the 2021 Texas power crisis. It should be noted that the coordinated control of flexible distributed energy resources (DERs) can help maintain the supply and demand balance; the long-term regulations and management of DERs can also be useful in facilitating the system operation in long-lasting extreme weather conditions. However, little discussion was made on the regulation and management of DERs under extreme weather conditions.
Hence, based on the actual data on the 2021 Texas power crisis, this study analyzes the importance of effective regulation and management of DERs in improving power grid resilience under such extreme weather conditions. The rest of this article is organized as follows: Section 2 describes the event timeline and detailed facts. Section 3 analyzes the problem and potential effects from the perspective of regulation and management of DERs. Section 4 concludes this article.
2 Event Summary
2.1 Basic Information of the Affected Region
In the US, three main interconnections, the Eastern Interconnection, the Western Interconnection, and ERCOT, connect the regional grids in a physical network structure and conduct the cross-regional transmission for reliability and commercial purposes. The interconnections operate independently with limited electricity transmission capacity between them. The power systems affected in this event include the areas operated by ERCOT, SPP, and MISO. Their regions are as shown in Figure 2, and the event-related data are shown in Table 1.
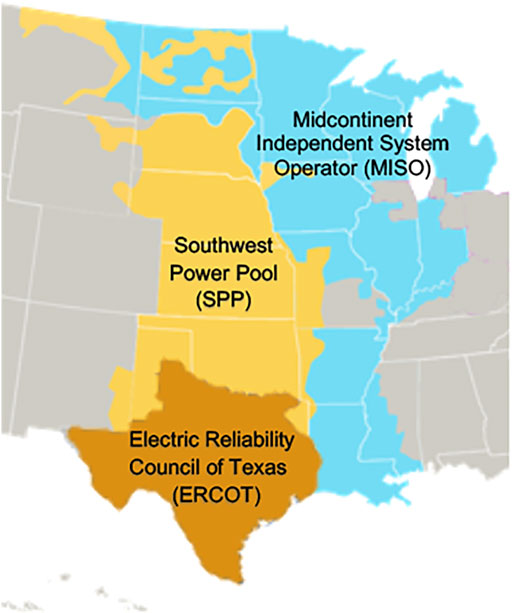
FIGURE 2. Areas affected by this event.
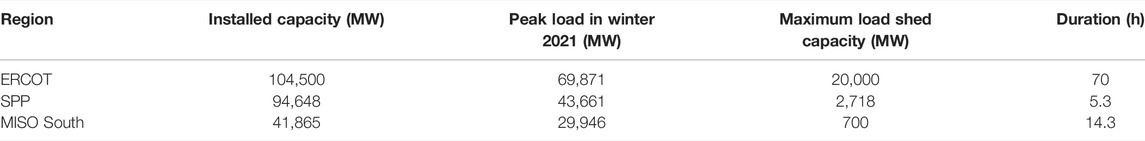
TABLE 1. Comparison of the affected ISO/RTOs in the 2021 Texas power crisis.
The ERCOT serves 90% load in Texas. As shown in Table 1, the installed generation capacity in the ERCOT is over 100 GW (Climate Central, 2014). SPP serves 14 states in the central US with over 94 GW generation capacity (Midcontinent Independent System Operator, 2021b). MISO serves 15 states across the central US with over 198 GW generation capacity (Electric Reliability Council of Texas, 2020). However, only the south part of MISO with 42 GW installed generation capacity was affected in the event. Meanwhile, the ERCOT has limited interstate transmission capacity and operates independently from the US Eastern Interconnection and US Western Interconnection. The total transmission capacity was 1220 MW, which only accounts for 1.8% of the system peak load (Electric Reliability Council of Texas, 2022a). Thus, its maximum load shed reaches 20,000 MW and lasts 70 h. Different from ERCOT, SPP and MISO are connected by the 193 transmission lines and are jointly connected to the Eastern Interconnection, which provides sufficient transmission availability (Southwest Power Pool, 2021b). Thus, their maximum load shed and duration are significantly lower.
As for the regulation, the independent agency FERC is responsible for regulating the interstate transmission and wholesale of the electricity market and the interstate commerce and transportation of the oil and gas market. Oversight by FERC, the NERC is responsible for improving the reliability and security of the power systems over the nation. The specific duties include developing and enforcing the reliability standards, monitoring BES, and assessing the system adequacy annually. The regional electricity, gas, and oil retail services are regulated through the public utility commissions or equivalent. For instance, within Texas, the electricity market is mainly regulated by the Public Utility Commission of Texas (PUCT), and the intrastate oil and gas industry is regulated by the Railroad Commission. It is noticeable that because of the relative independence of ERCOT, the electricity market is largely unregulated by FERC rules.
2.2 Timeline of the Event
The cold weather-related power outage (the 2021 Texas power crisis) caused cascading damages to over 4.5 million people, and at least 210 people were dead due to power shortage-related reasons (Federal Energy Regulatory Commission, 2021). According to the Federal Reserve Bank of Dallas (FRBD), this event costed the economy $10 billion to $20 billion via direct and indirect loss (Federal Reserve Bank of Dallas, 2021). For the BES reliability, 1045 individual BES generating units, with a combined nameplate capacity of over 192 GW in ERCOT, SPP, and MISO, experienced over 4000 times of outages, derates, and failures to start; several transmission lines tripped or had congestion problems; the curtailed load was not fully restored until the temperature rose after February 19th.
The worsening situation of the power grid operation was related to the dropping temperature (Eskandarpour et al., 2017). In this event, the extreme weather condition has two distinct characteristics. First, the below-average freezing temperature lasted relatively long, from February 8th to February 18th. Second, the temperature was much lower than the historical average daily temperature. Specifically, the climate was mild in early February with an average temperature of 15°C in the south-central US. From February 8th to 14th, the average temperature dropped to 0°C, and some regions experienced extreme weather conditions such as freezing rains or snowstorms. The severe cold weather lasted until the 18th, when the average temperature dropped as low as −20°C (Wundergroud, 2022).
With the clear deviation of weather conditions along with the event process, this study examines the performance of the power grid under different phases based on weather conditions.
2.2.1 Phase 1 (Early February to February 8th)
By early February, ERCOT, SPP, and MISO were already aware of the upcoming extreme weather conditions in the mid-February and had issued winterization preparation notices to the system generator owners (GOs), generator operators (GOPs), transmission owners (TOs), and transmission operators (TOPs), suggesting a series of preparation actions, including updating the information of the generation capacity, checking the fuel supply, and implementing the winterization preparation process based on the generation type (Electric Reliability Council of Texas, 2021a).
In response to the alert, all types of generators declared a series of winter operation preparedness actions. According to the record, the response actions of the wind generators included performing annual service and winterization checks, canceling planned maintenance, and ordering additional nitrogen for maintaining the hydraulic braking system; the response actions of the solar units included preparing inverters by checking the functionality of heaters and ensuring adequate temperature settings and functioning alarms; the response actions of natural gas-fired units included checking freeze protection, checking natural gas inventories and placing natural gas commodity order in advance, and testing heating supplies and protective equipment (Federal Energy Regulatory Commission, 2021).
Meanwhile, the natural gas production infrastructures, closely coupled with the natural gas-fired generation units, also declared the winterization preparations. The preparations mainly focused on freezing protection, fluid management, and staffing communications for the natural gas production side. A few gas production facilities shut down before the event in the case of potential freezing issues. The preparations focused on the electric power supply, equipment maintenance, and personnel deployment for the natural gas-processing side. The pipeline facilities focused on the storage activity reports and arranging staffing at critical field operations.
2.2.2 Phase 2 (February 8th to February 14th)
As the temperature decreased, the load demand for heating increased sharply. With an average daily electricity demand increase of 18% from February 9th to February 14th, the electricity demands in affected areas were approaching the historical peak of wintertime by the end of Phase 2 (Electric Reliability Council of Texas, 2021c). Meanwhile, affected by the extreme weather conditions, the generation capacity on the supply side began declining. Although most generation units had declared the preparations for cold weather in Phase 1, most of the units still experienced freezing, transmission system issues, or failure to operate under low ambient temperature. Among the affected generation units, the generation capacity of the wind turbines is mostly reduced due to freezing issues. Under cold weather, the precipitation and condensation caused icy layers on turbine blades, further leading to the balancing, bearing, and other problems for wind turbines. In the event, wind turbine outages and derates caused by freezing issues accounted for 23% of the total outages (Federal Communications Commission, 2021; Southwest Power Pool, 2021b; Eskandarpour et al., 2017). Thus, the operators utilized natural gas generation to compensate for the deficit caused by wind turbines. As shown in Figure 3, compared to the net generation proportions at the beginning of February, the proportion of wind generation declined steadily since February 9th, while the natural gas generation proportion has been increasing to compensate for the loss in wind generation (Energy Information Administration, 2021a). At this phase, the BES reliability was still maintained.
FIGURE 3. Net generation proportion.
2.2.3 Phase 3 (February 15th to February 20th)
Along with the deteriorating weather condition, the large-scale and long-lasted decline in the generation capacity occurred in all the affected power systems. With a total of 95 GW, the unavailable generation reached its peak on February 17th, accounting for 37% of the total installed capacity in the affected areas (Federal Energy Regulatory Commission, 2021). All the system operators deployed the multi-stage emergency energy actions (EEA) to utilize the demand resources to maintain the system's reliability. The load shed in ERCOT, SPP, and MISO is shown in Figure 4 (Electric Reliability Council of Texas, 2021b). Specifically, the following actions were taken:
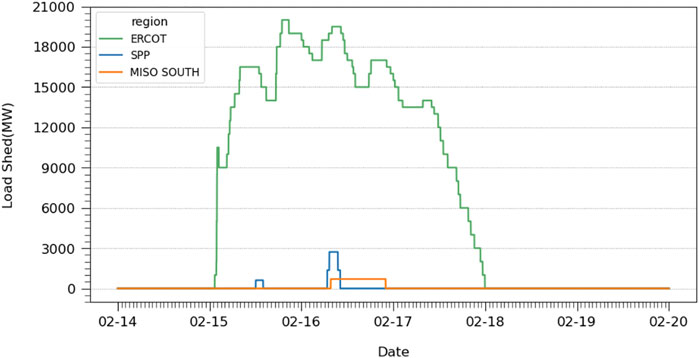
FIGURE 4. Load shed in ERCOT, SPP, and MISO South during the event.
The ERCOT initiated the EEA procedures to maintain the dropping system frequency from the night on the 14th to the morning on the 19th. At 0:15 a.m. on February 15th, EEA 1 was declared when the reserve dropped below the minimum responsive reserve requirement of 2300 MW. The demand resource 30-min Emergency Response Service (ERS-30) was deployed for 847.15 MW (Electric Reliability Council of Texas, 2022b). At 1:07 a.m. on February 15th, EEA 2 was declared. The demand resources 10-min Emergency Response Service (ERS-10) and the responsive reserve service (RRS) were declared successively for 51.6 and 423 MW load reduction (Electric Reliability Council of Texas, 2022c). At 1:20 a.m., when the frequency dropped to 59.938 Hz, ERCOT announced EEA 3 and instructed the immediate firm load reduction. The load shedding lasted from the 15th to the 18th, and the reduction peak was at 19:00 on February 15th with up to 200,000 MW, which accounts for approximately 37.7% of ERCOT’s peak demand. At 10:00 a.m. on February 19th, ERCOT lowered the emergency level to EEA 2. At 11:00 a.m. on the same day, ERCOT lowered the level to EEA 1, which indicates that ERCOT has been restored from the system emergency states (University of Texas at Austin and Energy Institute, 2021).
SPP is connected with the Eastern Interconnection through MISO, having more power transmission capacity than ERCOT. However, due to the transfer limit during the event, when the importable power supply decreased, SPP could not maintain system balance and declared EEA from February 15th. At 5:00 a.m. on February 15th, at the risk of not meeting the required operating reserves, SPP began EEA 1 and made public appealing to the customers to reduce power consumption. At 7:22 a.m. on February 15th, as the unplanned generation outages exceeded 3300 MW, SPP declared EEA 2 and began interrupting interruptible, curtailable load and utilizing demand resources. At 10:08 a.m., because of the reduced imports and insufficient reserves, SPP stated EEA 3, under which could terminate the load export and request firm load shedding (Southwest Power Pool, 2021a).
MISO is directly connected with the Eastern Interconnection. In this event, MISO imported large amounts of power flows to maintain system stability. However, the inadequate generation forced MISO to declare EEA on the 16th. At 4:59 p.m. on February 16th, MISO declared EEA 2. At 6:40 p.m. on February 16th, MISO declared EEA3. At 8:41 p.m.; all the curtailed loads were restored (Midcontinent Independent System Operator, 2021a).
3 Event Analysis
At the worst point, the total unavailable generation accounted for 38.8, 33.2, and 40.2% of the installed capacity in ERCOT, SPP, and MISO South, respectively, due to freezing issues and fuel supply shortage (Federal Energy Regulatory Commission, 2021). However, the scale of load shedding in ERCOT is remarkably higher and lasted for the longest time. The underlying reasons for this difference are complex and could be partly explained by the varying interconnection transmission capabilities among the three regions. During this event, SPP conducted the power inflows, ranging from 4000 to 6000 MW, and MISO South imported 3000 MW. Compared to SPP and MISO, which have abundant transmission capability with the Eastern Interconnection, ERCOT is restrained by the limited transmission capability to conduct power import to alleviate system imbalance. Hence, this section targets ERCOT and analyzes the impact of regulatory and management on DERs.
3.1 Winter Assessment of Distributed Generation
3.1.1 Inaccurate Assessment of Winter Generation Capability
After the power outage event in February 2011, ERCOT scheduled the winterization checking process to assess the generator operating capacity for 75 to 80 generators annually. ERCOT evaluates the generator winter preparation based on the self-reported questionnaire instead of the on-site visit. In the survey just before the 2021 event, 96% of the investigated generators declared they completed winterization. However, the post-event analysis demonstrated that 82% of the generators that have submitted winter preparation reports experienced at least once or more outages, derates, and start failures.
The overestimation of the winter generation capability can be categorized into two aspects. First, the winter inspection checking list has not been modified since 2011. However, the installed capacity of the power generators has changed over the past years, as shown in Figure 5. Based on Electric Reliability Council of Texas (2021d), the generation proportions of wind turbine generators and natural gas-fired generators increased dramatically from 8.5 to 26% and 40 to 52%, while the generation proportion of coal-fired generation decreased from 22 to 6%. Compared to coal-fired generators, wind turbines are more vulnerable under cold weather conditions. Second, most of the winter preparation data are self-reported, including the newly integrated distributed generators. As data validity cannot be ensured, ERCOT could hardly evaluate the winter generation capability accurately.
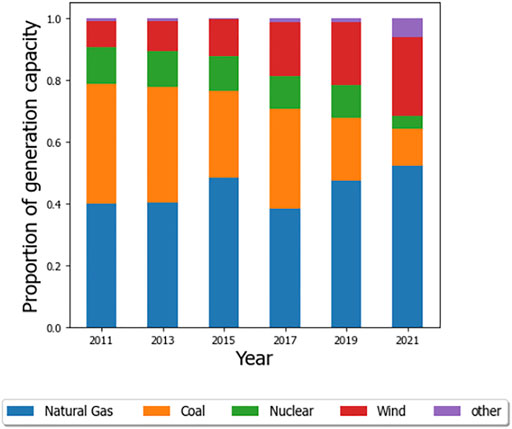
FIGURE 5. Structure of installed generation capacity in ERCOT from 2011 to 2021.
3.1.2 Lack of Intention to Upgrade the Cold Weather Critical Components
As the central and south US have temperature climates, most power generation facilities do not have the ability to operate in extremely cold winter. Wind turbines, solar panels, and natural gas production facilities are all vulnerable to freezing weather. Therefore, after the rotational load shedding event in 2011, ERCOT once made suggestions to the generators and natural gas production facilities to upgrade the cold weather critical components (Federal Energy Regulatory Commission and the North American Electric Reliability Corporation, 2011). However, regarding the concerns about retrofitting, most generation units lack intention to make substantial upgrades. Because conventionally extreme cold weather was considered a small-probability event, the upgraded generation units with higher operating costs may become less competitive in the market most of the time. Meanwhile, in extreme cold weather, the generators which have not been upgraded could shut down without being punished.
Nonetheless, from the perspective of social welfare, the investment in upgrading the cold weather critical components of the power system could effectively reduce the loss in extreme weather conditions. Using the value of lost load (VOLL) as the measurement, FRBD evaluated the total social loss as over $4.3 billion (Federal Reserve Bank of Dallas, 2021). Meanwhile, the cost of winterizing the piece of equipment for each gas plant is between $50,000 and $500,000, suggesting a total cost of up to $9 million to upgrade the 162 natural gas-fired generation units in Texas; The cost of installing the internal warming equipment for the wind turbines is up to $40,000 per blade, making it costly and infeasible to retrofit for all the 13,000 wind turbines in Texas (Federal Energy Regulatory Commission and the North American Electric Reliability Corporation, 2011). Hence, compared to the loss in social welfare, winterization upgrading investments are cost-effective.
3.2 Deployment of Demand-Side Resources
In Texas, the residential sector generally consumes 37% of the total electricity generation. As 60% of households use electricity as the primary heating fuel (White et al., 2021; US Energy Information Administration, 2019), the residential section takes approximately 51% of total demand during winter peak hours, followed by 26% of the large commercial and industrial and 23% of the small commercial loads. Consequently, with extreme weather conditions, the residential electricity demand increased sharply. In phase 2 of the 2021 event, driven by the extreme cold weather, the actual load was higher than the forecasted load, especially during peak hours, as shown in Figure 6 (Energy Information Administration, 2021b; Electric Reliability Council of Texas, 2021c). From February 9th to 14th, the mean absolute percentage error (MAPE) between the actual load and the day ahead forecast was 8.9%, which indicates a significant error in load prediction compared to the yearly average MAPE in 2020 of 1.7%.
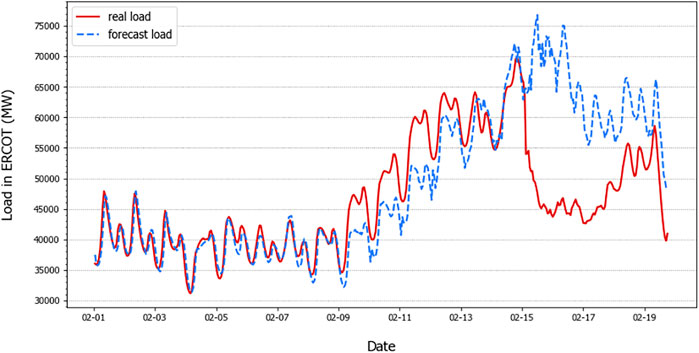
FIGURE 6. Comparison of real and forecast load from February 1st to February 20th in 2021.
In phase 3 of the 2021 event, EEA showed great importance in utilizing demand resources to stabilize system frequency, relieve transmission congestion, and maintain system operation. However, during this event, the deployment of demand-side resources suffers from two issues that limit their values.
3.2.1 Failure on Identifying Critical Loads Related to Natural Gas Production
As aforementioned, the flexible balancing resources in ERCOT relied on the natural gas-fired generators. Thus, when the system encountered unprecedented demands and the loss of wind generation for consecutive days, the proportion of natural gas generation relative to the total generation increased from an average of 43% in 2021 to 72%, as shown in Figure 3. Hence, the need for natural gas fuel increased during the 2021 event.
However, all-natural gas production loads were classified as curtailable loads, and some pieces of key equipment involved in the natural gas production were turned off. Consequently, the loss of power supply to natural gas infrastructure caused 23.5 percent of the decline in natural gas production. As shown in Figure 7, power supply issues account for an 18.1% loss in natural gas production from February 14th to 15 February 2021.
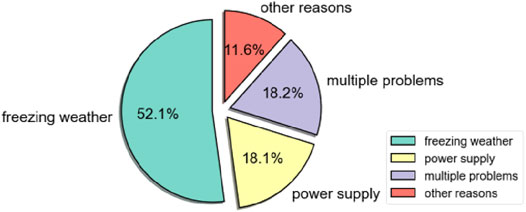
FIGURE 7. Cause of the natural gas production decline from 2021/2/14 9:00 a.m. to 2021/2/15 9:00 a.m. (measured by the natural gas production volume).
In practice, the regulations of the PUCT for the Texas state that the load units need to apply for becoming an important load to its transmission operator, and the transmission operator would then collect the self-reported information and report to PUCT every year. Under such a rule, the system operator only has the self-declared loads (Texas Tribune, 2021). For the loads for natural gas production, processing, and transmission which are not self-declared, system operators had classified them as curtailable loads. This phenomenon aggravates the fuel supply shortage for the natural gas-fired generators.
3.2.2 Late Utilization of Demand-Side Resources
The concept of demand-side resources was initially proposed to reduce energy consumption to alleviate the pressure on the supply side of the system to manage the energy. After the large-scale integration of clean energy, the demand side resource management has gradually shifted to a “power-based” approach on a shorter time scale to balance real-time power supply and demand and provide auxiliary services such as frequency regulation and capacity reserve.
In phase 2 of the 2021 event, although system operators predicted the long-lasting extreme weather with rain and snow, they did not issue early warnings, or power reserve appeals to the users until the wind turbines were interrupted and fuel supply declined. Until phase 3, when the load in the affected areas approached the history peak and the generation declined, ERCOT and SPP started to utilize demand-side resources with the power reserve appeal on February 14th (Southwest Power Pool, 2021a). Hence, the system operator did not act early and failed to take advantage of “the energy-based” property of demand-side resources in this event.
Energy not served (ENS) is used to evaluate the amount of insufficiency of generation relative to the forecast demand, calculated by taking the integral of load shedding over the blackout time (Menati and Le, 2021). As shown in Figure 8, in the period of EEA in ERCOT, the ENS was estimated as 1170 GWh. With a large amount of demand-side energy consumption in Texas, exploring the potential of demand-side resources to maintain the level of natural gas storage can be valuable.
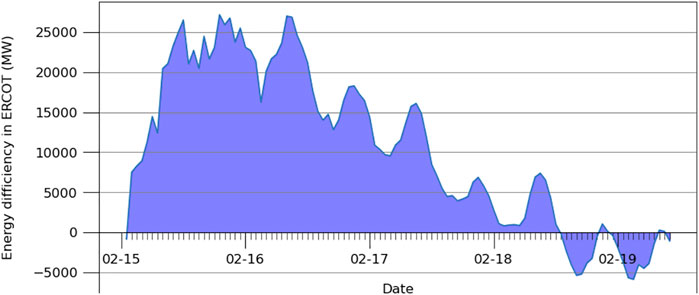
FIGURE 8. Energy deficiency in ERCOT during EEA.
Long-term energy management is defined as the pre-event energy conservation education or programs to encourage customers to voluntarily reduce electricity consumption during the peak load hours to alleviate system peaking-load operation pressure and avoid system blackouts (Electric Reliability Council of Texas, 2021a). The timely and efficient notifications to the customers could help reduce the peak demand (Darby and McKenna, 2012). In the power system event in California in the summer of 2020, after predicting extremely high demand, CAISO effectively sent flex alerts to users through mobile apps, social media, and press media, making public appeals to users to reduce electricity consumption on August 17th and 18th. Hence, the actual peak electricity usage became 4972 MW and 3488 MW, lower than the day-ahead peak demand forecast, and further avoided the large-scale firm load shedding event (Hu et al., 2020).
In the Texas event, the operators made public energy conservation appeal by the 14th. The system had experienced significant power outages and unexpectedly high demand, which exacerbated the system imbalance. Thus, the public conservation appeals did not have expected effects on load reduction. As the cold temperature was predicted to be long-lasting and the load demand had already exceeded the load forecast, the load demand pattern in the extreme weather event was not fully addressed, and the public was not notified of the possible power system blackouts. Thus, as the coldest temperature arrived, the users lacked intention and adequate preparation to reduce electricity usage, which was reflected by the rising demand after public appeals.
Due to the predicted long-lasting duration of this event, the public should be educated before the coldest temperature arrives on the night of February 14th. Except for the monetary-incentive demand response programs, the effects of the high impact, low-cost information, and education programs should be valued. The electricity conservation target could be achieved by encouraging users’ behavioral change by providing information on past energy use, conservation strategies, or peer consumption. The longer-term of such programs would conduct more energy savings (Delmas et al., 2013). Thus, the potential of pre-event load reduction on mitigating ENS is examined. It is assumed that the natural gas storage saved from pre-event load demand conservation could be used to compensate for the primary energy shortage during the coldest weather condition. Based on the publicly available data, the estimation of the saved natural fuel storage can be expressed as follows:
where
Figure 9 shows the load reduction during the pre-outage time period and the incremental generation capacity during the load shed period. It is estimated that a 25% reduction of daily average electricity consumption between February 9th and 14th could fully compensate for the energy deficiency during the power outage. Although it is practically hard for the end-users to reduce the electricity usage by an average daily amount of 25% during such extreme weather, the value of load resources could not be underestimated. Table 2 demonstrates the incremental proportion relative to the initial energy storage on February 15th under different amounts of average daily reduction.
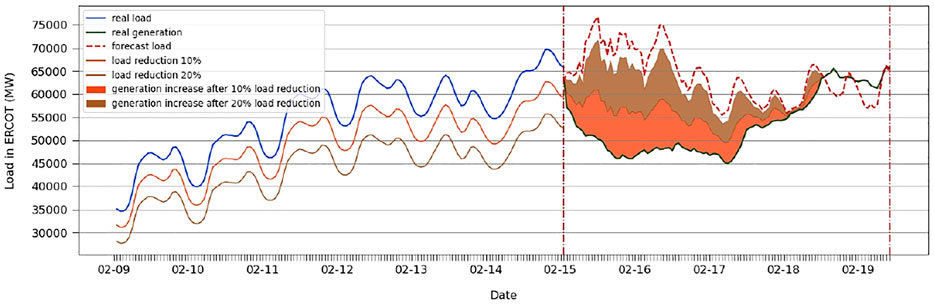
FIGURE 9. Effect of pre-event load conservation on mitigating energy deficiency.
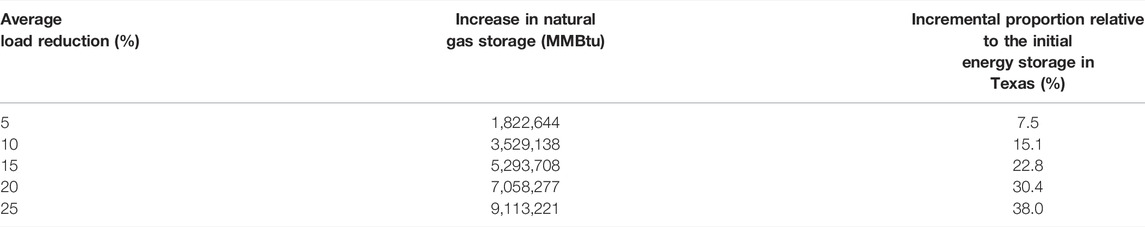
TABLE 2. Effect of average load reduction on natural gas fuel storage.
Because of the abundant natural resources in natural gas and wind energy, ERCOT has been leading in transitioning to the coal-light generation structure that extensively explored the potential of clean energies. The transition has shown significant improvement in energy efficiency and decarbonization. When the frequently occurred power outages could warn the unpredicted system vulnerabilities related to natural gas production under the extreme weather conditions and underscore the importance of primary energy supply during the extremely cold weather conditions. Long-term demand-side management could efficiently alleviate such fuel shortage pressure through effective and efficient programs in a costly manner.
4 Conclusion and Discussion
In the past few decades, extreme weather conditions have been rising due to global climate change. For the power grid operation, the observed outages to the bulk electric system showed a significant increase in the weather-related events, leading to enormous damage to people and the economy.
This study examined the 2021 Texas power crisis caused by the extremely cold weather, mainly from the perspective of DERs’ regulation and management. Based on the public data, it is estimated that the natural gas fuel supply saved by a daily average load reduction of 25% in ERCOT before the coldest weather could compensate for the total energy deficiency during the event. Also, the reliable power supply to the critical natural gas production loads could improve another 15% of the natural gas supply. Although it is practically hard to reach the daily average of 25% of load reduction, the value of the long-term demand-side “energy” management should be valued. Also, it is essential to realize the tight coupling relationship between natural gas production and electricity supply to identify the critical loads. Hence, the effective regulations and management of DERs have proven vital for improving the power grid resilience under such extreme weather conditions.
Data Availability Statement
The original contributions presented in the study are included in the article/Supplementary Material; further inquiries can be directed to the corresponding author.
Author Contributions
WP and YL conceived and designed the research. WP and YL carried out the data search. WP carried out the simulations and analyses. All authors contributed to the discussions on the method and the writing of this manuscript.
Conflict of Interest
The authors declare that the research was conducted in the absence of any commercial or financial relationships that could be construed as a potential conflict of interest.
Publisher’s Note
All claims expressed in this article are solely those of the authors and do not necessarily represent those of their affiliated organizations, or those of the publisher, the editors, and the reviewers. Any product that may be evaluated in this article, or claim that may be made by its manufacturer, is not guaranteed or endorsed by the publisher.
References
Busby, J. W., Baker, K., Bazilian, M. D., Gilbert, A. Q., Grubert, E., Rai, V., et al. (2021). Cascading Risks: Understanding the 2021 Winter Blackout in Texas. Energy Res. Soc. Sci. 77, 102106. doi:10.1016/j.erss.2021.102106
Climate Central (2014). Blackout: Extreme Weather, Climate Change and Power Outages. Princeton, NJ: Climate center. Available at: https://www-ourenergypolicy-org.vpn.seu.edu.cn:8118/wp content/uploads/2014/04/climate-central.pdf (Accessed April 14, 2022).
Darby, S. J., and McKenna, E. (2012). Social Implications of Residential Demand Response in Cool Temperate Climates. Energy Policy 49, 759–769. doi:10.1016/j.enpol.2012.07.026
Delmas, M. A., Fischlein, M., and Asensio, O. I. (2013). Information Strategies and Energy Conservation Behavior: A Meta-Analysis of Experimental Studies from 1975 to 2012. Energy Policy 61, 729–739. doi:10.1016/j.enpol.2013.05.109
Electric Reliability Council of Texas (2021b). Data from: Available Generation and Estimated Load without Load Shed Data. Austin, TX: Electric Reliability Council of Texas. Available at: https://www.ercot.com/files/docs/2021/03/18/Available_Generation_and_Estimated_Load_without_Load_Shed_Data.xlsx.
Electric Reliability Council of Texas (2021d). Data from: Generation Fuel Mix Report 2007–2020. Austin, TX: Electric Reliability Council of Texas. Available at: https://www.ercot.com/files/docs/2021/03/10/FuelMixReport_PreviousYears.zip.
Electric Reliability Council of Texas (2021c). Data from: Hourly Load Data Archives. Austin, TX: Electric Reliability Council of Texas. Available at: https://www.ercot.com/gridinfo/load/load_hist.
Electric Reliability Council of Texas (2022c). Earn Revenue and Protect Your Equipment in the ERCOT Responsive Reserve Service Program. Austin, TX: Electric Reliability Council of Texas. Available at: https://www.ercot.com/files/docs/2021/12/23/1092NPRR-09%20ERCOT%20Comments%20122321.docx (Accessed April 14, 2022).
Electric Reliability Council of Texas. 2022b Emergency Response Service. Austin, TX: Electric Reliability Council of Texas. Available at: https://www.ercot.com/services/programs/load/eils/ [Accessed April 14, 2022].
Electric Reliability Council of Texas (2020). ERCOT DC Tie Operations. Austin, TX: Electric Reliability Council of Texas. Available at: https://www.ercot.com/files/docs/2020/07/30/ERCOT_DC_Tie_Operations_Document.docx.
Electric Reliability Council of Texas (2022a). ERCOT Fact Sheet. Austin, TX: Electric Reliability Council of Texas. Available at: https://www.ercot.com/files/docs/2022/02/08/ERCOT_Fact_Sheet.pdf.
Electric Reliability Council of Texas (2021a). Extreme Cold Weather Expected to Result in Record Electric Use in ERCOT Region. Austin, TX: Electric Reliability Council of Texas. Available at: https://www.ercot.com/news/release?id=1f851612-b1c6-3806-ba84-f192b23083c9 (Accessed April 14, 2022).
Electric Reliability Council of Texas Public (2021). Preliminary Report on Causes of Generator Outages and Derates during the February 2021 Extreme Cold Weather Event. Austin, TX: Electric Reliability Council of Texas. Available at: https://www.ercot.com/files/docs/2021/04/28/ERCOT_Winter_Storm_Generator_Outages_By_Cause_Updated_Report_4.27.21.pdf.
Energy Information Administration (2021b). Data from: Day-Ahead Demand Forecast. Washington, DC: Energy Information Administration. Available at: https://www.eia.gov/opendata/qb.php?category=3389883&sdid=EBA.ERCO-ALL.DF.H.
Energy Information Administration (2021a). Data from: Net Generation by Energy Source. Washington, DC: Energy Information Administration. Available at: https://www.eia.gov/opendata/qb.php?category=3390137.
Eskandarpour, R., Khodaei, A., and Arab, A. (2017). “Improving Power Grid Resilience through Predictive Outage Estimation,” in North American Power Symposium (NAPS), 1–5. doi:10.1109/naps.2017.8107262
Federal Communications Commission (2021). Winter Storm Uri. Washington, DC: Federal Communications Commission. Available at: https://www.fcc.gov/uri (Accessed April 14, 2022).
Federal Energy Regulatory Commission and the North American Electric Reliability Corporation (2011). Outages and Curtailments during the Southwest Cold Weather Event of February 1–5, 2011. Atlanta, GA: Ferc.Gov. Available at: https://www.ferc.gov/sites/default/files/2020-04/08-16-11-report.pdf.
Federal Energy Regulatory Commission (2021). The February 2021 Cold Weather Outages in Texas and the South-Central united states: FERC, NERC and Regional Entity Staff ReportWashington, DC: Federal Energy Regulatory Commission. Available at: https://www.ferc.gov/media/february-2021-cold-weather-outages-texas-and-south-central-united-states-ferc-nerc-and.
Federal Reserve Bank of Dallas (2021). 2021 Deep Freeze Justifies Weatherization. Available at: https://www.dallasfed.org/research/economics/2021/0415.aspx (Accessed April 2nd, 2018).
Hu, Q., Ding, H., Ding, H., Chen, X., Chen, T., Ding, Y., et al. (2020). Analysis of Texas Blackout in 2021 and its Enlightenment to Power System Planning Management. Automation Electr. Power Syst. 24 (44), 11–18. Available at: https://kns.cnki.net/kcms/detail/detail.aspx?
Jufri, F. H., Widiputra, V., and Jung, J. (2019). State-of-the-art Review on Power Grid Resilience to Extreme Weather Events: Definitions, Frameworks, Quantitative Assessment Methodologies, and Enhancement Strategies. Appl. Energy 239, 1049–1065. doi:10.1016/j.apenergy.2019.02.017
A. Menati, and X. Le (Editors) (2021). A Preliminary Study on the Role of Energy Storage and Load Rationing in Mitigating the Impact of the 2021 Texas Power Outage. North American Power Symposium (NAPS). doi:10.48550/arXiv.2111.12908
Midcontinent Independent System Operator (2021a). Arctic Blast Creating Tight Operating Conditions in the South Region. Available at: https://cdn.misoenergy.org/2021%20Arctic%20Event%20Report554429.pdf.
Midcontinent Independent System Operator (2021b). MISO Corporate Fact Sheet. Available at: https://www.misoenergy.org/about/media-center/corporate-fact-sheet/ (Accessed April 14, 2022).
Southwest Power Pool (2021b). Fast Facts. An Overview of the SPP System. Available at: https://www.spp.org/about-us/fast-facts/.
Southwest Power Pool (2021a). Review of Southwest Power Pool's Response to the February 2021 Winter Storm: Analysis and Recommendations. Available at: https://www.spp.org/Documents/65037/Comprehensive%20Review%20of%20SPP' s%20Response%20to%20the%20Feb.%202021%20Winter%20Storm%202021%2007%2019.pdf.
Sperstad, I. B., Kjølle, G. H., and Gjerde, O. (2020). A Comprehensive Framework for Vulnerability Analysis of Extraordinary Events in Power Systems. Reliab. Eng. Syst. Saf. 196, 106788. doi:10.1016/j.ress.2019.106788
Texas Tribune (2021). Paperwork Failures Worsened Texas Blackouts, Sparking Mid-storm Scramble to Restore Critical Fuel Supply. Available at: https://www.texastribune.org/2021/03/18/texas-winter-storm-blackouts-paperwork/ (Accessed April 14, 2022).
University of Texas at Austin, Energy Institute (2021). The Timeline and Events of the February 2021 Texas Electric Grid Blackouts. Available at: https://energy.utexas.edu/sites/default/files/UTAustin%20%282021%29%20EventsFebruary2021TexasBlackout%2020210714.pdf.
US Energy Information Administration (EIA) (2019). One in Four US Homes Is All Electric. Available at: https://www.eia.gov/todayinenergy/detail.php?id=39293# (Accessed April 14, 2022).
White, P. R., Rhodes, J. D., Wilson, E. J. H., and Webber, M. E. (2021). Quantifying the Impact of Residential Space Heating Electrification on the Texas Electric Grid. Appl. Energy 298, 117113. doi:10.1016/j.apenergy.2021.117113
Wu, D., Zheng, X., Xu, Y., Olsen, D., Xia, B., Singh, C., et al. (2021). An Open-Source Extendable Model and Corrective Measure Assessment of the 2021 texas Power Outage. Adv. Appl. Energy 4, 100056. doi:10.1016/j.adapen.2021.100056
Wundergroud (2022). Dallas, TX Weather History. Available at: https://www.wunderground.com/history/daily/us/tx/dallas (Accessed April 14, 2022).
Yan, D. B., Wen, J. Y., Du, Z., Yang, D. J., Yao, W., Zhao, H. S., et al. (2021). Analysis of Texas Blackout in 2021 and its Enlightenment to Power System Planning Management. Power Syst. Prot. Control 49 (9), 121–128. doi:10.19783/j.cnki.pspc.210358R
Keywords: grid resilience, extreme weather, power crisis, DERs, regulation and management
Citation: Pan W and Li Y (2022) Improving Power Grid Resilience Under Extreme Weather Conditions With Proper Regulation and Management of DERs—Experiences Learned From the 2021 Texas Power Crisis. Front. Energy Res. 10:921335. doi: 10.3389/fenrg.2022.921335
Received: 15 April 2022; Accepted: 19 May 2022;
Published: 01 July 2022.
Edited by:
Qingxin Shi, North China Electric Power University, ChinaCopyright © 2022 Pan and Li. This is an open-access article distributed under the terms of the Creative Commons Attribution License (CC BY). The use, distribution or reproduction in other forums is permitted, provided the original author(s) and the copyright owner(s) are credited and that the original publication in this journal is cited, in accordance with accepted academic practice. No use, distribution or reproduction is permitted which does not comply with these terms.
*Correspondence: Yang Li, li_yang@seu.edu.cn