Can Carbon Emissions Trading Scheme Make Power Plants Greener? Firm-Level Evidence From China
 Mingxia Shi
 Tingting Zou
 Jingxuan Xu
 Jie Wang
- Department of Public Finance, School of Economics, Beijing Technology and Business University, Beijing, China
The green energy structure transition is an effective means to achieve carbon emission reduction and sustainable energy development in the long term. Whether the carbon emissions trading scheme, a typical market-oriented environmental regulation, can realize a green energy structure transition has attracted widespread attention. Rather than focusing on the macro-effects of the carbon emissions trading scheme, this paper explores its effect on green energy structural transition in the power sector, which is a major carbon emitter by consuming non-renewable energy. With the multi-period difference-in-differences method, this study manually collects a panel data set of 103 listed power plants from 2011 to 2020 for a total of 1,030 samples and investigates the effect of the carbon emissions trading scheme on the proportion of clean energy power generation. The corresponding mechanism and heterogeneous effects are also examined. The results reveal: 1) The carbon emissions trading scheme increases the proportion of clean energy power generation significantly. This improvement is achieved by increasing clean energy power generation and decreasing thermal power generation. 2) Power companies to which power plants belong are private-owned and have lower debt-to-asset ratios and higher fixed asset ratios, or in regions with a high development level or strong environmental law enforcement, they are found to be more responsive to carbon emissions trading schemes. 3) Green technological innovation is the primary path for transitioning to a green energy structure, but it is not the only path.
1 Introduction
Climate change (Weizsacker, 1990) and energy security (Ning et al., 2021) have emerged as the most critical issues facing sustainable development. Carbon dioxide emissions from the burning of fossil fuels are the primary cause of both problems. BP Statistical Review of World Energy (2021) reports that global greenhouse gas emissions reached 34.36 billion tons in 2019, of which over one-third was attributed to the burning of fossil fuels in the power sector. Therefore, the transformation of the energy structure in the power sector is not only conducive to reducing air pollution but also ensures long-term energy security. To control carbon emissions as soon as possible, countries expect to introduce environmental regulation policies that would result in the transformation of energy structures for power plants.
The carbon emissions trading scheme (ETS) is one of the main measures for achieving emission reduction targets. It has had positive results in many countries (Liang et al., 2014; Tang et al., 2015; Chang et al., 2020; Qi and Choi, 2020; Rickels et al., 2021). However, some studies conclude that it is inefficient (Borrego et al., 2005; María José et al., 2021). In addition to carbon emissions, the carbon ETS can also have an impact on the energy sector, such as improving energy efficiency (Smith and Sorrell, 2001; Zhao et al., 2018; Zhang et al., 2021; Chen et al., 2021), and enhancing the performance of energy companies (Choi et al., 2017). Moreover, the global carbon emissions trading market demonstrated resilience during the COVID-19 and control periods (ICAP, 2021). Thus, more evidence is needed to determine whether the carbon ETS is an effective policy that benefits climate and energy issues.
In contrast to the carbon ETS, the transition to a green energy structure has been widely viewed as a long-term effective strategy to address the two problems (Sun et al., 2020; IEA, 2021; State Council of China Guiding, 2021). Green energy structure transformation refers to the transformation of the main energy maintaining the operation of the national economy from fossil fuel to clean energy. As quickly as possible, countries are formulating policies to promote the transition to green energy infrastructure. Although carbon ETS is one of the most significant market-oriented environmental policies, its effects on the transition to a green energy structure have not been systematically assessed, and many countries have not even considered carbon ETS. With the largest carbon market (Nogrady, 2021) and clean energy output (BP Statistical Review of World Energy, 2021), China’s transition to a green energy structure through the carbon market has great advantages. Its successful transition contributes not only to the “net zero-emission” of the world but also offers valuable policy experience. China’s power sector is essential to its success in converting to a green energy structure since it accounts for a large share of the country’s carbon emissions and fossil fuel consumption (Ma et al., 2021; Zou et al., 2021). Moreover, because electricity consumption is widely distributed, and the demand is huge, plan-driven policies to regulate it can easily cause distortions in resource allocation. Therefore, with respect to carbon ETS as a proven potential market-oriented policy, this study uses the example of Chinese power plants to examine the policy effects of carbon ETS from the perspective of green energy structure transition.
Based on the manually collected panel data and using the multi-period difference-in-differences (MDID) model, this article empirically analyzes the effects of carbon ETS on the proportion of clean energy power generation, clean energy power generation, and thermal power generation. The results show that the carbon ETS significantly increases the proportion of clean energy power generation by promoting clean energy power generation and the limitating thermal power generation. Results of the heterogeneity analysis show that both internal and external characteristics of power firms can affect the green effects of the carbon ETS. The fixed asset ratio, the level of local economic development, and environmental law enforcement have a positive moderating effect, whereas the debt-to-asset ratio has the opposite effect, and privately-owned enterprises are more successful. Furthermore, the mechanism test determined that green technological innovation is one of the primary intermediary factors required for the carbon ETS to be effective.
The main contributions of this paper are summarized in three aspects: firstly, this paper studies the green effects of carbon ETS from the perspective of power generation and fills the gaps in previous studies and provides green empirical evidence regarding ETS’s effects on the environment and energy. As a second issue, the mainstream assessment result provides support for the nationwide implementation of the carbon ETS policy, and the described trends in the proportion of clean electricity and thermal power in recent years are helpful for China to understand the current state of the power generation market. Thirdly, the article examines the influencing factors and influence paths of the carbon ETS’s green effect, aiming to provide effective recommendations for carbon-free countries seeking to develop a national carbon market.
The following is an outline of the remainder of this article. The second section provides background information on carbon ETS policy and a literature review. Section 3 discusses data and methodology. Section 4 presents and analyzes the empirical results. The final section concludes and suggests policy implications.
2 Background and Literature Review
2.1 Background of Carbon ETS Policy
2.1.1 Policy Implementation Background
To accelerate the achievement of carbon emission reduction targets, China has successfully implemented carbon trading pilot schemes in nine provinces and cities over the past few years. Shenzhen served as the first pilot province, followed by Shanghai, Beijing, and Guangdong, all of which set up carbon trading markets in 2013, and Tianjin, Chongqing, and Hubei, which implemented carbon ETS in 2014. Fujian and Sichuan are unofficial pilot provinces that have established carbon markets in 2016. Furthermore, the power sector is the only industry participating in the initial carbon pilot transaction. It contributes a considerable portion of the country’s carbon emissions, which originate primarily from the production of electricity. From Figure 1, it can be seen that national thermal and clean energy power generation has been on the rise from 2011 to 2020. Thermal power has always been the primary power source in China, but it is notable that the proportion of clean energy power has increased from less than 20% in 2011 to about 30% by 2020, as shown in Figure 2.
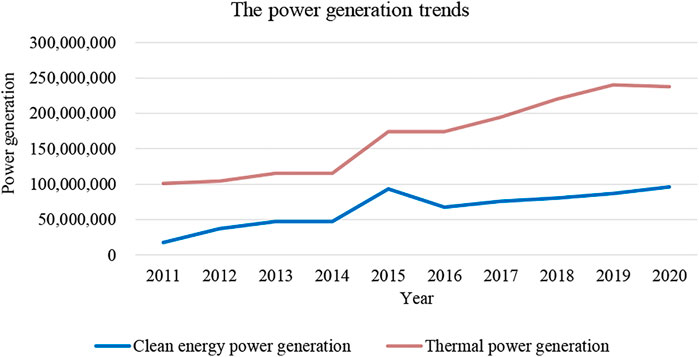
FIGURE 1. The power generation trends.
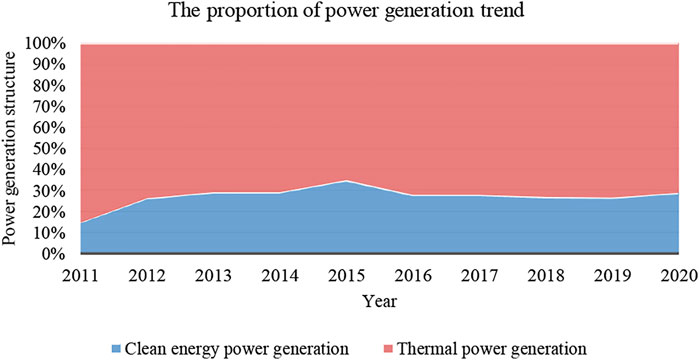
FIGURE 2. The proportion of power generation trend.
2.1.2 Policy Implementation Process
Under China’s Carbon ETS, a cap-and-trade system is implemented, which is a trading market based on total carbon emissions. As a means of limiting corporate carbon emissions, government agencies use carbon emission allowances1 to contract with companies listed in the ETS. Normally, if a firm’s carbon emissions exceed the government’s set carbon emission allowances, it must either purchase the carbon emission allowances through the carbon trading market or obtain Chinese Certified Emission Reduction (CCER) to replace part of the carbon emission allowances and keep the promise. Figure 3 describes the carbon ETS compliance process in more detail. At the beginning of the trading year, government authorities evaluate the maximum quantity of pollutants that can be discharged in order to meet environmental standards in a pilot province, which is called the “carbon emission cap” in this paper. Based on some calculation principles, it is divided into several shares and distributed to the member companies in both free and paid forms. The first form accounts for a relatively large proportion of China’s initial carbon pilot schemes, which are referred to as “free carbon emission allowances” in this paper. Member companies trade carbon emission allowances according to their carbon emissions requirements. And they should submit carbon emission allowances to offset the total carbon emissions resulting from the trading period at the end of the transaction period. If the carbon emissions are completely offset, the company has achieved “compliance”, otherwise it is considered “default”.
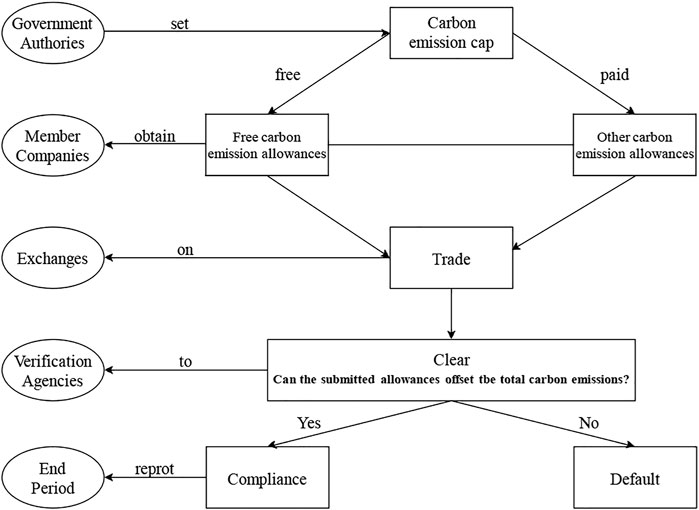
FIGURE 3. The carbon ETS compliance process.
2.2 Literature Review
2.2.1 The Direct Green Effect of the Carbon ETS
Currently, available literature describes the policy effects of carbon ETS primarily at the macro-level of a country as well as the micro-level of an enterprise. Some disagreements as to whether this market-oriented environmental regulation could, from the macro-level of a country’s perspective, actually contribute to sustainable development in terms of the environment and energy. The carbon ETS could reduce carbon dioxide emissions and improve the efficiency of carbon emission reductions during the dispatching of power (Wang and Li, 2021). Furthermore, carbon ETS not only decreased the emission of air pollutants, but it was also shown to alter the distribution of these pollutants, resulting in unintended environmental health damage in some areas (Cao et al., 2019; Zhang and Zhang, 2020). Energy companies also tend to be subject to the carbon ETS. Fang et al. (2020) and Zhang et al. (2020) proposed that a mature carbon trading market effectively controlled energy intensity and promoted the development of new energy sources. At the micro-level of the enterprise, Luo et al. (2021) empirically found that carbon ETS improved the green competitiveness and cost competitiveness of power companies. When only one environmental regulation policy was allowed, power companies gained more low-carbon profit, and carbon ETS tended to perform better than pollution right trading (Ge et al., 2019). In addition to the electric power sector, carbon emissions from energy companies have decreased since the opening of the carbon market, and the costs of energy companies’ carbon dioxide emissions were not shifted excessively to energy consumers. There was no distortion between supply and demand for energy consumption (Yu et al., 2022). Carbon ETS in general might play a positive role in the energy saving and emission reduction targets, whether at the macro or micro level.
2.2.2 The Heterogeneity Green Effect of Carbon ETS
Similar to the European Union (Borrego et al., 2005), China’s early carbon ETS had little impact on reducing carbon emissions, but with the improvement in the transaction mechanism, it became effective (Zhao et al., 2017). Therefore, research focused on the moderating factors affect the green effect of carbon ETS. The existing literature mainly discussed these moderating factors from the outside and the inside of power firms, with the latter having a greater prevalence. As for the external influence, Galán-Valdivieso et al. (2018) argued that the reduction in economic activity reduced the low-carbon effect of the carbon ETS from the point of view of pricing stability. The study by Zheng et al. (2021) concluded that the carbon emission performance of listed companies had improved significantly in eastern coastal pilot areas but had not improved in central or western pilot areas, while Zhou and Zhou (2021) proposed the opposite effect distribution. Different policies implemented by different regions had different effects on the efficiency of the carbon trading market (Zhou et al., 2019), and market-oriented regions performed better (Chen et al., 2021). Furthermore, resource-based cities had a higher carbon emission efficiency (Chen et al., 2021). At the enterprise level, cross-border cooperation might improve carbon trading market efficiency to a certain extent (Zhou et al., 2019). Environmental regulations that were more stringent could help improve the performance of the low-carbon sector of the economy (Xiong and Shen, 2020). Liu et al. (2021) noted that non-state-owned enterprises reduced carbon emissions more than state-owned enterprises in the face of economic policy uncertainty. In addition to the above two aspects, moderators from the carbon emission trading mechanism themselves also had significant impacts, such as the liquidity of the carbon trading market (Zhou et al., 2019) and the allocation principle of carbon emission rights (Zhao and Yang, 2021). In general, the level of regional economic development, regional industrial structure, environmental law enforcement, cross-enterprise cooperation, nature of property rights, and factors from carbon ETS itself might moderate the policy effect of carbon ETS.
2.2.3 The Mediating Green Effect of Carbon ETS
The paper discussed the potential mechanisms of carbon ETS on the green effect for power plants from the functional mechanism of carbon ETS as well as the realization mechanism of energy savings and emissions reduction since there were few studies on the transition to green energy sources. The carbon ETS could contribute to the sustainable development of the environment in a variety of ways. Of these, green technology innovation was the most frequently mentioned. As noted by Chen et al. (2021) and Rickels et al. (2021), carbon ETS significantly enhanced carbon emission efficiency through technological progress effects, energy consumption structure optimization effects, and green innovation effects. Zheng et al. (2021) empirically concluded that carbon ETS stimulated the innovation capability of listed companies, improving the carbon emission performance of listed companies. Luo et al. (2021) concurred and added that green competitiveness might also be a functional mechanism. On the other hand, the marginal abatement cost of CO2 emissions was found to be of great importance for the achievement of emission reduction targets (Xian et al., 2022). The higher the marginal emission reduction cost, the slower the cumulative emission reduction activity growth rate and the emission reduction growth rate of manufacturing enterprises (An et al., 2021). Apart from that, the share of fossil fuels in total energy consumption and energy intensity was also one of the factors affecting carbon emission intensity, whereas corporate innovation failed (Yu et al., 2021). Therefore, it was controversial whether carbon ETS could realize the green promotion of enterprises through technological innovation.
3 Data and Methodology
3.1 Data
This study manually collects and finally obtains research data on 103 listed power firms from 2011 to 2020, a total of 1,030 samples. Among these 103 listed power firms, 96 are on the A-share mainboard, and the remaining seven are from the Hong Kong stock mainboard. Power companies in China are the companies that operate on the grid and own a single or several power plants. We manually collect the clean energy power generation and revenue, thermal power generation and revenue, and the total power generation and revenue from the annual reports disclosed by power companies. As far as we know, this sample data is the most detailed and comprehensive database available publicly at present. Our sample annual power generation can account for 43.83% of the national power generation in 2020, and the trend of the proportion of clean energy power generation is consistent with the national trend according to our statistics from 2011 to 2020. Moreover, 29/34 regions of China are covered by our research database (the rest five are Jiangxi, Qinghai, Taiwan, Tibet Autonomous Region, and Macau Special Administrative Region). During the data collection process, about 124 listed power companies were available, but we ended up retaining only 103 companies. This is mainly because we remove the following two types of power firms: a large number of missing values due to their late establishment; and the lack of data on power generation and power revenue from different sources in their annual reports, making it difficult to determine whether the company has a power generation business. Finally, after subtracting thermal power generation and revenue (clean energy power generation and revenue) from total power generation and revenue to fill in the missing values, this study divides the clean energy power generation by the total power generation to obtain the proportion of green power generation.
This study also manually collects and collates the carbon ETS policy data. As per the pilot provinces selected by China, we download the annually updated lists of companies participating in the carbon ETS from the development and reform commissions of each pilot province. Supplement the policy implementation time data of sample power companies with these lists. The control variables and mediating variables, most of them, are separately collected from the CSMAR and CNRDS databases2. Data on power firms listed on Hong Kong Exchanges and Clearing Limited is primarily collected by their annual reports. As two heterogeneity factors to be detected at the regional level, the regional economic development level is collected from the National Bureau of Statistics of China, and the environmental law enforcement data is from the “China Environmental Statistical Yearbook” and “China Tax Statistical Yearbook.”
3.2 Methodology
3.2.1 MDID Model
According to Yu et al. (2022), this paper applied the multiple-period difference-in-differences (MDID) model, which is widely used to evaluate policy effects with multiple policy time coexistences. This study divides all samples into two groups according to the MDID model. The power companies are put into the experiment group, which consists of not only pilot areas but also members of the carbon ETS, and the other firms are placed in the control group. Using the basic regression of Eq. 1, we observed the function of carbon ETS on the green degree by comparing the changes in the proportion of clean energy power generation, clean energy power generation, and thermal power generation between the experiment group and the control group before and after joining carbon ETS.
Here t and i separately represent the year and listed power firm. The
3.2.2 Variables
The “green degree” is a traditional measure of corporate performance in green transition. Some studies use green competitiveness and low-carbon profit to measure the green degree of enterprises (Ge et al., 2019; Luo et al., 2021). Nevertheless, these indicators only measure the green effect on the economy, ignoring the environmental green effect, which can lead to one-sided estimates of the green degree influenced by carbon ETS policy. For this reason, this paper originally selects the proportion of power generation and power generation to represent the green degree of power plants. Specifically, we use the proportion of clean energy power generation as the main indicator of the green degree of a power plant. The higher the proportion of clean energy power generation, the greater the green degree of the plant. In this paper, clean energy power generation and thermal power generation are examined to assess the carbon ETS policy’s environmental effects, and the increase in clean energy power generation and the decrease in thermal power generation indicate that power plants have become more environmentally friendly. In addition, listed power companies are chosen by this paper since they have more power plants and their power generation represents a significant percentage of China’s power generation.
To control for factors that may explain the change in the green degree of power plants, this study controls three aspects of firm-level characteristics: assets, finances, and capabilities. Company size (size) and asset value (CETA) constitute the asset-level variables, financial risk (DTA) and financial structure stability (FA) constitute the financial-level variables, and capability-level is composed of management capacity (PR), solvency (CA), and profitability (ROA) (Xiong and Shen, 2020; Jing et al., 2021; Zheng et al., 2021; Zheng and Zhang, 2021; Feng et al., 2022). As a measure of green technological innovation, Zhang et al. (2021) analyzed the number of patents as an intermediary variable. One improvement is proposed in this paper. Green technology innovation is measured by the number of green patent inventions. The level of economic development is measured using GDP per capita as one of the heterogeneity factors. Accordingly, the intensity of environmental law enforcement is measured by the proportion of sewage charges or environmental protection taxes to regional GDP. Detailed signs and measurements of all variables involved in this study are provided in Table 1.
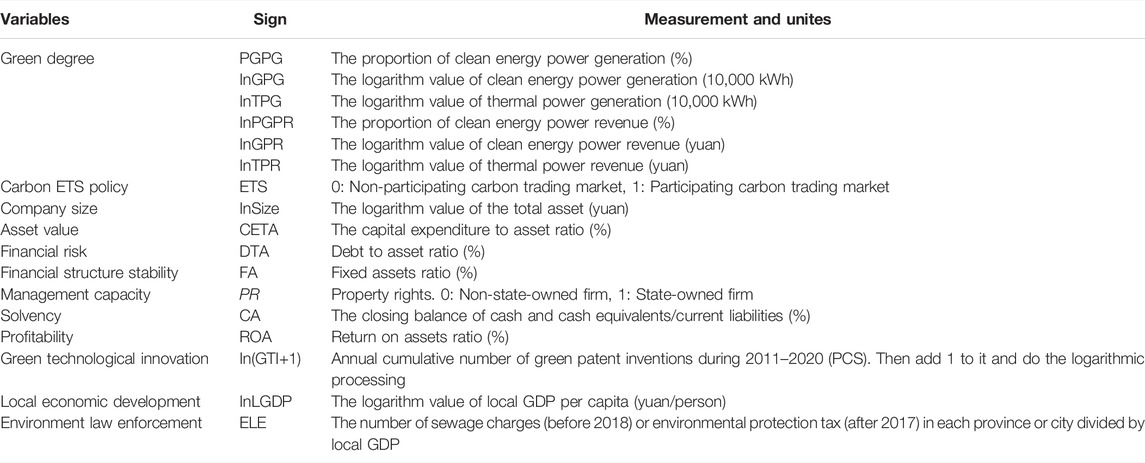
TABLE 1. The signs and measurements of total variables.
3.3 Descriptive Statistics
Table 2 presents descriptive statistics for the main variables in Eq. 1. Considering the incomplete disclosure of information in annual reports, this study was able to obtain 896 samples of data regarding the proportion of clean energy power generation. As indicated by the mean proportion of clean energy power generation of 0.477, thermal power generation remains the dominant force in China’s power generation structure. We can see from the standard deviation of clean energy power generation and thermal power generation that there is a significant difference between listed power firms from 2011 to 2020. The same is true for green power revenues and thermal power revenues. Carbon ETS has a mean value of 0.238, which indicates that the control group has 785 samples while the experiment group has 245 samples. Based on the average value of property rights, most of the power plants investigated in this study are owned by the government, which is consistent with the reality in China. The minimum value of the logarithm of green technology innovation is zero (GTI = 0) and the maximum value is 6.750 (GTI = 853), indicating that the number of green patent inventions of different power companies is quite varied. For the moderating variables, the standard deviation of the local economic development level is smaller than that of green technology innovation, but there are significant differences in the sewage charges per capita between the provinces.

TABLE 2. The descriptive statistics of main variables.
4 Empirical Results
4.1 The Impact of Carbon ETS on Power Plant Green Degree
4.1.1 The Impact of Carbon ETS on the Proportion of Clean Energy Power Generation
This study reflects the impact of carbon ETS on the power plants’ green degree, mainly by analyzing the influence of energy structure on power generation. The MDID model is used to estimate Eq. 1, and the results are presented in Table 3. In column (1), we show the estimated relationship between carbon ETS policy and green power generation structure, characterized by the percentage of clean energy power generation under the firm effect and time effect. Columns (2) and (3) contain the results of tests of the asset and financial characteristics of firms that have been gradually added. As a final control variable, the capability-level variables are added to the regression result in column (4), and the model is also our benchmark model. As we add control variables, the R2 value gets higher and higher, indicating that our regression model is fitting more and more accurately.
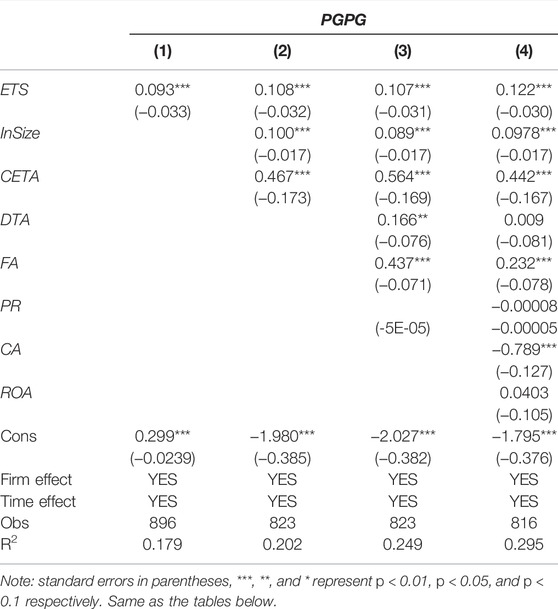
TABLE 3. The regression results of the proportion of clean energy power generation.
In Table 3, it can be seen that the estimated coefficient of ETS is statistically significant only with firm and time-fixed effects. The coefficients of ETS remain significant after the addition of total control variables, and their signs do not change. This suggests that the estimated results are reasonably robust. According to the test results, China’s carbon ETS pilot program has a positive influence on the production of clean energy power and can effectively promote the transition to a green energy structure for power plants. All asset-level characteristics are significant as control variables in this study. The total assets (size) and capital expenditure ratio (asset value) of the power company to which the plant belongs can also contribute to the promotion of green transformation. The fixed asset ratio (financial structure stability) has a positive effect among financial-level control variables, whereas the assets and liabilities ratio (financial risk) does not pass the significance level test. In terms of capability-level characteristics, the coefficient of PR is negative, and this suggests that private power companies have greater advantages in achieving green transformation. Cash ratios also perform negatively, which is because when power companies set aside too much cash from their net profits, they do not have enough funds to support the installation of green transformation equipment. Unlike the two abilities, the return on assets ratio (profitability) has no significant influence. Our results show that characteristics involving assets and capital are more likely to affect the green degree of power plants.
4.1.2 The Impact of Carbon ETS on Power Generation
To help test the relationship between the carbon ETS policy and the green degree for power plants, this study examines the impact on clean energy power generation and thermal power generation. Using clean energy power generation and thermal power generation to symbolize the green degree of power plants and estimate Eq. 1, this paper obtained Table 4’s results. Columns (1) and (2) report the test results with and without the control variables when the explained variable is clean energy power generation. Columns (3) and (4) separately present the results for thermal power generation as the dependent variable.
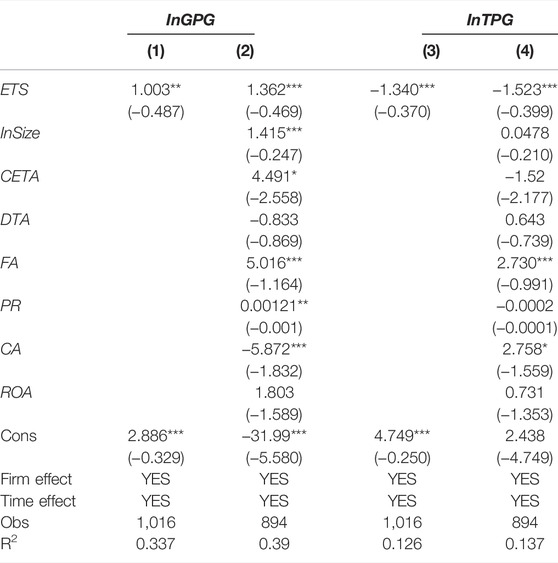
TABLE 4. The regression results of clean and thermal power generation.
Column (1) indicates that the coefficient of ETS is significantly positive at the 5% level, and the significance increases when the control variables in column (2) are included. The regression results suggest that the carbon ETS pilot has a positive effect on clean energy power generation and contributes significantly to green development for power plants. The coefficients of ETS are negative from column (3) to column (4), indicating that the carbon ETS pilot significantly decreases thermal power generation. The above two tests further confirm the main test conclusion that carbon emissions trading policies improve the proportion of clean energy power generation by increasing clean energy power generation and decreasing thermal power generation. From this, we can also conclude that the carbon ETS policy limits thermal power generation at the output end of business activities and positively impacts clean energy usage at the input end of economic activities, thereby promoting the transformation of the clean energy structure within power plants. Improving green degree relies on energy policy to directly adjust the energy structure and energy market. It requires the end of the corresponding management measures to force the input energy to be green and of high quality.
There are two reasons for this. On the one hand, the carbon trading market’s member power companies must control their carbon emissions by reducing the thermal power business of owning power plants, thereby completing their compliance target. Additionally, they desire to keep the company operating and growing, so they strive to minimize the reduction in total power generation as much as possible. In line with the future trend of green development in China, clean energy has been chosen as the main source of electricity generation. Therefore, the increasing effects of clean energy power generation and the decreasing effects of thermal power generation work together to increase the proportion of clean energy power generation and improve the green degree of power plants. On the other hand, as the carbon emissions trading system is improving, the “carbon emission cap” and “free carbon emission allowance” set by governments are gradually tightening. Therefore, member power firms must intensify their efforts and accelerate the pace of the transition to green energy sources.
4.2 Robustness Check
4.2.1 Parallel Trend Analysis
As with other types of DID models, one of the premises of MDID is to satisfy the parallel trend assumption (Bertrand et al., 2001). For the experiment group and control group, the trend of green degrees should be consistent both before and after policy implementation. This study utilizes the “Event Research” method to empirically test the dynamic effects of carbon ETS policy. Test (Eq. 2) is as follows:
In Eq. 2, M and N separately represent the number of periods before and after the policy time point.
Figures 4‐6 show the estimated range of the interaction term coefficient of
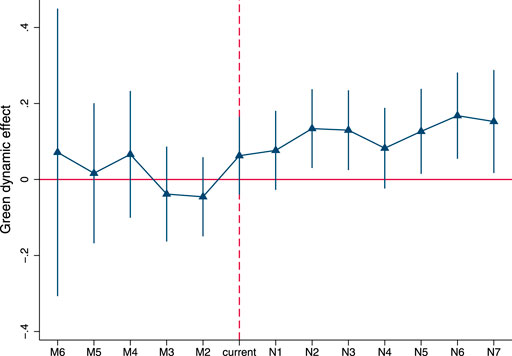
FIGURE 4. Parallel trend test result of the proportion of clean power generation.
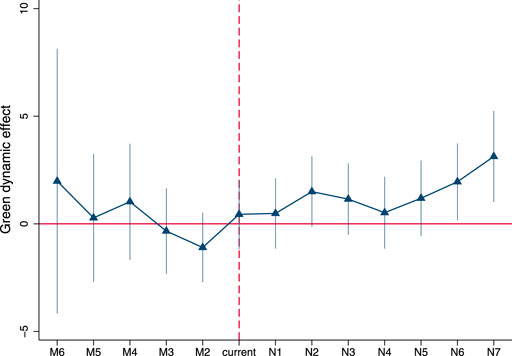
FIGURE 5. Parallel trend test result of clean power generation.
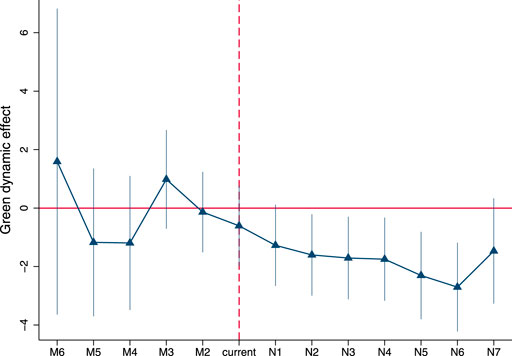
FIGURE 6. Parallel trend test result of thermal power generation.
4.2.2 Placebo Test
In the process of estimating the impact of carbon ETS policy on power plants’ green degree, other unknown factors may affect the selection of pilot provinces. To further test whether the results are driven by such unobserved factors, a placebo test is required by randomly assigning pilot provinces (Chen et al., 2018). Specifically, this study samples 500 times in 103 listed power firms, randomly selects 34 virtual experimental groups as many as the real situation, and takes plants belonging to other power firms as the control group for re-regression. If the results are significant and around the true coefficient values, it indicates that the previous test results are biased. Figures 7‐9 report the distribution of ETS coefficients and the corresponding significance after 500 random allocations. In each figure, the red vertical dashed lines represent the true coefficient value of ETS and the red horizontal dashed lines represent the p-value = 10%. It can be seen that most virtual coefficients of ETS, are all far from the actual value and most of them are not significant at the 10% significance level, which shows that the green effect is caused by the exogenous impact of the carbon ETS policy and has little to do with other factors.
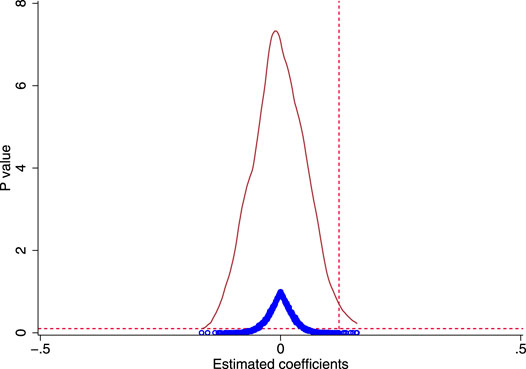
FIGURE 7. Placebo test result of the proportion of clean power generation.
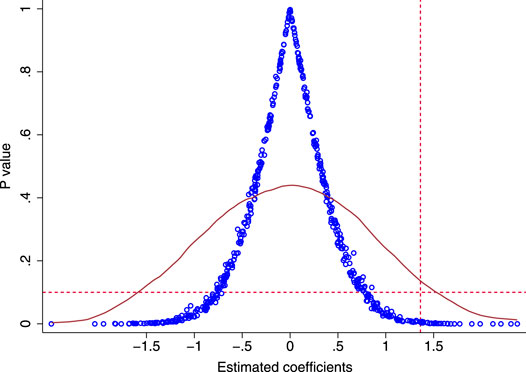
FIGURE 8. Placebo trend test result of clean power generation.
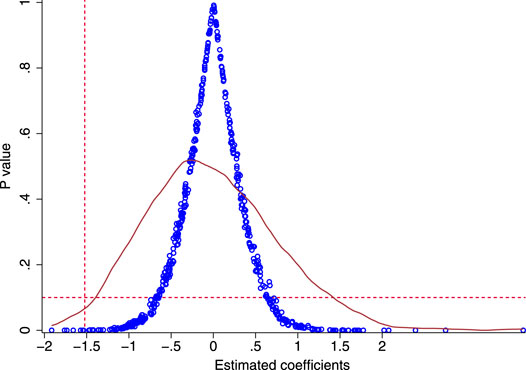
FIGURE 9. Placebo trend test result of thermal power generation.
4.2.3 Other Tests
To further ensure the reliability of the test results, other three robust methods are used in this study. Firstly, add control variables and shorten the sample time period to eliminate the interference of other environmental policies from 2011 to 2020. According to the research of Wang et al. (2022), Liu et al. (2022), and Cheng et al. (2022), the main environmental protection policies in China from 2010 to 2020 are the “Environmental Protection Law of the People’s Republic of China” implemented in 2015, the “Environmental Protection Tax Law of the People’s Republic of China” implemented in 2018, and the “Carbon Peaking and Carbon Neutrality3” goals announced in 2020. Based on the results of the parallel trend test presented in this paper, we can exclude the interference of policies implemented before 2016, including the “Environmental Protection Law of the People’s Republic of China” in 2015. To limit the interference of the “Environmental Protection Tax Law of the People’s Republic of China” policy, we further control regional environmental laws, as measured by sewage charges and environmental taxes, and the results are shown in Panel (A) of Supplementary Table S6. The re-estimated results are still all significant and the signs do not seem to have changed. For other policies in 2017 and later, we delete the data from 2017–2020 to re-regress, and obtain the regression results reported in the Panel (B) of Supplementary Table S7. The conclusion is consistent with our mainstream analysis results. That is, carbon ETS not only significantly increases the proportion of clean energy power generation and clean energy power generation but also significantly decreases thermal power generation for power plants.
Second, change the dependent variables to exclude the bias from the dependent variable, and the results are shown in Panel (C) of Supplementary Table S8. This study replaces the power revenue with the power generation, which is also collected manually. The re-estimated results of the proportion of clean power revenue, clean energy revenue, and thermal power revenue are all significant, and the signs are the same as the previous results. Third, reduce the sample size to eliminate bias from the sample. After removing the extreme values at the 1% level and 99% level, all coefficients of ETS are still significant and have the same signs as the mainstream regression results, which can be seen from Panel (D) of Supplementary Table S9. The results of these three robustness tests show that the carbon ETS policy can increase the green degree of power plants by promoting the use of clean energy and limiting the use of thermal power, and this finding is not a result of factors other than the variables and samples used in this study. As of the length of the article, the regression results are not presented as a table in the main text (due to the limited number of figures, the tables in this section are provided as the Supplementary Material).
4.3 The Heterogeneous Factors of Carbon Emissions Trading on Power Plant Green Degree
According to the above analysis, China’s carbon emission trading pilot program can enhance the green degree of its power plants. Despite this, the resource endowment of the various provinces differs considerably, causing the economic growth patterns to differ, as well as the uneven development characteristics, especially for power firms. As a result, this study examines the potential influence of factors both inside and outside of the company on the green effect of the carbon ETS. Based on the company-level sample highly coinciding with the proportion of national clean electricity generation, the analysis may conceal regional differences to a certain extent. Therefore, Eq. 3 is developed.
Here
The heterogeneity analysis results are shown in Table 5. Column (1), column (2), and column (3) report the examined results of the firm-level moderators. The coefficient of ETS*FA is significantly positive while the coefficients of ETS*DTA and ETS*PR are significantly negative. This result suggests that the fixed asset ratio can improve the green efficiency of the carbon ETS policy and accelerate the green transition for power plants. However, the debt to asset ratio weakens the green efficiency of the carbon ETS policy and slows down the process of green energy structure transition. Moreover, compared to the state-owned companies, the private ones have a greener effect on carbon ETS pilots. Column (4) reports the examined result of regional economic development, and the result of environmental law enforcement is shown in column (5). Both the coefficient of ETS*InLGDP and the coefficient of ETS*ELE are significantly positive, which indicates that carbon ETS policies in provinces with higher levels of economic development and more expensive environmental pollution costs have better green effects on power plants. In general, a total of four moderating factors are found in this study, among them, the higher fixed asset ratio and economic development level, the stricter environmental enforcement, and the presence of privately-owned power plants tend to improve the green efficiency of carbon ETS policy.
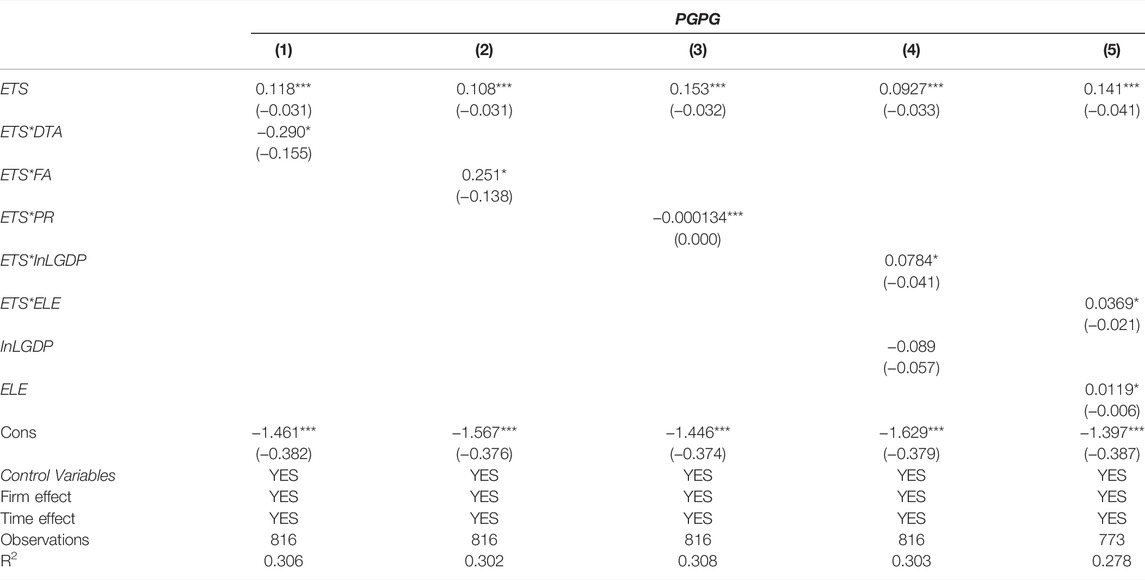
TABLE 5. The heterogeneity test results.
In the ratio of debt to assets, the financial leverage is reflected, which indicates the financial risk of the company in which the power plant is located. The greater the financial risk, the less likely the company is to obtain financing from a bank or other financial institution. If power companies need a great deal of financial support to achieve green transformation, a lower asset-liability ratio is more beneficial for the carbon ETS policy to have a green effect on power plants. The fixed asset ratio reflects, in part, the green power generation equipment owned by power companies that converts clean energy into electricity. As power companies increasingly possess more and more efficient green power generation equipment, driven by the carbon ETS policy, it becomes easier for them to realize the plan of replacing thermal power with green electricity and improve the efficiency of green power generation equipment to accelerate their green transformation. As a result, the higher the fixed asset ratio, the more the power company invests in green power generation equipment, and the more effective the carbon ETS policy is for power plants owned by power companies. Another important firm-level moderator for the carbon ETS is the power company’s property rights. Green policies such as carbon ETS may promote corporate social responsibility to a certain extent, thereby improving the green performance of power companies (Ang et al., 2022). This improvement in efficiency is commonly seen in private-owned power companies, so the carbon ETS policy results in greener power plants (Ang et al., 2022; Fan et al., 2022).
From the perspective of the power company, regions with high economic development levels often consume more electricity, which increases the demand for green electricity in the context of energy constraints and carbon emission reduction policies and thus promotes the green transition of power plants. Additionally, regional environmental law enforcement also plays a positive role in the carbon ETS policy’s effect. For those power companies with strict environmental enforcement in their locations, carbon ETS’s “compliance” mechanism further increases their carbon emission cost burden based on high pollution charges and environmental protection taxes, so it doubles the role of forcing power companies to make green transitions.
4.4 The Impact Mechanism of Carbon Emissions Trading on Power Plant Green Degree
Carbon emission trading can effectively promote green improvements for power plants in pilot provinces. How can this improvement be accomplished? Based on the literature review and theoretic analysis, the study examines the impact mechanism of China’s carbon emission trading system on power plants’ green improvements by examining green technological innovation as the mediator. Referring to the research of Baron and Kenny (1986), the following Eq. 4 and Eq. 5 are designed as follows:
Here
The results are shown in Table 6. It can be seen from column (1) that the total effect of carbon ETS pilots on the power plants’ green degree is 0.122 at a 1% significance level. Column (2) reports the estimated result of carbon ETS policy on green technology innovation, and column (3) shows the result of the mediation by incorporating the green technology innovation into the benchmark model. From column (2), we can see that the carbon ETS policy has a positive impact on the number of green patent inventions at a significance level of 1%, indicating that the implementation of the carbon ETS pilots can effectively promote green technological progress, achieve green innovation, and reduce dependence on fossil energy. In column (3), the regression coefficient of the carbon ETS policy is significantly positive, and the value of it is 0.121, which is less than 0.122, indicating that the carbon ETS policy can achieve a green effect by promoting power firms’ green technological progress. Green technological innovation is a partial intermediary variable.

TABLE 6. The results of the mechanical test.
This may be explained as follows. Having previously mentioned, with the gradual tightening of the “carbon emission cap” and “free carbon emission allowances”, members of the carbon ETS have decided to replace fossil fuel with clean energy to produce electricity. However, their current power generation equipment and technologies are only suitable for thermal power generation. Therefore, technological innovation is essential to successfully achieving the green transformation of thermal power plants. Similarly, to achieve carbon compliance goals, both thermal power plants and clean power plants are also working to develop more advanced technologies to reduce carbon emissions beyond the power generation process, such as transmission, transformation, and distribution.
5 Conclusion and Policy Implication
Environmental and energy problems have become increasingly serious, which has led to higher standards for green development. China, one of the main drivers of global economic growth, underpinned by the green energy structure transition target, must urgently improve policies’ efficiency and achieve a low-carbon development that is cost-efficient. However, there are few studies evaluating the effect of China’s carbon ETS policy on the green transition for the power sector, which is the key executor determining the success of this “carbon peaking and carbon neutrality” campaign. Based on this, this study manually collects a panel data set, comprising 1,030 observations from 103 listed power companies from 2011 to 2020, to investigate the impact of the carbon ETS on power plants’ green degree using a multiple-period difference-in-differences model. We conclude that: 1) A series of robustness test methods show that China’s carbon ETS significantly enhances the green degree, and this green transformation is achieved by increasing clean power generation and decreasing thermal power generation. 2) Heterogeneity test results demonstrate that the carbon ETS’s green effect is enhanced in private power plants. Further, decreasing the debt to asset ratio and increasing the fixed asset ratio of power companies to which the power plants belong as well as improving the level of economic development and penalties for environmental pollution can help strengthen the green effect of the carbon ETS pilot program. 3)The mechanism test result shows that the carbon emissions trading market can significantly increase the green degree by promoting green technological innovation, but it is not the only factor. These conclusions provide guidance for China to achieve the green energy structure transition and provide examples for green development for other countries through the application of market-oriented policies.
The following policy recommendations are derived from the above research conclusions. First, China should broaden the scope of the carbon ETS policy implementation and accelerate the establishment of the unified national carbon emissions trading system in the new stage of the green energy structure transition. The first national carbon market could take the form of a carbon ETS pilot, in which the power sector serves as the sole member sector and a “compliance” mechanism would be used to limit the power sector’s carbon emissions. In addition, the “carbon emission cap” and the “free carbon emission allowances” could be moderately tightened according to our findings. In promoting the green transition for and beyond the power sector, countries should place greater emphasis on market-oriented environmental policies. Second, China should formulate provincial balanced development strategies to prevent the disparities among power companies caused by imbalanced development and increase enforcement of environmental laws in provinces with a low amount of environmental protection taxes to improve the carbon ETS policy’s efficiency. Countries with similar conditions to China could refer to China’s experience when implementing carbon ETS policies. In the initial stages of carbon trading, the principle of allocating carbon emission rights could be based on free-form allocation, which gradually increases the proportion of paid carbon emission rights. A targeted principle considering different power companies and regions with significant moderating characteristics should also be incorporated into the final principle of carbon emission rights allocation. Third, China needs to create an environment that encourages green technology innovation through fiscal subsidies and tax incentives, and it needs to encourage power enterprises to actively explore new green technologies. The interaction and cooperation between environmental policies and other industrial policies should be given more attention by countries as a possible way to create the conditions for the green mediation effect. Finally, the power industry should increase its awareness of environmental responsibility and convert its power distribution systems voluntarily. It can be achieved by increasing environmental protection publicity and education activities for power companies and encouraging them to implement green development initiatives within their companies. Also, integrating carbon taxes into market mechanisms for carbon markets can increase the cost of carbon emissions for power companies, forcing them to make a voluntary green transition. There is a need for both China and other countries to continue developing clean energy vigorously, supplement the discovery of other influencing factors and mechanisms that affect the green transformation of the power sector, and explore measures that are more conducive to converting the power sector to a green energy structure.
Data Availability Statement
The raw data supporting the conclusion of this article will be made available by the authors without undue reservation.
Author Contributions
Conceptualization, MS and JW; methodology and writing original-draft, JX and TZ; software, MS, JX, and TZ; data curation, TZ; writing review and editing, JX and JW; supervision, MS, JX, and JW. All authors have read and agree with the published version of the article.
Funding
This research was funded by the National Natural Science Foundation of China (Grant number 71903008).
Conflict of Interest
The authors declare that the research was conducted in the absence of any commercial or financial relationships that could be construed as a potential conflict of interest.
Publisher’s Note
All claims expressed in this article are solely those of the authors and do not necessarily represent those of their affiliated organizations, or those of the publisher, the editors, and the reviewers. Any product that may be evaluated in this article, or claim that may be made by its manufacturer, is not guaranteed or endorsed by the publisher.
Supplementary Material
The Supplementary Material for this article can be found online at: https://www.frontiersin.org/articles/10.3389/fenrg.2022.906033/full#supplementary-material
Footnotes
1Carbon emission allowance represents carbon emission right. One carbon emission allowance is equal to one carbon emission right.
2China Stock Market Accounting Research (CSMAR) and Chinese Research Data Services (CNRDS) databases are research-based accurate databases in the economic and financial fields developed by China in accordance with China’s actual national conditions. They have been widely used by Chinese researchers.
3“Carbon Peaking and Carbon Neutrality” is China’s emission reduction target committed to the world. It means that carbon dioxide emissions will no longer increase before 2030 and will gradually decrease after reaching a peak. Before 2060, all carbon dioxide emissions will be offset by various methods such as tree planting, energy conservation, emission reduction, and carbon neutrality.
References
An, Y., Zhou, D., Yu, J., Shi, X., and Wang, Q. (2021). Carbon Emission Reduction Characteristics for China's Manufacturing Firms: Implications for Formulating Carbon Policies. J. Environ. Manag. 284, 112055. doi:10.1016/j.jenvman.2021.112055
Ang, R., Shao, Z., Liu, C., Yang, C., and Zheng, Q. (2022). The Relationship between CSR and Financial Performance and the Moderating Effect of Ownership Structure: Evidence from Chinese Heavily Polluting Listed Enterprises. Sustain. Prod. Consum. 30, 117–129. doi:10.1016/j.spc.2021.11.030
Baron, R. M., and Kenny, D. A. (1986). The Moderator-Mediator Variable Distinction in Social Psychological Research: Conceptual, Strategic, and Statistical Considerations. J. Personality Soc. Psychol. 51, 1173–1182. doi:10.1037/0022-3514.51.6.1173
Bertrand, M., Duflo, E., and Mullainathan, S. (2001). How Much Should We Trust Differences-In-Differences Estimates? SSRN J. doi:10.2139/ssrn.288970
Borrego, C., Martins, H., and Lopes, M. (2005). Portuguese Industry and the EU Trade Emissions Directive: Development and Analysis of CO2 Emission Scenarios. Environ. Sci. Policy 8, 75–84. doi:10.1016/j.envsci.2004.08.008
Bp Statistical Review of World Energy (2021). Available online at: https://www.bp.com/en/global/corporate/energy-economics/statistical-review-of-world-energy.html. (February 13, 2022).
Cao, C., Cui, X., Cai, W., Wang, C., Xing, L., Zhang, N., et al. (2019). Incorporating Health Co-benefits into Regional Carbon Emission Reduction Policy Making: A Case Study of China's Power Sector. Appl. Energy 253, 113498. doi:10.1016/j.apenergy.2019.113498
Chang, S., Yang, X., Zheng, H., Wang, S., and Zhang, X. (2020). Air Quality and Health Co-benefits of China's National Emission Trading System. Appl. Energy 261, 114226. doi:10.1016/j.apenergy.2019.114226
Chen, L., Liu, Y., Gao, Y., and Wang, J. (2021). Carbon Emission Trading Policy and Carbon Emission Efficiency: An Empirical Analysis of China's Prefecture-Level Cities. Front. Energy Res. 9, 793601. doi:10.3389/fenrg.2021.793601
Chen, Y. J., Li, P., and Lu, Y. (2018). Career Concerns and Multitasking Local Bureaucrats: Evidence of a Target-Based Performance Evaluation System in China. J. Dev. Econ. 133, 84–101. doi:10.1016/j.jdeveco.2018.02.001
Cheng, B., Qiu, B., Chan, K. C., and Zhang, H. (2022). Does a Green Tax Impact a Heavy-Polluting Firm's Green Investments? Appl. Econ. 54, 189–205. doi:10.1080/00036846.2021.1963663
China National DevelopmentReform Commission (2021). Ministry of Ecology and Environment: “Thirteenth Five-Year Plan” Has Achieved Remarkable Results in Tackling Climate Change. Available online at: https://www.ndrc.gov. Available online at: https://www.ndrc.gov.cn/xwdt/ztzl/2021qgjnxcz/bmjncx/202108/t20210827_1 294892.html?code= &state=123. (Accessed on December 8, 2021).
Choi, Y., Liu, Y., and Lee, H. (2017). The Economy Impacts of Korean ETS with an Emphasis on Sectoral Coverage Based on a CGE Approach. Energy Policy 109, 835–844. doi:10.1016/j.enpol.2017.06.039
Fan, R., Pan, J., Yu, M., and Gao, H. (2022). Corporate Governance of Controlling Shareholders and Labor Employment Decisions: Evidence from a Parent Board Reform in China. Econ. Model. 108, 105753. doi:10.1016/j.econmod.2021.105753
Fang, G., Lu, L., Tian, L., he, Y., and Yin, H. (2020). Research on the Influence Mechanism of Carbon Trading on New Energy-A Case Study of ESER System for China. Phys. A Stat. Mech. its Appl. 545, 123572. doi:10.1016/j.physa.2019.123572
Feng, C., Zhu, X., Gu, Y., and Liu, Y. (2022). Does the Carbon Emissions Trading Policy Increase Corporate Tax Avoidance? Evidence from China. Front. Energy Res. 9, 821219. doi:10.3389/fenrg.2021.821219
Galán-Valdivieso, F., Villar-Rubio, E., and Huete-Morales, M.-D. (2018). The Erratic Behaviour of the EU ETS on the Path towards Consolidation and Price Stability. Int. Environ. Agreements 18, 689–706. doi:10.1007/s10784-018-9411-3
Ge, S., Yu, X., Zhou, D., and Sang, X. (2019). The Integrated Effect of Carbon Emissions Trading and Pollution Rights Trading for Power Enterprises-A Case Study of Chongqing. Sustainability 11, 3099. doi:10.3390/su11113099
IEA (2021). Renewables 2020 Global Status Report. Available online at: https://www.ren21.net/wp-content/uploads/2019/05/gsr_2020_full_report_en.pdf. (Accessed on February 13, 2022).
International Carbon Action Partnership (2021). Emission Trading Worldwide Status Report. Available at: https://icapcarbonaction.com/en?option=com_attach&task=download&id=723 (Accessed on February 13, 2022).
Jing, S., Li, Y., and Sun, Y. (2021). R & D Attention and Profit Performance-An Empirical Study on Listed Companies in China's Electric Power and Electrical Industries. Sustainability 13, 8387. doi:10.3390/su13158387
Liang, M., Wang, Y., and Wang, G. (2014). China's Low-Carbon-City Development with ETS: Forecast on the Energy Consumption and Carbon Emission of Chongqing. Energy Procedia 61, 2596–2599. doi:10.1016/j.egypro.2014.12.256
Liu, G., Yang, Z., Zhang, F., and Zhang, N. (2022). Environmental Tax Reform and Environmental Investment: A Quasi-Natural Experiment Based on China's Environmental Protection Tax Law. Energy Econ. 109, 106000. doi:10.1016/j.eneco.2022.106000
Liu, X., Ji, Q., and Yu, J. (2021). Sustainable Development Goals and Firm Carbon Emissions: Evidence from a Quasi-Natural Experiment in China. Energy Econ. 103, 105627. doi:10.1016/j.eneco.2021.105627
Luo, Y., Li, X., Qi, X., and Zhao, D. (2021). The Impact of Emission Trading Schemes on Firm Competitiveness: Evidence of the Mediating Effects of Firm Behaviors from the Guangdong ETS. J. Environ. Manag. 290, 112633. doi:10.1016/j.jenvman.2021.112633
Ma, Q., Murshed, M., and Khan, Z. (2021). The Nexuses between Energy Investments, Technological Innovations, Emission Taxes, and Carbon Emissions in China. Energy Policy 155, 112345. doi:10.1016/j.enpol.2021.112345
Ning, W., Zhao, L., and Bei, Z. (2021). Analysis of the Impact of China's Energy Consumption Structure on Energy Security. E3S Web Conf. 245, 01054. doi:10.1051/e3sconf/202124501054
Nogrady, B. (2021). China Launches World's Largest Carbon Market: but Is it Ambitious Enough? Nature 595, 637. doi:10.1038/d41586-021-01989-7
Presno, M. J., Landajo, M., and González, P. F. (2021). GHG Emissions in the EU-28. A Multilevel Club Convergence Study of the Emission Trading System and Effort Sharing Decision Mechanisms. Sustain. Prod. Consum. 27, 998–1009. doi:10.1016/j.spc.2021.02.032
Qi, C., and Choi, Y. (2020). A Study on the CO2 Marginal Abatement Cost of Coal-Fueled Power Plants: Is the Current Price of China Pilot Carbon Emission Trading Market Rational? Carbon Manag. 11, 303–314. doi:10.1080/17583004.2020.1755596
Rickels, W., Proelß, A., Geden, O., Burhenne, J., and Fridahl, M. (2021). Integrating Carbon Dioxide Removal into European Emissions Trading. Front. Clim. 3, 690023. doi:10.3389/fclim.2021.690023
Smith, A., and Sorrell, S. (2001). Interaction between Environmental Policy Instruments: Carbon Emissions Trading and Integrated Pollution Prevention and Control. Ijep 15, 22. doi:10.1504/IJEP.2001.000592
State Council of China Guiding (2021). Opinions of the State Council on Accelerating the Establishment and Improvement of a Green and Low-Carbon Circular Development Economic. Available at: http://www.gov.cn/zhengce/content/2021-02/22/content_5588274.htm?pc. (December 8, 2021).
Sun, H., Samuel, C. A., Kofi Amissah, J. C., Taghizadeh-Hesary, F., and Mensah, I. A. (2020). Non-linear Nexus between CO2 Emissions and Economic Growth: A Comparison of OECD and B&R Countries. Energy 212, 118637. doi:10.1016/j.energy.2020.118637
Tang, L., Wu, J., Yu, L., and Bao, Q. (2015). Carbon Emissions Trading Scheme Exploration in China: A Multi-Agent-Based Model. Energy Policy 81, 152–169. doi:10.1016/j.enpol.2015.02.032
Wang, J., and Li, J. (2021). Exploring the Impact of International Trade on Carbon Emissions: New Evidence from China's 282 Cities. Sustainability 13, 8968. doi:10.3390/su13168968
Wang, Y., Hu, J., Hu, Y., and Wang, Y. (2022). Which Is More Effective: The Carrot or the Stick? Environmental Policy, Green Innovation and Enterprise Energy Efficiency-A Quasi-Natural Experiment from China. Front. Environ. Sci. 10, 870713. doi:10.3389/fenvs.2022.870713
Weizsacker, E. U. V. (1990). Global Warming and Environmental Taxes. Int. J. Glob. Energy Issues 2, 14–19. doi:10.1504/IJGEI.1990.063733
Xian, Y., Yu, D., Wang, K., Yu, J., and Huang, Z. (2022). Capturing the Least Costly Measure of CO2 Emission Abatement: Evidence from the Iron and Steel Industry in China. Energy Econ. 106, 105812. doi:10.1016/j.eneco.2022.105812
Xiong, H., and Shen, Y. (2020). Influence of Government Subsidies for Green Technology Development on the Performance of Chinese New-Energy Automobile Enterprises. Nept 19, 1593–1598. doi:10.46488/NEPT.2020.v19i04.026
Yu, J., Shi, X., Guo, D., and Yang, L. (2021). Economic Policy Uncertainty (EPU) and Firm Carbon Emissions: Evidence Using a China Provincial EPU Index. Energy Econ. 94, 105071. doi:10.1016/j.eneco.2020.105071
Yu, S., Chen, Y., Pu, L., and Chen, Z. (2022). The CO2 Cost Pass-Through and Environmental Effectiveness in Emission Trading Schemes. Energy 239, 122257. doi:10.1016/j.energy.2021.122257
Zhang, H., and Zhang, B. (2020). The Unintended Impact of Carbon Trading of China's Power Sector. Energy Policy 147, 111876. doi:10.1016/j.enpol.2020.111876
Zhang, X.-m., Lu, F.-f., and Xue, D. (2021). Does China's Carbon Emission Trading Policy Improve Regional Energy Efficiency?-An Analysis Based on Quasi-Experimental and Policy Spillover Effects. Environ. Sci. Pollut. Res. 29, 21166–21183. doi:10.1007/s11356-021-17021-4
Zhang, X., Löschel, A., Lewis, J., Zhang, D., and Yan, J. (2020). Emissions Trading Systems for Global Low Carbon Energy and Economic Transformation. Appl. Energy 279, 115858. doi:10.1016/j.apenergy.2020.115858
Zhao, B., and Yang, W. (2021). Allocation of Carbon Emission Allowance Based on DLA-GA Model: a Case Study in China. Environ. Sci. Pollut. Res. 29, 15743–15762. doi:10.1007/s11356-021-16643-y
Zhao, X.-g., Wu, L., and Li, A. (2017). Research on the Efficiency of Carbon Trading Market in China. Renew. Sustain. Energy Rev. 79, 1–8. doi:10.1016/j.rser.2017.05.034
Zhao, X., Zhang, Y., Liang, J., Li, Y., Jia, R., and Wang, L. (2018). The Sustainable Development of the Economic-Energy-Environment (3E) System under the Carbon Trading (CT) Mechanism: A Chinese Case. Sustainability 10, 98. doi:10.3390/su10010098
Zheng, Y., Sun, X., Zhang, C., Wang, D., and Mao, J. (2021). Can Emission Trading Scheme Improve Carbon Emission Performance? Evidence from China. Front. Energy Res. 9, 759572. doi:10.3389/fenrg.2021.759572
Zheng, Y., and Zhang, W. (2021). The Influence of Government Subsidies on Enterprise Innovation Performance.” in Proceedings of the 6th Annual International Conference on Social Science and Contemporary Humanity Development (SSCHD 2020). Xi’an, Shaanxi, China: Atlantis Press. doi:10.2991/assehr.k.210121.152
Zhou, C., and Zhou, S. (2021). China's Carbon Emission Trading Pilot Policy and China's Export Technical Sophistication: Based on DID Analysis. Sustainability 13, 14035. doi:10.3390/su132414035
Zhou, J., Huo, X., Jin, B., and Yu, X. (2019). The Efficiency of Carbon Trading Market in China: Evidence from Variance Ratio Tests. Environ. Sci. Pollut. Res. 26, 14362–14372. doi:10.1007/s11356-019-04778-y
Keywords: the carbon emissions trading scheme, green energy structure transition, power plants, green technological innovation, heterogeneous effects
Citation: Shi M, Zou T, Xu J and Wang J (2022) Can Carbon Emissions Trading Scheme Make Power Plants Greener? Firm-Level Evidence From China. Front. Energy Res. 10:906033. doi: 10.3389/fenrg.2022.906033
Received: 28 March 2022; Accepted: 29 April 2022;
Published: 15 June 2022.
Edited by:
Jian Yu, Central University of Finance and Economics, ChinaReviewed by:
Huaping Sun, Jiangsu University, ChinaJiasha Fu, Southwestern University of Finance and Economics, China
Copyright © 2022 Shi, Zou, Xu and Wang. This is an open-access article distributed under the terms of the Creative Commons Attribution License (CC BY). The use, distribution or reproduction in other forums is permitted, provided the original author(s) and the copyright owner(s) are credited and that the original publication in this journal is cited, in accordance with accepted academic practice. No use, distribution or reproduction is permitted which does not comply with these terms.
*Correspondence: Jie Wang, wangjie8912@btbu.edu.cn