Numerical Simulation Study on Optimal Shut-In Time in Jimsar Shale Oil Reservoir
 Xi Chen1
  Jian Zhu
 Fei Wang
- 1PetroChina Xinjiang Oilfield Company, Karamay, China
- 2Education Ministry Key Laboratory of Petroleum Engineering, China University of Petroleum, Beijing, China
- 3Institute of Petroleum, China University of Petroleum-Beijing, Karamay, China
The volume fracturing technology along with horizontal well is the main technology to obtain commercial oil flow in shale reservoirs because of the low porosity and low permeability. Whether the fracturing fluid has the potential of shale matrix imbibition oil recovery after a large amount of slickwater injected into the reservoir is a research hotspot at present. Therefore, it is of great significance to study the law of imbibition and replacement during the shut-in time. Aiming at the Jimsar area, there are several steps in this study in order to explore the new law of fracturing fluid imbibition and oil recovery in shale reservoirs. Primarily, the distribution of pressure and saturation during fracturing time and shut-in time is accurately described by the numerical simulation method. Furthermore, the sensitivity analysis is carried out from two aspects of geological and fracture factors. Eventually, the evaluation of optimal shut-in time is taken by imbibition replacement balance. According to the numerical simulation results, the pressure diffuses rapidly among the matrix during the shut-in time in the hydrophilic reservoir. After 65 days of well shut-in, the whole reservoir tends to be at the same pressure and reaches the equilibrium of imbibition replacement. Contrarily, the pressure of the lipophilic reservoir diffuses slowly and only propagates in the secondary fracture or the matrix near the fractures. The fracture system remains a “high-pressure area” for a long time during shut-in. Additionally, the optimal shut-in time chart of different geological parameters and fracture parameters is drawn to optimize the shut-in time. This research work has a certain reference value for the optimization of shut-in time after fracturing in Jimsar and similar shale oil wells.
Introduction
Nowadays, oil and gas are still irreplaceable and non-renewable energy all over the world. However, with the decline of recoverable reserves of conventional resources year by year, shale oil, as a new unconventional resource with great potential, has become an important part of global oil and gas resources (Greene et al., 2003). This research focuses on a typical shale reservoir located in the Permian Lucaogou Formation in Jimsar Sag, Jungar Basin, with a total exploration area of about 13,000 km2 (Li et al., 2015; Guo et al., 2019; Erting et al., 2020). The discussed area has the characteristics of medium–low porosity and low–ultra-low permeability. The average overburden porosity is 6 ∼ 16%. The overburden permeability is less than 0.1mD (Wang et al., 2020). There are two sweet spots with great differences in physical properties developed in the study area. The upper sweet spot is weak hydrophilic, and the lower sweet spot is weak lipophilic (Wu et al., 2019; Ma et al., 2020). At present, the volume fracturing technology along with horizontal wells is the key technology for shale reservoirs to obtain commercial oil flow (Sun et al., 2019). Hydraulic fractures can communicate and expand natural fractures, or induce micro-fractures to secondary hydraulic fractures through large-scale segmented and multi-cluster fracturing (Zhou et al., 2007; Zhu et al., 2015; Khanna and Kotousov, 2016; Zhang et al., 2018). Then, interconnected complex fracture networks formed in reservoirs can increase the reconstruction volume and improve single-well productivity greatly. Slickwater is generally used in unconventional reservoirs compared to conventional low-permeability reservoir fracturing. On the one hand, the cost of slickwater is relatively low. On the other hand, slickwater helps to form a complex fracture network as a consequence of low viscosity (Qu et al., 2020; Shi et al., 2020; Zhang et al., 2021). The capillary pressure plays a significant role in the process of well shut-in time after fracturing. The main power of imbibition comes from a capillary force (Handy 1960; Li 2006; Li et al., 2007). The wettability of the reservoir determines the magnitude of the capillary force (Wang et al., 2017). The slickwater retained in the reservoir can be imbibed into the hydrophilic reservoir after long-term well shut-in. At the same time, part of the crude oil in the matrix will be replaced into the fracture. The imbibition and replacement could improve the productivity of the oil well and the recovery of crude oil (Sherman and Holditch, 1991; Bazin et al., 2010; Mohammadmoradi and Kantzas, 2018). A complex fracture network composed of hydraulic main fractures and open secondary fractures will be formed after large-scale slickwater fracturing. Then, the fractured network becomes the main seepage channel connecting the wellbore and matrix. The statistical study of the distribution of shut-in time and production after fracturing on some horizontal wells in the area is shown in Figure 1. Prolonging the shut-in time of the upper sweet spot wells can improve the initial oil production to some extent. However, there is a large difference between the wells, while the shut-in time of the lower sweet spot well has little impact on the initial production after fracturing. From Figure 1, the distribution of shut-in time is wide and irregular. The imbibition and replacement mechanism during shut-in time is indeterminate. At present, the selection of shut-in time of Jimsar horizontal well mainly comes from historical construction experience. The selection of well production time lacks scientific basis.
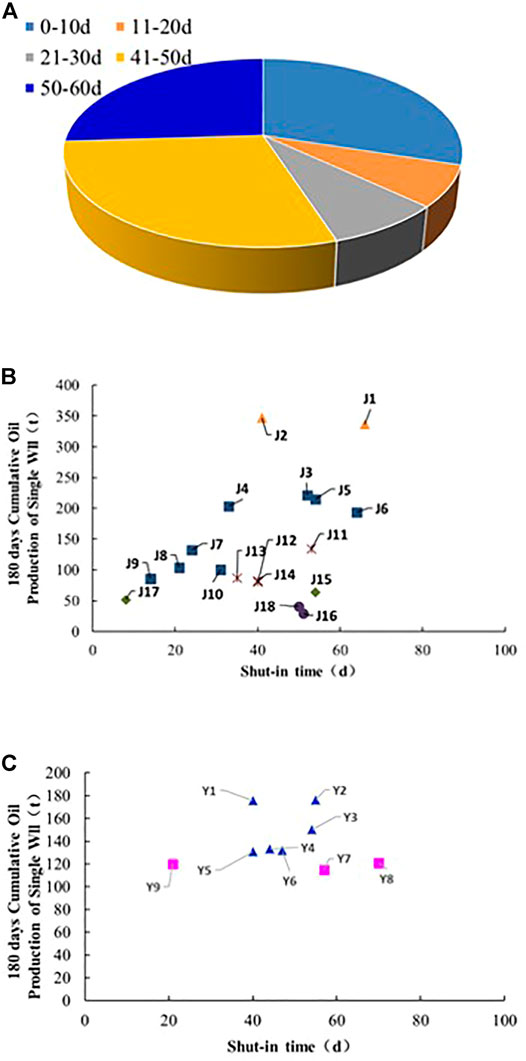
FIGURE 1. (A) Distribution of shut-in time after fracturing horizontal well in Jimsar; and (B) production distribution of horizontal well map after fracturing in the upper sweet spot; and (C) production distribution of horizontal well map after fracturing in the lower sweet spot.
Based on the abovementioned research on the production status of multistage fracturing of Jimsar horizontal well, in order to maximize the role of imbibition and replacement during well shut-in and improve the development effect of the shale oil fractured horizontal well, it is necessary to carry out the research on the law of imbibition and replacement during the well shut-in. Combined with the multiscale seepage characteristics of the Jimsar shale reservoir after fracturing, a triple-medium oil–water two-phase shut-in model is established to clarify the dynamic distribution of oil and water in the three flow areas of main hydraulic fracture, secondary hydraulic fracture, and matrix during well shut-in. Then, the water imbibition and oil replacement mechanism of fracturing fluid are explained by the simulation results. The results of this work can grasp the mechanism of fracturing fluid imbibition and oil replacement and clarify the oil–water dynamic distribution during the shut-in period to decide the reasonable shut-in time in Jimsar shale.
Numerical Simulation Method
Assumptions
① Shale oil reservoir is composed of shale matrix, secondary hydraulic fractures, and main fractures. Also, the liquid can flow among triple media.
② The main fracture is a discrete vertical fracture with two symmetrical wings distributed at both ends of the horizontal wellbore. The fracture height is equal to the reservoir thickness.
③ The secondary hydraulic fractures are discrete vertical fractures and orthogonal to the main fractures, which are distributed in the matrix grid of the reconstruction area.
④ Two-phase (oil and water) flow among the triple media. Fluid and rock are slightly compressible.
⑤ The fluid flow is isothermal seepage.
Main Governing Equations
The governing equation of oil phase flow is as follows:
where So is the oil saturation; ρo is the oil viscosity (mPa·s); φ is the porosity of matrix; kro is the relative permeability of oil; ηo is the mobility of oil; Δpo is the pressure difference of oil in different media.
The governing equation of water phase flow is as follows:
where Sw is the water saturation; ρw is water viscosity (mPa·s); φ is the porosity of matrix; krw is the relative permeability of water (mD); ηw is the mobility of oil; and Δpw is the pressure difference of water in different media.
where So is the oil saturation; Sw is the water saturation; and Pc is the capillary pressure (Pa).
Methodology
Various models are constructed by fully exploiting the functions of the commercial reservoir simulation software (CMG IMEX) based on the assumptions and equations. The reservoir consists of triple media: main hydraulic fracture (HF), second hydraulic fracture (SF), and matrix(M). The models show single-porosity, while the fracture system is set up by adopting logarithmic local grid refinement. Due to the great differences in reservoir properties and oiliness in different sweet spots in Jimsar, the upper and lower sweet spot of fracture element grid models are established. As shown in Figure 2, the horizontal wellbore is along the x-axis direction and the hydraulic fracture is along the y-axis direction. Diverse color represents different permeability. The red region represents the main hydraulic fracture with high conductivity, and the blue region represents the secondary hydraulic fracture with low conductivity. The whole numerical simulation process is divided into two stages: the fracturing fluid injection stage and the well shut-in stage. Through the numerical simulation of the fracturing fluid injection stage, the real distribution of different medium (HF, SF, and M) pressure and fluid saturation after fracture of formation is simulated.
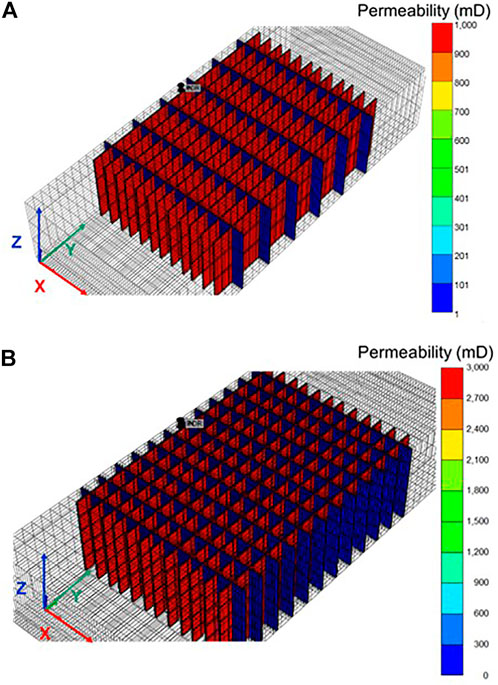
FIGURE 2. (A) Schematic diagram of the grid structure of the numerical model in the upper sweet spot; (B) schematic diagram of the grid structure of the numerical model in the lower sweet spot.
Model Description
An upper sweet spot model based on J1 (a horizontal well in the upper sweet spot, Jimsar) and a lower sweet spot model based on Y1 (a horizontal well in the lower sweet spot, Jimsar) are established to explore the law of fracturing fluid imbibition and oil replacement during the shut-in time. The parameters of the reservoir, fracture, and engineering are obtained through field data (Wang et al., 2020; Zhang et al., 2021). The PVT properties of the oil are acquired from the indoor experiment (Liao et al., 2019). Relevant known model parameters are summarized in Table 1 and Table 2 (the data are obtained from Xinjiang Oilfield).
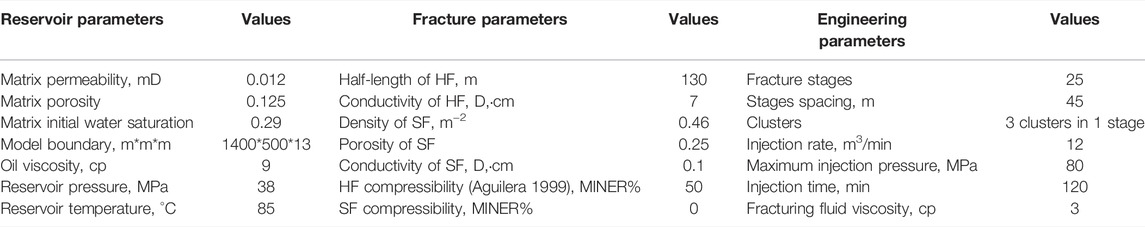
TABLE 1. Parameter setting for the upper sweet spot model.
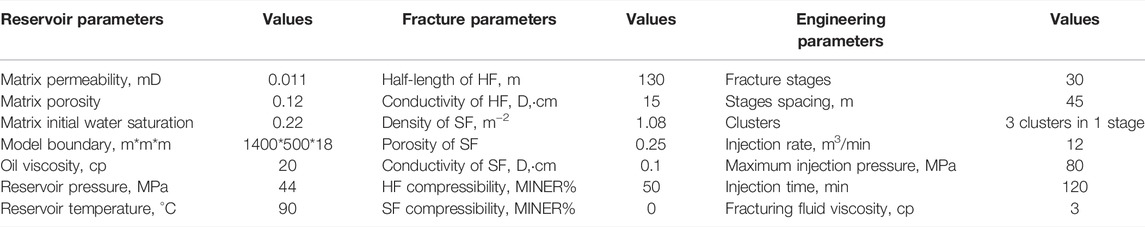
TABLE 2. Parameter setting for the lower sweet spot model.
Relative Permeability and Capillary Pressure Curve
The reservoir capillary pressure is high because of the characteristics of low porosity, ultra-low permeability, and widely developed microscale pores (Zhang et al., 2021). Capillary pressure, as the main power for slickwater to enter the matrix, affects the distribution of fracturing fluid and crude oil in the matrix and fracture system (Li et al., 2007). From the experiment test, the capillary pressure curve and two-phase relative permeability curve used in models are assigned as presented in Figures 3A,B respectively. The two-phase relative permeability of the fracture system uses the classical relative permeability setting (Zhang et al., 2017).
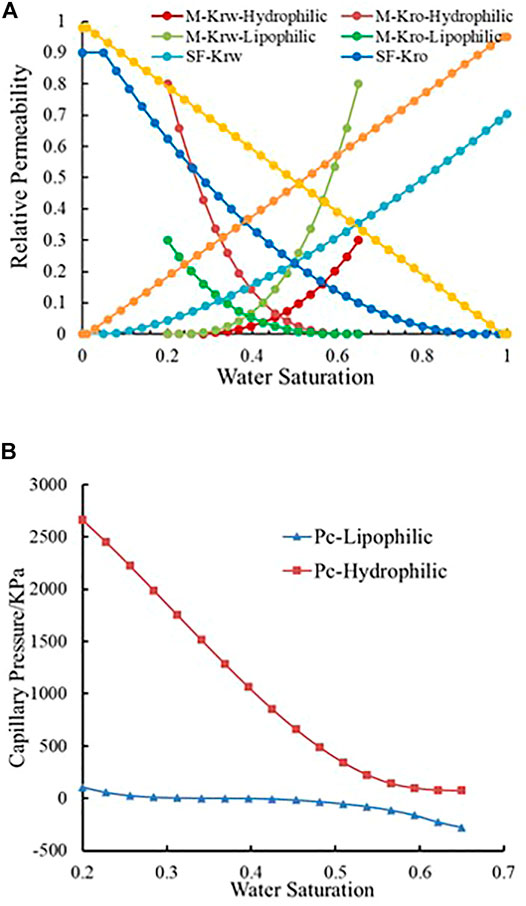
FIGURE 3. (A) Relative permeability; (B) capillary pressure.
Model Validation
The oil and water transfer between different media and the pressure of these media are difficult to monitor in reality because the techniques are limited. Therefore, the well bottom-hole pressure falloff at the shut-in period and water cut at flowback time could be used to validate the model.
This work verifies the model by well bottom-hole pressure of J1 and Y1 and water cut of J1, J2, J3, Y1, Y2, and Y3 using actual monitoring data. The validations are shown in Figures 4A,B. As shown in Figure 4, the simulated pressure change, water cut and the actual well pressure change, water cut fit well, which verifies the accuracy of the model.
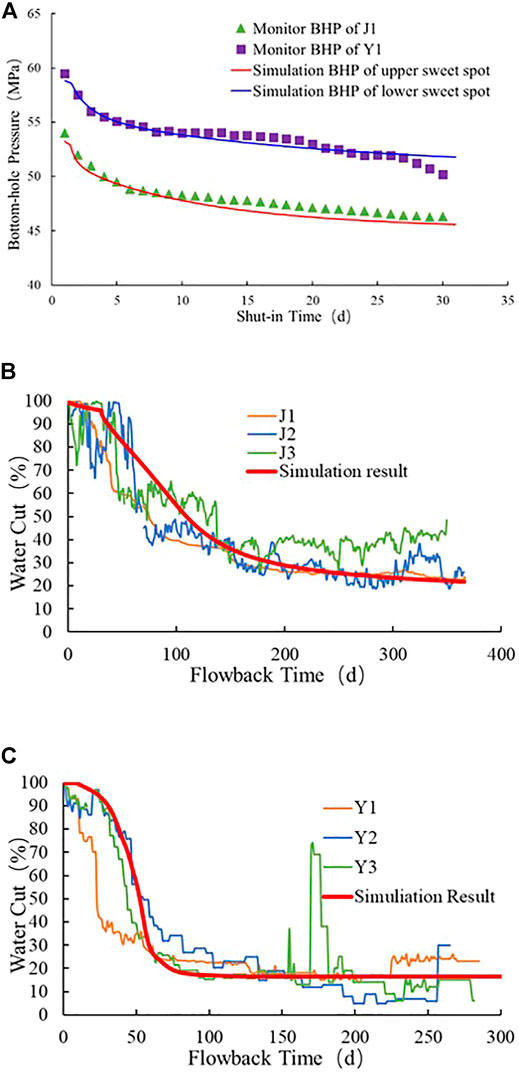
FIGURE 4. (A) Well bottom-hole pressure falloff; (B) water cut in the upper sweet spot; and (C) water cut in the lower sweet spot.
Law of Oil–Water Exchange During Well Shut-In
Simulation Results of Pressure
Figure 5 displays the pressure distribution diagram in the different sweet spots at different shut-in times. Figure 6 displays the statistical diagram of pressure distribution at different distances from HF. From Figures 4A,B, it can be seen that at the end of pumping, the pressure in the center of the main hydraulic fracture is 66.5 MPa; the pressure of the matrix 5 m and above from the fracture is the initial reservoir pressure (38 MPa). After 200 days of well shut-in, the pressure in the center of the main hydraulic fracture decreases to 43 MPa, and the pressure of the matrix 5 m and above from the fracture increases to 40 MPa. Figures 4C,D displays that the pressure in the center of the main hydraulic fracture is 71.5 MPa; the pressure of the matrix 5 m and above from the fracture is initial reservoir pressure (44 MPa). After 200 days of well shut-in, the pressure in the center of the main hydraulic fracture decreases to 46.3 MPa, and the pressure of the matrix 5 m and above from the fracture increases to 45 MPa. Combined with the weak hydrophilic characteristic of the upper sweet spot reservoir and the weak lipophilic characteristic of the lower sweet spot reservoir (Zhang et al., 2021). It can be concluded that during the shut-in period, the main fracture fluid pressure in the upper sweet spot is continuously diffused to the secondary hydraulic fractures and matrix under the capillary force. The capillary force as the main power promotes the imbibition and replacement between the fracture system and matrix. As it can be seen from the pressure distribution diagram, the reservoir pressure distribution is relatively average after 200 days of well shut-in, while the main fracture fluid pressure in the lower sweet spot is continuously diffused to the secondary hydraulic fracture. As a repulsive force, the capillary force hinders the imbibition and replacement. A small amount of fracturing fluid retained in the fracture system enters the matrix under differential pressure. After 200 days of a well shut-in, an obvious “high-pressure zone” is formed near the fracture system. The matrix pressure at the far fracture increases by 2%. The pressure changes from beginning to end are small.
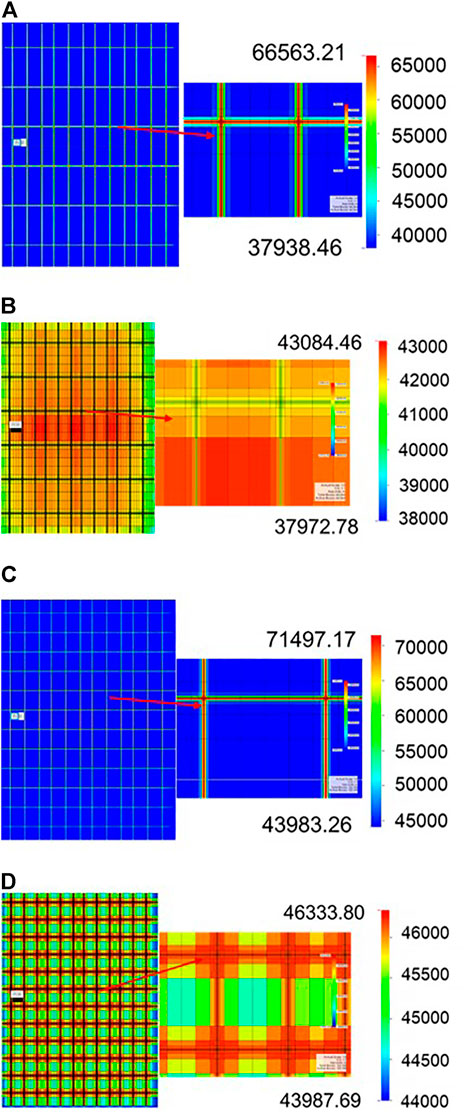
FIGURE 5. (A) Pressure distribution in the upper sweet spot at the end of pumping; (B) pressure distribution in upper sweet spot after 200days of shut-in; (C) pressure distribution in the lower sweet spot at the end of pumping; and (D) pressure distribution in the lower sweet spot after 200 days shut-in.
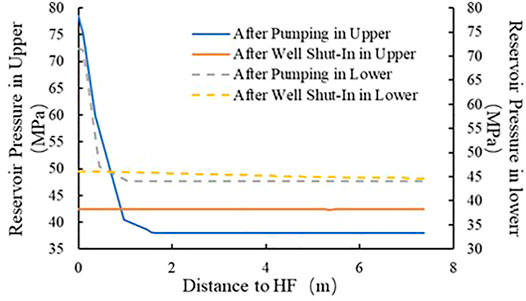
FIGURE 6. Pressure distribution of upper and lower sweet spots at different positions from HF.
Simulation Results of Saturation
Figure 7 displays the water distribution diagram in different sweet spots at different shut-in times. Figure 8 displays the statistical result. As shown in Figure 7A, at the end of pumping, 20.3% of the fracturing fluid is distributed in the HF, and 41.2% of the fracturing fluid is distributed in the RF. 38.5% of the fracturing fluid is filtered and imbibed into the near fracture matrix; As shown in Figure 7B, after 200 days of well shut-in, 3.2% of the fracturing fluid is distributed in the HF, 5.9% of the fracturing fluid is distributed in the SF, and 90.9% of the fracturing fluid is filtered and imbibed into the near fracture matrix. The water saturation of the fracture system is close to 0, and almost all the fracturing fluid is imbibed into the matrix. The long-term well shut-in helps to promote the oil-water exchange of the upper sweet spot reservoir (the fracturing fluid in the fracture i imbibed into the near fracture matrix, and the crude oil in the matrix is replaced in the fracture system), which is consistent with the conclusion by A. Almulhim. That work shows that the fracture water saturation in the fracture can be reduced from 100% to irreducible water saturation in a strong hydrophilic reservoir (Almulhim, et al., 2014). As shown in Figure 7C at the end of pumping, 28.1% of the fracturing fluid is distributed in the HF, and 40.2% of the fracturing fluid is distributed in the RF. 31.7% of the fracturing fluid is filtered and imbibed into the near fracture matrix; As shown in Figure 7D, after 200 days of well shut-in, 21.9% of the fracturing fluid is distributed in the HF, 27.9% of the fracturing fluid is distributed in the SF, 50.2% of the fracturing fluid is filtered, and imbibed into the near fracture matrix. The water saturation of the fracture system is 0.6–0.9. The water saturation still holds high water content. Long-term well shut-in has little impact on the oil-water exchange of the lower sweet spot reservoir.
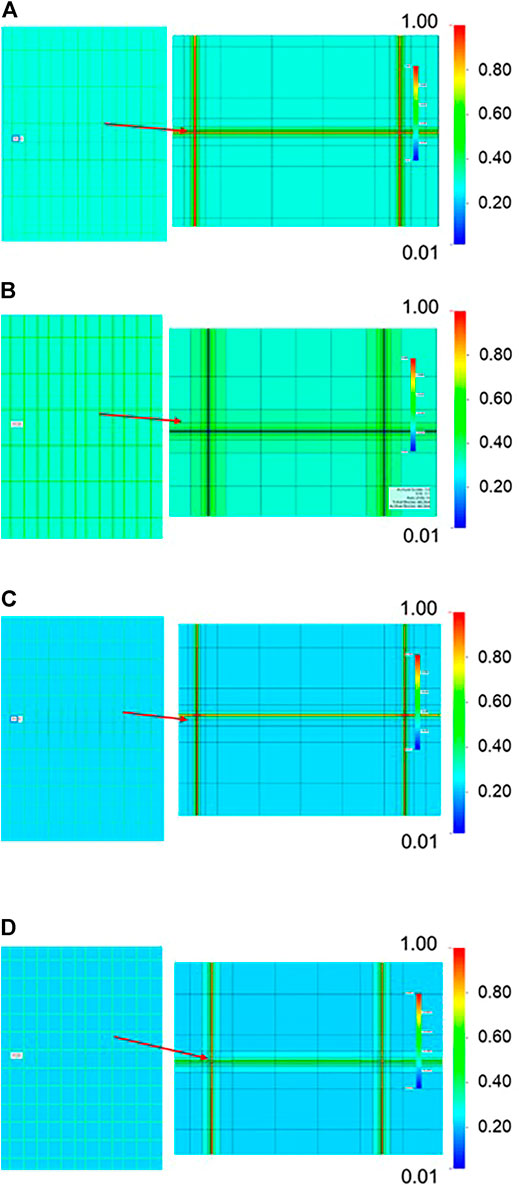
FIGURE 7. (A) Water saturation distribution in the upper sweet spot at the end of pumping; (B) water saturation distribution in the upper sweet spot after 200 days shut-in; (C) water saturation distribution in the lower sweet spot at the end of pumping; and (D) water saturation distribution in the lower sweet spot after 200 days shut-in.
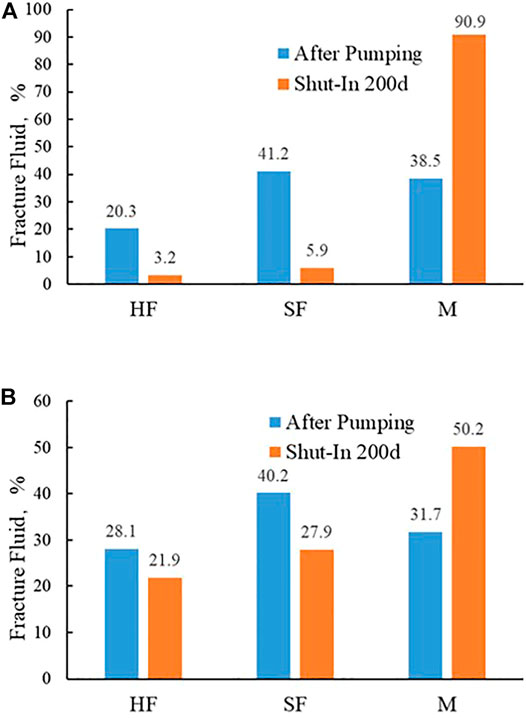
FIGURE 8. (A) Distribution of the fracturing fluid in the upper sweet spot at a different time; (B) distribution of the fracturing fluid in the lower sweet spot at different times.
Characteristics of Oil–Water Exchange
In this article, the oil-water changes among triple medium: HF, SF, and M are collected by setting different sectors. The oil-water replacement law during well shut-in is analyzed. It is defined that when the flow is less than 0.1 m³/d, the imbibition equilibrium is reached. During the well shut-in time, the oil is continuously replaced from the matrix to the fracture system in the upper sweet spot reservoir, as shown in Figure 9. The imbibition equilibrium is attained in about 65 days. When reaching the imbibition equilibrium, the cumulative oil volume replaced in sector SF is 161.2 m³, sector SF is 47 m³. A small amount of oil enters the fracture system in the lower sweet spot, as shown in Figure 9. The cumulative oil volume replaced in sector SF is higher than that of SF, reaching the imbibition equilibrium in about 14 days. The cumulative oil volume replaced in sector SF is 45.87 m3 and cumulative oil volume replaced into sector SF is 22.77 m³.
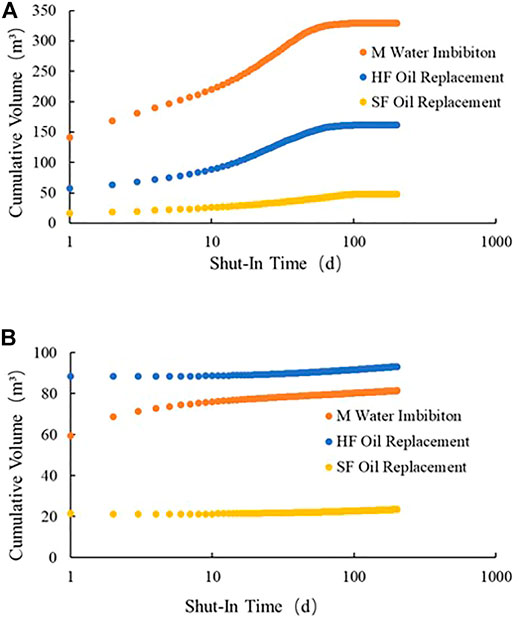
FIGURE 9. (A) Cumulative water imbibition volume and oil replacement volume of single fracture in the upper sweet spot; (B) cumulative water imbibition volume and oil replacement volume of single fracture in the lower sweet spot.
By counting the cumulative oil inflow of the fracture system, the simulation results of the two models are shown in Figure 10A. Combined with the fact that the SF density is low during the stimulation of the upper sweet spot reservoir, the complexity of the fracture system is low. In Figure 11, the initial oil saturation of the SF of the upper desserts is low. But the upper sweet desserts reservoir is hydrophilic with the capillary force as a power for imbibition. With the increase in shut-in time, the cumulative oil inflow changes gradually until the equilibrium state.
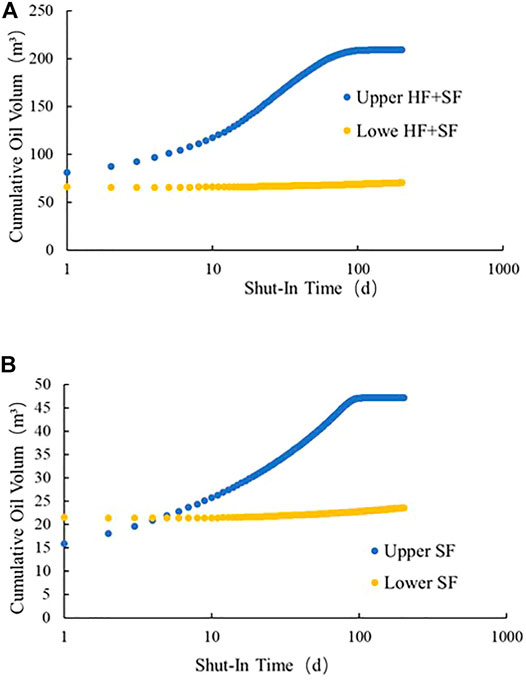
FIGURE 10. (A) Cumulative oil replacement of fracture system; (B) cumulative oil replacement of SF.
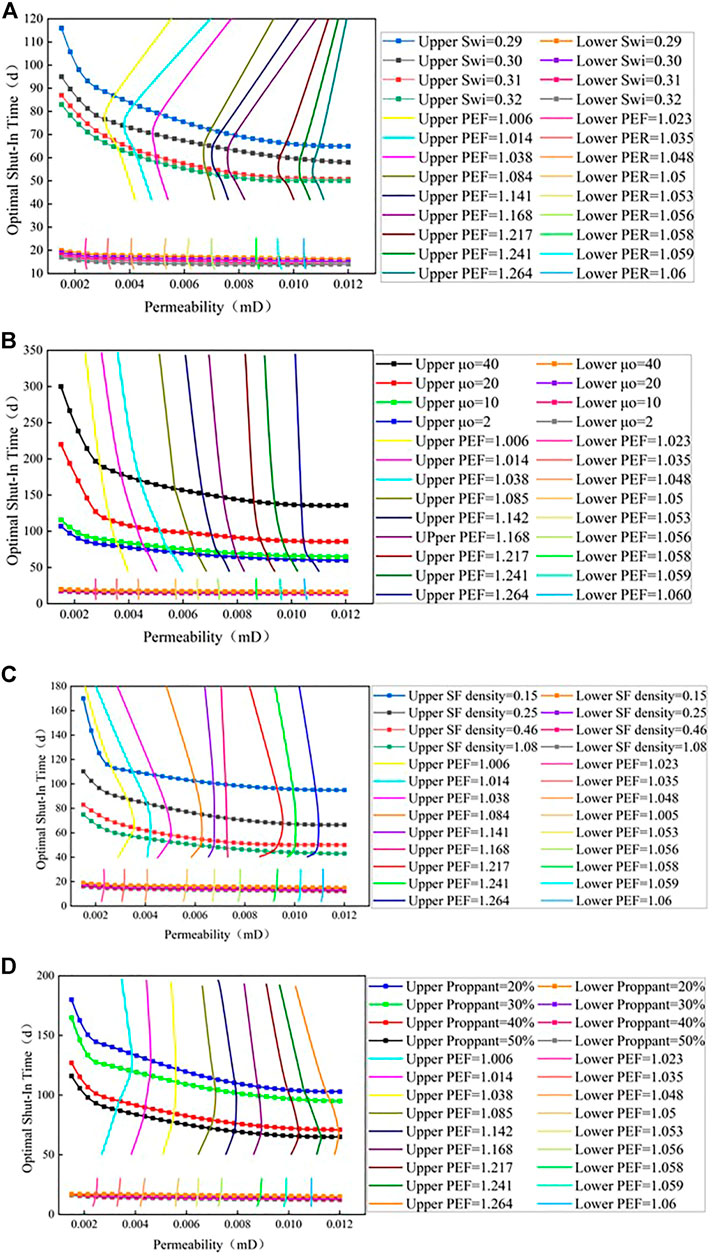
FIGURE 11. (A) Optimal well shut-in time chart of initial water saturation; (B) optimal well shut-in time chart of oil viscosity; (C) optimal well shut-in time chart of SF density; and (D) optimal well shut-in time chart of proppant proportion.
Because the density of SF is high during stimulation of the lower sweet spot reservoir. The complexity of the fracture system is high. In Figure 11B, the initial oil saturation of the SF is high, but the lower sweet spot reservoir is lipophilic. The capillary force is used as a resistance in the imbibition. The oil replacement is carried out only by the action of differential pressure between different media. The cumulative oil replacement hardly changes with the increase in well shut-in time.
Optimization of Shut-In Time
In this section, according to oil-water exchange among different media in Characteristics of Oil–Water Exchange, it is necessary to extend the shut-in time to make the fracturing fluid fully in contact with the reservoir, to achieve the best imbibition and replacement effect. Different parameters are analyzed by numerical simulation (permeability, initial water saturation, oil viscosity, SF density, and proppant ratio). Figure 11 shows the optimal well shut-in time and 1-year cumulative oil PEF (production enlargement factor) under different parameter conditions based on the infiltration equilibrium time defined by flow in Model Description. For example, the initial water saturation of the upper sweet spot reservoir is 0.3; the matrix permeability is 0.008md. Then the x-axis is 0.008; the y-axis is 0.3. The optimal shut-in time is 66 days, and the p cumulative oil production enlargement factor is 1.168.
Conclusion
1) The pressure diffusion is significant during the well shut-in in the upper sweet spot. The reservoir pressure distribution is relatively average after 200 days of well shut-in, whereas in the lower sweet spot reservoir, the pressure diffuses slowly during the well shut-in. The pressure only diffuses in the SF and near fracture matrix. After long-term well shut-in, there is still an obvious “high-pressure area” in the fracture system.
2) After 200 days of well shut-in, 85.2% of the fracturing fluid in the fracture system in the upper sweet spot reservoir was imbibed into the matrix. The oil saturation in the fracture is close to 1. Appropriately prolonging the well shut-in time is conducive to the water imbibition and oil replacement; Only 27.1% of the fracturing fluid in the fracture system in the lower sweet spot reservoir is imbibed into the matrix. The average oil saturation of the fracture system is 30%. Prolonging the soaking time has little effect on the water imbibition and oil replacement.
3) The upper sweet spot reservoir reached the equilibrium time in about 65 days. The cumulative oil volume replaced in the fracture system increased from 72 to 208 m3. The effect of imbibition replacement in well shut-in is good; The lower sweet spot reservoir reached the imbibition replacement balance in about 14 days. The cumulative oil volume replaced in the fracture system increased from 65 to 68 m3. There is no potential for water imbibition and oil replacement.
4) Because of the great potential of oil replacement in the upper sweet spot reservoir the optimal well shut-in time chart is drawn to guide post-fracture operation. It is suggested that the well shut-in time of the lower sweet spot reservoir is 14 days.
Data Availability Statement
The raw data supporting the conclusion of this article will be made available by the authors, without undue reservation.
Author Contributions
Methodology, XC; software, JZ; formal analysis, ZL and JW; data curation, XC, ZL, and JW; model, JZ and KL; imulation, JZ and FW; writing—original draft preparation, JZ, FW, and KL; writing—review and editing, JZ and KL; and supervision, KL.
Funding
This work is supported by study on shut-in mechanism after hydraulic fracturing in shale oil reservoir (51974332).
Conflict of Interest
XC, ZL, and JW were employed by PetroChina Xinjiang Oilfield Company.
The remaining authors declare that the research was conducted in the absence of any commercial or financial relationships that could be construed as a potential conflict of interest.
Publisher’s Note
All claims expressed in this article are solely those of the authors and do not necessarily represent those of their affiliated organizations, or those of the publisher, the editors, and the reviewers. Any product that may be evaluated in this article, or claim that may be made by its manufacturer, is not guaranteed or endorsed by the publisher.
References
Aguilera, R. (1999). Recovery Factors and Reserves in Naturally Fractured Reservoirs. J. Can. Pet. Technol. 38, 4. doi:10.2118/99-07-da
Almulhim, A., Alharthy, N., Tutuncu, A. N., and Kazemi, H. (2014). Impact of Imbibition Mechanism on Flowback Behavior: A Numerical Study. Abu Dhabi, UAE: Abu Dhabi International Petroleum Exhibition and Conference. [C] SPE-171799-MS. doi:10.2118/171799-MS
Bazin, B., Peysson, Y., Lamy, F., Martin, F., Aubry, E., and Chapuis, C. (2010). In-Situ Water-Blocking Measurements and Interpretation Related to Fracturing Operations in Tight Gas Reservoirs. SPE J. 25, 431–437. doi:10.2118/121812-PA
Erting, L., Baoli, X., Xiangjun, L., Zhou, N., Changchun, P., Dilidaer, R. Z., et al. (2020). Genetic Analysis of the Thicker Shale Oil of Lucaogou Formation in Jimsar Sag, Junggar Basin. Nat. Gas Geosciences 31 (02), 250–257. doi:10.11764/j.issn.1672-1926.2019.09.003
Greene, D. L., Hopson, J. L., and Li, J. (2003). Running Out of and into Oil: Analyzing Global Depletion and Transition through 2050. Oak Ridge, TN, USA: Oak Ridge National Laboratory. ORNL/TM-2003/259.
Guo, X., He, W., Sen, Y., Wang, J., Feng, Y., Jia, X., et al. (2019). Evaluation and Key Technology Application of Shale Oil "sweet Spot Area" in Junggar Basin: a Case Study of Permian Lucaogou Formation in Jimsar Sag. Nat. Gas Geosciences 30 (08), 1168–1179.
Handy, L. L. (1960). Determination of Effective Capillary Pressures for Porous media from Imbibition Data. SPE J. 219 (5), 75–80. doi:10.2118/1361-g
Khanna, A., and Kotousov, A. (2016). Controlling the Height of Multiple Hydraulic Fractures in Layered Media. SPE J. 21, 256–263. doi:10.2118/176017-PA
Li, J. (2006). Effect of Surfactant System on Imbibition Process [D]. Langfang: Graduate School of Chinese Academy of Sciences.
Li, S., Liu, W., Zhang, H., and Xiao, H. (2007). Experimental Study on Spontaneous Permeability and Displacement of Low Permeability Reservoirs. J. Pet. 28 (2), 109–112. doi:10.3321/j.issn:0253-2697.2007.02.022
Li, X., Ma, Q., Liang, H., Zhang, P., Zhang, Q., Jia, X., et al. (2015). Geological Characteristics and Exploration Potential of Tight Oil in the Second Member of Permian Lucaogou Formation of Santanghu Basin. Pet. Exploration Develop. 42 (6), 763–771. doi:10.1016/s1876-3804(15)30080-x
Liao, K., Zhang, S., Ma, X., and Zou, Y. (2019). Numerical Investigation of Fracture Compressibility and Uncertainty on Water-Loss and Production Performance in Tight Oil Reservoirs. Energies 12, 1189. -v2. doi:10.3390/en12071189
Ma, C., Wang, J., Pan, X., Chen, J., Shang, L., and Liu, J. (2020). Genesis and Significance of Analcite in Shale Oil Reservoir of Lucaogou Formation in Jimsar Sag, Junggar Basin. Pet. Exp. Geology. 42 (04), 596–603. doi:10.11781/sysydz202004596
Mohammadmoradi, P., and Kantzas, A. (2018). Wettability and Capillary Imbibition in Shales; Analytical and Data-Driven Analysis[C], 189806. SPE journal.
Qu, Y., Gong, X., Shi, K., Liu, Y., Ma, G., and Wang, X. (2020). Research Progress on Imbibition and Backflow Mechanism of Fracturing Fluid in Shale Reservoir. Contemp. Chem. Industry 49 (11), 2532–2535. doi:10.13840/j.cnki.cn21-1457/tq.2020.11.041
Sherman, J. B., and Holditch, S. A. (1991). Effect of Injected Fracture Fluids and Operating Procedures on Ultimate Gas Recovery. Houston, Texas: Society of Petroleum Engineers.[C]. SPE Journal. doi:10.2118/21496-MS
Shi, L., Zhang, K., and Mu, L. (2020). Discussion on Fracturing Technology of Shale Oil Reservoir. Pet. Sci. Bull. 5 (04), 496–511. doi:10.3969/j.issn.2096-1693.2020.04.043
Sun, L., Zou, C., Jia, A., Wei, Y., and Guo, Z., (2019). Development Characteristics and Orientation of Tight Oil and Gas in China. Pet. Exploration Develop. 46, 1015–1026. doi:10.1016/s1876-3804(19)60264-8
Wang, J., Liu, H., Xia, J., Liu, Y., Hong, C., Meng, Q., et al. (2017). Numerical Simulation of Imbibition Oil Recovery Mechanism in Fractured Reservoirs. Pet. Exploration Develop. 5, 761–770. doi:10.11698/PED.2017.05.11
Wang, R., Chang, Q., Qian, Y., Liu, G., Wan, M., and Huang, L. (2020). Reservoir Characteristics and Genetic Mechanism of "sweet Spot" of Shale Oil in Lucaogou Formation of Jimsar Sag, Junggar Basin. Pet. Exp. Geology. 42 (04), 604–611. doi:10.11781/sysydz202004604
Wu, B., Li, J., Wu, Y., Han, L., Zhao, Y., and Zou, Y. (2019). Integrated Development Practice of Geological Engineering for Upper Desserts of Lucaogou Formation Shale Oil in Jimsar Sag, Junggar Basin. PetroChina Exploration 24 (05), 679–690. doi:10.3969/j.issn.1672-7703.2019.05.014
Zhang, G., Chen, M., and Zhao, Y. (2018). Study on Initiation and Propagation Mechanism of Fractures in Oriented Perforation of New Wells. Acta Petrolei Sinica 29, 116–119. doi:10.7623/syxb200801025
Zhang, K., Liu, D., Huang, B., Li, Q., He, X., and Ge, H. (2021). Imbibition Displacement Characteristics of Lucaogou Formation Tight Oil Reservoir in Jimusaer. Sci. Techn. Eng. 21 (02), 538–545.
Zhang, T., Li, X., Li, J., Feng, D., Li, P., Zhang, Z., et al. (2017). Numerical Investigation of the Well Shut-In and Fracture Uncertainty on Fluid-Loss and Production Performance in Gas-Shale Reservoirs. J. Nat. Gas Sci. Eng. 46, 421–435. doi:10.1016/j.jngse.2017.08.024
Zhou, J., Chen, M., Jin, Y., and Zhang, G., (2007). Experimental Study on Hydraulic Fracture Propagation Mechanism of Fractured Reservoir. Acta Petrolei Sinica 28, 109–113. doi:10.3321/j.issn:0253-2697.2007.05.020
Keywords: shale oil, Jimsar, shut-in time, numerical simulation, imbibition replacement
Citation: Chen X, Liao K, Lv Z, Zhu J, Wang J, Li Y and Wang F (2022) Numerical Simulation Study on Optimal Shut-In Time in Jimsar Shale Oil Reservoir. Front. Energy Res. 10:849064. doi: 10.3389/fenrg.2022.849064
Received: 05 January 2022; Accepted: 25 March 2022;
Published: 26 April 2022.
Edited by:
Mehdi Ostadhassan, Northeast Petroleum University, ChinaReviewed by:
Sen Wang, China University of Petroleum, ChinaJianguo Wang, China University of Mining and Technology, China
Copyright © 2022 Chen, Liao, Lv, Zhu, Wang, Li and Wang. This is an open-access article distributed under the terms of the Creative Commons Attribution License (CC BY). The use, distribution or reproduction in other forums is permitted, provided the original author(s) and the copyright owner(s) are credited and that the original publication in this journal is cited, in accordance with accepted academic practice. No use, distribution or reproduction is permitted which does not comply with these terms.
*Correspondence: Kai Liao, 2020592108@cupk.edu.cn; Jian Zhu, 504876341@qq.com