Intelligent Online Health Estimation for Lithium-Ion Batteries Based on a Parallel Attention Network Combining Multivariate Time Series
 Xiaojun Tan
  Xiaoxi Liu
 Yuqian Fan
- School of Intelligent Systems Engineering, Sun Yat-sen University, Guangzhou, China
With the development of cloud and edge computing, data-driven methods for estimating a Li-ion battery’s state of health are becoming increasingly attractive. However, existing data-driven estimation methods have problems of low accuracy and weak robustness that need to be solved. Focusing on these points, this paper proposes a parallel attention network combining multivariate time series to extract the mapping relationship between the selected health features and the state of health. First, multivariate time series are extracted, which can describe battery aging characteristics at different scales. Then, a novel parallel learning framework is designed by integrating long short-term memory cells and an attention mechanism, which can make full use of the health features and help to solve the challenging issues of estimation accuracy and robustness. Experimental results show that the proposed model is able to obtain estimation results for different batteries with a mean absolute percentage error of less than 1%. Compared with existing methods, the maximum error of the proposed model is 38% lower on average. Furthermore, even under measurement noise injections of 50 dB, a preferable estimation result (maximum error of 3.36%) can still be achieved.
1 Introduction
Electric vehicles (EVs) are attracting more attention around the world. Due to their high energy density, long service life, and low environmental pollution, Li-ion batteries (LIBs) have been widely applied as a power supply for EVs (Li et al., 2020c; Yan et al., 2020). EV batteries must have high reliability, which will have high economic value and efficiency. However, LIBs are associated with an increased risk of performance degradation with time, which could result in problems concerning safety and reliability (Xiong et al., 2020). Accurate state of health (SoH) estimation can play an important role in applications such as charging management and thermal management. However, it is a difficult task due to the complex and nonlinear underlying mechanisms of LIBs (Tan et al., 2021a; Fan et al., 2021). Therefore, accurate and robust SoH estimation of LIBs has been an important research topic.
Generally, SoH estimation methods can be divided into three categories: 1) Direct measurement methods, 2) model-based methods, and 3) data-driven methods.
Direct measurement methods mainly estimate the SoH of LIBs based on terminal voltage, measured current, and impedance, such as coulomb counting and electrochemical impedance spectroscopy (EIS) (Pastor-Fernández et al., 2017; Islam and Park, 2020). A limitation of using this kind of method is that it requires a unique current profile and complicated equipment, which are hard to obtain in real operational scenarios (Zhang et al., 2019).
Model-based methods involve equivalent circuit models and electrochemical models. Circuit models define an electrical circuit with various components to simulate a cell’s electrical dynamics (Li et al., 2020d; Wu et al., 2021). An electrochemical model is another important research direction. Li et al. (2020a) analyzed the parameter sensitivity of an electrochemical model under both the charging process and real-world driving cycles. Li et al. (2020b) explored a state observer based on an extended single-particle model to control battery behavior by monitoring the internal states in electrochemical processes. Tang et al. (2019) presented a systematic method combining experimental and computational approaches for key parameter acquisition of an electrochemical model. However, model-based estimation requires fundamental knowledge of electrochemical behaviors inside the battery and heavily depends on the model’s accuracy (Sheng et al., 2021).
To this end, data-driven methods are becoming a common trend because the input (features) can be mapped directly to the output (SoH) without necessarily having to choose a physical model. Much effort has been made from the perspective of health feature (HF) extraction and data-driven modeling. In addition to obtaining direct measurement features such as voltage and current (Ouyang et al., 2021), second-order processing features converted from voltage curves can also be used as HFs. The curve peak area was calculated to estimate the SoH (Wang et al., 2021). Four features extracted from the charging voltage were selected for SoH estimation (Yang et al., 2018). Relationships between HFs and the SoH can be performed with data-driven models. Deep neural network (DNN)-based approaches (Yang et al., 2020; Bhattacharya et al., 2021) extracted the features from raw charging curve data to obtain the SoH as an output. Recurrent neural networks (RNNs) were adopted to process an input time sequence and obtain the nominal capacity (Ansari et al., 2021; Cheng et al., 2021). Convolutional neural network (CNN)-based models (Yang, 2021; Zraibi et al., 2021) were utilized to obtain an estimation result. Tan et al. (2021b) trained a support vector regression (SVR)-based model to perform SoH estimation. A Gaussian process regression (GPR) model was designed to capture the battery cyclic capacity dynamics (Liu et al., 2019).
The above studies show that data-driven approaches can achieve health state assessment based on historical data samples. However, the work mentioned above suffers from two major drawbacks awaiting further improvements. 1) Due to the complexity of the degradation mechanism and the diversity of reasons for battery aging, the measurable signals that can reflect the internal electrochemical characteristics can show a complex nonlinear variation trend with battery aging. Therefore, to track such complex changes, multiple features should be extracted and analyzed. 2) Different features have distinct influences on the final results. However, existing SoH estimation network models are mostly single-branch models, namely using the same model to deal with different features, which limits the performance of extracting various aspects of battery data. Moreover, it is not reasonable to assume that the input features make equal contributions to the estimation results.
To address the above problems, this paper proposes a parallel attention network (PANet) combining multivariate time series. First, direct measurement features and second-order processing features from the battery charging curves were chosen, which can describe battery aging characteristics at different scales. Then, a novel parallel learning framework was designed to further improve the generalization capability, accuracy, and robustness of the estimation results by integrating long short-term memory (LSTM) cells and an attention mechanism. The parallel structure makes full use of HFs and helps to solve the challenging issues of estimation accuracy and robustness.
2 Experiments and Health Feature Extraction
With the development of information technology such as the Internet of Vehicles (IoV) and cloud computing, more recent attention has focused on intelligent cloud battery management systems (BMSs). The battery parameters in EVs are collected and uploaded to the cloud in real time, and the battery state is estimated through a data-driven model. BMSs make it possible to manage the battery and improve the safety of EVs. This paper focuses on the SoH part of an intelligent cloud BMS, including HF extraction and the implementation of a parallel-structured neural network model, as shown in Figure 1.
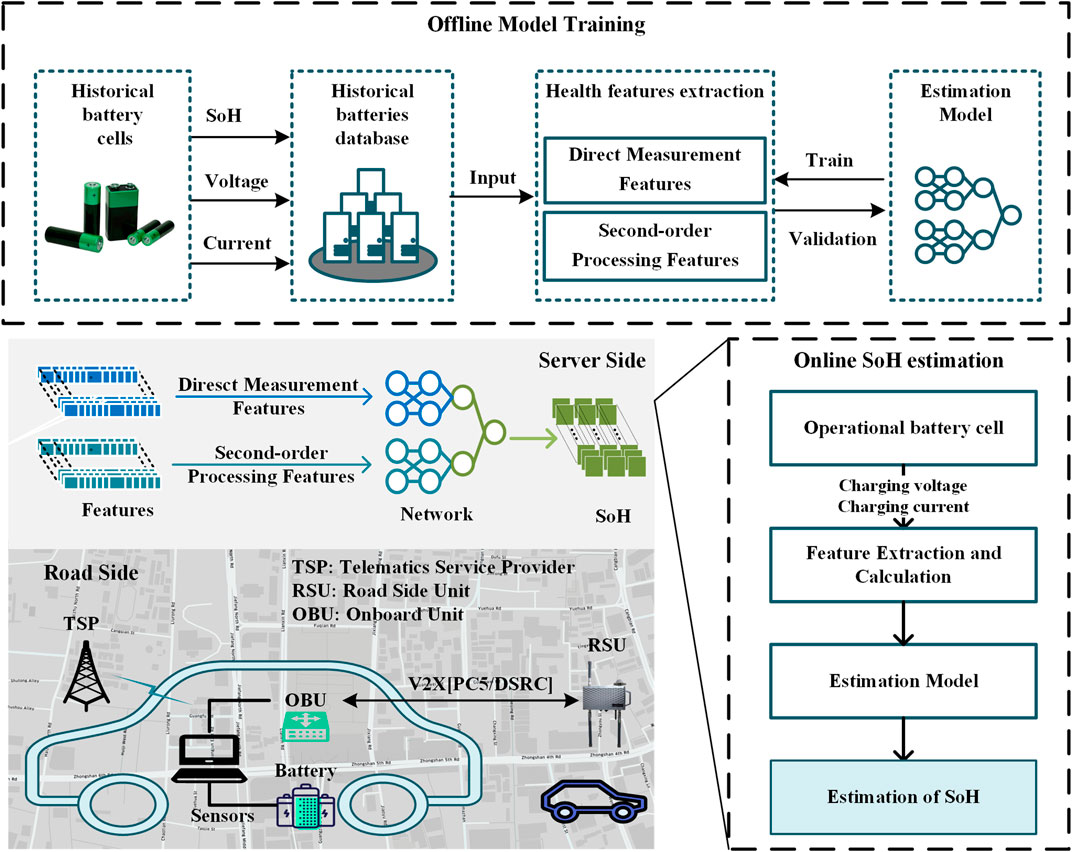
FIGURE 1. Diagram of an intelligent cloud battery management system (the SoH part) based on a connected vehicle intelligent management platform.
2.1 Aging Experiments
Five commercially available 2 Ah, 18650 LIBs were selected as the test objects, and the specifications are displayed in Table 1. The battery aging dataset utilized in this work was obtained from experiments on a battery cycling life test platform. The platform consists of a charge/discharge tester, a programmable constant temperature and humidity chamber (SANWOOD SMG-150-CC), and a computer to record data, as shown in Figure 2A.
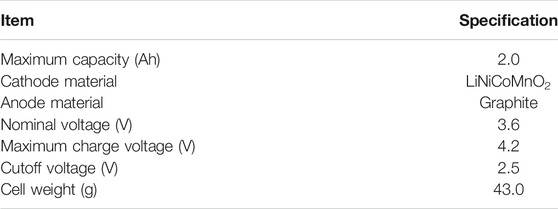
TABLE 1. Specifications of the tested 18650 batteries.
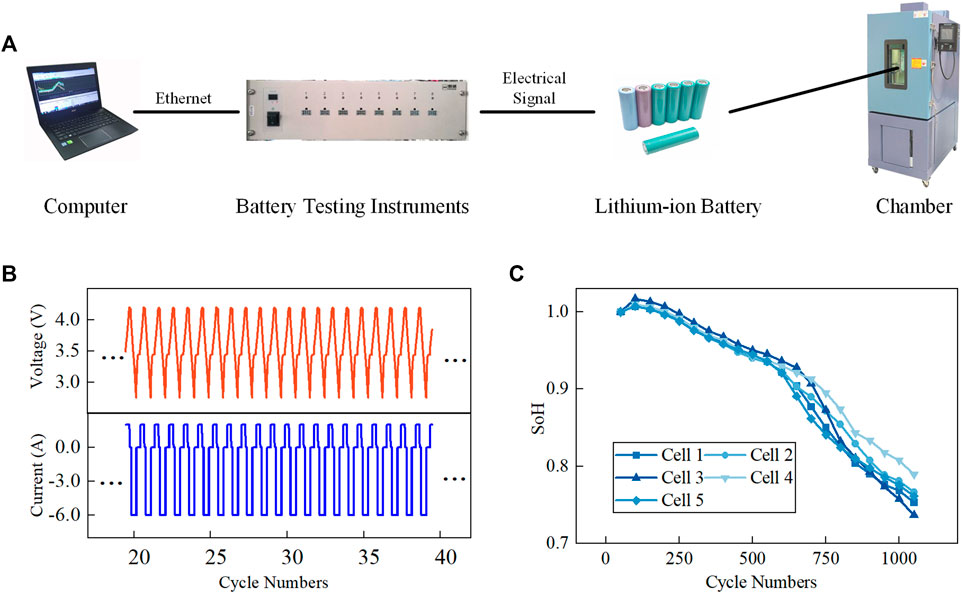
FIGURE 2. (A) The test platform. (B) Voltage and current response. (C) SoH data of the tested battery cells.
Capacity is used as the SoH indicator in this paper. The SoH is defined as the ratio of the current maximum available capacity of the battery pack to the rated capacity (Li K. et al., 2020). The formula is as follows:
where
The historical operational data of the batteries, such as the voltage, current, and temperature, were collected to set up the database. The practical capacities were calculated by integrating the discharge current over the discharge cycle duration as the benchmark values. Figure 2B shows the curve shapes of the charge voltage and current of a battery, and Figure 2C shows the SoH data of the five tested battery cells.
The cells were aged with the same cycling profile, including the battery pretreatment cycle, aging cycle, and capacity calibrating cycle. The specific steps are provided in Figure 3 and Table 2. All the cells were cycled in a humidity chamber at a constant temperature of 25°C.
FIGURE 3. The cycling steps for battery aging. (A) Battery cell pretreatment period. (B) Aging cycle period. (C) Capacity calibration period.
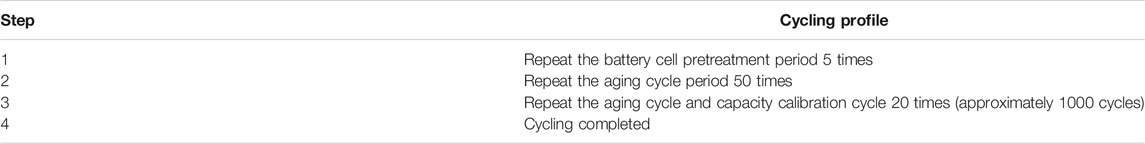
TABLE 2. Cycling profile for battery aging.
2.2 Health Feature Extraction
HF extraction is a key step in the SoH estimation of LIBs, as it not only affects the algorithm’s computational effort but also enables the determination of the accuracy.
The common feature inputs for an SoH estimation problem can be mainly classified into two categories: Direct measurement features and second-order processing features. Direct measurement features, such as the number of cycles, voltage, current, and temperature, are recorded by the sensors in the BMS. They can be measured easily and precisely, and reflect the short-term characteristics of batteries. Features obtained by a simple calculation of the direct measurement features are referred to as second-order processing features. Second-order features can extract the long-term dependency after they have been processed. These two types of features are combined in this paper to improve the estimation model’s performance.
2.2.1 Direct Measurement Features
The terminal voltage and current of the battery during the charging process were measured as the direct measurement features in this paper.
Compared with the discharging process, the charging process is stationary. Generally, the discharging process is heavily influenced by load profiles. Different discharging currents result in different discharging voltage differences during the same time interval, which makes the discharge features less ideal for SoH assessment, especially in highly fluctuating online applications. In addition, the charging process is normally controlled by the BMS. Therefore, using data from the charging process can effectively eliminate the impact of random working loads on the measurement results.
The essential attributes of a battery can be expressed through its external characteristics. The battery properties change as the SoH varies. Accordingly, batteries with different cycle lives or cycle numbers have different internal properties and external performance, resulting in different terminal voltages and currents. Furthermore, obtaining the observed voltage and current for any battery is simple, ensuring the generalization of the proposed method.
2.2.2 Second-Order Processing Features
In addition to direct measurement features, second-order processing features are receiving increasing attention and are obtained by transforming the charging or discharging voltage curve. As the battery cycle proceeds, the battery capacity will gradually decay, and the battery charging voltage curve will also change. The trend of the battery charging voltage curve remains the same, but the charging time in CC mode decreases as the cycle number increases. In other words, the time duration of the equal terminal voltage interval gradually decreases as the cycle number increases in the CC charging step, as shown in Figure 4A. Specifically, for a battery with a high SoH value, the charging voltage rises slowly (the blue part of the curve). When the battery is used for a long period of time with a lower SoH value, the charging voltage rapidly rises (the red part of the curve).
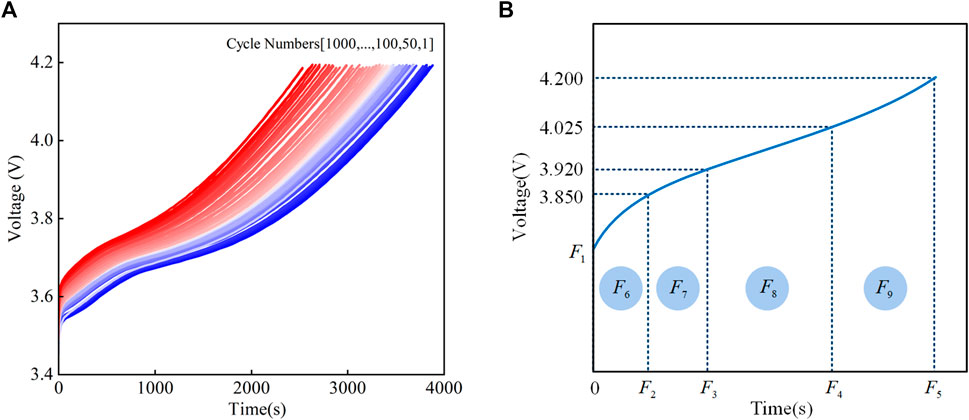
FIGURE 4. (A) Voltage curves during the aging cycles. (B) Nine features extracted from the charging voltage curve.
Based on this characteristic, the method of calculating the cumulative time of the charging voltage is suitable to estimate the SoH value for different cycles.
Therefore, in this work, nine features (Tan et al., 2020) are extracted based on the voltage curve measured during the charging process for the SoH estimation of LIBs, as shown in Figure 4B.
The charging voltage curve, which can reflect the internal electrochemical characteristics, is divided into four intervals based on voltage variation. The first interval is from the start voltage to 3.85 V. The 3.85 V was mainly set to include the maximum start voltage for a battery. The last value is 4.2 V, which is the maximum charge voltage of the battery. Considering that the curve slope of previous parts changes more, the resulting curve is split into 2:3:5 based on the voltage value.
Therefore, these nine features are defined as follows. The first feature
The remaining four features are the integration of the voltage with respect to time in the four intervals, which represent the magnetic flux and can reflect the power supply, and these four features are recorded as
2.3 Evaluation Criteria
The root-mean-square error (RMSE), mean absolute percentage error (MAPE), and maximum error (MaxE) are utilized as the performance evaluation metrics with the equations given below. The MAPE and RMSE highlight the average accuracy of the model’s estimation. The MaxE highlights the consistency of model estimations. These three scores indicate better performance with lower values.
where
3 Proposed Method
The proposed method for SoH estimation comprises two stages: offline model training and online SoH estimation. For offline training, historical data were collected to set up a database. In the online estimation process, the well-trained PANet model, which can extract the mapping relationship between the features and the SoH, is applied for SoH estimation.
3.1 PANet Model Method
The primary task in achieving battery SoH estimation is to develop estimation networks. To address this problem, this paper proposes an intelligent SoH estimation method based on a PANet model. The architecture of the proposed PANet model is shown in Figure 5A.
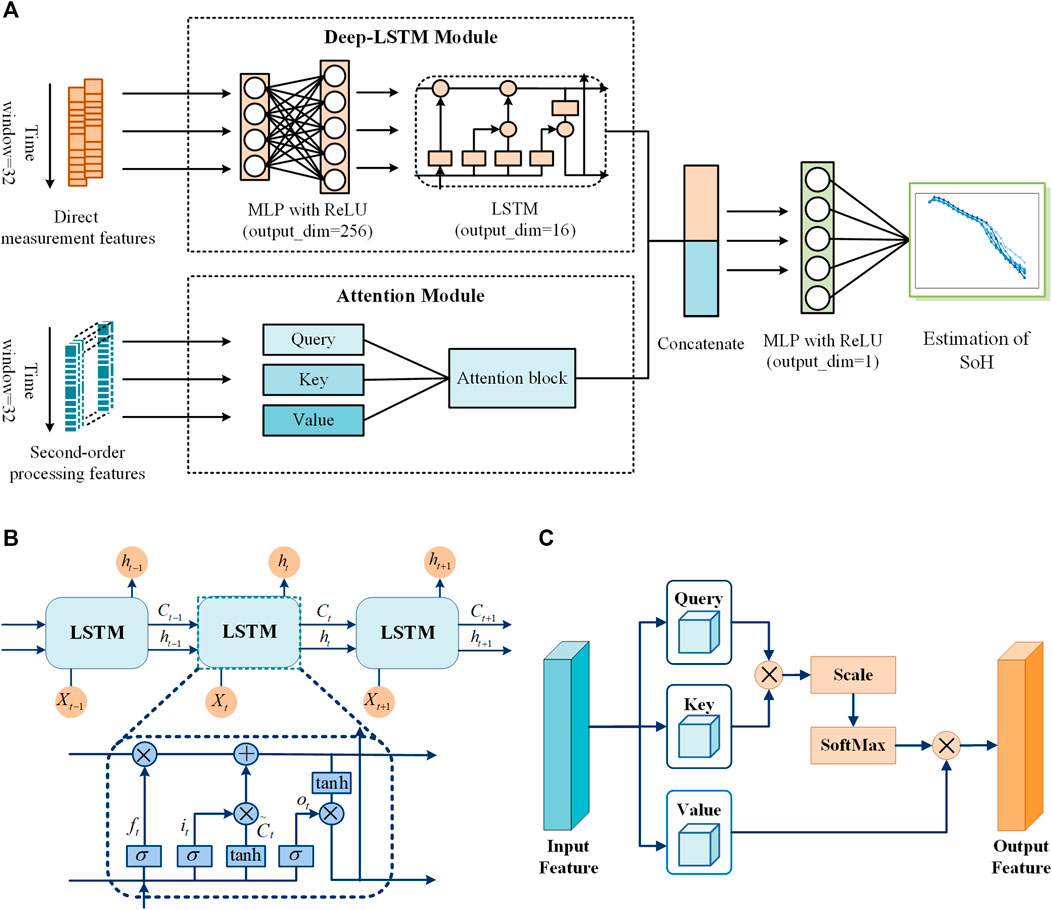
FIGURE 5. (A) The structure of PANet. (B) The structure of LSTM. (C) The structure of the attention mechanism.
As discussed in Section 2, two kinds of HFs were chosen. One is direct measurement features that can reflect short-term characteristics, and the other is second-order processing features that can extract long-term dependency. Motivated by the wide and deep model (Karatzoglou and Hidasi, 2017), which utilizes two modules to handle two different features to perform efficient feature extraction, it is reasonable to design a parallel structure to deal with direct measurement features and second-order processing features. However, as the aging of batteries is a gradual degradation process, this inspired us to introduce an LSTM network to solve the SoH estimation problem.
The proposed PANet contains two modules, i.e., a deep-LSTM module and an attention module. Two kinds of HFs are calculated after obtaining the battery information extracted from the online measurements. Direct measurement features are fed into the deep-LSTM module, while the second-order processing features are fed into the attention module. To obtain the final estimation result, the outputs of the two modules are concatenated and fed into a multilayer perceptron (MLP). By jointly training the two modules, PANet has the ability to perform efficient feature extraction. Therefore, the properly learned feature representations help to solve the challenging issues of estimation accuracy and robustness.
3.2 Deep-LSTM Module
The deep-LSTM module contains two types of operations, i.e., MLP and LSTM. The input to this module is the direct measurement features, which can be denoted as
The input is first projected into a 256-dimensional space using an MLP layer with ReLU as the activation function. The ability of the model to handle unseen features can be developed by learning a mapping relationship between the low-dimensional input and the dense embedding vector.
Then, the embedding vector is fed into the LSTM cell (Tan et al., 2020). The LSTM network was introduced for its ability to process time-series data efficiently, as it has an internal structure that can collect key historical degeneration. The LSTM architecture is shown in Figure 5B.
The LSTM network has three gate structures to increase or eliminate the information of cell state
where
where
Voltage and current, although easy to measure and obtain, are often accompanied by unpredictable measurement noise. This uncertainty can result in unseen feature combinations. Thus, an MLP layer is first applied to improve the model’s generalization by learning a dense embedding vector. The embedded vector is then fed into an LSTM cell, as LSTM is adaptable to handling sequential data and can reduce the noise sensitivity to assist in achieving robust estimation performance.
3.3 Attention Module
The second-order processing features are fed into the attention module. The input to this module can be denoted as
The attention mechanism was first proposed for translation tasks (Bahdanau et al., 2015), and it shows the ability of attention to extract the long-distance dependencies of words in a sentence. The popular self-attention base transformer (Vaswani et al., 2017) has been proposed as a new way of thinking about sequence modeling and has achieved great success. An attention function can be described as mapping a query and a set of key-value pairs to an output, where the query, keys, and values are vectors transformed from the original input. The attention architecture is shown in Figure 5C.
The attention mechanism assigns different weights to the input sequence to select the most relevant information features. The mathematical expressions of the attention mechanism are as follows:
where
The second-order processing features are calculated from the voltage curve according to specific rules. Handcrafted features with domain knowledge can convey additional information for the estimation of the SoH. Compared with the direct measurement features (voltage and current), they reflect the characteristics of different periods in a cycle and have different contributions to the estimation results.
The attention mechanism enables the network to focus on specific parts of sequences. Specifically, we allow the model to learn to pay attention to different features in a sequence of charging cycles based on their relevance in the SoH estimation task and to determine the information in each charging cycle to be incorporated into the estimation.
4 Experimental Results and Analysis
4.1 Experimental Settings
After obtaining the raw data, the SoH measurements were interpolated to create a supervised learning dataset. In this research, cell 1 and cell 2 were selected as the training cells, while the remaining three cells were used as test cells. To train the network, the mean square error (MSE) function was chosen as the loss function. Then, the network was optimized using the gradient descent method with a sufficient Adam learning rate. An early stopping mechanism was adopted to prevent model overfitting. Specifically, the training process is terminated if the monitored validation loss does not decrease for k time points. In particular, min-max normalization was utilized to rescale the data in the range of [0, 1] using Eq. 16. It is beneficial for a model if the data are normalized before being fed into the model, as it enables faster convergence during the learning process.
where
4.2 Analysis of Different Feature Selection Schemes
Data-driven estimation accuracy is closely related to the feature selection scheme. As discussed in Section 2, direct measurement features and second-order processing features were chosen as HFs, and a parallel learning framework was designed. The deep-LSTM module receives the direct measurement features, while the attention module receives the second-order processing features. To verify the effectiveness of this scheme, three alternative feature selection schemes were created for comparison. Direct measurement features are fed into both modules, represented by FS1, while second-order processing features are fed into both modules, denoted as FS2. In addition, the inputs are exchanged to ensure that the deep-LSTM module and the attention module are suitable for various features, i.e., second-order processing features are fed into the deep-LSTM module, while direct measurement features are fed into the attention module. This scheme is denoted as FS3.
The experimental results of a variety of feature selection schemes are presented in Table 3. The results are reported as the ‘mean ± standard deviation’. The SoH estimation results and estimation errors are shown in Figure 6.
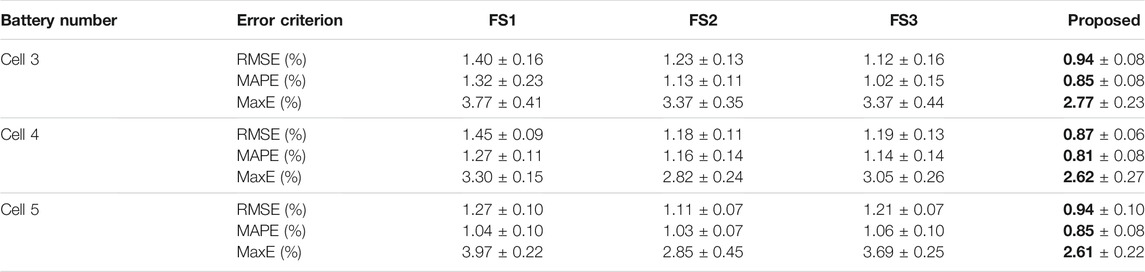
TABLE 3. Performance comparison of different schemes.
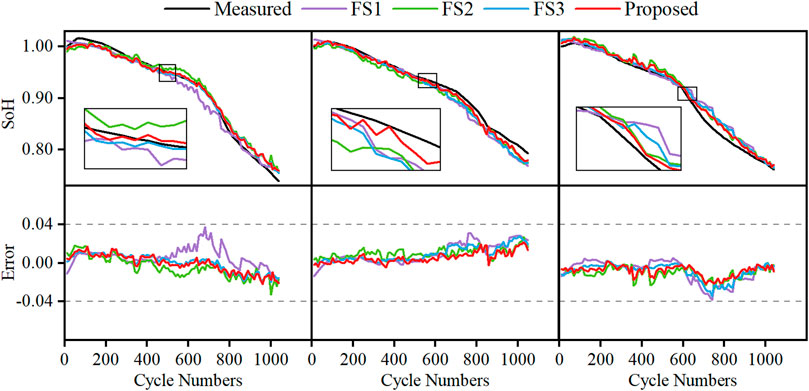
FIGURE 6. SoH estimation results and errors of different schemes for cell 3, cell 4, and cell 5
According to Table 3.
1) as seen from the results of FS2, which denotes that only second-order processing features are used as the model’s input, the performance of this scheme is acceptable with RMSEs of 1.23, 1.18, and 1.11%. As such, it is reasonable to say that the second-order processing features have a strong correlation with battery aging.
2) When comparing the results of FS3 and the proposed scheme, it can be observed that the proposed scheme has better performance on the three test cells under the three criteria. This suggests that the two modules play different roles in the estimation process and that the proposed scheme is effective.
3) The feature selection scheme proposed in this paper has good adaptability for batteries of the same type. When the model established using the training dataset is used to test other batteries of the same type, it can achieve a high accuracy estimation.
4.3 Estimation Results of Different Methods
To verify the effectiveness of the proposed SoH estimation method, the performance of the proposed PANet was compared to that of certain published methods and a classic machine learning method, such as Bi-LSTM (Li et al., 2021), FNN (Kaur et al., 2021), DCNN (Shen et al., 2020), and random forest (RF) regression. These models were reimplemented and trained following the author’s description and supplement, including specified data extraction and loss functions. The models were all trained and tested on the same dataset (cell 1 and cell 2 were used as the training cells, while the remaining three cells were used as test cells).
Table 4 lists the results of the SoH estimation achieved by the Bi-LSTM, FNN, DCNN, and RF methods in terms of the RMSE, MAPE, and MaxE. Figure 7 shows the SoH estimation results and errors produced by different methods for three cells.
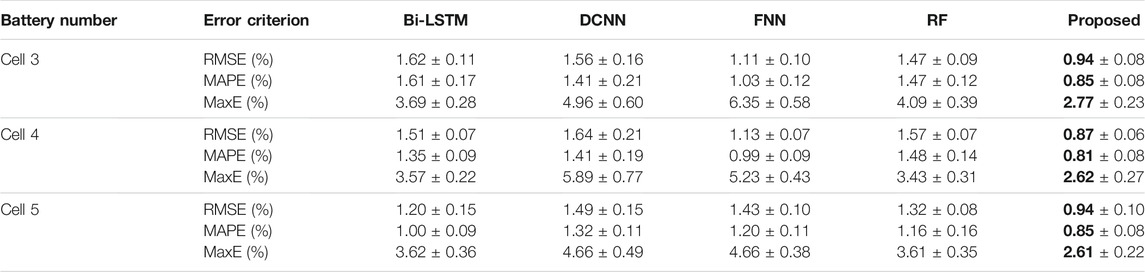
TABLE 4. Performance comparison of different methods.
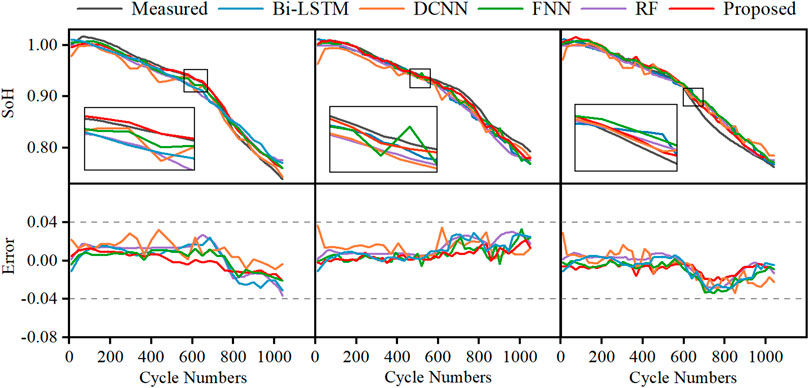
FIGURE 7. SoH estimation results and errors of different methods for cell 3, cell 4, and cell 5
In Figure 7, the proposed model can be seen to precisely track the SoH fading pattern. The model proposed in this paper estimates the SoH of the three cells with RMSEs of 0.94, 0.87, and 0.94%, MAPEs of 0.85, 0.81, and 0.85%, and MaxEs of 2.77, 2.62, and 2.61%. From the perspective of the RMSEs, MAPEs, and MaxEs in individual trials, the performance of PANet outperforms that of the Bi-LSTM, FNN, DCNN, and RF methods. As a result, it is acceptable to conclude that the proposed model is capable of making more accurate SoH estimations than the other considered methods.
4.4 Analysis of Robustness
Sensors frequently interfere with data acquisition in real-world applications, making it critical to evaluate the robustness of the estimation model. Therefore, an analysis was carried out to test the model’s robustness when dealing with noisy data.
In the real world, noise can be divided into two aspects: measurement noise and systematic error (Zheng et al., 2018). Measurement noise, different from systematic error, is an unpredictable variation in the measured signal. Therefore, white Gaussian noise, a kind of noise that has uniform power across the frequency band but has a zero mean value, is applied to the terminal voltage in this paper to simulate the measurement noise in real battery signal measurements.
The degree of added noise is notated as the signal-to-noise ratio (SNR), defined as:
where
In Table 5, the mean and the standard deviation of the estimated performance under different SNR measurement noise injections are displayed and plots are presented in Figure 8.
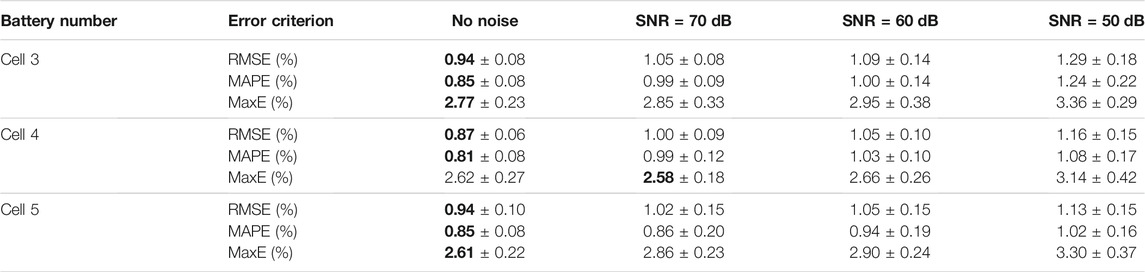
TABLE 5. Performance comparison of noisy inputs.
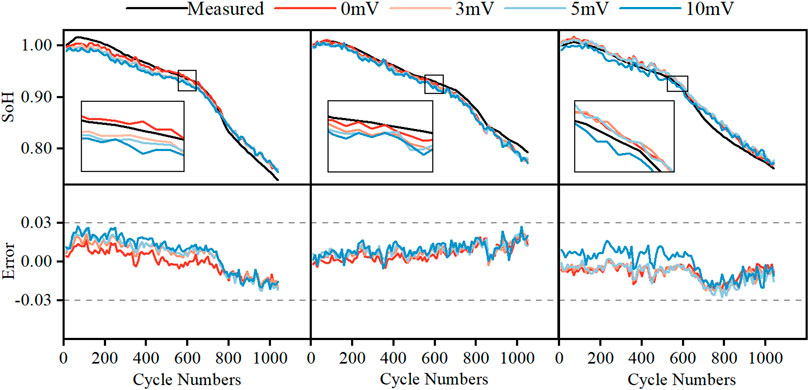
FIGURE 8. SoH estimation results and errors of noisy inputs for cell 3, cell 4, and cell 5.
The estimation results of various noise conditions suggest that the proposed model has strong robustness. The estimation results with no noise added are more accurate. As the noise level rises, the error level rises as well. Even so, a preferable estimation result can still be achieved since the RMSEs are still well within 1.3% when the noise is 50 dB. During the entire operation, the SoH estimation error for the three tested batteries is within 3.5% of the boundaries. This demonstrates the efficiency of the developed methodology when the noise has a Gaussian distribution.
5 Conclusion
This paper presents an intelligent state of health estimation method combining multivariate time series. Below are some of the study’s highlights.
1) A novel feature selection scheme is proposed in this paper. To extract more information from battery data, direct measurement and second-order processing features are combined. The experimental results show that the proposed scheme improves the accuracy of the state of health estimation.
2) An intelligent health estimation method is proposed to build a relationship between the selected features and the state of health. Experimental results show that the proposed model can estimate the state of health of different batteries with a mean absolute percentage error of less than 1%. Compared with four other models, the maximum error is 38% lower on average.
3) The model’s robustness is demonstrated experimentally by adding noise to the input. Under measurement noise injections of 50 dB, a preferable estimation result (maximum error of 3.36%) can be obtained.
In general, the proposed model is suitable for electric vehicles with a cooperative vehicle infrastructure system. It is worth noting that, in addition to neural networks, health feature analysis and screening also deserve further attention to improve the accuracy and real-time performance. In future work, more health feature analyses and screening methods will be studied and compared.
Data Availability Statement
The datasets presented in this article are not readily available because The data are provided by the local company for research purposes, and there is strict limitation for the use of those data. Requests to access the datasets should be directed to YF, fanyq8@mail.sysu.edu.cn.
Author Contributions
XT: Investigation, Visualization. XL: Methodology, Validation, Writing-original draft. HW: Investigation, Visualization. YF: Conceptualization, validation, writing review and editing, funding acquisition. GF: Investigation, Visualization.
Funding
This work was supported by the Key-Area Research and Development Program of Guangdong Province, China (2020B0909040004, 2020B090920002).
Conflict of Interest
The authors declare that the research was conducted in the absence of any commercial or financial relationships that could be construed as a potential conflict of interest.
Publisher’s Note
All claims expressed in this article are solely those of the authors and do not necessarily represent those of their affiliated organizations, or those of the publisher, the editors and the reviewers. Any product that may be evaluated in this article, or claim that may be made by its manufacturer, is not guaranteed or endorsed by the publisher.
References
Ansari, S., Ayob, A., Hossain Lipu, M. S., Hussain, A., and Saad, M. H. M. (2021). Data-Driven Remaining Useful Life Prediction for Lithium-Ion Batteries Using Multi-Charging Profile Framework: A Recurrent Neural Network Approach. Sustainability 13, 13333. doi:10.3390/su132313333
Bahdanau, D., Cho, K. H., and Bengio, Y. (2015). “Neural Machine Translation by Jointly Learning to Align and Translate,” in Proceedings of 3rd International Conference on Learning Representations, ICLR2015, San Diego, CA, May 7–9, 2015, Conference Track Proceedings, 1–15.
Bhattacharya, S., Kumar Reddy Maddikunta, P., Meenakshisundaram, I., Reddy Gadekallu, T., Sharma, S., Alkahtani, M., et al. (2021). Deep Neural Networks Based Approach for Battery Life Prediction. Comput. Mater. Contin. 69, 2599–2615. doi:10.32604/cmc.2021.016229
Cheng, G., Wang, X., and He, Y. (2021). Remaining Useful Life and State of Health Prediction for Lithium Batteries Based on Empirical Mode Decomposition and a Long and Short Memory Neural Network. Energy 232, 121022. doi:10.1016/j.energy.2021.121022
Fan, Y., Zhan, D., Tan, X., Lyu, P., and Rao, J. (2021). Optimization of Cooling Strategies for an Electric Vehicle in High-Temperature Environment. Appl. Therm. Eng. 195, 117088. doi:10.1016/j.applthermaleng.2021.117088
Islam, S. M. R., and Park, S.-Y. (2020). Precise Online Electrochemical Impedance Spectroscopy Strategies for Li-Ion Batteries. IEEE Trans. Ind. Applicat. 56, 1661–1669. doi:10.1109/TIA.2019.2958555
Karatzoglou, A., and Hidasi, B. (2017). “Deep Learning for Recommender Systems,” in Proceedings of the Eleventh ACM Conference on Recommender Systems (RecSys '17), Como, Italy, August 27–31, 2017 (New York, NY: Association for Computing Machinery), 396–397. doi:10.1145/3109859.3109933
Kaur, K., Garg, A., Cui, X., Singh, S., and Panigrahi, B. K. (2021). Deep Learning Networks for Capacity Estimation for Monitoring SOH of Li‐ion Batteries for Electric Vehicles. Int. J. Energ. Res. 45, 3113–3128. doi:10.1002/er.6005
Li, K., Zhou, P., Lu, Y., Han, X., Li, X., and Zheng, Y. (2020). Battery Life Estimation Based on Cloud Data for Electric Vehicles. J. Power Sourc. 468, 228192. doi:10.1016/j.jpowsour.2020.228192
Li, W., Cao, D., Jöst, D., Ringbeck, F., Kuipers, M., Frie, F., et al. (2020a). Parameter Sensitivity Analysis of Electrochemical Model-Based Battery Management Systems for Lithium-Ion Batteries. Appl. Energ. 269, 115104. doi:10.1016/j.apenergy.2020.115104
Li, W., Fan, Y., Ringbeck, F., Jöst, D., Han, X., Ouyang, M., et al. (2020b). Electrochemical Model-Based State Estimation for Lithium-Ion Batteries with Adaptive Unscented Kalman Filter. J. Power Sourc. 476, 228534. doi:10.1016/j.jpowsour.2020.228534
Li, W., Garg, A., Le, M. L. P., Ruhatiya, C., Gao, L., and Tran, V. M. (2020c). Electrochemical Performance Investigation of LiFePO4/C0.15-x (x=0.05, 0.1, 0.15 CNTs) Electrodes at Various Calcination Temperatures: Experimental and Intelligent Modelling Approach. Electrochimica Acta 330, 135314. doi:10.1016/j.electacta.2019.135314
Li, W., Rentemeister, M., Badeda, J., Jöst, D., Schulte, D., and Sauer, D. U. (2020d). Digital Twin for Battery Systems: Cloud Battery Management System with Online State-Of-Charge and State-Of-Health Estimation. J. Energ. Storage 30, 101557. doi:10.1016/j.est.2020.101557
Li, W., Sengupta, N., Dechent, P., Howey, D., Annaswamy, A., and Sauer, D. U. (2021). Online Capacity Estimation of Lithium-Ion Batteries with Deep Long Short-Term Memory Networks. J. Power Sourc. 482, 228863. doi:10.1016/j.jpowsour.2020.228863
Liu, K., Hu, X., Wei, Z., Li, Y., and Jiang, Y. (2019). Modified Gaussian Process Regression Models for Cyclic Capacity Prediction of Lithium-Ion Batteries. IEEE Trans. Transp. Electrific. 5, 1225–1236. doi:10.1109/TTE.2019.2944802
Ouyang, T., Xu, P., Chen, J., Lu, J., and Chen, N. (2021). An Online Prediction of Capacity and Remaining Useful Life of Lithium-Ion Batteries Based on Simultaneous Input and State Estimation Algorithm. IEEE Trans. Power Electron. 36, 8102–8113. doi:10.1109/TPEL.2020.3044725
Pastor-Fernández, C., Uddin, K., Chouchelamane, G. H., Widanage, W. D., and Marco, J. (2017). A Comparison between Electrochemical Impedance Spectroscopy and Incremental Capacity-Differential Voltage as Li-Ion Diagnostic Techniques to Identify and Quantify the Effects of Degradation Modes within Battery Management Systems. J. Power Sourc. 360, 301–318. doi:10.1016/j.jpowsour.2017.03.042
Shen, S., Sadoughi, M., Li, M., Wang, Z., and Hu, C. (2020). Deep Convolutional Neural Networks with Ensemble Learning and Transfer Learning for Capacity Estimation of Lithium-Ion Batteries. Appl. Energ. 260, 114296. doi:10.1016/j.apenergy.2019.114296
Sheng, H., Liu, X., Bai, L., Dong, H., and Cheng, Y. (2021). Small Sample State of Health Estimation Based on Weighted Gaussian Process Regression. J. Energ. Storage 41, 102816. doi:10.1016/j.est.2021.102816
Tan, X., Lyu, P., Fan, Y., Rao, J., and Ouyang, K. (2021a). Numerical Investigation of the Direct Liquid Cooling of a Fast-Charging Lithium-Ion Battery Pack in Hydrofluoroether. Appl. Therm. Eng. 196, 117279. doi:10.1016/j.applthermaleng.2021.117279
Tan, X., Zhan, D., Lyu, P., Rao, J., and Fan, Y. (2021b). Online State-Of-Health Estimation of Lithium-Ion Battery Based on Dynamic Parameter Identification at Multi Timescale and Support Vector Regression. J. Power Sourc. 484, 229233. doi:10.1016/j.jpowsour.2020.229233
Tan, Y., Zhao, G., Zhao, G., and Zhao, G. (2020). Transfer Learning with Long Short-Term Memory Network for State-Of-Health Prediction of Lithium-Ion Batteries. IEEE Trans. Ind. Electron. 67, 8723–8731. doi:10.1109/TIE.2019.2946551
Tang, S., Wang, Z., Guo, H., Wang, J., Li, X., and Yan, G. (2019). Systematic Parameter Acquisition Method for Electrochemical Model of 4.35 V LiCoO2 Batteries. Solid State Ionics 343, 115083. doi:10.1016/j.ssi.2019.115083
Vaswani, A., Shazeer, N., Parmar, N., Uszkoreit, J., Jones, L., Gomez, A. N., et al. (2017). “Attention is All You Need,” in Proceedings Advances in Neural Information Processing Systems 30: Annual Conference on Neural Information Processing Systems 2017, Long Beach, CA, December 4–9, 2017, 5999–6009.
Wang, J., Liu, S., Wang, S., Liu, Q., Liu, H., Zhou, H., et al. (2021). Multiple Indicators-Based Health Diagnostics and Prognostics for Energy Storage Technologies Using Fuzzy Comprehensive Evaluation and Improved Multivariate Grey Model. IEEE Trans. Power Electron. 36, 12309–12320. doi:10.1109/TPEL.2021.3075517
Wu, J., Wei, Z., Li, W., Wang, Y., Li, Y., and Sauer, D. U. (2021). Battery Thermal- and Health-Constrained Energy Management for Hybrid Electric Bus Based on Soft Actor-Critic DRL Algorithm. IEEE Trans. Ind. Inf. 17, 3751–3761. doi:10.1109/TII.2020.3014599
Xiong, R., Pan, Y., Shen, W., Li, H., and Sun, F. (2020). Lithium-ion Battery Aging Mechanisms and Diagnosis Method for Automotive Applications: Recent Advances and Perspectives. Renew. Sustainable Energ. Rev. 131, 110048. doi:10.1016/j.rser.2020.110048
Yan, J., Xu, P., Chen, S., Wang, G., Zhang, F., Zhao, W., et al. (2020). Construction of Highly Ordered ZnO microrod@SnO2 Nanowire Heterojunction Hybrid with a Test-Tube brush-like Structure for High Performance Lithium-Ion Batteries: Experimental and Theoretical Study. Electrochimica Acta 330, 135312. doi:10.1016/j.electacta.2019.135312
Yang, D., Zhang, X., Pan, R., Wang, Y., and Chen, Z. (2018). A Novel Gaussian Process Regression Model for State-Of-Health Estimation of Lithium-Ion Battery Using Charging Curve. J. Power Sourc. 384, 387–395. doi:10.1016/j.jpowsour.2018.03.015
Yang, H., Wang, P., An, Y., Shi, C., Sun, X., Wang, K., et al. (2020). Remaining Useful Life Prediction Based on Denoising Technique and Deep Neural Network for Lithium-Ion Capacitors. eTransportation 5, 100078. doi:10.1016/j.etran.2020.100078
Yang, Y. (2021). A Machine-Learning Prediction Method of Lithium-Ion Battery Life Based on Charge Process for Different Applications. Appl. Energ. 292, 116897. doi:10.1016/j.apenergy.2021.116897
Zhang, S., Zhai, B., Guo, X., Wang, K., Peng, N., and Zhang, X. (2019). Synchronous Estimation of State of Health and Remaining Useful Lifetime for Lithium-Ion Battery Using the Incremental Capacity and Artificial Neural Networks. J. Energ. Storage 26, 100951. doi:10.1016/j.est.2019.100951
Keywords: lithium-ion battery, SoH, health feature extraction, neural network, attention mechanism
Citation: Tan X, Liu X, Wang H, Fan Y and Feng G (2022) Intelligent Online Health Estimation for Lithium-Ion Batteries Based on a Parallel Attention Network Combining Multivariate Time Series. Front. Energy Res. 10:844985. doi: 10.3389/fenrg.2022.844985
Received: 29 December 2021; Accepted: 03 February 2022;
Published: 24 February 2022.
Edited by:
Zhile Yang, Shenzhen Institutes of Advanced Technology (CAS), ChinaReviewed by:
Byeng D. Youn, Seoul National University, South KoreaJichao Hong, University of Science and Technology Beijing, China
Copyright © 2022 Tan, Liu, Wang, Fan and Feng. This is an open-access article distributed under the terms of the Creative Commons Attribution License (CC BY). The use, distribution or reproduction in other forums is permitted, provided the original author(s) and the copyright owner(s) are credited and that the original publication in this journal is cited, in accordance with accepted academic practice. No use, distribution or reproduction is permitted which does not comply with these terms.
*Correspondence: Yuqian Fan, fanyq8@mail.sysu.edu.cn