Effects of particle diameter and plate thickness on transpiration cooling for double-layer porous plates
 Xiaokai Zhang
 Guanghan Yan1
  Yi Zhang
- 1Key Laboratory of Ocean Energy Utilization and Energy Conservation of Ministry of Education, Dalian University of Technology, Dalian, China
- 2Aeroengine Research Institute, Aero Engine Corporation of China, Shenyang, China
Transpiration cooling is a highly efficient active thermal protection technology, which has a great application prospect in the thermal protection of hypersonic vehicles. Nevertheless, the problem of large injection pressure caused by porous structure in transpiration cooling system has been ignored in previous studies. In this work, the transpiration cooling performance of double-layer sintered metal particle plates with different particle diameter combinations and plate thickness were simulated. The results showed that the cooling effectiveness of double-layer plates was improved when the particle diameter of the porous plate in direct contact with the main stream decreased. The inner plate particle diameter and plate thickness had little effect on cooling performance. By increasing inner plate particle diameter, the coolant injection pressure can be lowered by 41% while the structural thickness was maintained. Further reducing the thickness of the outer plate to 1/4 of the total thickness can reduce the injection pressure to 38% of the single plate, which provided an optimization direction for reducing engine power consumption caused by heat dissipation.
1 Introduction
With the development of hypersonic vehicle and space technology, the necessity for thermal shielding has risen dramatically (Wang et al., 2021). When a hypersonic aircraft flies close to 10 Mach, the windward surface is exposed to an ultra-thermal environment, and the surface temperature of some parts exceeds 3500 K. Continuous aerodynamic heating is a problem for hypersonic cruise missiles (Dong et al., 2019). The research of aircraft shape design and thermal protection materials is necessary for the development of spacecraft return technology (Ji et al., 2008; Hayashi and Wakayama, 2009). As a result, the thermal protection system is critical for the safety of hypersonic aircraft that are subjected to high levels of aerodynamic heating (Wang et al., 2014).
Figure 1 shows a schematic diagram of transpiration cooling, which is a bionic technology. The coolant is sprayed through the porous surface of the bionic structure to cut off heat transfer to the structure, with a maximum cooling capacity of 140 MW/m2 (Jiang et al., 2004; van Foreest et al., 2009). Due to the efficient thermal protection effect, it has been paid more and more attention in the thermal protection of the surface of a hypersonic vehicle and scramjet chambers (Jackson et al., 2004; Liu et al., 2013; Castiglone et al., 2015).

FIGURE 1. Schematic diagram of transpiration cooling.
Porous media had great advantages in enhancing fluid-solid heat transfer (Sun et al., 2022), its structure (Yakimov, 2015) and physical characteristics (Liu et al., 2010; Liu et al., 2013) had significant impact on transpiration cooling effect. One of the most important parameters influencing the effect of transpiration cooling was particle diameter (Huang et al., 2017; Huang et al., 2019). Reducing the particle diameter minimized the pore channels, increased the specific surface area of porous, enhanced fluid convective heat transfer, and hence improved cooling efficiency (Shi and Wang, 2011). However, reducing the particle diameter will greatly increase the coolant injection pressure, which cannot be ignored in the actual flying process of airplane.
Cosart, (1975) experimentally tested the influence of varied substrate thickness on the cooling efficiency, and found that the transpiration cooling effect is independent of the thickness of porous media. But the pressure drop of the coolant through the porous media increased significantly with the increase of the thickness (Kilic, 2019; Su et al., 2019; Su et al., 2021), affecting the endurance of the aircraft. Because of the mainstream’s aerodynamic effect during high-speed flight, porous media needed to be thick enough to assure mechanical stability in the actual structural design. Thickness-related increases in injection pressure at this point cannot be disregarded.
In recent years, some innovative porous media transpiration cooling structures have been presented, one of which is a double-layer or multi-layer composite porous structure with various features (Wolfersdorf, 2005; Luo et al., 2021). Liu et al., (2013) and Wang (Shi and Wang, 2008) investigated the transpiration cooling in a double-layer porous structure. Laschet et al., (2006) also numerically studied the temperature profile and local cooling efficiency of multi-layer plates in transpiration cooling. The findings revealed that the temperature of the solid surface near the main stream was influenced by thermal conductivity and the porosity. When the mass flow of coolant was constant, the layer close to the hot side had a significant impact on the surface temperature, whereas the layer close to the cold side had little impact. Ma et al., (2016) experimentally studied the transpiration cooling performance of double-layer and triple-layer sintered woven wire mesh structures. It was found that the cooling efficiency increased with the increase of the average porosity, and that the arrangement of plates with varied porosity had a significant impact on pressure drop. These studies showed that a multi-layer configuration was an effective transpiration cooling structure, they also proved that the influence law of material thermal conductivity and porosity on the transpiration cooling of multi-layer configurations was somewhat different from that of single-layer configurations: porous materials with the same structural parameters had different effects on the cooling performance when they were in different positions in a multi-layer plate. Therefore, it was necessary to examine how the structural parameters of porous materials impact the transpiration cooling performance. However, it had not been sufficiently studied, especially for sintered metal particle porous materials, where the effects of particle diameter and material thickness on transpiration cooling of multi-layer were not clear.
Herein, we simulated the transpiration cooling of sintered Ti-6Al-4V titanium (TC4) metal particle plates with different particle diameters. The cooling effect of each specimen were calculated. By comparing the temperature distribution, velocity distribution, cooling efficiency and pressure drop characteristics in the transpiration cooling process, the influence of particle diameter and plate thickness on the transpiration cooling effect and coolant injection pressure was analyzed. The transpiration cooling characteristics of single and double layer plates were further compared, and it was found that using a double-layer plate can greatly reduce coolant injection pressure, proving that, in addition to changing the porosity, the rational design of the particle diameter combination of the double-layer plate was also a way to reduce injection pressure.
2 Description of the computational domain
2.1 Physical model
Figure 2 depicts a two-dimensional physical model with a high-temperature mainstream channel, porous plate and cooling cavity. The total thickness of the porous plate was 6 mm, and was divided into two regions: the outer plate in contact with the main stream was plate A, and the inner plate in contact with the cooling cavity was plate B. The thickness of plate was h1 and h2 respectively. To prevent the influence of inlet and outlet effects on transpiration cooling, the main channel was extended 55 mm to the left and right sides based on porous media. The high temperature mainstream flowed in from the left entrance and flowed out through the right exit. Air as the coolant was injected from the cooling chamber’s bottom and flowed out of the porous plate’s outer surface, mixing with the high-temperature main stream.
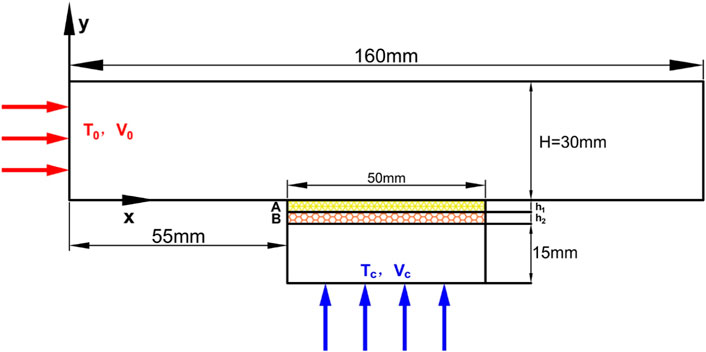
FIGURE 2. Model and coordinates for double-layer sintered porous wall.
2.2 Mathematical model
The flow of main stream and coolant in porous regions should be investigated together. In the pure fluid or porous media region, relevant physical rules restrict fluid flow and heat transfer. Table 1 shows the governing equations of all the heat transfer processes.
TABLE 1. Conservation equations of the main stream and porous regions.
The momentum equation in porous media adopts Darcy-Brinkman-Forchheimer (D-B-F model) (Vafai and Tien, 1981), which comprehensively considers the influence of viscous force and inertia force on the flow of porous media. The values of K and F are related to the structure of porous media and can generally be calculated by Ergun (Ergun, 1952).
2.3 Boundary conditions and structural parameters
The main stream and coolant were air, the porous media was made of TC4 alloy. Boundary conditions and physical properties were shown in Table 2, wherein the main stream and coolant inlet adopt mass flow inlet, the outlet was the pressure outlet, interior condition was used for the outer and inner surfaces of porous media, and the other wall surfaces were adiabatic and non-slip wall conditions.
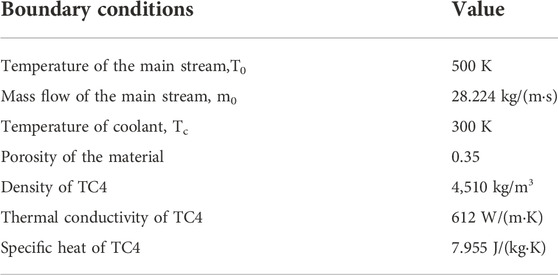
TABLE 2. Boundary conditions.
There was a large temperature differential between the coolant and the main stream during transpiration cooling, and when the coolant traveled through the porous media, there was a large pressure shift. The ideal gas state equation was utilized to solve the gas density since temperature and pressure caused substantial changes in gas density. Simultaneously, the specific heat, viscosity, and thermal conductivity of the fluid also had a great relationship with temperature. The above variables were fitted as polynomial functions of temperature to ensure the accuracy of the calculation results:
2.4 Evaluation parameters
Two dimensionless parameters, injection rate and cooling efficiency, were used to evaluate the transpiration cooling effect:
Where, ρ represents fluid density, u represents flow rate, and T represents temperature. Subscript C represents coolant parameters and 0 represents mainstream parameters. Tiw represents porous media wall temperature without transpiration cooling, and Tcw represents porous media wall temperature after transpiration cooling.
2.5 Mesh generation and model validation
The structured grids were carried out to mesh the geometric model. Considering the interface fusion of different computing regions, the wall of the main channel, the outer and inner surfaces of porous media were treated with mesh encryption. The overall effect of meshing and partial encryption effect of porous media were shown in Figure 3. When the enhanced wall function was used to solve the bottom flow, the dimensionless distance parameter y plus was guaranteed to be less than 1.
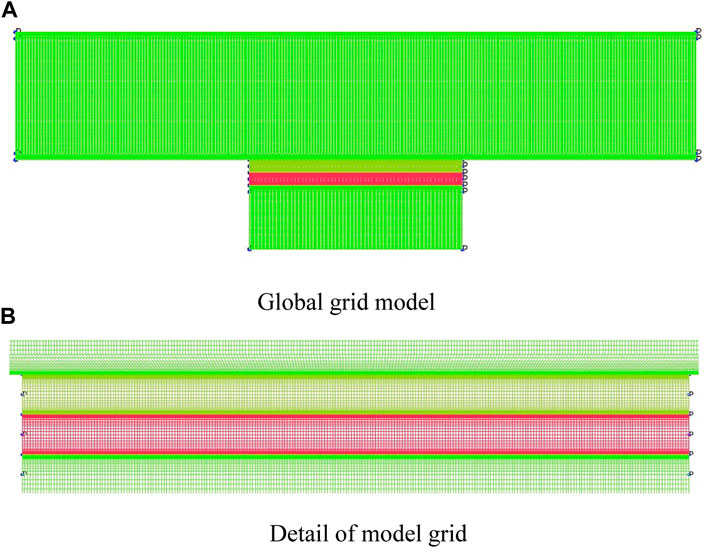
FIGURE 3. Computational domain grid. (A) Global grid model, (B) Detail of model grid.
The simulation was carried out using the ANSYS Fluent 20.2 program. The mesh size has a considerable impact on the correctness of a transient problem solution. The outer surface temperature distributions of porous plates were measured by four mesh strategies, Mesh 1: 112,766, Mesh 2: 137,793, Mesh 3: 152,299 and Mesh 4: 198,650. The comparisons were shown in Figure 4. In the diagram, x/L represents the relative position of monitoring points on the outer surface of the porous plate. It showed that Mesh 2, Mesh 3, and Mesh 4 exhibited a high degree of coincidence, with a maximum divergence of 0.5%, Mesh 1 had a temperature distribution that was considerably different from the other three. Considering the accuracy and efficiency of calculation, model with 137,793 grid was selected for numerical simulation calculation.
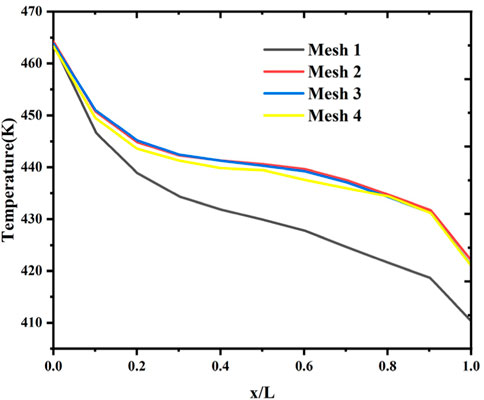
FIGURE 4. Mesh independence verification.
To validate the above mathematical model and numerical strategy of gas transpiration cooling, the experimental results exhibited by Liu et al. (Liu et al., 2013) were used to compare with the simulation results in this work. The geometric model was shown in Figure 5A. In the model, the porous media plate was sintered with stainless steel metal particles, with a porous region length L of 120 mm, and a porosity of 0.367. The boundary conditions were consistent with the experiment.
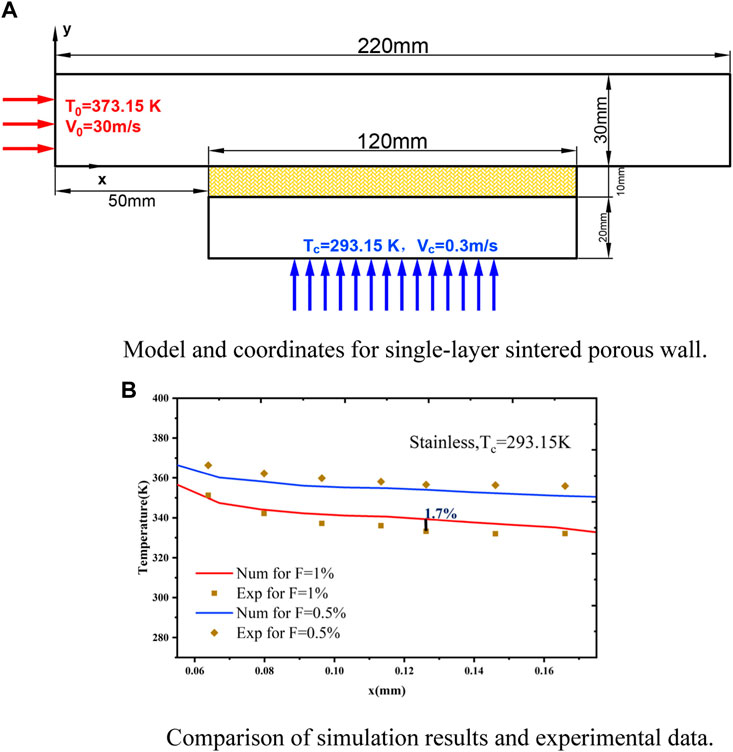
FIGURE 5. (A) Model and coordinates for single-layer sintered porous wall. (B) Comparison of simulation results and experimental data.
The numerical and experimental temperature distribution along the porous plate’s outer surface were shown in Figure 5B. It can be seen that the temperature distribution trend of the outer surface of porous media derived by numerical modeling was comparable with the experimental trend, with a maximum error of 1.7%. Therefore, it can be concluded that the numerical model proposed in this study could be confidently applied for the plate transpiration cooling.
3 Results and discussions
Using validated numerical methods, the impacts of particle diameter and plate thickness on transpiration cooling of double-layer plates were investigated, and the performance of coolant injection pressure was optimized.
3.1 Effect of plate A particle diameter on cooling efficiency
In order to analyze the influence of plate A particle diameter on the cooling efficiency and injection pressure, five specimens were set up and listed in Table 3. In Ref. (Liyan et al., 2005), a single-layer porous plate with a particle diameter ranging from 25 μm to 175 μm had relatively high cooling performance. Therefore, plate B particle diameter in all specimens was 175 μm, Plate A particle diameter ranged from 25 to 140 μm, and each plate’s particles were uniform in size and 3 mm thick.

TABLE 3. The plate position arrangement of double-layer plates.
The temperature contours in Figure 6A showed double-layer plate temperature distribution with different plate A particle diameter. The difference in temperature distribution was small for all models in the first half of the porous region (0.055 < x < 0.065), but in the posterior half of the porous region (0.065 < x < 0.105), the difference in temperature distribution was obvious.
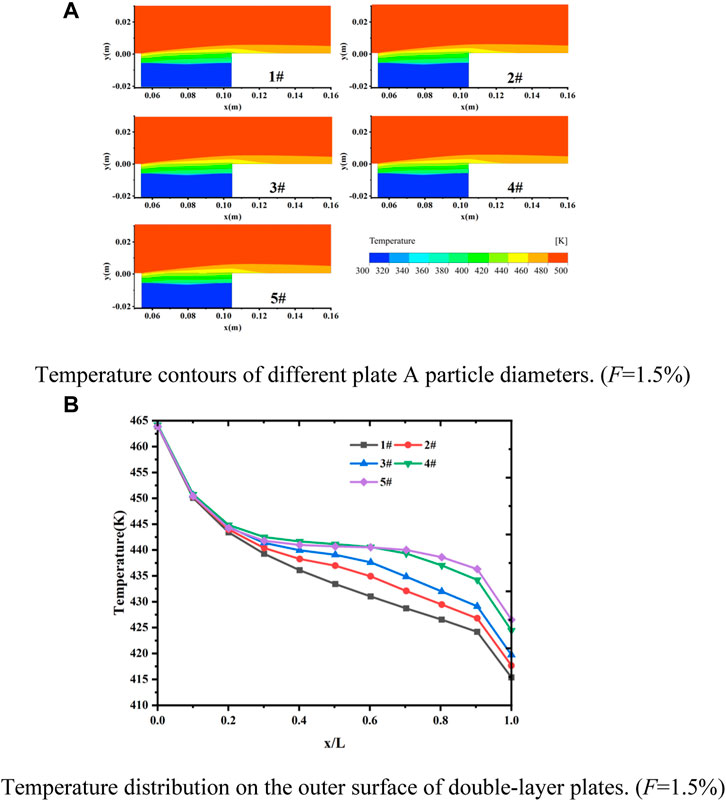
FIGURE 6. (A) Temperature contours of different plate A particle diameters. (F = 1.5%). (B) Temperature distribution on the outer surface of double-layer plates. (F = 1.5%).
The temperature distribution on the outer surface shown in Figure 6B illustrates the difference more clearly. In the posterior half of the porous plates (0.2 < x/L < 1), the outer surface temperature in Test 1 decreased rapidly along the main stream direction, and significantly lower than that in the other specimens, indicating that the plate A particle diameter had a great influence on double-layer plates’ transpiration cooling effectiveness. When the plate with smaller particle diameter was in contact with the main stream, the transpiration cooling effect was better. This was because plates with smaller particle diameter had larger fluid-solid contact areas.
Figure 7 depicts the cooling efficiency at different injection rates. It can be observed that the cooling efficiency of all specimens grew monotonically as the injection rate increased. When the injection rate increased from 0.75% to 2%, the cooling efficiency difference between Test 1 and Test 5 was 0.021 and 0.037, respectively. This suggested that when the injection rate increased, the effect of plate A particle diameter on cooling efficiency became increasingly apparent. The smaller the particle diameter of plate A was, the faster the cooling efficiency increased with the increase of the injection rate.
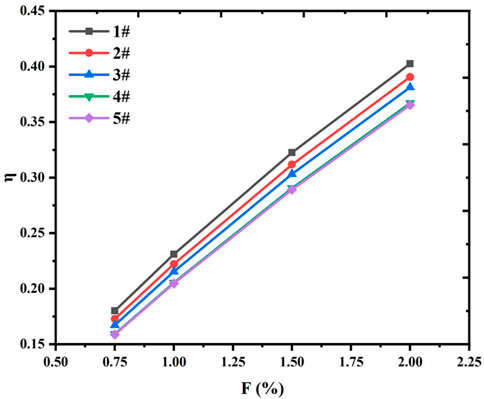
FIGURE 7. Cooling efficiency for various coolant injection rates.
This was because the reduction of particle diameter had no effect on the heat absorption capacity of the coolant, meaning that a given amount of coolant can absorb a limited amount of heat. As a result, when the injection rate was low, the heat exchange of coolant flowing through the porous region was sufficient, and increasing the heat exchange area continuously did not significantly enhance the heat exchange. With the increase of injection rate, the improvement of cooling efficiency will be more significant.
3.2 Effect of plate A particle diameter on injection pressure
Figure 8 shows the variation of coolant injection pressure at different plate A particle diameter. It can be seen from the figure that the Test 1, which had the highest cooling efficiency, required an extremely high coolant injection pressure compared to other situations.
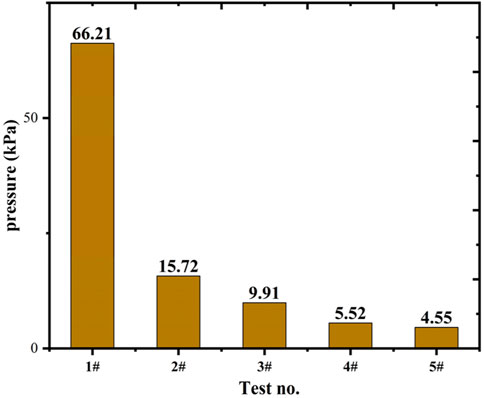
FIGURE 8. Coolant injection pressure for different specimens. (F = 1.5%).
The pressure distribution contour of the porous region were shown in Table 4. In Test 1, the pressure varied slightly when the coolant traveled through plate B, but it dropped significantly once it entered plate A. Plate A had a pressure drop of 98.5% of the total pressure drop, compared to 90.7% in Test 2 and 84.4% in Test 3. It meant that when plate A particle diameter decreased, the injection pressure gradually rose, the rising speed also became faster, and the gradient was focused in the region with the lower particle diameter.
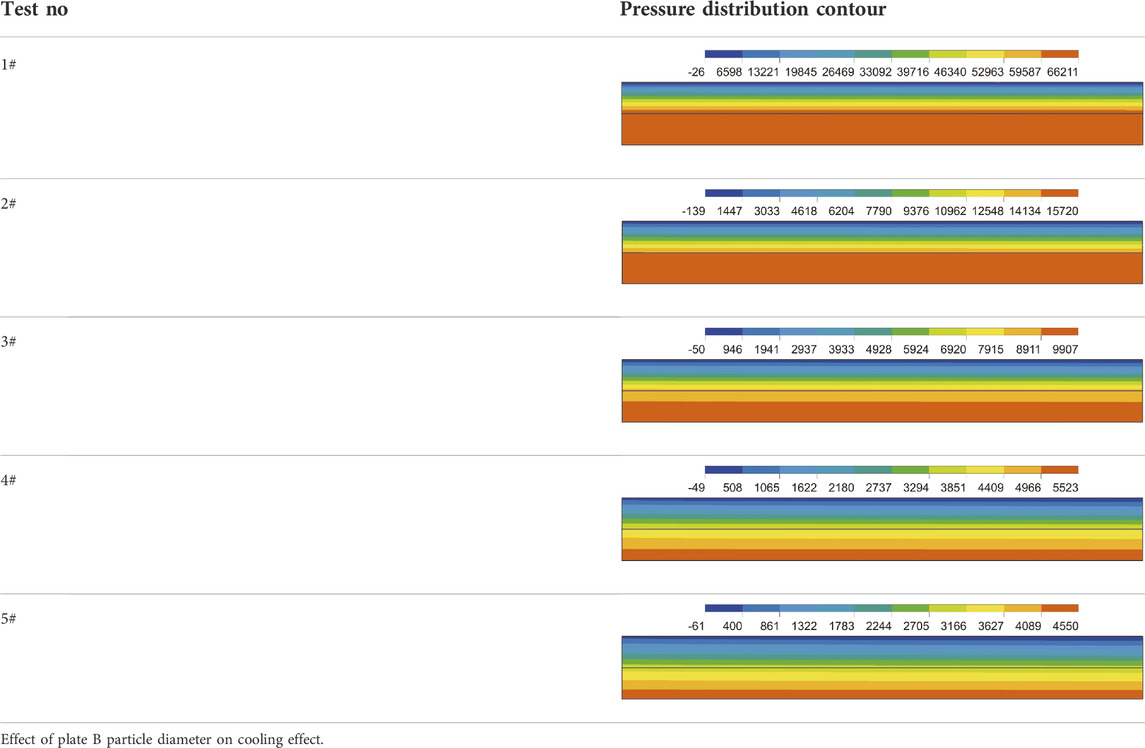
TABLE 4. Pressure distributions in the porous plates. (F = 1.5%).
In this section, the specimens were divided into two groups, and the particle combinations were shown in Table 5. The particle diameter of plate B varied from 25 μm to 175 μm, with both layers being 3 mm thick. In each group, a single-layer plate was used as a comparison. The particle diameter of the single-layer plate was the same as that of plate A, with a thickness of 6 mm.
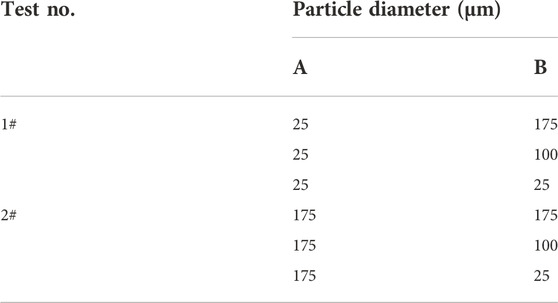
TABLE 5. The particle diameter combination of double-layer plates.
Figure 9 illustrates the temperature contours for three different particle diameter combinations in Test 1. It can be seen that the temperature in the porous region varied in both x and y directions, with the temperature closer the upstream region being higher. The temperature distribution in the double-layer plates was highly consistent with that of the single-layer plate. Even in the area of plate B with varying particle sizes, the temperature variation rule was the identical to that of the single-layer plate.
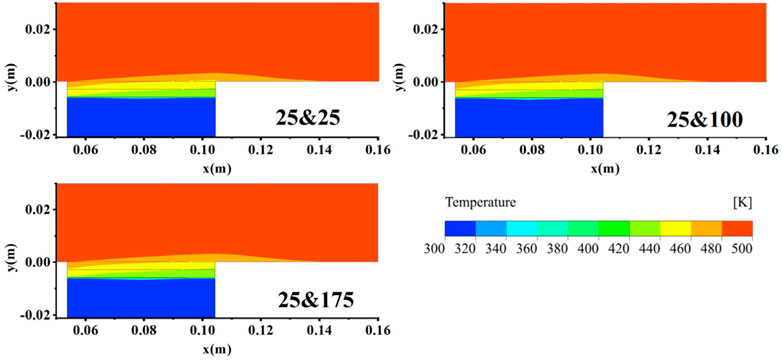
FIGURE 9. Temperature contours of different particle diameter combinations in Test 1. (F = 0.75%).
Figure 10 depicts the transpiration cooling efficiency under the injection rate of 0.75%–2%. The cooling efficiency of all specimens improved dramatically as the injection rate increased. In Test 1, the cooling efficiency of the double-layer plates was always the same as that of the single-layer plate, and the same rule applied in Test 2. Therefore, when the structure of plate A is unchanged, the particle diameter of plate B did not affect the transpiration cooling effect of the double-layer plate.
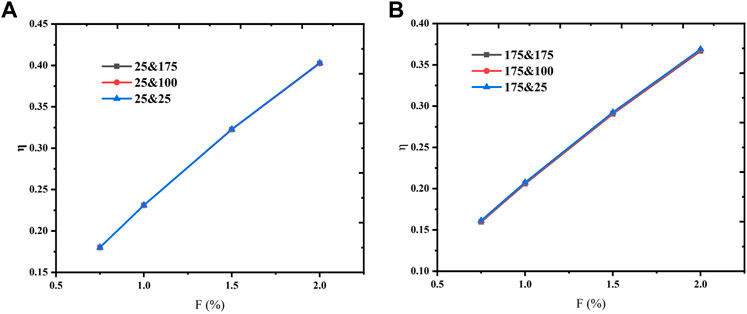
FIGURE 10. Comparison of cooling efficiency for various injection rates. (A) Test 1 and (B) Test 2.
By comparing the velocity distribution in the near-wall area in Figure 11, it can be found that the boundary layer distribution of the three specimens in Test 1 were identical. The distribution law of coolant in the boundary layer position was the same, which indicated plate B did not affect the boundary layer distribution. This explained the same temperature distribution of different structures in Figure 9.
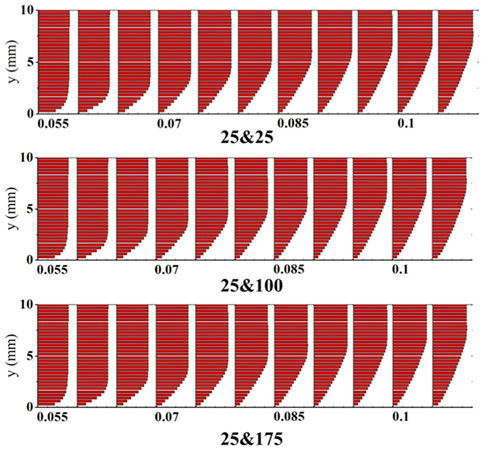
FIGURE 11. Velocity distributions in the near wall region for various models in Test 1 (F = 0.75%).
3.3 Effect of plate B particle diameter on injection pressure
The coolant flow direction in the porous region was the same in both the double-layer and single-layer plates: the coolant flow velocity in the y-direction was larger, while the x-direction was almost zero, the flow can be approximated as a one-dimensional flow. By comparing the velocity contours in Figure 12A, it can be found that, the flow velocity on the outer surface of double-layer plates was the same as that of single-layer plate, but the velocity gradient along the flow direction of the two was different. The velocity gradient of the specimens with the largest particle diameter in plate B was the smallest. The calculation results of specimens in Test 2, which was displayed in Figure 12B, also showed the same rule.
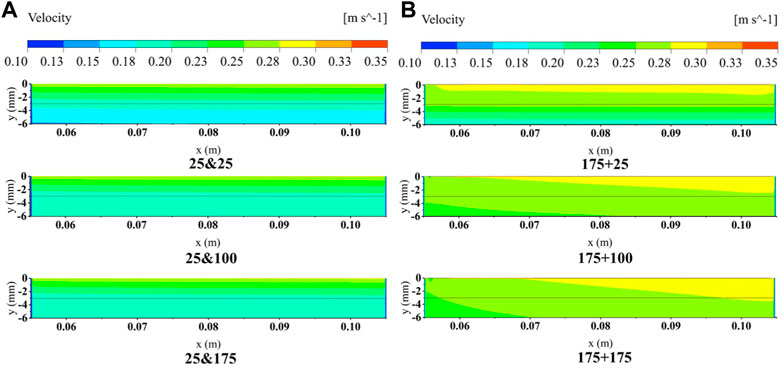
FIGURE 12. Velocity distributions in double-layer plates for various models (F = 0.75%) (A) Test 1 and (B) Test 2.
The difference in velocity leaded to a difference in coolant injection pressure between the different models. Figure 13 shows the coolant injection pressure at different injection rates. When the injection rate was 0.75% and the particle diameter of plate B was raised from 25 μm to 175 μm, the coolant injection pressure decreased by 41%. The results also illustrated that the gap between injection pressure curves increased with increasing injection rate. This phenomenon indicated that the influence of plate B particle diameter on injection pressure was gradually stronger with the increase of injection rate.

FIGURE 13. Injection pressure for various coolant injection rates. (A) Test 1 and (B) Test 2.
According to the conclusion of 3.3, since the same particle diameter of plate A, the cooling effect of double-layer plates did not change compared with that of single-layer plate. This was a feasible scheme to optimize the coolant injection pressure.
3.4 Effect of plate thickness on cooling effect and injection pressure
The thickness distribution of the double-layer plates were shown in Table 6. In all specimens, the total thickness of the two layers was 6 mm. For plate A, porous plate with 25 μm particles was selected, in this case, the cooling performance of the system is better. Plate B was chosen 175 μm particle diameter to reduce pressure drop.
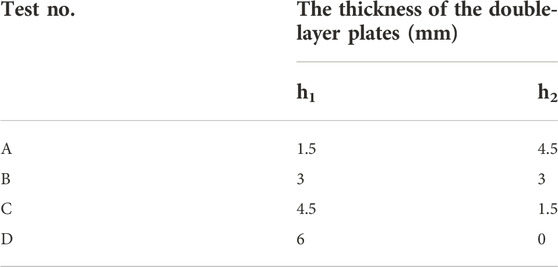
TABLE 6. Double-layer plates arrangement of unequal thickness.
The transpiration cooling temperature distribution of different kinds of thickness combinations was shown in Figure 14A. The single-layer porous plate with particle diameter of 25 μm (Test D) was taken as the comparison. From the figure, the temperature contours inside the porous media were similar for all the cases.
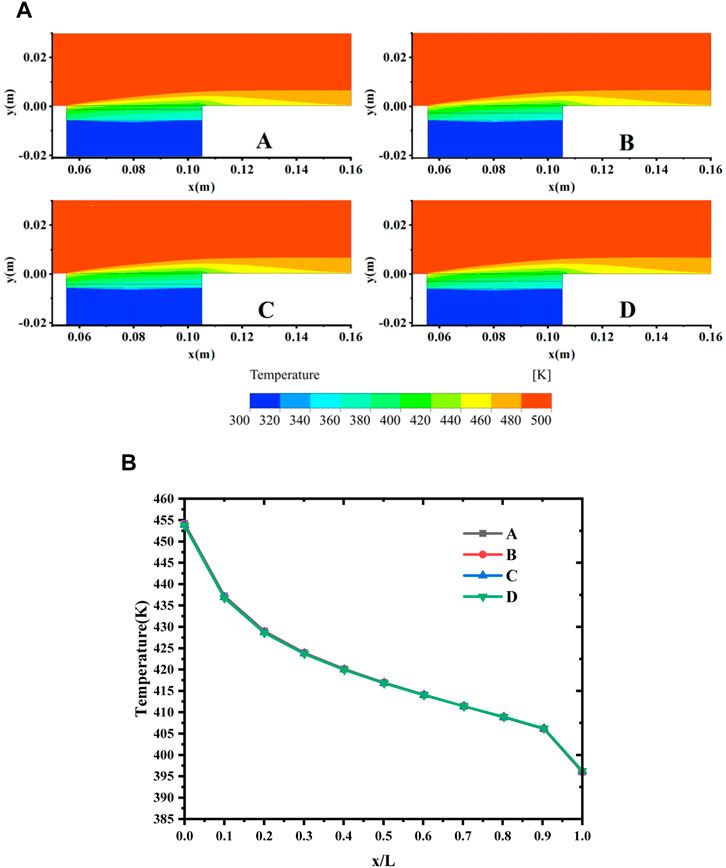
FIGURE 14. (A) Temperature contours of different plate thickness. (F = 2%). (B) Temperature distribution on the outer surface of a porous plate. (F = 2%).
Figure 14B shows the temperature distribution on the outer surface of the porous plates. It can be seen that the cooling effect of Test A/B/C was identical with that of Test D, proving that at least within the calculation range, the thickness variation of plate A and B will not affect the cooling efficiency. In Ref. (Langener et al., 2012), experiments have proved that the thickness of single-layer porous plate did not affect the cooling efficiency. When evaluating the influence of thickness alone, the effect of plate A thickness on cooling efficiency was consistent with that of a single-layer plate in Ref. (Langener et al., 2012). Plate B was equivalent to an addition to a single-layer transpiration cooling system with plate A as the porous region, and its thickness had no effect on the outer surface temperature distribution of the porous plates.
Injection pressure simulation results for double-layer plates with different thickness combinations were shown in Figure 15. The injection pressure of Test A/B/C was lower than that of Test D (the single-layer plate with the particle diameter of 25 μm), and Test A’s injection pressure was only 38% of that of Test D. Compared to the single-layer plate with the same total thickness, the injection pressure of a double-layer plate with unequal thickness was significantly lower.
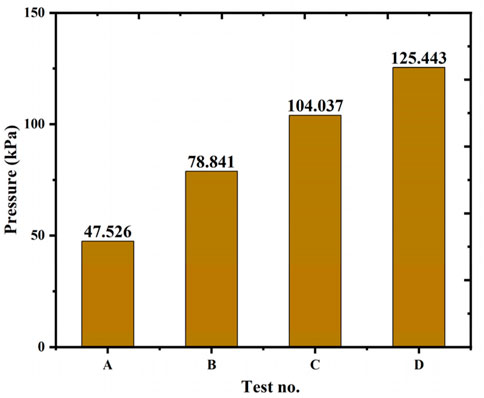
FIGURE 15. Coolant injection pressure of different plate thickness combinations. (F = 2%).
Comprehensive cooling effect and injection pressure analysis showed that, at least within the simulation range, the design of non-equal thickness double-layer plates can reduce coolant injection pressure and engine power consumption during transpiration cooling without significantly changing the cooling efficiency.
4 Conclusion
Transpiration cooling is an effective cooling technology, and it has a wealth of application potential in hypersonic flight vehicles. In the present work, the transpiration cooling porous plate of a certain thickness was divided into two layers, and the effect of particle diameter and plate thickness on transpiration cooling effect and injection pressure was simulated and analyzed. The double-layer porous plate structure was found to have considerable advantages in reducing coolant injection pressure compared to the single-layer plate with the same thickness. Conclusions can be drawn as follows:
1) In the test range, when the outer plate particle diameter decreased from 140 μm to 25 μm, the cooling efficiency for the double-layer plate transpiration cooling structure increased by 9.21%. The cooling efficiency was independent of plate thickness and inner plate particle diameter.
2) The decrease in the particle diameter of both plates A and B results in a significant increase in the coolant injection pressure.
3) When the total thickness of the porous plate remains unchanged, splitting the traditional single-layer plate with a particle diameter of 25 μm into two layers, and increasing the particle diameter of the inner plate to 175 μm can potentially reduce the coolant injection pressure by 41% without affecting the cooling efficiency. On this basis, the injection pressure can be further reduced by reducing the outer plate thickness to 1/4 of the total thickness.
Data availability statement
The original contributions presented in the study are included in the article/Supplementary Material, further inquiries can be directed to the corresponding author.
Author contributions
XZ, GY, and XY provide research ideas and write the original manuscript. XZ carried out all the calculation work. HL, YZ, and YS are responsible for the revision of the paper.
Funding
The grant numbers and funding information in the author's proof are correct, but we are missing one item: the Key Laboratory Development Project of Nanjing University of Aeronautics and Astronautics in 2020(CEPE2020016).
Conflict of interest
XY and HL were employed by the company Aero Engine Corporation of China.
The remaining authors declare that the research was conducted in the absence of any commercial or financial relationships that could be construed as a potential conflict of interest.
Publisher’s note
All claims expressed in this article are solely those of the authors and do not necessarily represent those of their affiliated organizations, or those of the publisher, the editors and the reviewers. Any product that may be evaluated in this article, or claim that may be made by its manufacturer, is not guaranteed or endorsed by the publisher.
Abbreviations
D-B-F model, Darcy-Brinkman-Forchheimer model; TC4 alloy, Ti-6Al-4V titanium alloy.
References
Castiglone, L. A., Northam, G. B., Baker, N. R., and Roe, L. A. (2015). Wall drag in internal mach-2 flow with cavity and transpiration injection. J. Propuls. Power 16 (3), 472–477. doi:10.2514/2.5592
Cosart, W. P. (1975). Transpiration cooling of a rotating disk: An experimental study. Int. J. Heat. Mass Transf. 18 (3), 433–441. doi:10.1016/0017-9310(75)90031-9
Dong, Y. W., Wang, E. T., You, Y. C., Yin, C. P., and Wu, Z. P. (2019). Thermal protection system and thermal management for combined-cycle engine: Review and prospects. ENERGIES 12 (2), 240. doi:10.3390/en12020240
Hayashi, T., and Wakayama, S. (2009). Thermal fatigue behavior of 3D-woven SiC/SiC composite with porous matrix for transpiration cooling passages. Adv. Compos. Mater. 18 (1), 61–75. doi:10.1163/156855108x379354
Huang, G., Liao, Z., Xu, R., Zhu, Y., and Jiang, P. (2019). Self-pumping transpiration cooling with phase change for sintered porous plates. Appl. Therm. Eng. 159, 113870. doi:10.1016/j.applthermaleng.2019.113870
Huang, G., Zhu, Y., Liao, Z., Ouyang, X., and Jiang, P. (2017). Experimental investigation of transpiration cooling with phase change for sintered porous plates. Int. J. Heat Mass Transf. 114, 1201–1213. doi:10.1016/j.ijheatmasstransfer.2017.05.114
Jackson, T. A., Eklund, D. R., and Fink, A. J. (2004). High speed propulsion: Performance advantage of advanced materials. J. Mater. Sci. 39 (19), 5905–5913. doi:10.1023/b:jmsc.0000041687.37448.06
Ji, H. L., Zhang, C. R., Zhou, X. G., and Cao, Y. B. (2008). Fabrication of porous transpiration C/SiC composites. Key Eng. Mater. 368-372, 1053–1055. doi:10.4028/www.scientific.net/kem.368-372.1053
Jiang, P., Si, G., Li, M., and Ren, Z. (2004). Experimental and numerical investigation of forced convection heat transfer of air in non-sintered porous media. Exp. Therm. Fluid Sci. 28 (6), 545–555. doi:10.1016/j.expthermflusci.2003.07.006
Kilic, M. (2019). A heat transfer analysis from a porous plate with transpiration cooling. Therm. Sci. 23 (5), 3025–3034. doi:10.2298/tsci180326135k
Langener, T., von Wolfersdorf, J., Selzer, M., and Hald, H. (2012). Experimental investigations of transpiration cooling applied to C/C material. Int. J. Therm. Sci. 54, 70–81. doi:10.1016/j.ijthermalsci.2011.10.018
Laschet, G., Rex, S., Bohn, D., and Krewinkel, R. (2006). Three-dimensional numerical analysis of curved transpiration cooled plates and homogenization of their aerothermal properties. J. Turbomach. 129 (4), 791–799. doi:10.1115/1.2720867
Liu, Y., Jiang, P., Jin, S., and Sun, J. (2010). Transpiration cooling of a nose cone by various foreign gases. Int. J. Heat Mass Transf. 53 (23), 5364–5372. doi:10.1016/j.ijheatmasstransfer.2010.07.019
Liu, Y., Jiang, P., Xiong, Y., and Wang, Y. (2013). Experimental and numerical investigation of transpiration cooling for sintered porous flat plates. Appl. Therm. Eng. 50 (1), 997–1007. doi:10.1016/j.applthermaleng.2012.08.028
Liu, Y. Q., Xiong, Y. B., Jiang, P. X., Wang, Y. P., and Sun, J. G. (2013). Effects of local geometry and boundary condition variations on transpiration cooling. Int. J. HEAT MASS Transf. 62, 362–372. doi:10.1016/j.ijheatmasstransfer.2013.02.075
Liyan, M., Peixue, J., Fangshuai, J., Lei, Y. U., and Zepei, R. (2005). Experimental investigation of the heat transfer for transpiration cooling through a sintered porous plate. J. TSINGHUA Univ. Technol. 45 (11), 1537–1539.
Luo, S., Miao, Z., Liu, J., Song, J., XI, W., and Liu, C. (2021). Effects of coolants of double layer transpiration cooling system in the leading edge of a hypersonic vehicle. Front. Energy Res. 9. 530, doi:10.3389/fenrg.2021.756820
Ma, J., Luo, X., Li, H., and Liu, Y. (2016). An experimental investigation on transpiration cooling based on the multilaminated sintered woven wire mesh structures. J. Therm. Sci. Eng. Appl. 8 (3). doi:10.1115/1.4032921
Shi, J., and Wang, J. (2008). Optimized structure of two layered porous media with genetic algorithm for transpiration cooling. Int. J. Therm. Sci. 47 (12), 1595–1601. doi:10.1016/j.ijthermalsci.2008.01.010
Shi, J. X., and Wang, J. H. (2011). A numerical investigation of transpiration cooling with liquid coolant phase change. Transp. Porous Media 87 (3), 703–716. doi:10.1007/s11242-010-9710-9
Su, H., He, F., Wang, J., Luo, X., and Ai, B. (2021). Numerical investigation on the effects of porous cone parameters on liquid transpiration cooling performance. Int. J. Therm. Sci. 161, 106743. doi:10.1016/j.ijthermalsci.2020.106743
Su, H., Wang, J., He, F., Chen, L., and Ai, B. (2019). Numerical investigation on transpiration cooling with coolant phase change under hypersonic conditions. Int. J. Heat Mass Transf. 129, 480–490. doi:10.1016/j.ijheatmasstransfer.2018.09.123
Sun, M., Zhang, L., Hu, C., Zhao, J., Tang, D., and Song, Y. (2022). Forced convective heat transfer in optimized kelvin cells to enhance overall performance. Energy 242, 122995. doi:10.1016/j.energy.2021.122995
Vafai, K., and Tien, C. L. (1981). Boundary and inertia effects on flow and heat transfer in porous media. Int. J. Heat Mass Transf. 24 (2), 195–203. doi:10.1016/0017-9310(81)90027-2
van Foreest, A., Sippel, M., Gülhan, A., Esser, B., Ambrosius, B. A. C., and Sudmeijer, K. (2009). Transpiration cooling using liquid water. J. Thermophys. Heat Transf. 23 (4), 693–702. doi:10.2514/1.39070
Wang, J., Zhao, L., Wang, X., Ma, J., and Lin, J. (2014). An experimental investigation on transpiration cooling of wedge shaped nose cone with liquid coolant. Int. J. Heat Mass Transf. 75, 442–449. doi:10.1016/j.ijheatmasstransfer.2014.03.076
Wang, Z., Wang, H., Ding, N., Zhang, J., and Hu, B. (2021). Research on the development of hypersonic vehicle technology. Sci. Technol. Rev. 39 (11), 59–67.
Wolfersdorf, J. V. (2005). Effect of coolant side heat transfer on transpiration cooling. Heat. Mass Transf. 41 (4), 327–337. doi:10.1007/s00231-004-0549-x
Yakimov, A. S. (2015). Calculation of heat exchange characteristics transpiration cooling systems. Appl. Mech. Mater., 756, 365–371.doi:10.4028/www.scientific.net/AMM.756.365
Nomenclature
dp Particle diameter (m)
E Total energy (J/kg)
F Injection rate
H Height of main passage (mm)
h1 Thickness of plate A (mm)
h2 Thickness of plate B (mm)
K Turbulent kinetic energy
keff Effective heat conductivity (W/(m·K)
L Length of porous plate (mm)
p Pressure (Pa)
T Temperature (K)
Tiw Temperature of porous media wall surface without sweat cooling
Tcw Temperature of porous media wall surface after sweat cooling
u Velocity (m/s)
y + Dimensionless wall distance
Greek symbols
τ Viscous stress (m/s2)
μt Turbulence viscosity coefficient
ε Dissipation rate of turbulent energy
φ Porosity
λ Thermal conductivity (W/m·K)
ρ Density (kg/m3)
η The cooling efficiency
Subscripts
C Coolant
0 Mainstream gas
Keywords: sintered metal particle, double-layer, transpiration cooling, cooling efficiency, injection pressure
Citation: Zhang X, Yan G, Yu X, Li H, Zhang Y and Song Y (2022) Effects of particle diameter and plate thickness on transpiration cooling for double-layer porous plates. Front. Energy Res. 10:1050399. doi: 10.3389/fenrg.2022.1050399
Received: 21 September 2022; Accepted: 31 October 2022;
Published: 16 November 2022.
Edited by:
Jinlong Liu, Zhejiang University, ChinaReviewed by:
Qifan Wang, Zhejiang University, ChinaHuachao Yang, Zhejiang University, China
Ziming Yan, Clemson University, United States
Copyright © 2022 Zhang, Yan, Yu, Li, Zhang and Song. This is an open-access article distributed under the terms of the Creative Commons Attribution License (CC BY). The use, distribution or reproduction in other forums is permitted, provided the original author(s) and the copyright owner(s) are credited and that the original publication in this journal is cited, in accordance with accepted academic practice. No use, distribution or reproduction is permitted which does not comply with these terms.
*Correspondence: Yi Zhang, zhangyi80@dlut.edu.cn