Determination of the spent fuel decay heat with the VERA core simulator
 Marjan Kromar1*
  Andrew T. Godfrey2
- 1Reactor Physics Department, Jožef Stefan Institute, Ljubljana, Slovenia
- 2Oak Ridge National Laboratory, Nuclear Energy and Fuel Cycle Division, Oak Ridge, TN, United States
VERA core simulator capabilities to predict spent fuel decay heat have been explored. The comparison with the Serpent2 and NEWT/TRITON sequence from the SCALE package, performed on the NPP Krško fuel test cases, has enabled independent verification of the successful implementation of the VERA depletion/decay calculation sequence applied on the extended nuclide set. Since the VERA is a 3-D core simulator, the focus in the rest of the paper was on the investigation of the 3-D effects and non-linearity of the soluble boron concentration averaging process, which are difficult to assess with most of available computational tools. A difference in the decay heat prediction between the 3-D and 2-D model approaches was analyzed. In addition, the impact of the Inconel grids on the decay heat was determined. Averaging the concentration of soluble boron over the fuel irradiation period has been found to be a viable approach, since it results in slight decay heat overprediction, which is considered conservative for most applications. Finally, demonstration on the Watts Bar Unit 1 cycle 1 depletion has shown formidable VERA capabilities to accurately predict spent fuel decay heat.
1 Introduction
Decay heat is one of the most important parameters needed for safe and economical dry or wet spent nuclear fuel storage and disposal. Since a decay heat measurement of an assembly lasts at least one full day, it is impractical to measure the entire spent nuclear fuel inventory produced during the lifetime of one or more nuclear power plants. Calculations are thus required for full spent fuel characterization. The accuracy of the predictions plays an important role in the determination of suitable loading patterns. While adequate fuel cooling can be guaranteed with additional safety margins, overly conservative margins can lead to significant financial costs (Solans et al., 2020). It is therefore important to have as accurate as possible decay heat calculation tools using minimum number of simplifications that could contribute to the additional uncertainties. In the most widely used approach, the fuel is sliced into one or more independent domains, taking into account some average fuel properties (Kromar and Kurinčič, 2017). Such an approach inevitably leads to discretization uncertainties. In this paper more straight forward decay heat capabilities of the VERA core simulator (Turner et al., 2016; Kochunas et al., 2017) are investigated for the fuel cooling periods from 1 day to 100 years.
2 Brief code description
2.1 VERA
VERA (Virtual Environment for Reactor Applications) core simulator, developed as part of the CASL project (The Consortium for Advanced Simulation of Light Water Reactors, URL: http://www.casl.gov), is state-of-the-art core simulator capable to accurately predict the detailed power, temperature, and isotopic distribution in the nuclear reactor throughout the lifetime of the fuel. VERA provides direct, fully coupled solutions at the fuel rod level for neutronics and thermal-hydraulics without any spatial homogenization. Isotopic depletion and transmutations occur locally within the once-through 3-D calculation, avoiding the need for macroscopic spectral corrections to simplified history models. VERA consists of three main components: the neutronics solver MPACT (Collins et al., 2016), the thermal-hydraulic solver COBRA-TF (CTF) (Salko and Avramova, 2019), and the nuclide transmutation solver ORIGEN.
IMPACT uses a 2-D/1-D method to solve the neutron flux distribution throughout the core. This is achieved by using the 2-D method of characteristics (MOC) in the radial planes to capture the heterogeneity in the radial direction with high accuracy. Each pin cell is explicitly modeled, and even sub-pin details can be captured (three rings have been used in the presented analysis). In the axial direction, a low-order transport solution is obtained by NEM-P3 on a pin-cell homogenized basis. The axial and radial solutions are linked through the use of transverse leakage terms, which ensure neutron balance in each pin cell at convergence. MPACT uses a 51-energy group cross section library (Kim et al., 2017) based on ENDF/B VII.1 data (Chadwick et al., 2011) with subgroup parameters to capture self-shielding effects. COBRA-TF is a modernized, improved, quality-controlled version of the COBRA-TF subchannel thermal-hydraulic code. In VERA, CTF is directly coupled to MPACT and is executed in full for each neutronics-T/H iteration until convergence between the two codes is achieved. In this paper CTF is used only in the evaluation of the spacer grids and Watts Bar reactor core calculation. The Oak Ridge Isotope Generation (ORIGEN) depletion/decay code was developed at ORNL in 1973. Since then, several updates have been developed. As an integral part of the SCALE 6.* system (Wieselquist et al., 2020), ORIGEN has been subject to hundreds of test cases using measured data to validate calculation sequences and nuclide data.
In VERA, the depletion is done on the fuel pin level avoiding any spatial homogenization and using explicit approximations for the reactor support structures (e.g., grid spacers and nozzles). In the default sequence 244 nuclides are used in the depletion calculation (Kochunas et al., 2017). Recently, a possibility to take into account an extended set of almost 2,300 nuclides has been added into the calculation chain. Namely, ORIGEN decay data include all ground and metastable state nuclides with half-lives greater than 1 millisecond. Using these data sources ORIGEN can tracks 174 actinides, 1,149 fission products, and 974 activation products (Wieselquist et al., 2020). Additional nuclides are not very important for neutron transport calculations and can be easily neglected, but are essential for the decay heat determination. VERA version 4.2 was used in the present analysis.
2.2 Serpent
Serpent (Leppänen et al., 2015) is a three-dimensional continuous-energy Monte Carlo reactor physics burnup calculation code, developed at the VTT Technical Research Centre of Finland. It provides the ability to calculate many variables related to nuclide inventories at different burnup and cooling steps. The code is widely used in various fields related to neutron transport and fuel burnup because it is relatively fast and easy to use. In this analyses Serpent2, version 2.1.29 and the continuous energy cross section library in ACE format based on the ENDF/B-VII.1 evaluated nuclear data files (Chadwick et al., 2011) were used with 1,424 nuclides taken into account in the depletion/decay calculation. For each statepoint 30,000 neutrons in 900 active neutron cycles were tracked. The statistical uncertainty for the multiplication factor obtained in this way was less than 10 pcm. The fuel pellet was divided into 10 annular rings.
2.3 SCALE
The SCALE code system (Wieselquist et al., 2020) is a widely-used modelling and simulation suite for nuclear safety analysis and design that is developed, maintained, tested, and managed by the Nuclear Energy and Fuel Cycle Division (NEFCD) of Oak Ridge National Laboratory (ORNL). SCALE provides a comprehensive, verified and validated, user-friendly toolset for criticality safety, reactor and lattice physics, radiation shielding, spent fuel and radioactive source term characterization, and sensitivity and uncertainty analysis. The TRITON/NEWT module with the internal 56-energy group library v7-56 based on the ENDF/B-VII.1 evaluated nuclear data files was used in this paper. In the depletion calculation the same nuclide set of almost 2,300 nuclides has been applied as in the VERA case. Each fuel pin unit cell used 4 × 4 underlying grid.
3 Test cases and results
3.1 NPP Krško fuel
The Krško NPP is a 2-loop Westinghouse PWR plant with thermal rated power of 1994 MW t and 727 MWe gross electric power. The core consists of 121 UO2 fuel assemblies with some VANTAGE+ features, such as IFBA (Integral Fuel Burnable Absorber) rods and axial blankets. Each fuel assembly has 235 fuel rods with standard radius of 0.47498 cm (0.374 inch diameter) arranged in a 16 × 16 array. The remaining 21 positions contain guide tubes and are intended for control rods and in-core instrumentation.
3.1.1 Code comparison
A typical fuel assembly with 4.95% enrichment and no IFBA rods was selected for code comparison. A reference 2-D case scenario (infinite in axial direction) with periodic boundary conditions in lateral direction consists of the following reactor operational parameters:
1. Fuel temperature — 900 K, cladding temperature — 620 K,
2. Moderator temperature — 580.46 K with density—0.70871 g/cm3,
3. Soluble boron concentration of 1,000 ppm.
Parameters are close to the average operational parameters observed in the last NPP Krško cycles. The decay heat after a burnup of 60,000 MWD/MTU was examined. The burnup mesh (0, 0.15, 0.5, 1, 2, 3, 4, 5, 7.5, 10, 12.5, 15, 17.5, 20, 22.5, 25, 27.5, 30, 35, 40, 45, 50, 55, 60—all values in GWD/MTU) was the same in all codes. The results from VERA (2-D MOC MPACT solver) are compared with the results from the Serpent2 code and the TRITON/NEWT sequence from the SCALE package for cooling times from 1 day to 100 years (Figure 1). The results are very similar and are within the line width. Relative differences compared to the VERA results are shown in Figure 2. Serpent2 results differ noticeably at low cooling times (e.g., less than 1 year). Since SCALE results (using the same ORIGEN depletion code, nuclide set and depletion/decay data as VERA) are close to the VERA prediction in this time range, the reason is most likely due to a different set of short-lived nuclides. It should be mentioned that in all codes a nuclide set with a maximum number of isotopes was used. VERA and SCALE consider almost 2,300 nuclides in the depletion/decay calculation, while Serpent2 uses a set of 1,424 nuclides. Nevertheless, for dry storage and disposal, longer cooling times are representative. In this cooling period, the results of Serpent2 and SCALE show the same behaviour. Serpent2 is up to 2% higher, while SCALE is mostly within 1%. Relative small differences between VERA and SCALE on all time frames confirm adequate implementation of the extended ORIGEN nuclide set in the VERA code.
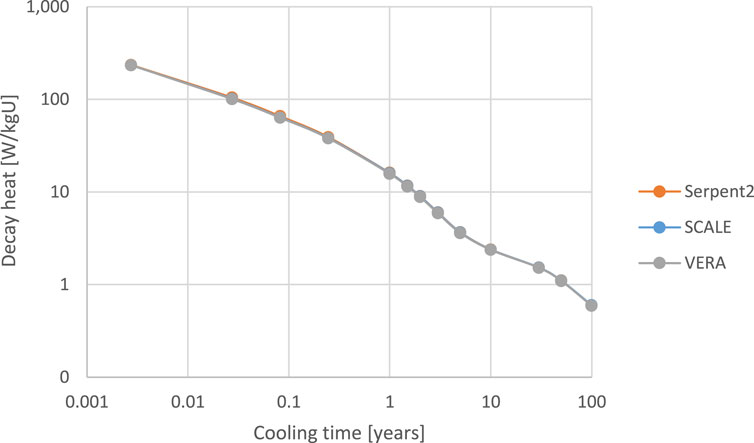
FIGURE 1. Decay heat as a function of cooling time.
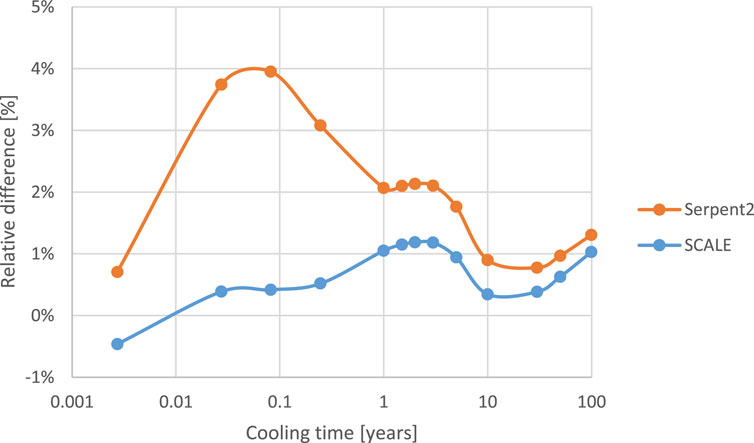
FIGURE 2. Relative decay heat differences compared to the VERA results.
To further validate the predictions of VERA, a case with 116 IFBA rods was studied. Boron in IFBA rods causes spectral changes that affect isotopic composition. The effect of IFBA rods can be assessed from Figure 3, where decay heat differences from the previous no IFBA case are plotted for each code. Apart from the already observed Serpent2 differences at short cooling times, all three codes provide very similar predictions. Given the added complexity of the case and the similarity of the codes’ predictions, the suitability of VERA for the determination of the decay heat can be confirmed.
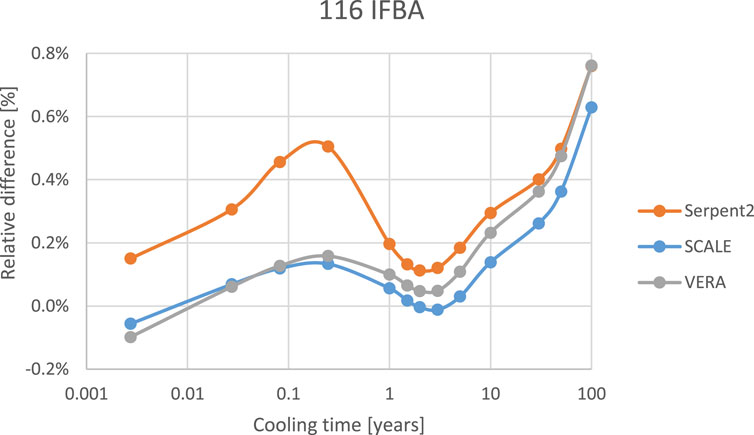
FIGURE 3. Impact of IFBA rods on decay heat.
3.1.2 3-D effects
Since the VERA is a core simulator, it offers the possibility to simply take into account the entire fuel assembly in a single calculation. To investigate this 3-D approach, the axially infinite 2-D fuel array from the previous case was modelled as finite in axial dimension, with fuel rod end plug, gap and nozzle encompassing the active fuel height of 365.76 cm (12 feet). To speed up the calculation, only the bottom half of the fuel assembly was considered with a symmetric boundary condition on the core midplane and a vacuum on the bottom. The relative difference of the decay heat compared to the previous 2-D calculation (axially infinite) is shown in Figure 4. The differences are within 1%. Since the temperatures and densities are kept constant during irradiation, the observed differences are due to the:
1. Burnup profile in the fuel assembly,
2. Power density profile,
3. Spectral changes at the end of the active fuel.
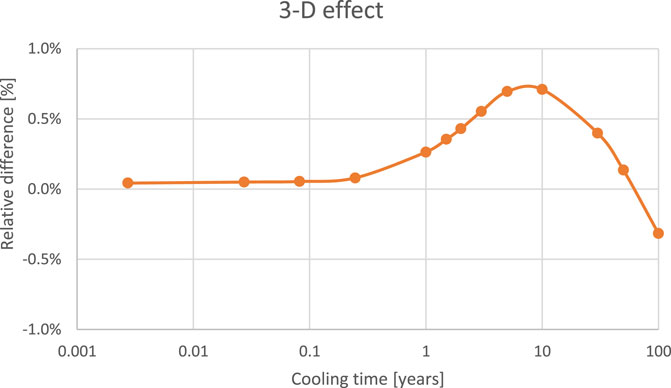
FIGURE 4. 3-D versus 2-D decay heat relative difference.
In (Kromar and Kurinčič, 2017) it was shown that the decay heat is not linearly dependent on burnup and specific power. Therefore, since we have significant burnup and power variations within the fuel assembly in the 3-D approach (Figure 5), the average decay heat is not equal to the decay heat at average burnup and specific power (2-D approach). In addition, the spectral end effects are difficult to estimate separately because material heterogeneities inevitably cause power and burnup gradients and consequently inherently contribute non-linear effects to the decay heat. The beauty of the simulator approach is that we do not have to worry about this. All these effects are automatically taken into account in the single 3-D calculation.
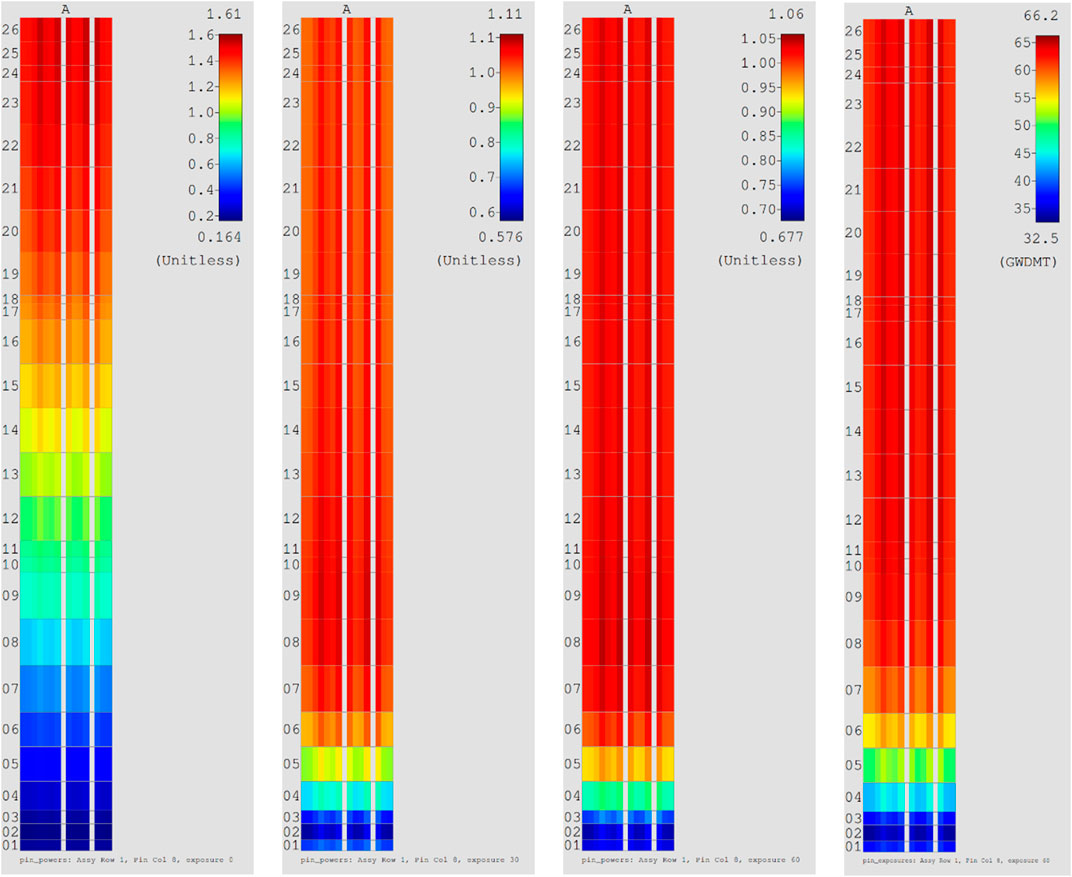
FIGURE 5. Axial relative power distribution at 0 MWD/MTU, 30,000 MWD/MTU and 60,000 MWD/MTU and burnup distribution at 60,000 MWD/MTU.
3.1.2 1 Spacer grids
The effect of the NPP Krško Inconel-718 spacer grids on the decay heat was studied in a 2-D approach, where grids material was smeared in the axial direction and is represented as an additional radial ring, and in an explicit 3-D representation with eight grids of 3.608 cm height. Temperatures and densities were fixed and are the same as in Section 3.1.1. The effect of the grids is shown in Figure 6, where relative decay heat differences between calculation with the grid and without the grids is presented for 2-D and 3-D cases (“result with grids”/“result without grids”—1). 2-D and 3-D approaches give very similar results, confirming the suitability of the smearing approximation. In, addition, it can be observed that the total grid impact is less than 1%. We have also investigated the possible impact of the local power feedback effect on the grid locations. For this purpose, a coupled thermal-hydraulics calculation with CTF code was initiated for the 3-D case introducing axial and radial fuel and moderator temperature gradients. The relative difference of the two runs (with and without grids) is denoted as 3D_CTF in Figure 6. The effect of the power feedback is negligible, since the 3D and 3D_CTF curves are almost overlapping.
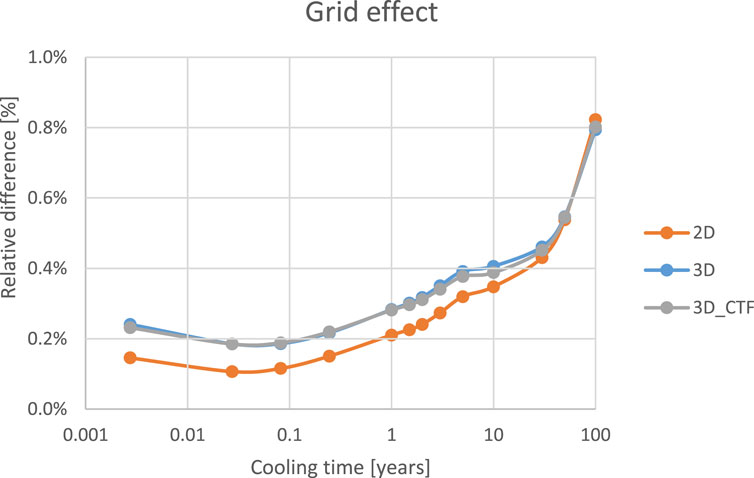
FIGURE 6. Effect of the grids on the decay heat.
3.1.3 Soluble boron variations
As mentioned earlier, decay heat calculations are usually performed under some average operating conditions. Therefore, it is prudent to evaluate the non-linear effects associated with such approach. VERA is a very suitable tool to study this, since it is very easy to change the conditions during fuel irradiation. A 2-D model from Section 3.1.1 was considered. For the purpose of soluble boron concentration variations, an input model was created, where the entire 60,000 MWD/MTU burnup interval was divided into three equal hypothetical fuel cycles with a burnup of 20,000 MWD/MTU. Each cycle was then subdivided into intervals of constant boron concentration, maintaining an average boron concentration of 1,000 ppm (Figure 7). Number 1 denotes constant boron approximation, number 2 introduces two constant boron intervals, number 5 represents five intervals, etc. Relative decay heat differences compared to the constant boron approach are shown in Figure 8. The differences for the shorter cooling times (less than 1 year) are inside 1% and for the longer cooling times less than 0.5%. It should be noted that the constant boron approach gives the highest decay heat, which is considered conservative for most applications.
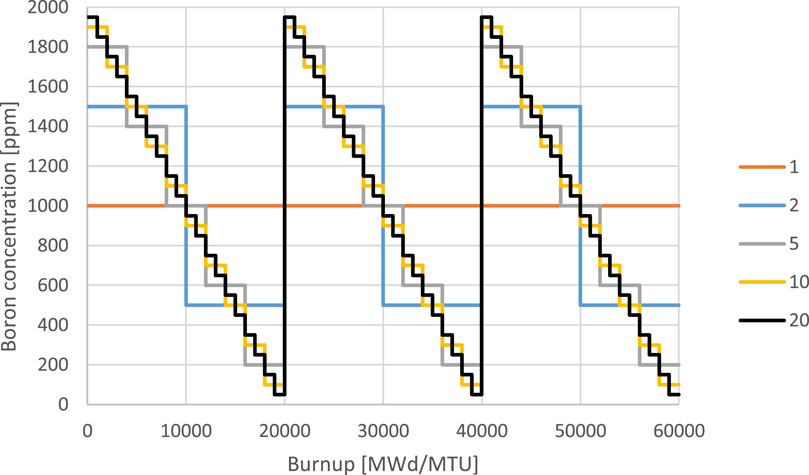
FIGURE 7. Soluble boron discretization.
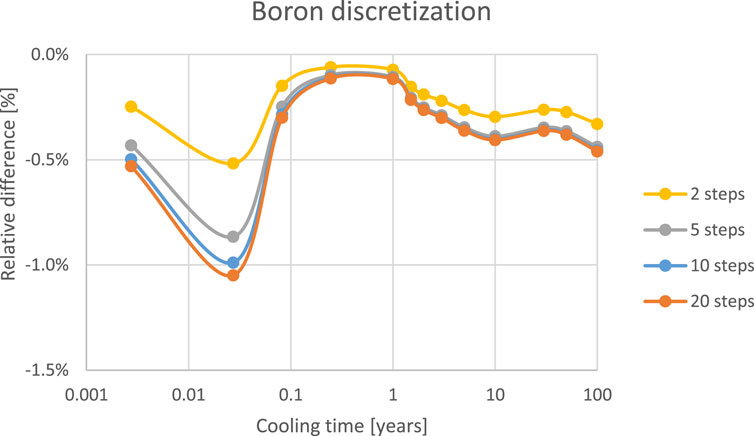
FIGURE 8. Effect of the soluble boron discretization on the decay heat.
3.2 Watts Bar Unit 1 cycle 1
The full advantage of VERA’s advanced computational approach is seen in the prediction of the decay heat with the entire 3-D reactor core calculation. Watts Bar Unit 1 (WBN1) cycle 1 depletion - problem 9 from the VERA progression problems (Godfrey, 2014) was selected to demonstrate the capabilities of VERA. WBN1 is a Westinghouse 4-loop Pressurized Water Reactor (PWR) that was completed in 1996. The reactor core consists of 193 17 × 17 fuel assemblies with an active fuel stack height of 365.76 cm, each with 264 fuel rods and 25 guide or instrumentation tubes. Cycle 1 reactor power history is shown in Figure 9. It should be noted that the reactor was operated at reduced power at the end of the cycle (stretch-out operation). Full cycle depletion has been performed with the extended nuclide set followed by a cooling period of up to 100 years. Figure 10, Figure 11, Figure 12 show the predictions of the pin-by-pin decay heat. The radial distribution is taken near the core midplane, while the axial distribution is represented with a plane crossing the middle of the row 9. For very short cooling times (e.g., days) the decay heat distribution is governed by the short-lived nuclides, which are proportional to the power distribution. Since the power distribution at the end of the cycle is shifted towards the top due to the power level around 65% of rated power, short-lived nuclides and the decay heat are also shifted to the top. After longer cooling times, longer-lived nuclides dictates the decay heat distribution. Longer-lived nuclides are more proportional to the burnup distribution, which is nearly symmetric. Therefore, the decay heat gradually shifts towards more axially symmetrical distribution. This test case provides an excellent demonstration of the VERA capabilities, where minimal calculation approximations are used in the decay heat determination process.
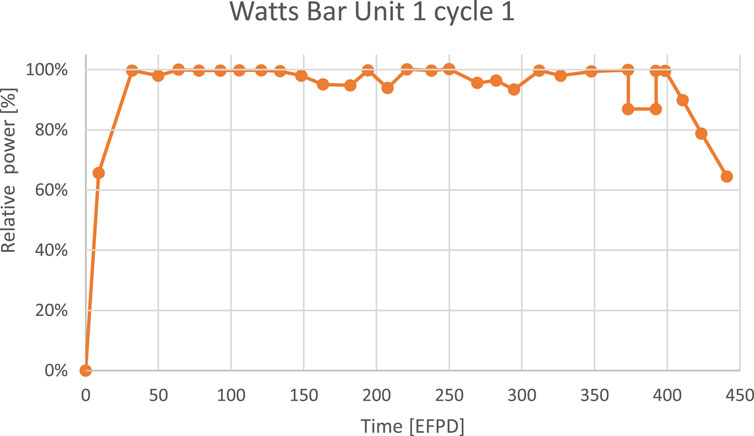
FIGURE 9. WBN1 cycle 1 reactor power history.
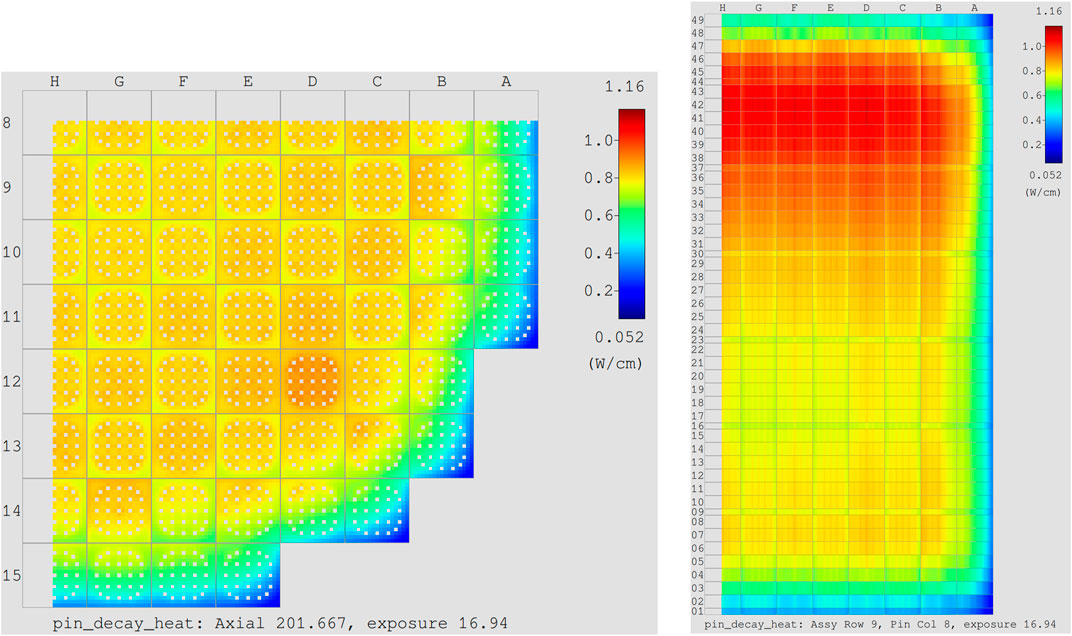
FIGURE 10. Radial and axial decay heat distribution after 1 day of cooling.

FIGURE 11. Radial and axial decay heat distribution after 1 year of cooling.
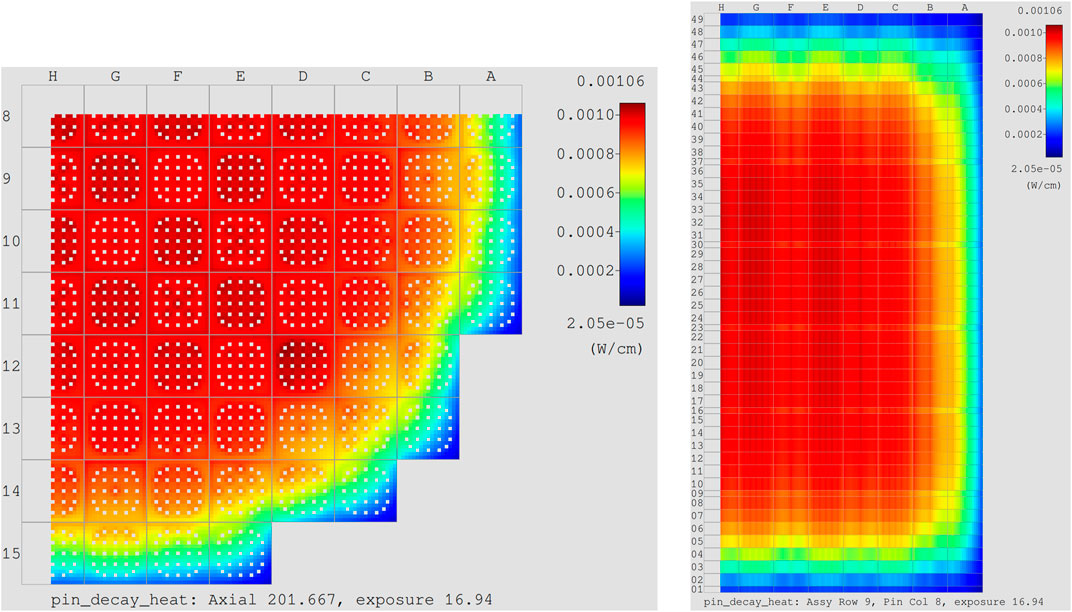
FIGURE 12. Radial and axial decay heat distribution after 100 years of cooling.
The calculation in quarter core symmetry took a little more than 43 h on 928 computer cores of the INL Sawtooth cluster. One 2-D case takes approximately 1 h on 1 computer core. If we assume that at least two 2-D runs are needed to adequately cover 1 fuel assembly, 56 times 2 h or 112 h on 1 core system are needed for the quarter core. Therefore, roughly speaking a 3-D full core calculation would require about 350 more computer time than standard 2-D approach. Nevertheless, such computer requirements are not out of reach.
4 Conclusion
Investigation of the VERA core simulator capabilities to predict spent fuel decay heat has been performed. The comparison with the Serpent2 and NEWT/TRITON sequence from the SCALE package, performed on the NPP Krško fuel test cases, has shown excellent agreement. For cooling times longer than 1 year Serpent2 results are up to 2% higher, while SCALE results are mostly within 1%. Since VERA is a 3-D core simulator, it allows the study of 3-D effects. Relative differences of the 3-D decay heat calculation compared to the 2-D approach on the assembly level are within 1%. Inconel grids increase the decay heat production, but the effect is inside 1% for cooling times of less than 100 years. Smearing of the Inconel grids over the entire fuel height has been shown to be a viable option for predicting decay heat. Using the average concentration of soluble boron during fuel depletion increases the decay heat. The effect of the finer boron let-down curve discretization is within 1%. The demonstration on the Watts Bar Unit 1 cycle 1 depletion has shown formidable VERA capabilities to predict decay heat. VERA allows determination of the spent fuel decay heat with far fewer model assumptions compared to traditional 2-D approaches. For example there is no need for any spatial homogenization. Isotopic composition is determined on the pin level obtained from the flux distribution fully coupled spatially over the reactor core and coupled also with the thermal-hydraulic solver, if needed. The reactor support structures (e.g., grid spacers, end plugs, nozzles, baffle etc.) are explicitly modeled. The increased computational cost associated with such high fidelity full core 3-D approach seems to be acceptable even for industrial applications.
Data availability statement
The underlying data supporting the conclusions of this article will be made available by the authors, without undue reservation.
Author contributions
AG supported the calculations and reviewed the manuscript. MK selected test cases, performed the calculations and prepared the manuscript.
Funding
MK acknowledges the financial support from the Slovenian Research Agency (research core funding No. P2-0073).
Acknowledgments
Presented research was made possible through collaboration with the VERA Users Group (https://vera.ornl.gov/). This research made use of the resources of the High-Performance Computing Center at Idaho National Laboratory, which is supported by the Office of Nuclear Energy of the U.S. Department of Energy and the Nuclear Science User Facilities under Contract No. DE-AC07-05ID14517.
Conflict of interest
The authors declare that the research was conducted in the absence of any commercial or financial relationships that could be construed as a potential conflict of interest.
The handling editor LF declared a past co-authorship with the author MK.
Publisher’s note
All claims expressed in this article are solely those of the authors and do not necessarily represent those of their affiliated organizations, or those of the publisher, the editors and the reviewers. Any product that may be evaluated in this article, or claim that may be made by its manufacturer, is not guaranteed or endorsed by the publisher.
References
Chadwick, M. B., Herman, M., Oblozinský, P., Dunn, M. E., Danon, Y., Kahler, A. C., et al. (2011). ENDF/B-VII.1: Nuclear data for science and technology: Cross sections, covariances, fission product yields and decay data. Nucl. Data Sheets 112, 2887–2996. doi:10.1016/j.nds.2011.11.002
Collins, B., Stimpson, S., Kelley, B. W., Young, M. T. H., Kochunas, B., Larsen, E. W., et al. (2016). Stability and accuracy of 3D neutron transport simulations using the 2D/1D method in MPACT. J. Comput. Phys. 326, 612–628. doi:10.1016/j.jcp.2016.08.022
Godfrey, T. A. (2014). “VERA core physics benchmark progression problem specifications,”. CASL-U-2012-0131-004, Rev. 4 (Oak Ridge, TN, USA: Oak Ridge National Laboratory). Available at: https://vera.ornl.gov/technical-reports/.
Kim, K. S., Williams, M. K., Wiarda, D., and Clarno, K. T. (2017). “Development of the CASL-VERA v4.2m5 MPACT 51-group libraries with ENDF/B-VII.0,” in Proceedings of the M&C International Conference on Mathematics & Computational Methods Applied to Nuclear Science and Engineering, Jeju, Korea, January 2017. Available at: https://www.kns.org/files/int_paper/paper/MC2017_2017_6/P249S06-01KimKS.pdf.
Kochunas, B., Collins, B., Stimpson, S., Salko, R., Jabaay, D., Graham, A., et al. (2017). VERA core simulator methodology for pressurized water reactor cycle depletion. Nucl. Sci. Eng. 185 (1), 217–231. doi:10.13182/NSE16-39
Kromar, M., and Kurinčič, B. (2017). Determination of the NPP Krško spent fuel decay heat. AIP Conf. Proc. 1866, 050005. doi:10.1063/1.4994529
Leppänen, J., Pusa, M., Viitanen, T., Valtavirta, V., and Kaltiaisenaho, T. (2015). The Serpent Monte Carlo code: Status, development and applications in 2013. Ann. Nucl. Energy 82, 142–150. doi:10.1016/j.anucene.2014.08.024
Salko, R. K., and Avramova, M. N. (2019). “CTF theory manual,”. CASL-U-2019-1886-001 (Pennsylvania, PA, USA: The Pennsylvania State University). Available at: https://vera.ornl.gov/wp-content/uploads/2020/07/CASL-U-2019-1886-001_CTF-Theory-Manual.pdf
Solans, V., Rochman, D., Ferroukhi, H., Vasiliev, A., and Pautz, A. (2020). Loading optimization for Swiss used nuclear fuel assemblies into final disposal canisters. Nucl. Eng. Des. 370, 110897. doi:10.1016/j.nucengdes.2020.110897
Turner, J., Clarno, K., Sieger, M., Bartlett, R., Collins, B., Pawlowski, R., et al. (2016). The virtual environment for reactor applications (VERA): Design and architecture. J. Comput. Phys. 326, 544–568. doi:10.1016/j.jcp.2016.09.003
Wieselquist, W. A., Lefebvre, R. A., and Jessee, M. A. (2020). “SCALE code system,”. ORNL/TM-2005/39, Version 6.2.4 (Oak Ridge, Tennessee: Oak Ridge National Laboratory). Available at: https://www.ornl.gov/file/scale-62-manual/display
Keywords: spent nuclear fuel, decay heat, core simulator, VERA, CASL
Citation: Kromar M and Godfrey AT (2022) Determination of the spent fuel decay heat with the VERA core simulator. Front. Energy Res. 10:1046506. doi: 10.3389/fenrg.2022.1046506
Received: 16 September 2022; Accepted: 05 December 2022;
Published: 19 December 2022.
Edited by:
Luca Fiorito, Belgian Nuclear Research Centre, BelgiumReviewed by:
Sebastien Lahaye, Commissariat à l'Energie Atomique et aux Energies Alternatives (CEA), FranceVanessa Vallet, Commissariat à l'Energie Atomique et aux Energies Alternatives (CEA), France
Simon Ravaux, Framatome, France
Copyright © 2022 Kromar and Godfrey. This is an open-access article distributed under the terms of the Creative Commons Attribution License (CC BY). The use, distribution or reproduction in other forums is permitted, provided the original author(s) and the copyright owner(s) are credited and that the original publication in this journal is cited, in accordance with accepted academic practice. No use, distribution or reproduction is permitted which does not comply with these terms.
*Correspondence: Marjan Kromar, marjan.kromar@ijs.si