Steady-state thermal hydraulic modelling and turbine trip transient simulation of the NuScale integral pressurised water reactor using the ASTEC code
 Zhexi Guo
 Sicong Xiao
 Keng Yeow Chung
- Singapore Nuclear Research and Safety Initiative, National University of Singapore, Singapore, Singapore
A steady state model of the NuScale reactor has been built using the thermal hydraulic module CESAR of the severe accident code ASTEC. Construction of the model was achieved through iterations based on convergence towards data provided by NuScale pertaining to important operating properties—core temperatures, coolant mass flow rate and secondary steam temperature—at 100% power (160 MW) and also at lower power levels. Good agreement with reference values was achieved to within 3% deviation. With a similar methodology, the previous model was adjusted to give a second steady state model meant to provide conservative initial conditions from which a turbine trip transient simulation would be performed. Sound agreement with literature was achieved, with maximum deviations of less than 1.8% for monitored parameters. Lastly, a turbine trip transient was simulated and compared to reference data from analyses performed with NRELAP5 and RELAP5/SCDAPSIM. The most important system behaviors and event timings are well captured and reproduced, with discrepancies arising from inevitable estimates made due to lack of information.
1 Introduction
Classification of small modular reactors (SMRs) often includes reactors with a power rating within 10–300 MWe, a range sufficient for practical applications and adequately low to reap the advantages of convenient production and implementation. The modular design means the nuclear steam supply system could be assembled from smaller components possibly of standardized designs manufactured in fixed locations before being transported to the desired site of construction. In contrast, the equivalent process for conventional large reactors is often performed on-site, leading to larger upfront costs and longer deployment periods.
One class of SMRs being developed comprises pressurized water reactors (PWRs), essentially scaled-down versions of conventional PWRs, that are able to utilize existing knowledge of such systems and phenomena concerning two-phase water flow. A particular design of such SMRs known as integral PWRs (iPWRs) has garnered much interest for the fact that the steam generators (SGs) fit into the reactor pressure vessel (RPV) and remove heat from the primary coolant without need for U-tubes external to the overall cylindrical RPV geometry like in traditional PWRs, thereby reducing the dimensions of the system and contribute to the compactness of the design. Another prominent characteristic is the use of natural circulation versus forced convection to drive primary coolant flow. Natural circulation is a well-recognized physical process with regards to reactor passive safety which has become part of the design philosophy of newer systems. A comprehensive summary of the major ongoing pressurized water SMR projects in the world is provided in various literature (IAEA, 2020; Ingersoll and Carelli, 2021).
The subject of study in this work is the NuScale iPWR that produces 160 MW of thermal power and 50 MW electrical power (thermal efficiency ∼31%). Reactor dimensions are small since all main components are housed in one RPV. Helical SG tubes are “integrated” into the RPV of the primary circuit, coiling around the riser and removing heat from primary coolant within the downcomer region. More information is presented in the cited certification application documents published by NuScale Power LLC. Due to the integral design, possibility of large-break loss-of-coolant accidents (LOCAs) is effectively eliminated, leaving small-break LOCAs to be adequately dealt with by passive safety systems. Core damage frequency is deemed to be lower than existing light water reactors (LWRs) (NuScale Power LLC 2020a).
Passive safety is a prominent feature highlighted by the manufacturer. In accordance with regulations by the Nuclear Regulatory Commission (NRC), the NuScale design has been demonstrated to be capable of performing safety-related functions without relying on AC power for 72 h after the initiating event, of which a station blackout (SBO) is a typical example scenario (NuScale Power LLC 2020d). Each NuScale power module is placed in a large water pool that serves as the ultimate heat sink (UHS) in design basis accidents (DBAs) where a complete loss of AC power occurs. Heat is extracted from the core by the SG secondary coolant as usual, flowing through the valve-actuated decay heat removal system (DHRS) via natural circulation, and finally exchanging heat with the UHS through condenser tubes. Existence of the large UHS water inventory is key to ensuring integrity of the core by continuous cooling through boil-off for more than 30 days without operator action, electric power or makeup water (NuScale Power LLC 2020e).
With a vast amount of information available on public domain, NuScale serves as a suitable subject of study and benchmark of different codes. Numerous studies have been performed, ranging from overall steady-state and transient characteristics using system codes (Yan et al., 2016; Skolik et al., 2021) to specific phenomena related to natural circulation, helical SG coils, boiling instabilities etc. with CFD methods (Che et al., 2020), and combinations of these (Hoffer et al., 2011; Kim et al., 2020).
CESAR has been used extensively for numerous PWRs such as the French PWRs (Foucher et al., 2014), German KONVOI (Gómez-García-Toraño et al., 2017), and for validation of specific CESAR models (Gómez-García-Toraño et al., 2018; Gómez-García-Toraño and Laborde, 2019), but full ASTEC models of iPWRs are scarce. One such model had been validated based on the IRIS reactor (Di Giuli 2014; Di Giuli et al., 2015) but only the two-phase five-equation rather than six-equation model had been applied. Compared to RELAP5 used by multiple other works (Ricotti et al., 2002; Freitag 2018; Johnson 2021; Skolik 2021), the application of the relatively new ASTEC code in the modelling of natural circulation in full systems, in particular thermal hydraulics (TH) of primary coolant, has not yet been examined extensively. The aim of this work is to conduct a code-to-code comparison with RELAP5 and NRELAP5 (a RELAP5-based code developed by NuScale) in order to have a preliminary assessment of the ASTEC model from a user’s point of view. This initial step lays the foundation for subsequent construction of the full ASTEC NuScale model.
This paper is structured as follows. Section 2 introduces the basic features of the ASTEC code and of the numerical model of CESAR most relevant to this work, and subsequently how these tools are used to build the steady-state and turbine trip transient models. Section 3 lays out the parameters to yield the optimized steady-state model and how it was validated. Finally, the main results of the turbine trip transient simulation are discussed in Section 4, ultimately showing that the ASTEC-CESAR model is indeed comparable to reference data obtained with other system codes.
2 Methodology
2.1 The ASTEC code and CESAR module
The most widely used system codes today are RELAP5 (RELAP5 Development Team 1995), TRACE (NRC, U.S., 2010), ATHLET (Burwell et al., 1989) and CATHARE (Bestion 1990), all of which were originally developed specifically for LWRs to simulate and predict accident phenomena therein. Concise descriptions and summaries of these codes are available in literature (Petruzzi et al., 2008; Bestion 1990; Bestion 2008; Bestion 2017). 1-D system codes have the advantage of being computationally fast in simulating large-scale processes up to the entire plant but naturally lose intricate 3-D effects that may be crucial. These issues are inherent in severe accident (SA) codes such as MELCOR and ASTEC (Accident Source Term Evaluation Code) as well, the latter of which is used in the present work.
SA codes are made up of several modules (or “packages” in MELCOR terminology), each responsible for simulating a particular phase or group of coupled physical processes within the long and complex sequence of events from normal operation to core-melt and subsequent release of radionuclides. Development of ASTEC was originally carried out by Institut de Radioprotection et de Sûreté Nucléaire (IRSN, France) and Gesellschaft für Anlagen und Reaktorsicherheit mbH (GRS, Germany). The latest version is V2.2 released in 2021, with a clear overview based on V2.1 available in public literature (Chatelard et al., 2016).
2.2 Basic equations in CESAR
The ASTEC-CESAR module is responsible for simulation of two-phase TH in PWR coolant systems, very much like the above system codes. Its TH model is governed by the well-known conservation equations of mass, momentum, and energy for two-phase flow. Spatial discretization is done with the finite volume method using a staggered grid approach, where scalar variables are defined at the center of each control volume while vector quantities are determined at volume interfaces or junctions, using the donor cell (or upwind) principle to calculate advective terms. Time discretization is carried out with the first-order backward difference scheme. This implicit time discretization strategy enhances the numerical stability and yields a system that is unconditionally stable for any time step ∆t. Solution of equations is performed with the Newton-Raphson method (Zambaux 2021). This work uses the six-equation approach for all cells in preparation for more complex transient simulations. The basic conservation equations for each phase k (liquid, gas) are described below.
The mass conservation equation reads
where αk, ρk,
The momentum conservation equation reads
where pk, g, fwall,k and Mk are respectively pressure, gravitational acceleration, wall forces and additional terms that include contributions from interfacial forces, pumps and virtual mass. The wall forces comprise the commonly known friction and form loss terms as follows:
where LJ, PJ, SJ, ζfric,k and Kform (hereafter simplified as K) are junction length, wetted perimeter, junction flow area, friction loss coefficient and form loss coefficient respectively. The K coefficients are often tuned to converge towards the desired operating conditions, a long iteration process that is necessary to capture the complex 3-D geometric effects in this 1-D averaged approach. This problem is aggravated by the lack of design details in this case.
The energy conservation equation reads
where hk, ϕwall,k and ϕint,k are enthalpy, wall heat transfer and interfacial heat transfer respectively.
Heat exchange is described by solid wall components comprising two half-walls, each for which the temperature at the center is calculated. The temperature gradient between the two temperature nodes leads to a diffusive flux through the surface common to both half-walls. The other surface of each half-wall has a flux contribution that could originate from an external source φext such as fuel, which implies a defined boundary condition, or fluid φwall-fluid such as the SG primary and secondary sides. The energy balance equation is then
where V, ρ, cp, A and λ are respectively the volume, density, specific heat capacity, surface area and thermal conductivity. The temperature gradient is assumed linear from the external surface of half-wall i to that of half-wall j as follows
and x has been used in the equation to emphasize that it is perpendicular to flow in the z-axis. The wall-fluid flux is derived from complex models correlating heat transfer coefficients with void fraction, phase thermal conductivities, and flow properties characterized by the Reynolds, Grashof, Nusselt and Prandtl numbers. Based on these properties, a heat transfer coefficient is calculated corresponding to one of the four flow types: laminar natural convection, turbulent natural convection, laminar forced convection, and turbulent forced convection. Specific equations are not provided but the reader may refer to a largely representative description provided in the CATHARE models (Bestion 1990).
2.3 NuScale reactor model nodalization
Preservation of coolant fluid dimensions was of priority when nodalizing the system, carried out based on the individual component heights, flow areas and fluid volumes, adhering as closely as possible to reference values (NuScale Power LLC 2020b; Guo et al., 2022). It is important to ensure that component heights are consistent since they significantly influence pressure differences due to gravity and resultant natural circulation. In heated sections such as the core and SG region, fluid volume is crucial as well, since it directly impacts the temperature changes corresponding to total enthalpy transferred.
Figure 1 from NuScale documentation (NuScale Power LLC 2020a) is a schematic of the RPV and flow of coolant under normal operating conditions included in Table 1, while Figure 2 illustrates the CESAR nodalization where the primary circuit follows the flow in Figure 1 and the secondary circuit with the reactor pool for DHRS operation. Natural circulation in the primary loop is initiated by fuel rods generating 160 MW at 100% nominal power along the 2.0-m-tall active core region, represented by red wall components and red single-headed arrows in the figure.
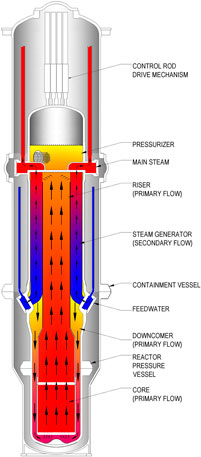
FIGURE 1. Schematic of one NuScale power module (NuScale Power LLC 2020a).
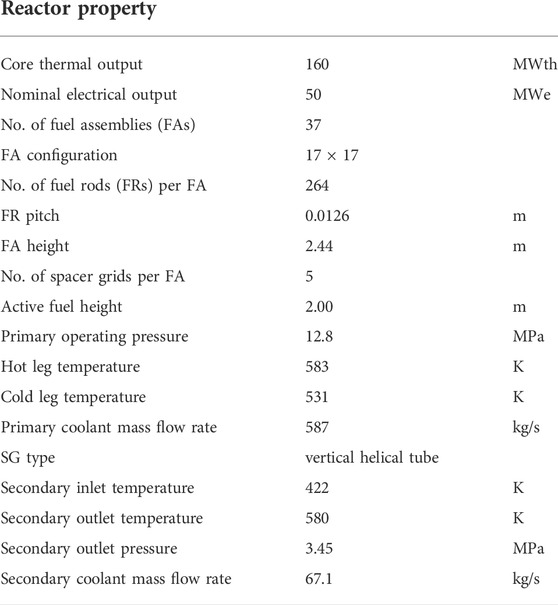
TABLE 1. Main properties of the NuScale reactor at full nominal power (NuScale Power LLC 2020b).
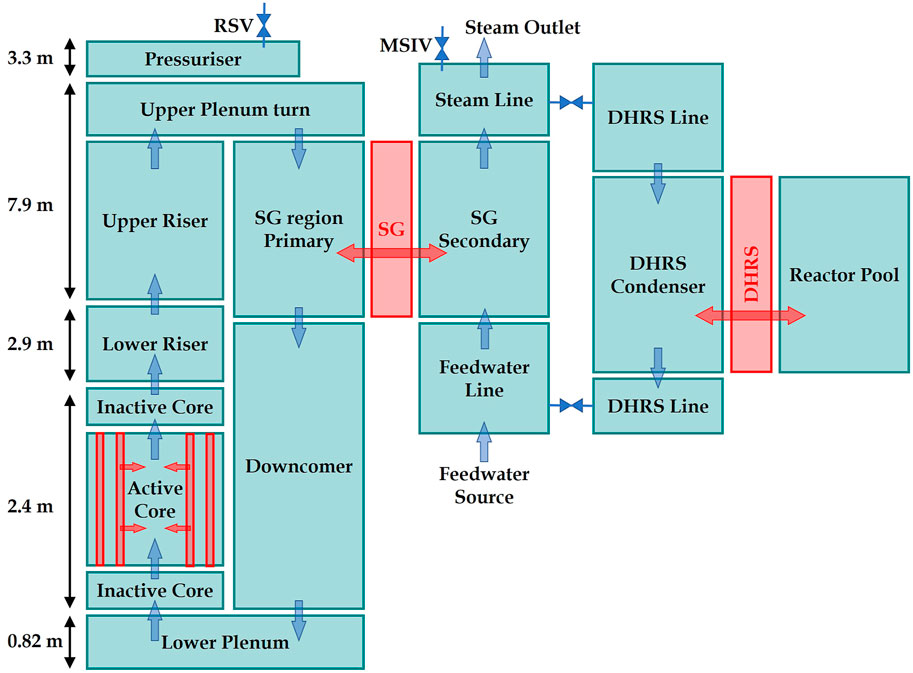
FIGURE 2. CESAR nodalization diagram of the NuScale system. Blue arrows show the expected coolant flow path under normal conditions; red arrows represent heat transfer from the fuel in the active core and heat exchange through the SG and DHRS condenser tubes. Opening the DHRS actuation valves forms a flow circuit cooled by the reactor pool via natural circulation.
The blue arrows (junctions) show heated coolant rising through the respective volumes to the upper plenum before turning downwards through the SG region and downcomer, and finally re-entering the core after turning through the lower plenum. In normal operation, the primary loop is cooled via heat exchange (red double-headed arrows) through the SG wall with the secondary loop, which comprises a pumped feedwater source whose flow rate is a boundary condition to the problem, and superheated steam enters the turbine through the main steam isolation valve (MSIV) where the outlet pressure is another boundary condition. Two actuation valves connect the secondary line to the DHRS, in order to simulate accident scenarios where the system is available to provide passive cooling.
Primary pressure is maintained by the pressurizer, which is modelled by CESAR as a fluid volume of water and steam at saturation with a spray system to remove enthalpy and raise the water level when pressure and void fraction exceed an upper limit, and a heater system to provide enthalpy and lower the water level when pressure and void fraction drop below a lower limit. Reactor safety valves (RSVs) serve as an overpressure protection, like in the NuScale design. For each valve the user defines the maximum flow area, activation pressure and pressure range over which the valve is gradually opened. No flow arrow is included in Figure 2 between the Pressurizer and Upper Plenum Turn volumes because heat exchange is intentionally limited—just as in the actual design where a baffle plate with holes separates the two regions—while allowing pressure changes to be communicated quickly from the pressurizer to the entire system. In CESAR, two form loss coefficients are defined for each junction in both forward and reverse directions. Defining a large value for this junction achieves the intended pressurizer function described above.
2.4 Turbine trip transient model setup
As an initial test among the multiple possible design basis events (DBEs), a turbine trip transient was simulated to assess the accuracy and performance of the model. This transient was chosen for several reasons. Firstly, its simplicity compared to other transients would allow better identification of problems in the model. Secondly, it involves operation of the crucial DHRS that is supposed to maintain integrity of the plant for a long duration without human action, making the test highly relevant to subsequent transient analyses. Thirdly, a number of studies using system codes had already been performed, including reference results published by NuScale (Skolik et al., 2018a; Skolik et al., 2018b; NuScale Power LLC 2020f), which can be used for comparison as well.
The turbine trip transient falls under the “decrease in heat removal by the secondary system” group of DBEs and for it NuScale had performed transient analysis based on a set of conservative initial conditions. The first step was to modify the steady-state CESAR model to converge towards these conservative conditions. This means some of the form loss coefficients and feedwater pump flow rate obtained in the 160 MW steady state described in Section 3 had to be adjusted to cope with the increased input power of 163.2 MW (2% higher). The process is largely similar to that for the original steady state other than the exclusion of the lower power cases, reducing the number of parameters to be considered during iteration.
3 Steady state simulation
Several existing works using RELAP5 (Skolik et al., 2018a; Hosseini et al., 2021) have achieved good agreement with reference values at 100% power. However, data for lower powers at 75%, 50% and 15% are also available in the safety analysis report (NuScale Power LLC 2020c). To have an improved confidence of the constructed CESAR steady-state model, this work applies the optimization process to all four power levels. The procedure taken was to adjust the form loss coefficients K of each component. The final set of parameters was selected through an iterative approach, based on two criteria: 1) it has the lowest sum of root-mean-square deviations of major reactor operating quantities from reference values, i.e., core inlet temperature, primary SG region inlet (hot leg) temperature, core inlet-outlet temperature difference (ΔT), primary coolant mass flow rate (MFR), and secondary steam outlet temperature; 2) each deviation should not exceed 3%.
Summarized in Table 2 are the values obtained at the end of the optimization process to achieve the final reactor operating conditions in Table 3. Larger deviations at 160 and 24 MW exemplify the difficulty of achieving convergence at all powers. In addition, a similar difficulty is shown by the decreasing MFR and increasing ΔT deviations in with reduction in power. This can be expected given the balance between the volumetric heat generation rate
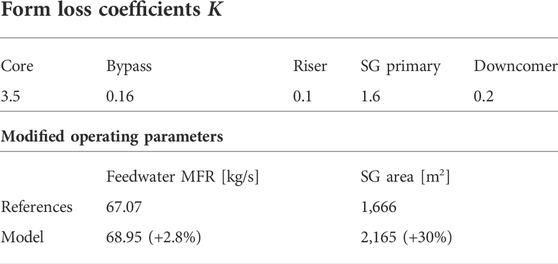
TABLE 2. Form loss coefficients, secondary feedwater MFR and SG heat exchange area used in the optimized steady state model.
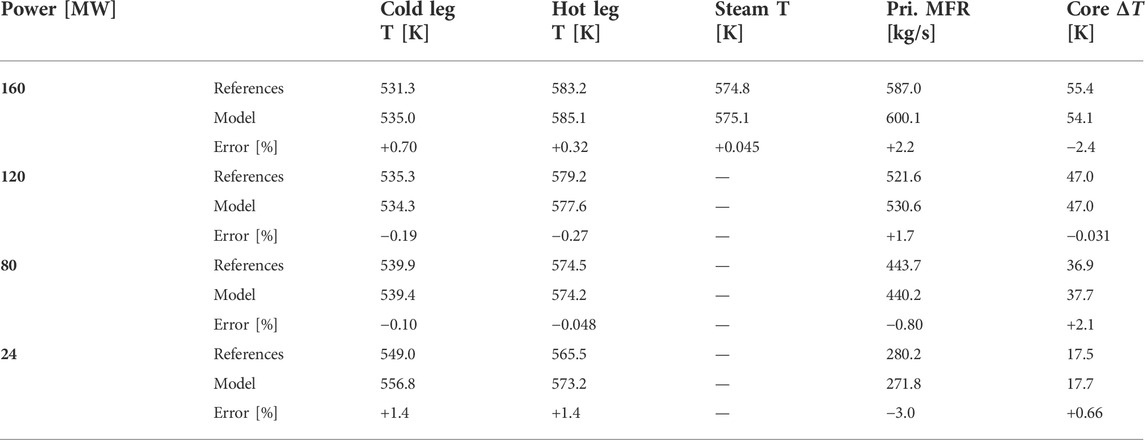
TABLE 3. Deviation of core inlet (cold leg), primary SG region inlet (hot leg) and secondary steam temperatures, primary coolant mass flow rate, and core inlet-outlet temperature difference from reference values at four power levels. Calculations are done in SI units, i.e., K for temperatures and kg/s for MFR.
The SG heat exchange area had to be drastically modified from the stated physical value. Other works using RELAP5 (Hoffer et al., 2011; Skolik et al., 2021) had also found this increase of 30% to be necessary for overall reactor quantities to fit correct values. Severe deviation in this heat exchange region is attributed to the need to compensate for 1-D simplification by system codes of the complex geometry, flow, and heat exchange in the once-through helical-coil SG region.
Adjustment of the secondary feedwater pump MFR had to be made but was kept minimal. One reason is that uncertainties of the pump MFR are expected to be small since it is a relatively standard component, and its operation should not evolve drastically under normal conditions. Furthermore, changing the pump MFR leads to large deviations especially at lower powers.
Minimization of errors in regions like the core and SG require higher-resolution CFD modelling to better reflect local flow and consequent energy exchange phenomena, instead of arbitrary adjustment of the above system parameters to fit the desired results. It is important to note that changing the value of one parameter shifts the optimal values of others. In fact, applying all ideal values does not produce overall results that lie within 3% deviation. Covering a large span of operating powers is hence critical for examining natural circulation systems and for future work on accident scenarios that usually involve inadvertent or intentional power losses.
4 Turbine trip transient simulation
4.1 Conservative initial steady state conditions
The final converged values for the steady state are recorded in Table 4. Core power, feedwater temperature, reactor pool temperature and RSV setpoint are boundary conditions defined by the user in the code and hence should not differ from the reference values. From the table, the adjusted model has generated sufficiently accurate conditions, showing only small deviations in the average primary coolant temperature, pressurizer pressure and primary coolant MFR.
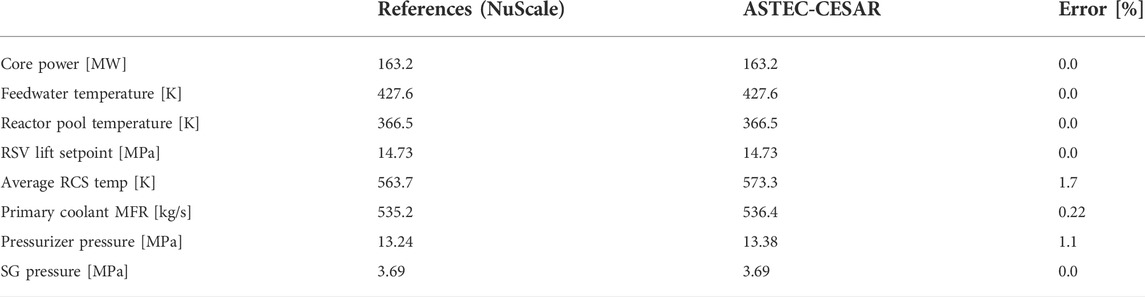
TABLE 4. Steady-state initial conditions for turbine trip transient generated by the CESAR model in comparison to reference NuScale values.
Corresponding to Table 4, the parameters used to attain the desired initial transient model are listed in Table 5. Because of the considerably lower primary MFR of 535.2 kg/s required (8.8% decrease from 587.0 kg/s for steady state at 160 MW), the form loss coefficients had to be raised significantly to provide adequate pressure drops along the loop. All K values for primary-side components were increased significantly by 68% from steady-state values. This general scaling was done, instead of tuning each K as before, to preserve the overall proportionality since the MFR cannot be expected to be lower at a higher core power of 163.2 MW under natural circulation given the same geometries unchanged from normal steady state. The feedwater MFR was raised by 5.9%–71.01 kg/s, but this includes the increase that would have been expected by design to account for the 2% higher input power, which would otherwise be 68.41 kg/s and lower the deviation to 3.8%. On the other hand, the SG heat exchange area was kept the same as earlier.
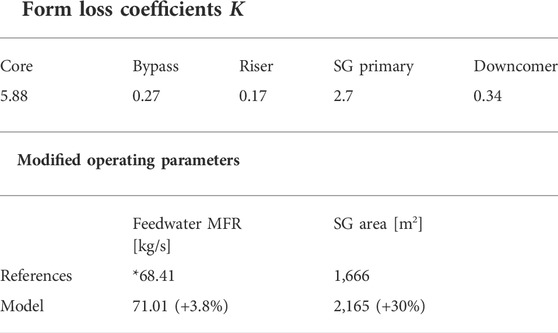
TABLE 5. Form loss coefficients, secondary feedwater MFR and SG heat exchange area used in the conservative steady state from which the transient will be simulated. *The reference feedwater MFR here is not provided by NuScale but increased by 2% from the steady-state value of 67.07 kg/s, scaled linearly with the higher input power.
4.2 Simulation results
From the conservative steady-state conditions obtained earlier, simulation of the turbine trip transient was initiated by closing the MSIV at t = 0. The immediate effect is an increase in secondary pressure since the steam outlet is closed, reducing its heat removal ability, and leading to increased primary pressure. The reactor trip signal is triggered when primary pressure exceeds 13.79 MPa, with a 2-s delay before the trip is physically activated, followed by a sharp drop in core thermal power described by Figure 3, start of feedwater pump coast-down, and start of the 30-s wait before the DHRS actuation valves are opened as shown by the sudden rise in DHRS flow rate in Figure 4. The time taken for the feedwater pump to be completely shut off was set to 14.0 s.
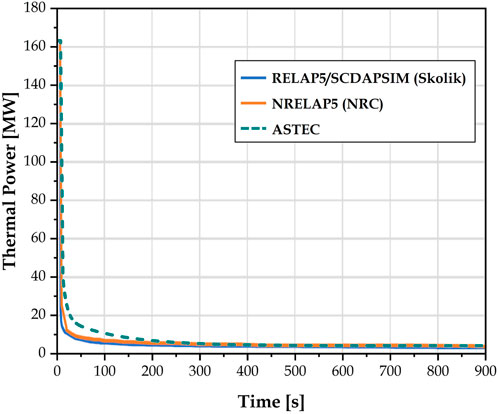
FIGURE 3. Turbine trip transient: Evolution of core thermal power after transient initiation. After reactor trip has been triggered, a 2.0-s delay is implemented before the actual sharp power reduction begins. Compared to the other two references, the thermal power in the first 200 s in this work is set higher, before reaching the same decay heat level.
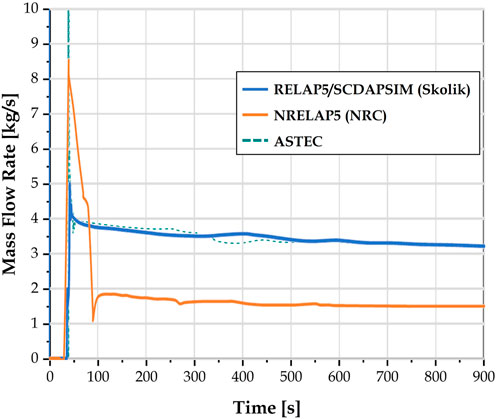
FIGURE 4. Turbine trip transient: DHRS total mass flow rate of both liquid and vapor phases. This figure zooms in on values below 10 kg/s for direct comparison with references. Refer to text for detailed discussion on the peak excluded from this figure.
Table 6 shows the sequence of events reflecting the set delays mentioned and the events dependent on evolution of physical phenomena such as the time taken to reach the reactor trip high-primary-pressure trigger and maximum primary pressure attained during the transient. Comparison of the timings with references in Table 7 shows no large differences. In fact, the ASTEC model appears to reproduce the NRELAP5 data more closely with regards to the time taken for the high primary pressure that triggers the reactor trip signal to be reached, and also the timing at which the maximum primary pressure is reached is closer to the NRELAP5 time of 10.0 s at 13.8 s compared to 15.0 s in the RELAP5 model.
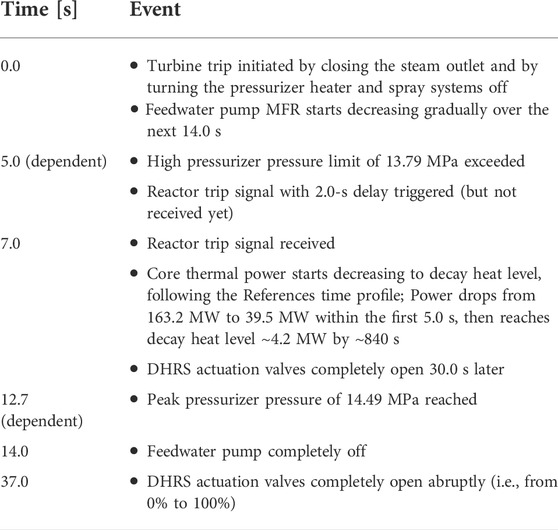
TABLE 6. Sequence of events in the turbine trip transient simulated. The initiating event occurs at time t = 0.0 s, causing a rise in primary pressure sufficient to trigger the reactor trip. Events labelled ‘dependent’ are physical processes whose timing depend on the system evolution, whereas the other events have user-defined durations or delays relative to earlier events.
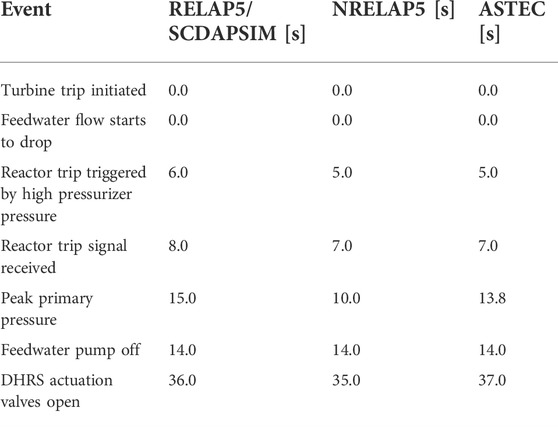
TABLE 7. Timing of events in the turbine trip transient simulated by RELAP5/SCDAPSIM (Skolik et al., 2018b), NRELAP5 (NuScale Power LLC 2020f) and ASTEC.
To enable direct comparison with the other two reference curves, the vertical axis has been limited to 10 kg/s, cutting off part of the peak. The maximum MFR reached is about 45.8 kg/s, in stark contrast to 5 kg/s and 8.5 kg/s in the RELAP5/SCDAPSIM and NRELAP5 studies respectively. However, if one considers that the peak width measured at 4 MW is about 50 s in the NRELAP5 analysis and less than 6 s in this CESAR model, mass flowing through in both peaks is very similar. This discrepancy could arise from the need to estimate information such as the secondary component flow areas and DHRS actuation valve orifice dimensions since they directly impact the consequent maximum and stable DHRS MFR calculated.
Figures 5–8 display the evolution of main quantities during the transient. Progression of the quantities calculated using RELAP5/SCDAPSIM (Skolik et al., 2018b; Skolik 2021), NRELAP5 (NuScale Power LLC 2020f) and ASTEC in this work generally agree. Primary pressure (Figure 5) shows a steeper negative gradient than reference, with the initially higher pressure dropping below reference values after about 350 s, whereas secondary pressure (Figure 6) is consistently higher than reference. Investigation of different parameters (e.g., power-time profile, duration over which the feedwater pump coasts down, starting time of feedwater pump coast-down, DHRS actuation valve size) yield no simple way to reconcile both pressures since events that tend to raise primary pressure would have a similar effect on secondary pressure as well. The ideal method would involve the exact component designs, especially the heat exchange components like the SG that couples the two separate coolant circuits and also the DHRS condenser that couples the secondary side to the ultimate heat sink.
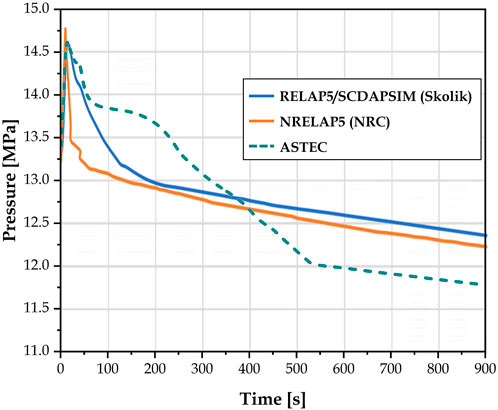
FIGURE 5. Turbine trip transient: Primary pressure.
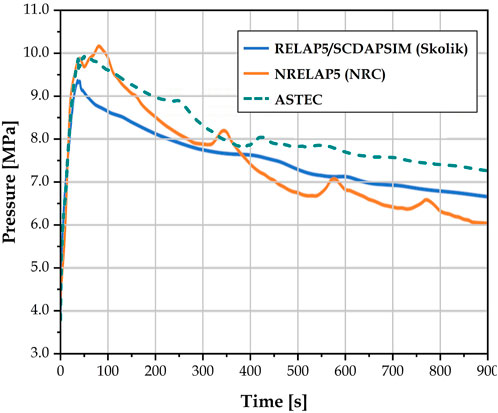
FIGURE 6. Turbine trip transient: Secondary pressure.
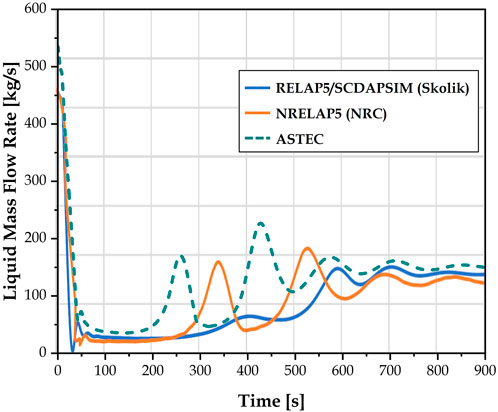
FIGURE 7. Turbine trip transient: Primary coolant mass flow rate. CESAR result generally follows that of NRELAP5 but appears shifted earlier by approximately 80 s.
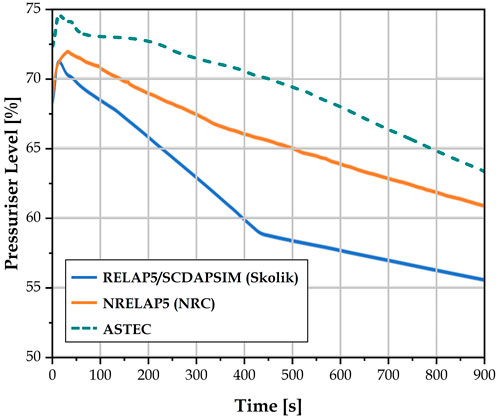
FIGURE 8. Turbine trip transient: Pressurizer water level.
The primary coolant mass flow rate calculated with ASTEC exhibits the same behavior as that with NRELAP5, most prominent of which are the two large peaks followed by low-frequency oscillations at a stable level, as plotted in Figure 7. This was not well captured by the RELAP5/SCDAPSIM simulation. On the other hand, both peaks in this work occur about 80 s earlier than the NRELAP5 ones. The initial sharp drop also does not reach close to zero as was exhibited by the reference analyses. This is related to the slightly slower drop in power implemented in this study, as previously described with Figure 3. Even though using a more drastic power reduction would reproduce the initial MFR drop better, the peaks would correspondingly be shifted to the left and the stable MFR attained earlier as well. The final flow rate calculated in all three studies show great agreement around 150 kg/s.
Lastly, the pressurizer level undergoes largely the same absolute changes as reference, with the difference being the fact that the initial level was slightly higher, as shown in Figure 8. As compared to the RELAP5/SCDAPSIM result, discrepancies are within 5% of the NRELAP5 results. It should be noted that the pressurizer level is heavily dependent upon the control volume setup from the beginning since the exact position of the heaters and spray MFR need to be estimated from limited information as well. As such, it is possible for the pressurizer level to exhibit large differences without affecting its modelling function of maintaining primary system pressure. The only time it can pose problems is when trying to replicate the real system where the spray has a minimum MFR even when pressure is on the low end of the acceptable range. This means that if the simulation is run long enough, the pressurizer becomes completely filled and eventually the system pressure reaches critical temperature and pressure. To circumvent this, the minimum spray MFR is set to zero and pressure limits modified to prevent unrealistic over-filling of the pressurizer.
5 Conclusion
A steady state model of the NuScale iPWR has been set up with the TH module of the ASTEC code. An improvement to existing works has been made with regards to its accuracy from low (15%) to full nominal power, results of which served as a guide for iteration towards a best-fitting model and could be used in modelling of similar reactor designs. Good agreement of reactor operating conditions at all power levels with reference data to within 3% deviation was deemed sufficient to verify the accuracy of the model. With largely the same methodology, a second steady state model was constructed by modifying the previous one to generate conservative initial conditions from which a turbine trip transient simulation would be performed. Deviations from reference data were small, with those of primary coolant average temperature and mass flow rate reaching 1.7% and 0.22% respectively, while pressurizer pressure differed by only 1.1%.
The second steady state model enables subsequently a range of transient scenarios to be studied. This steady state was then used for simulation of a turbine trip transient, and results showed good agreement with NuScale NRELAP5 analyses pertaining mainly to evolution of system pressures and mass flow rates. Further work remains to be done as inherent uncertainties of such system models in complex regions like the core and SG rely on CFD modelling to be minimized, and simulation of other DBEs to validate the applicability of this model.
Data availability statement
The original contributions presented in the study are included in the article/Supplementary Material, further inquiries can be directed to the corresponding author.
Author contributions
ZG: Modelling, analysis, writing, editing; SX: Concept, research, editing, supervision; KC: Project funding, overall supervision.
Funding
This work was supported by the National Research Foundation Singapore (A-0001360-06-00).
Acknowledgments
The authors would like to acknowledge the Institut de Radioprotection et de Sûreté Nucléaire (IRSN, France) as developers of the ASTEC code and for making technical support available when needed.
Conflict of interest
The authors declare that the research was conducted in the absence of any commercial or financial relationships that could be construed as a potential conflict of interest.
Publisher’s note
All claims expressed in this article are solely those of the authors and do not necessarily represent those of their affiliated organizations, or those of the publisher, the editors and the reviewers. Any product that may be evaluated in this article, or claim that may be made by its manufacturer, is not guaranteed or endorsed by the publisher.
References
Bestion, D. (1990). The physical closure laws in the CATHARE code. Nucl. Eng. Des. 124 (3), 229–245. doi:10.1016/0029-5493(90)90294-8
Bestion, D. (2008). “System code models and capabilities,” in THICKET 2008. (Pisa, Italy: OECD/NEA).
Bestion, D. (2017). System thermal hydraulics for design basis accident analysis and simulation: Status of tools and methods and direction for future R&D. Nucl. Eng. Des. 312, 12–29. doi:10.1016/j.nucengdes.2016.11.010
Burwell, M. J., Lerchl, G., Miro, J., Teschendorff, V., and Wolfert, K. (1989). “The thermalhydraulic code ATHLET for analysis of PWR and BWR systems,” in 4th international topical meeting on nuclear reactor thermal-hydraulics (NURETH-4). Editors: U. Mueller, K. Rehme, and K. Rust. Karlsruhe, Germany.
Chatelard, P., Belon, S., Bosland, L., Carénini, L., Coindreau, O., Cousin, F., et al. (2016). Main modelling features of the ASTEC V2.1 major version. Ann. Nucl. Energy 93, 83–93. doi:10.1016/j.anucene.2015.12.026
Che, S., Breitenmoser, D., Infimovskiy, Y. Y., Manera, A., and Petrov, V. (2020). CFD simulation of two-phase flows in helical coils. Front. Energy Res. 8 (65), 1–15. doi:10.3389/fenrg.2020.00065
Di Giuli, M. (2015). PhD dissertation: Severe accident simulation in small modular reactor. Bologna, Italy: Università di Bologna.
Di Giuli, M., Sumini, M., and Bandini, G. (2014). “Pressurized water small modular reactor (SMR), design basis accident analysis using the ASTEC code,” in 23rd international conference nuclear energy for new Europe. (Portorož, Slovenia: Nuclear Society of Slovenia).
Foucher, L., Cousin, F., Fleurot, J., and Brethes, S. (2014). Assessment on 900-1300 MWe PWRs of the ASTEC-based simulation tool of SGTR thermal-hydraulics for the IRSN emergency technical centre. Nucl. Eng. Des. 272, 287–298. doi:10.1016/j.nucengdes.2013.07.041
Freitag, P. (2018). Master thesis: Transient thermal-hydraulic simulation of a small modular 365 reactor in RELAP 5. Kingston, RI: University of Rhode Island.
Gómez-García-Toraño, I., Sánchez-Espinoza, V. H., Stieglitz, R., and Queral, C. (2017). Analysis of primary bleed and feed strategies for selected SBLOCA sequences in a German Konvoi PWR using ASTEC V2.0. Ann. Nucl. Energy 110, 818–832. doi:10.1016/j.anucene.2017.08.003
Gómez-García-Toraño, Ignacio, and Laborde, L. (2019). Validation of selected cesar friction models of the ASTECV21 code based on moby dick experiments. J. Nucl. Eng. Radiat. Sci. 5 (2). doi:10.1115/1.4042119
Gómez-García-Toraño, Ignacio, Laborde, L., and Zambaux, J. A. (2018). Overview of the CESAR thermalhydraulic module of ASTEC V2.1 and selected validation studies. Proceedings of the 18th Int. Youth Nucl. Congr. Bariloche, Argentina, March 2018, 2, 2–5.
Guo, Z., Xiao, S., and Chung, K. Y. (2022). “Preliminary steady-state thermal hydraulic modelling of the NuScale integral pressurised water reactor using the CESAR module of ASTEC,” in Advances in thermal hydraulics (ATH 2022). (Anaheim, CA, USA: American Nuclear Society).
Hoffer, N. V., Sabharwall, P., and Anderson, N. A. (2011). Modeling a helical-coil steam generator in RELAP5-3D for the next generation nuclear plant.
Hosseini, S. A., Akbari, R., Shirani, A. S., and D’Auria, F. (2021). Analysis of the natural circulation flow map uncertainties in an integral small modular reactor. Nucl. Eng. Des. 378, 111156. doi:10.1016/j.nucengdes.2021.111156
Ingersoll, D., and Carelli, M. (2021). Handbook of Small Modular Nuclear Reactors. Second Edition. Elsevier.
Johnson, K. P. (2021). Master Thesis: Transient Analysis of the NuScale Power Helical-Coil Steam 387 Generator Tube Rupture Using RELAP5-3D. Kingston, RI: University of Rhode Island.
Kim, M. S., and Jeong, Y. H. (2020). Conceptual design of small modular reactor driven by natural circulation and study of design characteristics using CFD & RELAP5 code. Nucl. Eng. Technol. 52, 2743–2759. doi:10.1016/j.net.2020.05.014
NuScale Power LLC (2020a). NuScale standard plant design certification application. Chapter 01: Introduction. and General Description of the Plant. Washington, DC: U.S. NRC.
NuScale Power LLC (2020b). NuScale standard plant design certification application. Chapter 04: Reactor. Washington, DC: U.S. NRC.
NuScale Power LLC (2020c). NuScale standard plant design certification application. Chapter 05: Reactor Coolant System and Connecting Systems. Washington, DC: U.S. NRC.
NuScale Power LLC (2020d). NuScale standard plant design certification application. Chapter 08: Electric Power. Washington, DC: U.S. NRC.
NuScale Power LLC (2020e). NuScale standard plant design certification application. Chapter 09: Auxiliary Systems. Washington, DC: U.S. NRC.
NuScale Power LLC (2020f). NuScale Standard Plant Design Certification Application. Chapter 15: Transient and Accident Analyses. Washington, DC: U.S. NRC.
Petruzzi, A., and D'Auria, F. (2008). Thermal-hydraulic system codes in nulcear reactor safety and qualification procedures. Sci. Technol. Nucl. Installations 2008 (460795), doi:10.1155/2008/460795
RELAP5 Development Team (1995). RELAP5/MOD3 code manual vol. 1: Code structure, system models, and solution methods. Idaho falls, ID: Idaho National Engineering Laboratory.
Ricotti, M. E., Cammi, A., Cioncolini, A., Cipollaro, A., Oriolo, F., Lombardi, C., et al. (2002). “Preliminary safety analysis of the IRIS reactor,” in International conference on nuclear engineering (ICONE10). (Arlington, VA, USA: ASME). doi:10.1115/ICONE10-22398
Skolik, K., Allison, C., Hohorst, J., Malicki, M., Perez-Ferragut, M., Pieńkowski, L., et al. (2021). Analysis of loss of coolant accident without ECCS and DHRS in an integral pressurized water reactor using RELAP/SCDAPSIM. Prog. Nucl. Energy 134, 103648. doi:10.1016/j.pnucene.2021.103648
Skolik, Katarzyna (2021). PhD dissertation: Thermal-hydraulic analysis of severe accident progress in pressurized light water reactor according to its scale. AGH University of Science and Technology. Kraków, Poland.
Skolik, K., Trivedi, A., Perez-Ferragut, M., and Allison, C. (2018a). “Assessment of RELAP/SCDAPSIM for turbine trip transient in NuScale-SMR,” in 26th international conference on nuclear engineering (ICONE26). (London, UK: ASME). doi:10.1115/ICONE26-81861
Skolik, K., Trivedi, A., Perez-Ferragut, M., and Allison, C. (2018b). “Integrated uncertainty analysis of the turbine trip transient in NuScale SMR using RELAP/SCDAPSIM,” in 12th international conference of the Croatian nuclear society. (Zadar, Croatia: Croatian Nuclear Society).
Yan, Y., Shi, S., and Ishii, M. (2016). “Scaling analysis and facility design for stability investigation during accidents in a PWR-type SMR,” in 24th international conference on nuclear engineering (ICONE24). (Charlotte, NC: ASME). doi:10.1115/ICONE24-60476
Keywords: ASTEC, NuScale, SMR, system code, thermal hydraulics, natural circulation
Citation: Guo Z, Xiao S and Chung KY (2022) Steady-state thermal hydraulic modelling and turbine trip transient simulation of the NuScale integral pressurised water reactor using the ASTEC code. Front. Energy Res. 10:1036142. doi: 10.3389/fenrg.2022.1036142
Received: 04 September 2022; Accepted: 26 October 2022;
Published: 14 November 2022.
Edited by:
Jingang Liang, Tsinghua University, ChinaReviewed by:
Zhongchun Li, Nuclear Power Institute of China (NPIC), ChinaYang Liu, Argonne National Laboratory (DOE), United States
Chen Wang, University of Illinois at Urbana-Champaign, United States
Copyright © 2022 Guo, Xiao and Chung. This is an open-access article distributed under the terms of the Creative Commons Attribution License (CC BY). The use, distribution or reproduction in other forums is permitted, provided the original author(s) and the copyright owner(s) are credited and that the original publication in this journal is cited, in accordance with accepted academic practice. No use, distribution or reproduction is permitted which does not comply with these terms.
*Correspondence: Sicong Xiao, snrxs@nus.edu.sg