Optimal planning of hybrid electric-hydrogen energy storage systems via multi-objective particle swarm optimization
 Juqin Xuan1
  Zhuolin Chen
- 1State Grid Fujian Electric Power Co. Ltd, Fuzhou, China
- 2Economic and Technological Research Institute of State Grid Fujian Electric Power Co. Ltd, Fuzhou, China
Abstract: In recent years, hydrogen is rapidly developing because it is environmentally friendly and sustainable. In this case, hydrogen energy storage systems (HESSs) can be widely used in the distribution network. The application of hybrid electric-hydrogen energy storage systems can solve the adverse effects caused by renewable energy access to the distribution network. In order to ensure the rationality and effectiveness of energy storage systems (ESSs) configuration, economic indicators of battery energy storage systems (BESSs) and hydrogen energy storage systems, power loss, and voltage fluctuation are chosen as the fitness function in this paper. Meanwhile, multi-objective particle swarm optimization (MOPSO) is used to solve Pareto non-dominated set of energy storage systems’ optimal configuration scheme, in which the technique for order preference by similarity to ideal solution (TOPSIS) based on information entropy weight (IEW) is used select the optimal solution in Pareto non-dominated solution set. Based on the extended IEEE-33 system and IEEE-69 system, the rationality of energy storage systems configuration scheme under 20% and 35% renewable energy penetration rate is analyzed. The simulation results show that the power loss can be reduced by 7.9%–22.8% and the voltage fluctuation can be reduced by 40.0%–71% when the renewable energy penetration rate is 20% and 35% respectively in IEEE-33 and 69 nodes systems. Therefore, it can be concluded that the locations and capacities of energy storage systems obtained by multi-objective particle swarm optimization can improve the distribution network stability and economy after accessing renewable generation.
Introduction
With the continuous advancement of science and technology in the world, the demand for energy supply is rising. Traditional energy based on fossil energy is facing major problems of resource depletion and environmental pollution (Li et al., 2022a), (Zhang et al., 2022). Developing clean and renewable energy, reducing the use of fossil energy, and reducing carbon emissions have become necessary means for the sustainable development of human society (Yang et al., 2020), (Yang et al., 2021a). However, renewable energy power generation is easily affected by weather factors, resulting in a series of problems such as voltage over-limit, large voltage fluctuation of distribution network, poor stability of power grid. With the development of energy storage systems (ESSs), configuring ESSs in distribution networks with a high penetration rate of renewable energy can effectively solve the above problems (Yang et al., 2021b; Yang, 2021; Wang et al., 2022).
The ESSs can store the energy that cannot be consumed in the power grid, and when the power grid load increases and the power supply is insufficient, the stored energy is fed back to the power grid. Reference (Li et al., 2022b) established a flywheel energy storage system to assist the thermal power units in the power grid to participate in the primary frequency regulation of the power grid to improve the frequency stability of the power grid. However, the flywheel energy storage system is a device that uses the mechanical energy in the rotation of the flywheel to store energy. The device is usually very large and the charging and discharging time is short. This characteristic makes the flywheel energy storage system unsuitable for long-term energy storage and difficult to apply to the power grid. Hydrogen energy storage systems (HESSs) are chemical energy storage systems that use hydrogen as a storage medium and can store a large amount of energy by electrolysis of water to produce hydrogen. When the grid load increases, hydrogen can be converted into electrical energy through a fuel cell (FC) to supply power to the grid. Because of the high cleanliness and sustainability of hydrogen, HESSs are configurated reasonably can accelerate the realization of low-carbon power grids and the goal of sustainable development.
In recent years, worldwide scholars have completed numerous research on ESSs configuration method (Sarvesh and Geena, 2017; Xing et al., 2017; Zhang et al., 2020; Georgious et al., 2021; Li et al., 2022c). In reference (Cui et al., 2017), aiming at minimizing the sum of voltage over-limit of each node, genetic algorithm was used to optimize the capacity of battery energy storage systems (BESSs). In reference (Yan et al., 2013), the annual net revenue was taken as the objective function to establish BESSs optimization value evaluation model, and the particle swarm optimization algorithm combined with multi-SUMT function was used to solve it. The models of ESSs optimization established in the above references are all single-objective models. The disadvantage of the single-objective model is that it is difficult to fully consider the economy and grid stability in the process of ESSs configuration. Reference (Yan et al., 2022) studied the configuration method of the hybrid energy storage system of electrochemical energy storage and hydrogen energy storage, aiming at reducing the wind and solar curtailment rate of the system, using a two-level optimization mode, and solving the model by the proximal policy optimization algorithm. Reference (Jiang and Chen, 2021) used the improved artificial bee colony algorithm to study how to reduce the daily cost of users, reduce the energy loss of ESSs and reduce the fluctuation of wind and solar energy for the ESSs in microgrid system. In reference (Fu et al., 2022), the mathematical model of optimal configuration of ESSs is constructed with the goal of the economic benefit of ESSs and the influence of the energy storage device on the voltage quality of the distribution network. The objectives in the above research content are difficult to fully reflect the real situation of distribution network operation after ESSs are connected. In reference (Li et al., 2022d), a power interaction constraint model was introduced into the capacity optimal configuration model of the hybrid electric-hydrogen energy storage systems to configure the capacity of ESSs to improve system economy and power supply reliability. Reference (Xiang et al., 2015) established a hybrid optimization model for the configuration of BESSs intending to maximize the net profit in the whole life cycle of BESSs in the distribution network. In reference (Luo and Shen, 2022), a hybrid electric-hydrogen energy storage structure was proposed to deal with the economic and practical problems of wind/photovoltaic/storage microgrid. The model of ESS is established with the goal of life cycle cost. Through simulation analysis, it is proved that the hybrid energy storage structure has the characteristics of good economy, high reliability and environmental friendliness. In reference (Guo et al., 2022a) A bi-level programming model of lead-acid battery-supercapacitor hybrid energy storage system is proposed. The outer objective function is the annual return rate of energy storage investment, considering the income of energy storage system, life cycle cost and other factors. The inner objective function is the daily scheduling income of energy storage. The two-layer model is solved by particle swarm algorithm and CPLEX solvers. Reference (Guo et al., 2022b) optimized the capacity of the ESSs according to the economic index of distributed energy storage systems (DESSs). When optimizing the ESSs, the above research does not consider the influence of ESSs on the stability of the distribution network operation.
Based on the existing research content, considering that the configuration of ESSs needs to be determined from various angles. In this paper, a multi-objective particle swarm optimization (MOPSO) algorithm is proposed to optimize the configuration of hybrid electric-hydrogen energy storage systems when the penetration rate of renewable energy is 20% and 35% respectively. A multi-objective optimization model is established with the economic indicators of BESSs and HESSs, network loss, and voltage fluctuation as the objectives.
The main contributions of this work are:
1) A multi-objective optimization model based on Pareto is established, and a multi-objective location and capacity model of the hybrid energy storage system is established with three objectives;
2) TOPSIS based on IEW to establish weight is used to obtain the optimal solution from the Pareto front of MOPSO.
3) The extended IEEE-33 node systems and IEEE-69 node systems are simulated and tested when the renewable energy penetration rate is 20% and 35% respectively. In this way, the optimization ability of the MOPSO algorithm is verified, and the optimal configuration scheme of hybrid electric-hydrogen energy storage systems under two different node systems is obtained.
Battery energy storage systems/hydrogen energy storage systems configuration model
The model consists of load, BESSs, photovoltaic power generation, wind power generation, electrolytic cell, FC unit, and hydrogen tank (HT). The state of charge (SOC) of BESSs is an important parameter of charge and discharge operation.
The SOC of BESSs can be calculated as follows:
where
The exchange power between BESSs and the power grid can be calculated by Eq. 2:
It should be noted that the charging and discharging processing of BESSs cannot proceed at the same time, so the power exchange between BESSs and network must be satisfied:
Objective function
In this work, the economic index of the hybrid electric-hydrogen energy storage system, the daily network loss of the power grid, and voltage fluctuation is taken as the objectives, and a multi-objective optimization model based on Pareto can be established as follows:
where
1) Economic indicators of ESSs
ESSs economic indicators include total capital cost (TCC) and maintenance cost (MC). The economic indicators of HESSs and BESSs are as follows:
Total capital cost of battery energy storage systems
where
Maintenance cost of battery energy storage systems
where
Total capital cost of hydrogen energy storage systems
where
Maintenance cost of hydrogen energy storage systems
where
The power gird loss is considered in ESSs siting and sizing planning, expressed as daily power losses, as follows:
where
The voltage quality of the power grid is considered in the location and capacity planning of the ESSs, expressed as daily voltage fluctuations, as follows:
where
Constraints
where
2) Charge-discharge constraints of BESSs and HESSs
Here, Eq. 13 represents the charge and discharge constraints of BESSs, where
3) Capacity and power constraints of ESSs
where Eq. 15 represents the upper and lower limits of the capacity and power of BESSs; Eq. 16 represents the upper and lower limits of the capacity and power of HESSs.
4) Installation node number constraints of ESSs
where Eq. 17 represents the upper and lower limits of installation node number of ESSs. It should be noted that since node 1 is a balanced node, the installation node number of BESSs and HESSs starts from node 2, and the two energy storage devices cannot be installed at the same node location.
where
Model solution based on multi-objective particle swarm optimization
Multi-objective particle swarm optimization
In MOPSO, the swarm is composed of multiple particles, each particle represents a feasible solution of the optimization problem. The algorithm uses the global optimal solution and local optimal solution in each iteration to update the fitness. Eq. 19, 20 are the update methods of particle velocity and position (Shi and Wei, 2022).
where
where
The details of MOPSO are as follows:
1) Input distribution network parameters and operation data;
2) Set MOPSO parameters, population initialization, set the initial value of the marker;
3) Adding a new particle to the external archive set and marking the dominated particle by comparing it with the existing particle;
4) Delete all marked particles;
5) Calculate the current crowding degree according to Eq. 22, sort the crowding degree in descending order, and control the size of Pareto solution set;
6) The particles with the first 10% crowding degree are selected as the optimal particles;
7) Steps (3–6) are repeated to obtain the Pareto optimal solution set. The flowchart diagram of the MOPSO used for hybrid electric-hydrogen energy storage system is shown in Figure 1.

FIGURE 1. The flowchart diagram of the MOPSO used for hybrid electric-hydrogen energy storage system.
Pareto solution set storage and selecting
It should be noted that the external archive set is used to store the Pareto solution set. During the iteration, the particles obtained from each iteration are compared with all the particles already in the archive to update the solution set in the archive. The specific methods are as follows:
1) The particles to be added are compared with all particles in the archive, and if the particles to be added dominate a particle in the archive, the particles in the archive are marked;
2) If a particle in the archive dominates the particles to be added, the particles to be added will be marked;
3) When all the particles are compared, delete all marked particles.
To ensure computational speed, the external archive can only store a limited number of solutions. Therefore, the size of the Pareto solution set is limited, and the crowding degree is used to limit the size of the Pareto solution set below the limit value. The crowding degree is calculated as follows:
where,
Technique for order preference by similarity to ideal solution based on information entropy weight to establish weights
In this paper, a TOPSIS based on IEW is designed. The optimal solution in the Pareto solution set is taken as the optimal decision scheme, which is composed of the following steps (Zhang et al., 2018):
1) Dimensionless objective function
Eq. 24 represents the original data matrix consisting of
The normalized matrix
2) Calculating the entropy
3) Calculating the distance between each objective function and the absolute ideal solution
where
Case studies
In this work, the extended IEEE-33 and extended IEEE-69 node system are used to test whether the ESSs configured by MOPSO can improve the power quality, reduce the voltage fluctuation and improve the stability of the power system when the renewable energy penetration rate is 20% and 35% respectively. The parameter settings of MOPSO are shown in Table 1. Table 2 shows the main parameters of power grid (Yang et al., 2021c). Table 3 and Table 4 shows the parameters of the IEEE-33 node system and IEEE-69 node system. Table 5 shows the main parameters of BESSs and HESSs. Moreover, the longer the duration time (DT), the higher the battery cost.
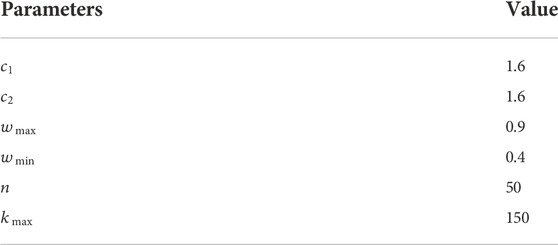
TABLE 1. MOPSO parameter setting.
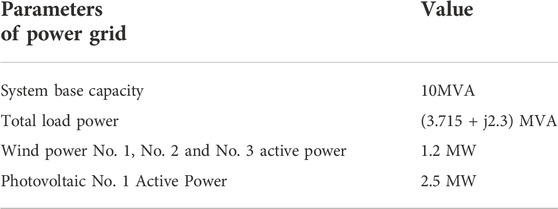
TABLE 2. Main parameters of power grid.
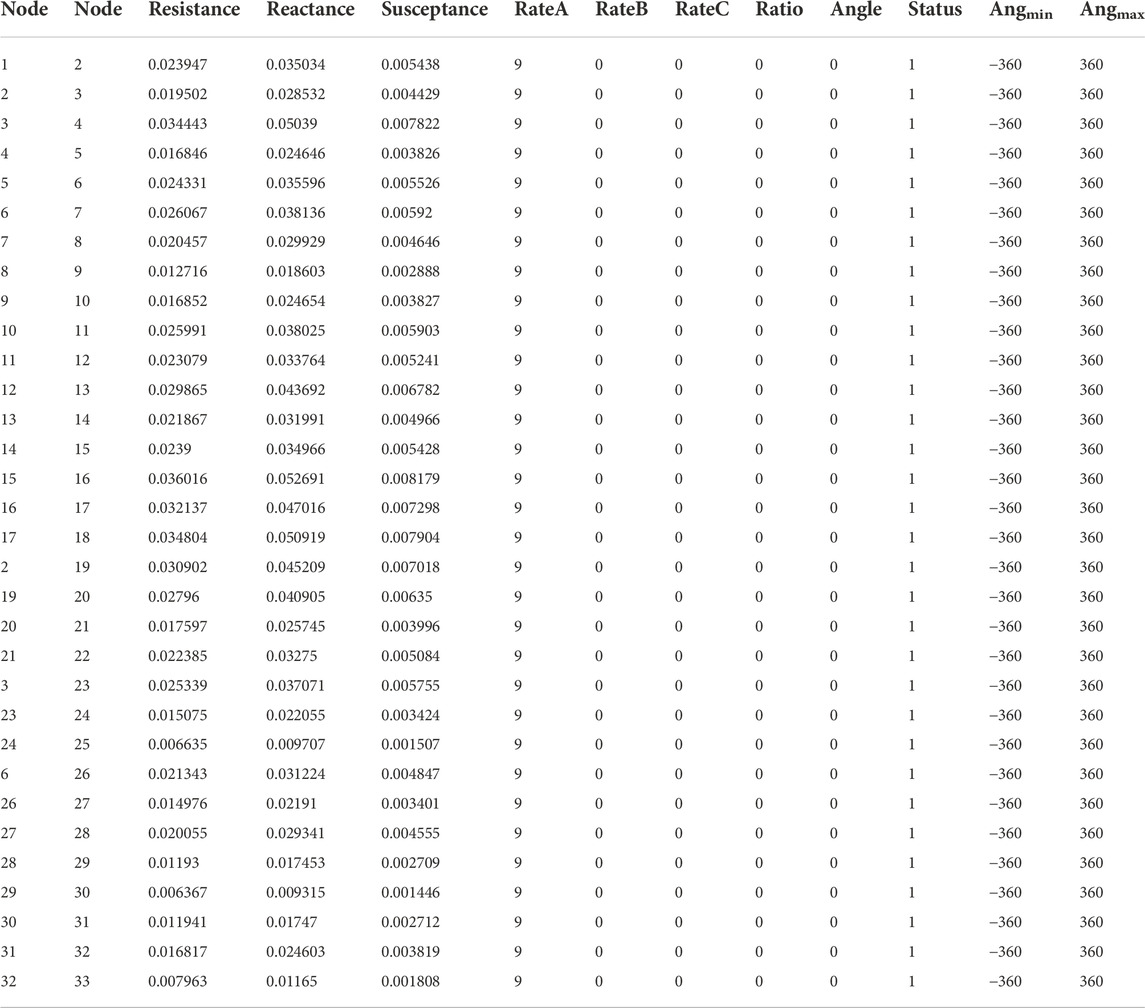
TABLE 3. Parameters of the IEEE-33 node system.
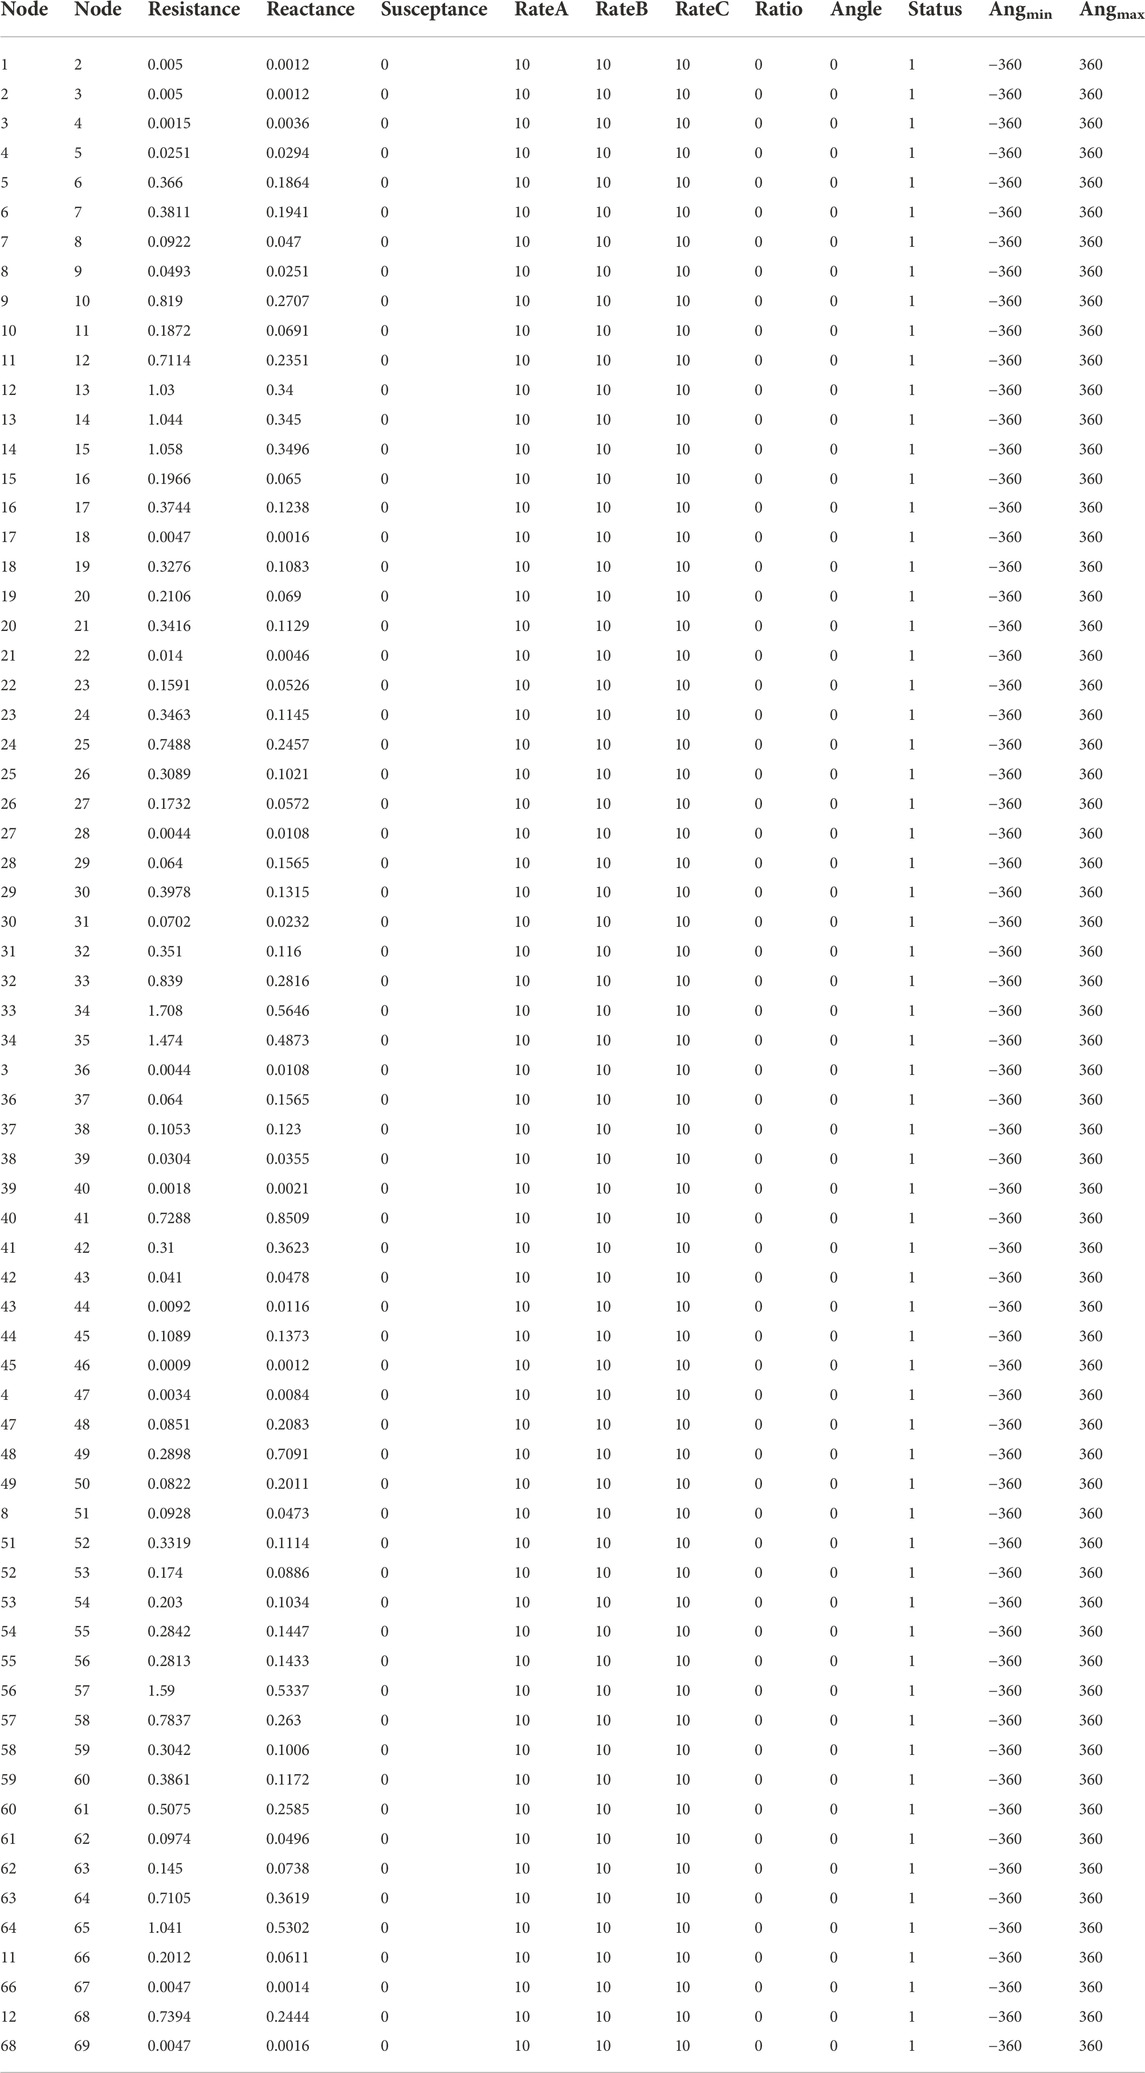
TABLE 4. Parameters of the IEEE-69 node system.
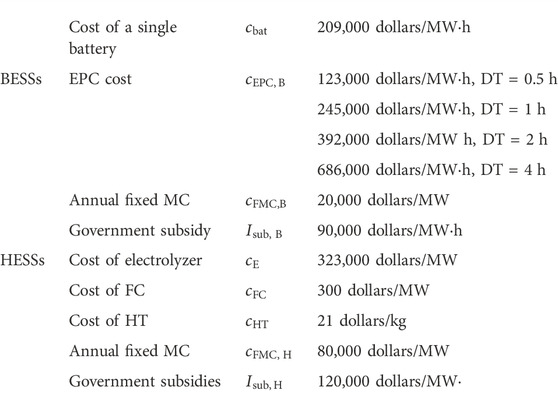
TABLE 5. Main parameters of BESSs and HESSs.
Results analysis of extended IEEE-33 node system
The topology of the extended IEEE-33 node system is shown in Figure 2. Wind power No. 1, No. 2 and No. 3 are connected at nodes 9, 20 and 25 respectively. Photovoltaic No. 1 is connected at nodes 28.
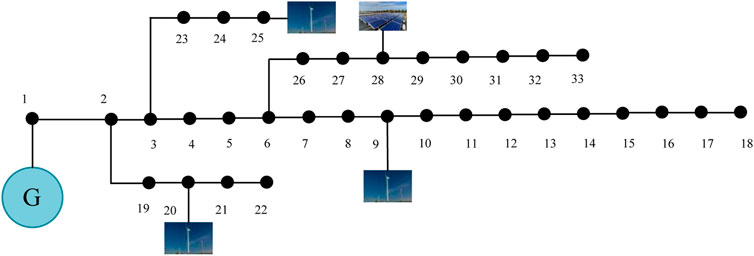
FIGURE 2. Topology of the extended IEEE-33 bus.
Table 6 shows the daily network loss and daily voltage fluctuation without ESSs. Table 7 shows the optimal configuration scheme of TOPSIS MOPSO based on IEW method under two different renewable energy penetration rates. By comparing Table 6 and Table 7, it can be found that the daily network loss of the power grid is reduced and the daily node voltage fluctuation is significantly reduced after the configuration of the hybrid electric-hydrogen energy storage system. When renewable energy penetration rate is 20%, the daily network loss of the power grid decreases by 0.2725 MW, and the daily node voltage fluctuation decreases by 3.7955 p. u. When the renewable energy penetration rate is 35%, the daily network loss decreases 0.2774 MW, the daily node voltage fluctuation decreases 3.9752 p. u. It can be seen from Table 7 that when the renewable energy penetration rate is 20%, the two BESSs are installed at node seven and node 26 respectively, which capacities are 0.7148 MWh and 0.3615 MWh respectively. Meanwhile, the power capacity of 0.7069 MW and 0.4526 MW respectively. Two HESSs are installed in node 11 and node 10, with the capacity of 12.349 kg, 7.420 kg, and the power of 0.7105 MW, and 0.4669 MW respectively. When the rate is 35%, the two BESSs are installed at node six and node 26 respectively, and their capacities are 0.1886 MW h and 0.5279 MW h respectively, and their powers are 0.7112 MW and 0.6805 MW respectively. Two HESSs are installed in node 23 and node 26, with the capacity of 9.1354 kg, 8.32 kg, and the power of 0.6767 MW, and 0.7139 MW respectively. Moreover, when the renewable energy penetration generation rate is 20%, the total configuration cost of ESSs is $ 268,000, which is $ 52,000 higher than the rate is 35%. This can be confirmed by the total capacity of ESSs configurations for two different penetration rates. Figure 3A and Figure 3B show the node voltage levels of the extended IEEE-33 system after the optimized configuration of ESSs when the renewable energy penetration rate is 20% and 35%, respectively. Figure 4A and Figure 4B are the average node voltage of the IEEE-33 system after the optimized configuration of ESSs when the renewable energy penetration rate is 20% and 35%, respectively. A conclusion can be drawn from Figure 3 and Figure 4 that under two different renewable energy penetration rates, compared with the unconfigured hybrid electric-hydrogen energy storage system, the configuration of the hybrid electric-hydrogen energy storage system using the algorithm described in this work can improve the voltage level of the power grid, stabilize the average node voltage of the power grid, and improve the quality.
1) Node voltage level when renewable energy penetration rate is 20%
2) Node voltage level when renewable energy penetration rate is 35%
3) Average node voltage when renewable energy penetration rate is 20%
4) Average node voltage when renewable energy penetration rate is 35%
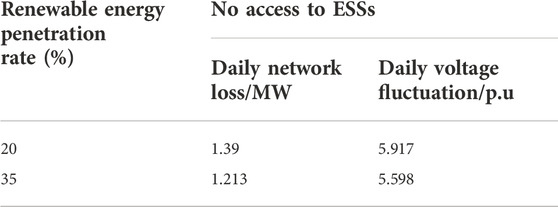
TABLE 6. Network loss and voltage fluctuation when ESS is not configured.
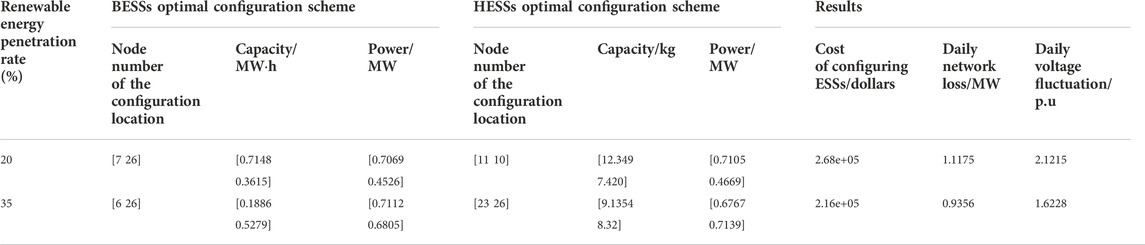
TABLE 7. BESSs and HESSs configuration schemes and optimization results under two different renewable energy penetration rates.

FIGURE 3. Node voltage level after optimized configuration of ESSs when renewable energy penetration is 20% and 35%. (A) Node voltage level when renewable energy penetration rate is 20 %; (B) Node voltage level when renewable energy penetration rate is 35 %.
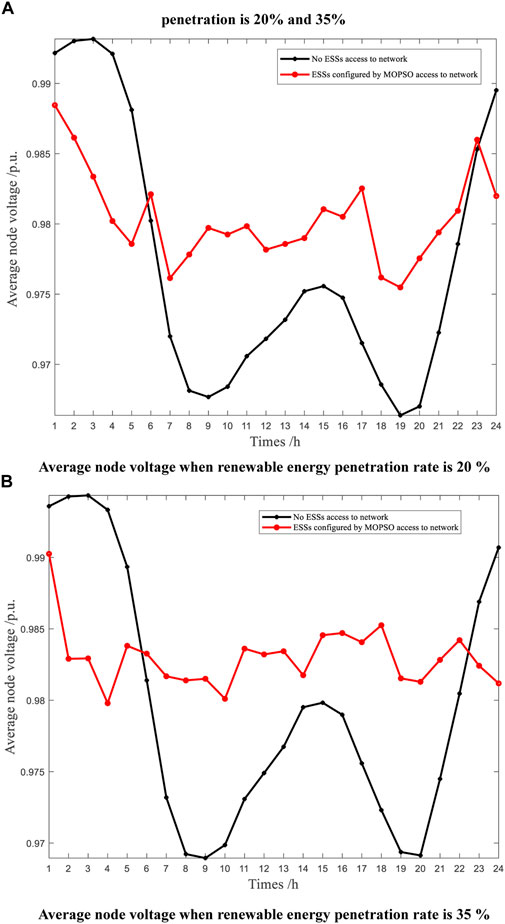
FIGURE 4. Average node voltage after optimized configuration of ESSs when renewable energy penetration is 20% and 35%. (A) Average node voltage when renewable energy penetration rate is 20 %; (B) Average node voltage when renewable energy penetration rate is 35 %.
Results analysis of extended IEEE-69 node system
The topology of the extended IEEE-69 node system is shown in Figure 5. Wind power No. 1, No. 2 and No. 3 are connected at nodes 9, 20 and 25 respectively. Photovoltaic No. 1 is connected at nodes 28.
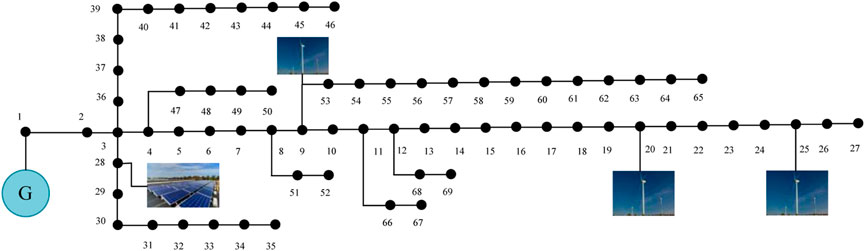
FIGURE 5. Topology of the extended IEEE-69 bus.
Table 8 shows the daily network loss and daily voltage fluctuation without ESSs. Table 9 shows the optimal configuration scheme of TOPSIS MOPSO based on IEW method under two different renewable energy penetration rates. By comparing Table 8 and Table 9, it can be found that the hybrid electric-hydrogen energy storage system configured can reduce the daily network loss of the power grid and the daily node voltage fluctuation. When renewable energy penetration rate is 20%, the daily network loss of the power grid decreases by 0.2987 MW, and the daily node voltage fluctuation decreases by 1.881 p. u. When the renewable energy penetration rate is 35%, the daily network loss decreases 0.1833 MW, the daily node voltage fluctuation decreases 2.2537 p. u. It can be seen from Table 9 that when the renewable energy penetration rate is 20%, the two BESSs are installed at node 57 and node 48 respectively, which capacities are 0.2428 MWh and 0.1528 MWh respectively. Meanwhile, the power of both BESSs is 0.72 MW. Two HESSs are installed in node 36 and node 2, with the capacity of 13 kg, and 14.338 kg, and the power of both HESSs is 0.72 MW. When the rate is 35%, the two BESSs are installed at node 57 and node 36 respectively, and their capacities are 0.5553 MW h and 0.1 MW h respectively, and their powers are 0.72 MW and 0.6621 MW respectively. Two HESSs are installed in node 49 and node 36, with the capacity of 6.2487 kg, 6.2345 kg, and the power of 0.6702 MW, and 0.6844 MW respectively. Furthermore, it can be seen from Table 9 that the total capacity of ESSs with 20% renewable energy penetration is lower than the 35% renewable energy penetration. Therefore, with 20% renewable penetration, the total allocation of ESSs is reduced by $8,000 compared to 35% penetration, which is a reasonable result. Figures 6A,B show the node voltage levels of the extended IEEE-69 system after the optimized configuration of ESSs when the renewable energy penetration rate is 20% and 35%, respectively. Figures 7A,B are the average node voltage of the extended IEEE-69 system after the optimized configuration of ESSs when the renewable energy penetration rate is 20% and 35%, respectively. A conclusion can be drawn from Figure 6 and Figure 7 that after ESS is configured, the voltage level is improved, the average node voltage stability of the nodes of the power grid is improved, the fluctuation is reduced, and the stability of the power grid is improved.
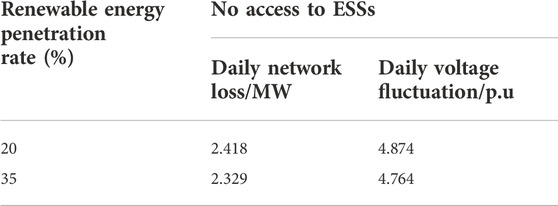
TABLE 8. Network loss and voltage fluctuation when ESSs is not configured.
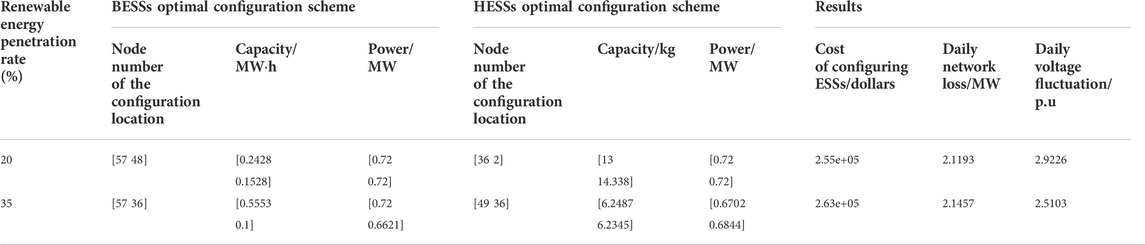
TABLE 9. BESSs and HESSs configuration schemes and optimization results under two different renewable energy penetration rates.
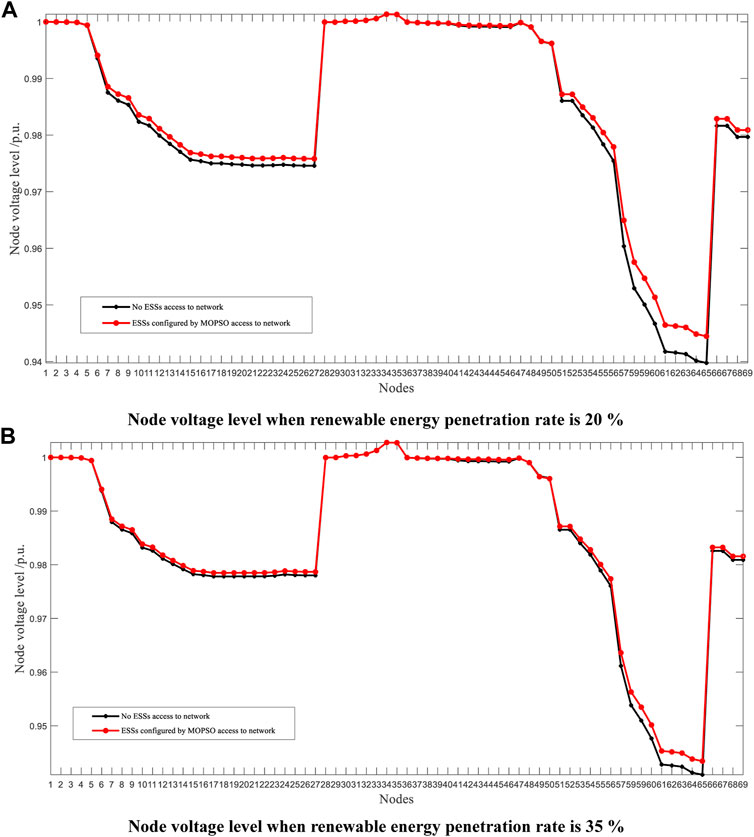
FIGURE 6. Node voltage level after optimized configuration of ESSs when renewable energy penetration is 20% and 35%. (A) Node voltage level when renewable energy penetration rate is 20 %; (B) Node voltage level when renewable energy penetration rate is 35 %.
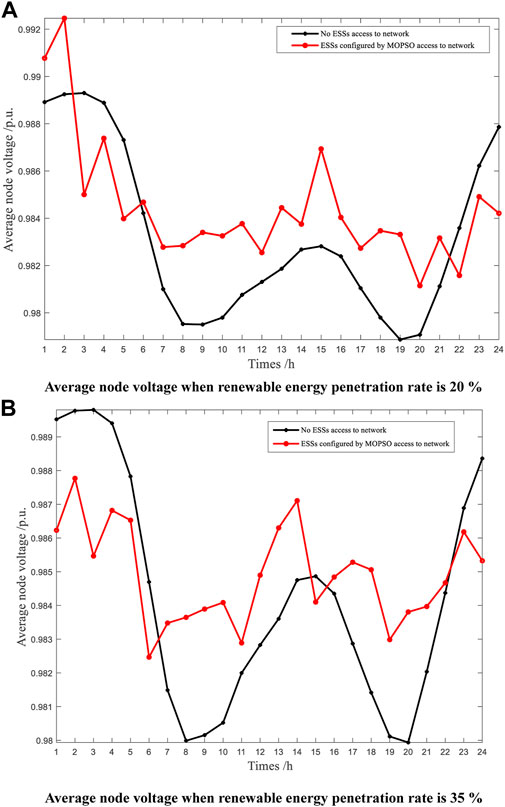
FIGURE 7. Average node voltage after optimized configuration of ESSs when renewable energy penetration is 20% and 35%. (A) Average node voltage when renewable energy penetration rate is 20 %; (B) Average node voltage when renewable energy penetration rate is 35 %.
Conclusion
In this work, a Pareto multi-objective optimization model based on MOPSO is proposed to configure the hybrid energy storage system to improve the stability of distribution network operation. Firstly, it is proved that MOPSO can obtain the ESSs configuration scheme stably when the renewable energy penetration rate is 20% and 35% respectively, through the extended IEEE-33 and IEEE-69 system tests. Secondly, Figure 8 shows the Pareto front of MOPSO and the position of the optimal solution, which proves that MOPSO has a strong optimization effect. Finally, by comparing with the system without ESSs, it is proved that the ESSs configuration scheme obtained by this method can improve the node voltage level of the distribution network, reduce the node average voltage fluctuation of the distribution network, and prevent the voltage from exceeding the limit. It should be noted that as the penetration of renewable generation increases, the net-load fluctuation of the distribution network has increased, which will influence the stability of the electric power system and electric quality of the users. Hence, the rate capacity of BESSs has expanded, so the configuration costs may increase. It can be seen from the Tables 7 and 9, when the renewable energy penetration rate of IEEE-33 system is 20% and 35%, the daily power loss is reduced by 0.2725 MW and 0.2774 MW respectively. At the same time, the daily node voltage fluctuation has decreased by 3.7955 p. u. and 3.9752 p. u. respectively. Furthermore, in IEEE-69 system, the daily power loss has reduced by 0.2987 MW and 0.1833 MW respectively as well as the daily node voltage fluctuation has decreased by 1.881 p. u. and 2.2537 p. u. respectively. It shows that ESSs configuration scheme based on MOPSO can improve the stability of the distribution network effectively.
1) Pareto distribution for IEEE-33 system with 20% penetration of renewable energy
2) Pareto distribution for IEEE-33 system with 35% penetration of renewable energy
3) Pareto distribution for IEEE-69 system with 20% penetration of renewable energy
4) Pareto distribution for IEEE-69 system with 35% penetration of renewable energy
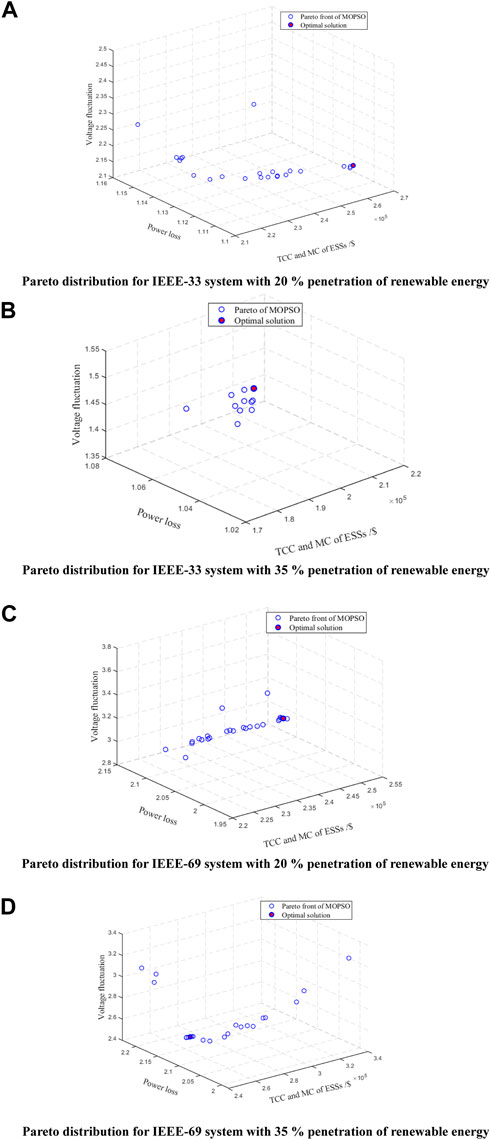
FIGURE 8. The pareto front of MOPSO and the position of the optimal solution. (A) Pareto distribution for IEEE-33 system with 20 % penetration of renewable energy; (B) Pareto distribution for IEEE-33 system with 35 % penetration of renewable energy; (C) Pareto distribution for IEEE-69 system with 20 % penetration of renewable energy; (D) Pareto distribution for IEEE-69 system with 35 % penetration of renewable energy.
Data availability statement
The raw data supporting the conclusions of this article will be made available by the authors, without undue reservation.
Author contributions
JX: writing the manuscript; ZC: discussion of the economic index; JZ: discussion of the technology index; ZZ: editing; YS: discussion of the topic.
Funding
This work is funded by special research project of State Grid Fujian Electric Power Co., Ltd. (B3130N22000S).
Conflict of interest
Author JX is employed by State Grid Fujian Electric Power Co., Ltd. Authors ZC, JZ, ZZ and YS are employed by Economic and Technological Research Institute of State Grid Fujian Electric Power Co., Ltd.
Publisher’s note
All claims expressed in this article are solely those of the authors and do not necessarily represent those of their affiliated organizations, or those of the publisher, the editors and the reviewers. Any product that may be evaluated in this article, or claim that may be made by its manufacturer, is not guaranteed or endorsed by the publisher.
References
Cui, Y., Liu, W., and Tang, Y. H. (2017). An optimal allocated method for energy storage batteries improving voltage level of distributed network with high penetration of distributed PV[J]. Acta. Energiae Solaris Sin. 38 (5), 1157–1165. CNKI:SUN:TYLX.0.2017-05-001.
Fu, L., Dong, L. T., and Zhang, Y. (2022). Research on optimal configuration of energy storage system in distribution network considering voltage quality[J]. Electr. Autom. 44 (1), 2430–2526. doi:10.3969/j.issn.1000-3886.2022.01.008
Georgious, R., Refaat, R., Garcia, J., and Daoud, A. A. (2021). Review on energy storage systems in microgrids. Electronics 10 (17), 2134. doi:10.3390/ELECTRONICS10172134
Guo, B., Xing, J., Yao, F., and Jing, X. (2022). Optimal configuration of user-side hybrid energy storage based on bi-level programming model[J]. Energy Storage Sci. Technol. 11 (2), 615–622. doi:10.19799/j.cnki.2095-4239.2021.0508
Guo, Y. H., Yu, D., and Yang, P. (2022). Optimal capacity allocation method of a distributed energy storage system based on greedy algorithm[J]. Energy Storage Sci. Technol. 11 (7), 2295–2304. doi:10.19799/j.cnki.2095-4239.2021.0695
Jiang, W., and Chen, Z. G. (2021). Optimization of microgrid energy storage system capacity based on improved artificial bee colony algorithm[J]. J. Shanghai Univ. Electr. Power 37 (05), 415427–416421. doi:10.3969/j.issn.2096-8299.2021.05.001
Li, B. H., Liang, L., and Hong, F. (2022). Research on primary frequency modulation of thermal power unit based on flywheel energy storage[J]. Electr. Eng. (9), 15–18. doi:10.19768/j.cnki.dgjs.2022.09.004
Li, H. X., Li, J. L., and Mi, Y. (2022). Summary of research on new energy side energy storage optimization configuration technology[J/OL]. Energy Storage Sci. Technol., 1–11. doi:10.19799/j.cnki.2095-4239.2022.0102
Li, R. R., Li, Q., and Pu, Y. C. (2022). Optimal configuration of an electric-hydrogen hybrid energy storage multi-microgrid system considering power interaction constraints[J]. Power Syst. Prot. Control 50 (14), 53–64. doi:10.19783/j.cnki.pspc.211311
Li, X. J., Ma, H. M., and Jiang, Q. (2022). Review of energy storage configuration technology on renewable energy side[J]. Electr. Power 55 (1), 13–25. doi:10.11930/j.issn.1004-9649.202109032
Luo, X., and Shen, Y. X. (2022). Research on optimal capacity allocation of hybrid energy storage system for wind solar energy storage microgrid[J]. Tech. Automation Appl. 41 (6), 108–111. doi:10.20033/j.1003-7241.(2022)06-0108-04
Sarvesh, G., and Geena, K. (2017). A review on energy storage systems for mitigation power fluctuations in wind turbine based power system[J]. J. Trend Sci. Res. Dev. 1 (4), 414–419. doi:10.31142/ijtsrd170
Shi, Z. L., and Wei, Y. W. (2022). Multi-objective optimization of active distribution network based on particle swarm optimization[J/OL]. Electron. Sci. Technol., 1–8. doi:10.16180/j.cnki.issn1007-7820.2022.09.002
Wang, L., Wang, Z., and Feng, B. (2022). Optimal configuration of wind-photovoltaic-ESS complementary power generation system based on bi-level optimization model[J]. Acta. Energiae Solaris Sin. 43 (5), 98–104. doi:10.19912/j.0254-0096.tynxb.2020-0430
Xiang, Y. P., Wei, Z. N., and Sun, G. Q. (2015). Life cycle cost based optimal configuration of battery energy storage system in distribution network[J]. Power Syst. Technol. 39 (1), 264–270. doi:10.13335/j.1000-3673.pst.2015.01.040
Xing, P. X., Zhang, S. Z., and Zeng, M. D. (2017). Review of configuration optimization for hybrid microgrid with multiple energy resources[J]. Eng. J. Wuhan Univ. 50 (3), 375–383. doi:10.14188/j.1671-8844.2017-03-009
Yan, Q. Y., Shi, C. F., and Qin, G. Y. (2022). Research on two-layer configuration and operation optimization based on proximal policy optimization for electrochemical/hydrogen hybrid energy storage system[J]. Electr. Power Constr. 43 (8), 22–32. doi:10.12204/j.issn.1000-7229.2022.08.003
Yan, Z. M., Wang, C. M., and Zheng, Jian (2013). Value assessment model of battery energy storage system in distribution network[J]. Electr. Power Autom. Equip. 33 (2), 57–61. doi:10.3969/j.issn.1006-6047.2013.02.010
Yang, B., Wang, J. T., Chen, Y. X., Li, D., and Zeng, C. (2020). Optimal sizing and placement of energy storage system in power grids: A state-of-the-art one-stop handbook. J. Energy Storage 32, 101814. doi:10.1016/j.est.2020.101814
Yang, B., Yu, L., Chen, Y. X., Ye, H., Shao, R., and Shu, H. (2021). Modelling, applications, and evaluations of optimal sizing and placement of distributed generations: A critical state-of-the-art survey. Int. J. Energy Res. 45 (3), 3615–3642. doi:10.1002/er.6104
Yang, B., Yu, L., and Wang, J. T. (2021). Optimal sizing and placement of distributed generation based on adaptive manta ray foraging optimization[J]. J. Shanghai Jiao Tong Univ. 55 (12), 1673–1688. doi:10.16183/j.cnki.jsjtu.2021.397
Yang, X. L., Ding, L. M., and Li, Y. H. (2021). Study on optimal allocation of hybrid energy storage system considering wind power uncertainty[J]. Power Demand Side Manag. 23 (06), 69–74. doi:10.3969/j.issn.1009-1831.2021.06.014
Yang, Y. M. (2021). Analysis of optimal configuration strategy of power grid energy storage system[J]. Electron. Test. (22), 104–106. doi:10.16520/j.cnki.1000-8519.2021.22.039
Zhang, Q. G., Zhang, J. F., and Liu, Y. (2018). Transmission performance optimization of dual-cavity half toroidal CVT through IEW & TOPSIS[J]. Operations Res. Manag. Sci. 27 (8), 99–104. doi:10.12005/orms.2018.0187
Zhang, S. J., Qian, X., and Bai, C. (2022). Optimal configuration method of energy storage system oriented to multiapplication scenarios[J]. Zhejiang Electr. Power 41 (5), 22–31. doi:10.19585/j.zjdl.202205004
Keywords: battery energy storage systems (BESSs), hydrogen energy storage systems (HESSs), multiple-objective particle swarm optimization (MOPSO), smart grid, voltage adjustment
Citation: Xuan J, Chen Z, Zheng J, Zhang Z and Shi Y (2023) Optimal planning of hybrid electric-hydrogen energy storage systems via multi-objective particle swarm optimization. Front. Energy Res. 10:1034985. doi: 10.3389/fenrg.2022.1034985
Received: 02 September 2022; Accepted: 20 September 2022;
Published: 09 January 2023.
Edited by:
Bin Zhou, Hunan University, ChinaReviewed by:
Jingbo Wang, University of Liverpool, United KingdomXiaoshun Zhang, Northeastern University, China
Mert Sinan Turgut, Ege University, Turkey
Copyright © 2023 Xuan, Chen, Zheng, Zhang and Shi. This is an open-access article distributed under the terms of the Creative Commons Attribution License (CC BY). The use, distribution or reproduction in other forums is permitted, provided the original author(s) and the copyright owner(s) are credited and that the original publication in this journal is cited, in accordance with accepted academic practice. No use, distribution or reproduction is permitted which does not comply with these terms.
*Correspondence: Zhuolin Chen, kc1132672500@outlook.com