Multi-objective optimization model of micro-grid access to 5G base station under the background of China’s carbon peak shaving and carbon neutrality targets
 Weishang Guo
 Yihua Mao1
 - 1College of Civil Engineering and Architecture, Zhejiang University, Hangzhou, Zhejiang, China
- 2School of Civil Engineering and Architecture, Taizhou University, Taizhou, Zhejiang, China
- 3Fangyuan Construction Group Co.,Ltd., Taizhou, Zhejiang, China
Abstract: a large number of 5G base station are connected, which provides a new possibility for the future low-carbon development of power systems. By encouraging 5G base station to participate in demand response and incorporating it into the Microgrid, it can reduce the power consumption cost of 5G base stations and promote the efficient utilization of renewable energy. Based on the microgrid operation structure, 5G base station and multi-objective problem algorithm, a multi-objective optimization operation model of microgrid access to 5G base station is built. Considering the physical constraints of Microgrid, the objective is to minimize the operating cost and carbon emission. Through the joint dispatching of distributed clean energy generation, micro gas turbine, energy storage system and 5G base station in Microgrid, the comprehensive optimization of system economy and low-carbon benefits can be achieved. In this paper, a microgrid in Beijing is taken as the research object, and the Whale Optimization Algorithm algorithm is used to solve the multiobjective problem. The analysis results show that 5G base station can flexibly respond to microgrid scheduling, which helps microgrid to improve the consumption and utilization efficiency of renewable energy, thus bringing higher economic benefits and low-carbon benefits, and helping China to achieve the goal of carbon peak shaving and carbon neutrality at an early date.
1 Introduction
1.1 Literature review
China’s “14 Five-Year Plan” for electric power development has been made clear. China will no longer build new coal-fired power generation projects, and arrange a certain scale to ensure the electric power supply according to demand, so as to vigorously promote the consumption of clean energy such as wind energy and photovoltaic energy. By 2030, the installed capacity of wind power and photovoltaic in China is expected to reach over 1.8 billion GW, accounting for about 25% of the total power generation. In 2060, the installed capacity of wind power and photovoltaic power generation is expected to reach over 6 billion GW, accounting for about 75% of the total power generation. With the increasing popularity of new energy, the peak-valley difference of net load fluctuation after the superposition of new energy output and load demand will increase year by year.
China’s microgrid construction is still in the exploratory stage. With the deepening of energy consumption revolution and power system reform, and the continuous maturity of grid-connected technology of distributed generation, the interactive operation with external large power grid will remain a research focus. Microgrid is usually integrated by distributed generation, energy storage system, demand side and energy management system, and becomes a small power generation and distribution system which can not only be used as backup grid connected operation, but also independent of external power grid. At the executive meeting of China’s State Council in April 2020, seven major new infrastructure projects were established. They include 5G base station construction, UHV, intercity high-speed railway and urban rail transit, charging piles for new energy vehicle, big data center, artificial intelligence and industrial internet. Therefore, the construction of 5G base station connected to microgrid is one of the inevitable directions of new power system construction in China. Espina et al. (2020) summarized the development of distributed cooperative control system, they thought applied the cooperative algorithm of the system, including the minimum cost operation. Agalgaonkar and Robinson (2021) discussed relationship between communication system and power system of Microgrid, and the latest development of Microgrid is described. Hirsch et al. (2018) considered that the application of Microgrid has entered into commercial application from experiment, which improves the reliability of power supply, manages distributed energy. Chen et al. (2020a) considered communication and functional integration comprehensively to realize the optimal and sustainable operation of Microgrid. Parhizi et al. (2015) discussed the different design schemes in islanding state and connected with large power grid, and reviewed the technologies of distributed generation, protection and communication. Ke et al. (2022a); Ke et al. (2022b) studied the investment scheme selection of urban comprehensive energy system and photovoltaic poverty alleviation project, and analyzed the economic and environmental benefits of these two new power systems from the perspectives of economic cost and energy utilization.
Distributed generation technology is undoubtedly an important generation side component of microgrid. System planning and energy policy making are of great significance for the coordinated control of distributed generation. Lopes et al. (2007); Gupta et al. (2020); Zhao et al. (2020) improved the power quality of wind energy and photovoltaic in distribution network and reduced the harmonics through the adaptive signal extraction method and the design of T-shaped filter. Zhang et al. (2011) simulated a new grid connected inverter for distributed wind power generation in MATLAB. Liu et al. (2006) discussed the safe operation state of grid connected control. Lee et al. (2021); Yuvaraj et al. (2021) used different algorithms to find the optimal capacity and location of distributed generation. Naval and Yusta (2021) optimized the hourly scheduling of pumping equipment proves that distributed photovoltaic warfare reduces the energy cost of pumping station. Lotfi (2021) proved that using demand response to change user habits can achieve optimization effect when the joint operation of distributed generation and reactive power compensation capacitor combined. Katiraei and Iravani (2006) mainly studied the active and reactive power management strategy of distributed generation unit. Alabdali and Nahhas (2021) discussed the scope and development prospect of photovoltaic grid connection in Arab region. Onojo et al. (2021) compared the differences between two different systems including distributed generation unit and diesel generating unit.
The optimization of microgrid has always been the focus of attention of experts and scholars, which can be roughly divided into two aspects: one is the optimization of scheduling operation, and the other is the optimization of capacity allocation. In terms of scheduling, (Weishang et al., 2022) used the PSO algorithm to construct and solve the optimal scheduling of the gas heat virtual power plant. Marzband et al. (2018a) considered a large number of distributed energy suppliers in the energy market firstly. A heuristic algorithm is adopted to maximize the economic benefits of all subjects. Marzband et al. (2018b) put forward the main body of demand response. The market mechanism is used to change the consumption mode of consumers, so as to improve the operation optimization mechanism of power market. Tavakoli et al. (2018) optimized the cost strategy of Microgrid for commercial buildings by using linear programming model after quantifying the cost of distributed generation in bad weather by conditional value at risk theory. Zia et al. (2018) compared several communication technologies and analyzed the optimal cost management strategy. Ali et al. (2021) used the bi level programming model based on meta heuristic to solve the randomness of uncertain generation and electric vehicle random charge and discharge. Junejo et al. (2021) used the improved MILP method to optimize the Microgrid access scheme in rural areas can reduce the total net present value and carbon emissions. Tan et al. (2020) established a model based on multi task learning and least squares support to predict the electric, heating, cooling and gas loads in the integrated energy system, which is helpful to improve the operation efficiency of the system. Zhou et al. (2021) used the robust model to ensure the high robustness and stability of wind power inverter in Microgrid, which can not only save energy but also ensure the fast convergence. Zandrazavi et al. (2022) proposed a stochastic multi-objective optimization model for Microgrid to minimize the total operating cost and voltage deviation. by ε-Constraint method and fuzzy satisfaction method. Chen et al. (2020b) proposed an unconscious islanding transition control strategy of three-phase/single-phase MMG based on artificial emotion reinforcement learning to reduce the time required for voltage recovery and improve the power supply reliability of Microgrid. Aa et al. (2021) combined Particle swarm optimization and bat algorithm to optimize the location and capacity of distributed solar power generation in Microgrid. Guo et al. (2021) used Quantum behaved particle swarm optimization (QPSO) to solve the capacity allocation optimization problem of isolated Microgrid and realized power supply reliability. Cheng et al. (2021) used the NSGA-II algorithm to solve the optimization model of grid cost-benefit composition, so as to ensure the safety of power consumption of important users in Microgrid (Wang et al., 2021) used the genetic particle swarm optimization algorithm to solve the capacity allocation problem of photovoltaic, wind power and energy storage equipment in Microgrid.
In recent years, with the rapid popularization and promotion of 5G communication technology in China, 5G base station has gradually developed into an important emerging load. According to the statistics of the Ministry of industry and information technology of China, by the end of 2021, 1.425, million 5G base stations have been built and opened in China. The total number of 5G base stations accounts for more than 60% of the world. The 5G network has covered all prefecture level cities, More than 98% of the counties and cities and 80% of the towns and townships. By the end of 2020, the number of base stations per person has increased by nearly 10.1 million. In the operation process, through scientific means to dispatch and manage the power supply and power consumption equipment in 5G base station, the interactive response potential of 5G base station can be brought into full play, and considerable flexibility support can be provided for the power grid, At the same time, it can improve the clean energy consumption and carbon emission reduction. The massive access of 5G base stations provides a new possibility for the development of low-carbon power system in the future, (ishchenko et al., 2022) discussed the MIMO antenna array in the fifth generation millimeter wave UWB data transmission network. Chandran and Abdulla (2021) compared the infrastructure update of 5G communication technology and 4G communication technology in the Internet of things. Hao et al. (2020); Wen et al. (2021) discussed the nano materials, antennas and other equipment needed for 5G communication technology. Yong et al. (2021) introduced the basic equipment and power consumption characteristics of 5G base station, and studied its demand response potential. Asia et al. (2022) introduced the changes of demand growth of copper clad laminate for 5G base stations in Europe and the United States and the changes of 5G base stations. Weissberger (2020) introduced the development of China’s 5G communication technology, the technical impact of the US.-China trade war and the export control promulgated by the US. government on the development of 5G communication.
1.2 Innovation and contribution
According to the comparison of literature research, the innovations and contributions of this paper are as follows.
1) Give full play to the low-carbon energy potential of 5G base station in microgrid operation, deeply consider its operation characteristics, and establish an optimized operation model of 5G base station operation adjustable characteristics under the coupling of multiple energies of microgrid connected to external network.
2) Most of the existing researches adopt system cost minimization or system operating income maximization. After deeply analyzing the role of microgrid operating framework and 5G base station in carbon emission reduction of power system, based on the two dimensions of economic benefit and environmental benefit, this paper comprehensively considers the physical constraints of microgrid units, and constructs the double objectives of microgrid operating cost and carbon emission minimization under the access of 5G base station.
3) 5G base station participating in microgrid dispatching can effectively optimize the system load curve, and the fluctuation of system load is obviously optimized.
2 Multi objective optimization model of microgrid access to 5G base station
2.1 Basic structure of microgrid access to 5G base station
The basic structure of Microgrid can be divided into four parts: generation side, user side, energy storage system and energy management system in Microgrid. After 5G base station is connected, the specific composition of Microgrid system is shown in Figure 1.
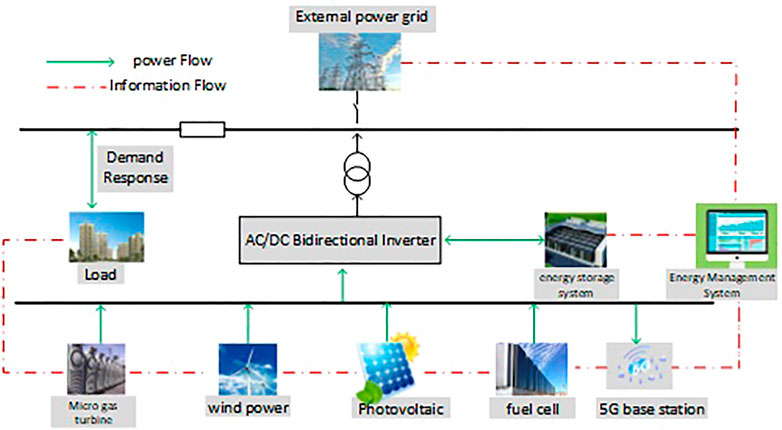
FIGURE 1. Schematic diagram of Microgrid system structure.
As can be seen from Figure 1, the power generation side of the system mainly includes controllable power sources, such as micro turbine (MT) and fuel cell (FC), and distributed power generation, such as wind turbine (WT) and photovoltaics (PV), which can be connected to 5G base station, thus further embodying the characteristics of reducing the abandonment rate of wind and photovoltaics. In this paper, the distributed energy consumption maximization principle is adopted, that is, wind power and photovoltaic power are preferentially absorbed, and controllable power supply mainly plays a role of adjustment and supplement. Meanwhile, the microgrid designed in this paper is connected to the power grid through the point of common coupling (PCC).
2.2 Simplified mathematical model of microgrid
2.2.1 Simplified photovoltaic output model
Assuming that the photovoltaic output is only related to photovoltaic intensity and ambient temperature, the power generation of photovoltaic array can be expressed by the following formula:
2.2.2 Wind turbine output model
When the wind speed
2.2.3 Power generation model of micro gas turbine
Micro gas turbine is a kind of ultra-small gas turbine. Usually, methane and natural gas are used as fuel with a power of less than 1 million kilowatts. Micro-gas turbine can generate electricity through various fuels, which is not only environmentally friendly, efficient, simple in operation and maintenance, and mature in technology, but also has better controllability compared with new energy generation, and can also be used for rotary standby, so it is widely used in the field of distributed power generation. The output power of the micro gas turbine can be increased or decreased by controlling the fuel supply according to the load demand, but it has the upper limit and lower limits, and the change speed, that is, climbing speed, is limited by this range.
Therefore, the power generation model of micro gas turbine is as follows:
Furthermore, the power generation cost (fuel cost) of micro gas turbine can be calculated by the following formula:
Among them,
Distributed micro sources such as micro gas turbine and fuel cell will generate emission cost during power generation. The calculation formula is as follows:
2.2.4 Fuel cell power generation model
The fuel cell converts the chemical energy in fuel (usually hydrogen or natural gas) and oxidant into electric energy through the positive and negative electrodes and electrolyte materials in the device, mainly emits CO2 and water, and the power generation efficiency is between 50% and 70%. The fuel cell converts the chemical energy in fuel (usually hydrogen or natural gas) and oxidant into electric energy through the positive and negative electrodes and electrolyte materials in the device, mainly emits CO2 and water, and the power generation efficiency is between 50% and 70%.
Similar to the power generation cost of micro gas turbine, the calculation formula of power generation cost under normal operation of fuel cell is as follows:
Similar to micro gas turbine, the environmental cost of fuel cell is calculated by the following formula.
2.2.5 Operation model of energy storage system
The remaining charge of the battery at that time and its state of charge. In this paper, the state of charge (SOC) is used to reflect the remaining capacity of the battery, which is expressed by the ratio of the remaining capacity of the battery to the total capacity.
When the battery is charged:
When the battery is discharged:
2.2.6 5G base station energy consumption model
The energy consumption of 5G base station includes static power consumption and dynamic power consumption. Static power consumption refers to the energy demand independent of service load and output transmission power, which is mainly composed of fixed losses of power supply system, BBU baseband unit signal processing and cooling system Dynamic power consumption refers to the energy requirement related to 5G service load. It is a function of 5G base station output transmission power. To sum up, the total power consumption of a single 5G base station can be expressed as follows.
During the operation scheduling period, the relationship between the energy storage capacity of the energy storage equipment in 5G base station in the current period, the state of the former sequence electricity and the charging and discharging power is shown as follows:
2.3 Planning objectives
2.3.1 Mathematical model of objective function
2.3.1.1 System operation cost minimization
Total cost of Microgrid generation and operation
2.3.1.2 System carbon emission minimization
In order to comprehensively reflect the benefits of carbon emission reduction brought by 5G base station participating in demand response for microgrid, this paper takes the minimum carbon emission of the system as another objective of optimizing the operation model. Among them, the carbon emission of microgrid is directly related to the fossil fuel consumption of micro gas turbine. As the fossil fuel consumption of micro gas turbine is very small compared with the external power grid, it can be neglected. Therefore, the carbon emission of the system is equal to the electricity purchased from the external power grid multiplied by the coal consumption coefficient of unit power generation and then multiplied by the carbon emission coefficient corresponding to unit coal consumption power generation, as follows:
2.3.1.3 After weighting these two objective functions, the final multi-objective optimization function can be obtained as follows:
2.3.2 Physical constraints of microgrid
2.3.2.1 System power balance constraints
2.3.2.2 Energy storage system constraints
1) Power constraint of energy storage system
2) State of charge constraints of energy storage system
If the optimal scheduling period of Microgrid is continuous, then the state of charge of the energy storage system should be consistent at the beginning and the end of each scheduling period.
2.3.2.3 Internal load balancing constraints
2.3.2.4 Controllable load capacity constraint
2.3.3 Constraints on generation side of microgrid
The constraints on the generation side of Microgrid mainly include climbing power constraint, maximum minimum output constraint and power exchange constraint between Microgrid and external power grid.
2.3.3.1 Interactive power constraints between power grids
2.3.3.2 Unit output constraints
2.3.3.3 Unit climbing constraints
2.3.4 5G base station constraints
During the operation, the maximum number of transceivers in 5G base station should meet the following constraints due to the limitation of equipment configuration capacity:
In addition, since 5G operators need to meet the requirements of transmitting signals within the allocated bandwidth and meet the transmission equipment standards, the data transmission bandwidth of transceiver in 5G base station should also meet the following constraints:
3 Solving algorithm
3.1 Whale optimization algorithm
The whale optimization algorithm is based on the behavior of whales rounding up their prey. Whales are social mammals, and they will cooperate with each other to drive and round up their prey when hunting.
There are three ways to find the best prey, that is, to find the best prey by soaking net and to find whale prey by soaking net.
3.1.1 Surround the prey
During hunting, whales can find out the coordinates of their prey and surround it. Before solving the problem, the position of prey in the solution space is unknown to whales. Therefore, in the WOA algorithm, the position of the best whale in the current population is assumed to be the position of the prey, and other whales in the population are surrounded by the best whale. The mathematical model is described as follows:
3.1.2 Bubble net attack mode
We choose the helix update position mechanism to calculate the distance
Humpback whales swim in a short circle around their prey along a spiral path. In order to get this behavior optimized in the process_50% of the probability is between the encirclement mechanism and the spiral update position mechanism to update the position of the individual whale. The mathematical model is described as follows.
3.1.3 Looking for prey
In the process of hunting prey, we can use the method that changes with the iteration process vector a. In fact, humpback whales will randomly explore the space according to each other’s position. Therefore, when the random value of A is greater than 1 or less than 1, it is used to update the whale’s position in the global exploration stage to stay away from the current individual. Compared with the local development stage, the global exploration stage. The position of a single whales is upgraded on the basis of randomly selected individuals, instead of the best individual found so far. It is assumed that in the optimization process, there is a 50% probability of randomly selecting the location of the updated individual whale between the circling mechanism and the spiral updating location mechanism. The mathematical model is described below.
3.2 Solution steps
1) Input variables of parameter setting of microgrid power supply including wind turbine capacity, wind turbine cut in wind speed and other initial parameter into the algorithms;
2) Set the whale number n and the maximum iteration number tmax of the algorithm, and initialize the position information;
3) Calculate the fitness of each whale, find the current optimal whale position and keep it;
4) Calculate parameters
5) Judge whether the absolute value of coefficient vector
6) After the position update, calculate the fitness of each whale, and compare it with the previously reserved optimal whale position. If it is better than that, replace it with a new optimal solution. Judging whether the current calculation reaches the maximum number of iterations, if so, obtaining the optimal solution, and finishing the calculation, otherwise, entering the next iteration, and returning to step (4);
7) Output the final calculation result.
GAMS-BARON solver is used to solve the mixed integer nonlinear programming model of optimal scheduling of micro-energy grid operation configuration considering the characteristics of electric load. The specific process is shown in Figure 2.
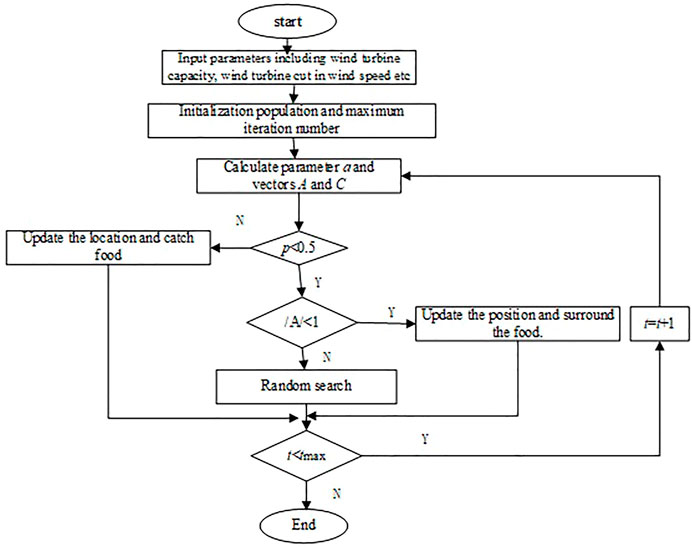
FIGURE 2. Solution flow.
4 Simulation example
In this paper, a microgrid in Beijing is selected as the study object. The dispatching cycle of the Microgrid is 1 day, which is divided into 24 dispatching periods, that is, the dispatching interval is 1 h. Refer to the literature (Wen et al., 2021) for the setting of parameters such as the emission coefficient and converted cost of the micro-combustion turbine and fuel cell.
4.1 Basic data
In the selected Microgrid, the parameter settings of various power sources in the Microgrid are shown in Table 1.
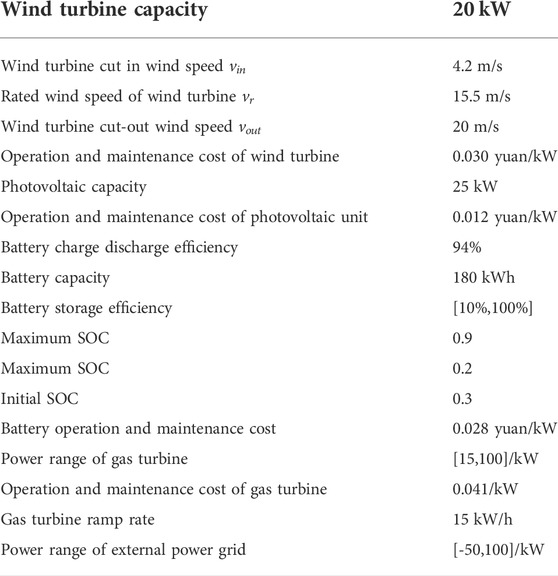
TABLE 1. Parameter setting of Microgrid power supply (Yu and Zheng, 2020).
See Figures 3, 4 for the forecast of average wind speed and solar irradiance in the next 24 h.
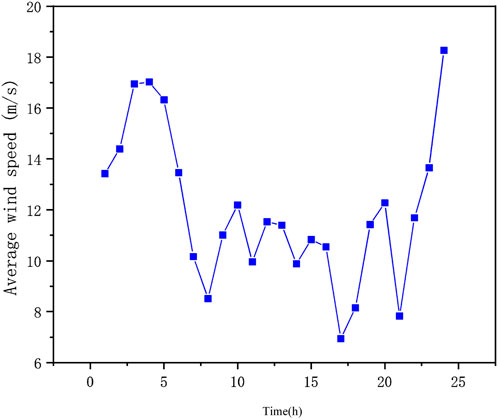
FIGURE 3. Average wind speed forecast in the next 24 h.
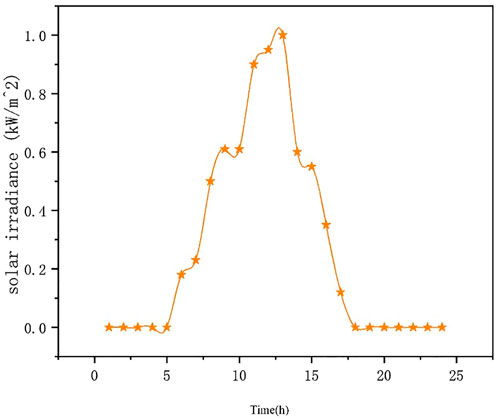
FIGURE 4. Forecast of solar irradiance in the next 24 h.
Based on the mathematical relationship between Figures 3, 4 and Formula (1-2), calculate the power of photovoltaic and wind turbines. When calculating the output power of WT and PV, it is assumed that the power factor of these power sources is 1, and no reactive power is generated.
The typical daily load curves of high industrial load, total commercial load and smart home load can be predicted according to historical data, as shown in Figure 5.
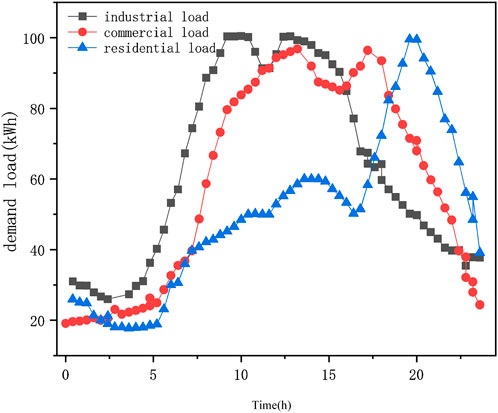
FIGURE 5. Daily load curve of different users.
Time-of-use electricity prices of external power grid are shown in Table 2.
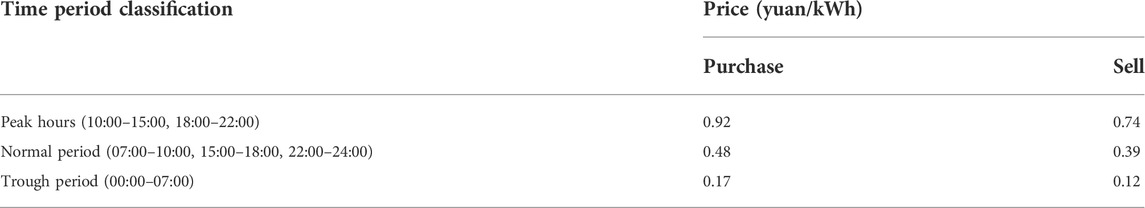
TABLE 2. Time-of-use electricity prices.
4.2 Simulation
In order to compare the absorption and efficient utilization of renewable energy in microgrid system by 5G base station, and consider whether to access 5G base station or not, the model established in this paper is configured with two operating modes, as follows (Table 3).
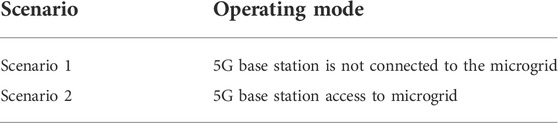
TABLE 3. Operation modes.
In order to reveal the economic and environmental benefits of 5G base station participating in microgrid, this section makes a comparative analysis of the scheduling schemes of 5G base station participating in microgrid and not participating in it. Scenario 1 without 5G access means that 5G base station do not participate in grid interaction when dispatching power in microgrid, and only manage the power consumption of electrical equipment from the perspective of their own energy consumption. WOA algorithm is used to determine the best solution set.
4.3 Analysis
The wind curtailment power of the system of the two scenarios is shown in Figure 6.
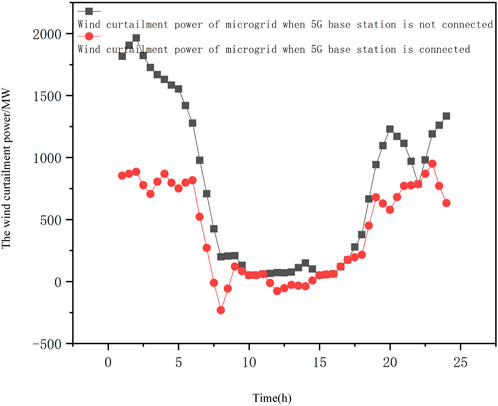
FIGURE 6. The wind curtailment power of the system.
As can be seen from Figure 6, the flexible interaction of 5G base stations significantly reduces wind power, and the amount of wind power connected to the grid greatly increases during peak wind power generation. The main reasons are as follows. In the peak period of power load, on the premise of meeting the communication service quality, the base station controls the number of transceivers, which significantly reduces the power consumption of 5G base stations. In addition, due to the discharge of the energy storage system, the total energy consumption of each 5G base station group is greatly reduced. Inversely proportional to the total load curve of the system, thus reducing the power purchase of the main network and improving the operation efficiency.
Figure 7 shows the operation state of 5G base station before and after participating in demand response.
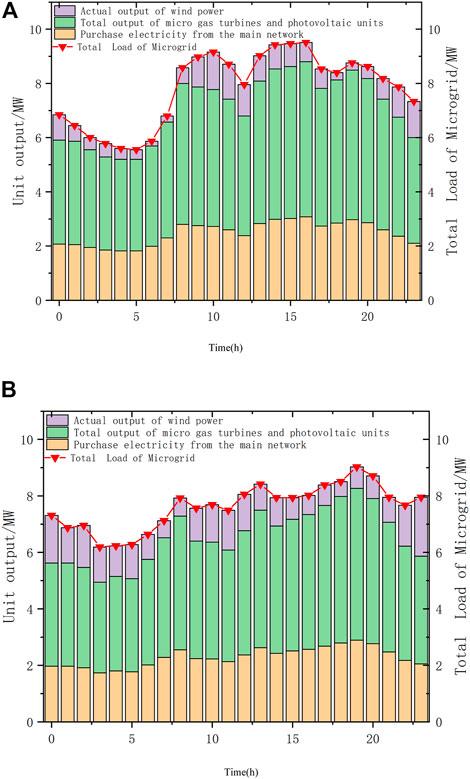
FIGURE 7. (A) 5G base station is not connected to the microgrid.(B). 5G base station access to microgrid.
It can be seen from the figure that 5G base station participating in microgrid dispatching can effectively optimize the system load curve and obviously optimize the system load fluctuation. In Scenario 1, the peak value of power load is 9.5111 mw, and the valley value is 5.5556 MW. In the Scenario 2, the peak load is 9.0292 mw and the valley value is 6.1912 MW. It can obviously cut off the peak and fill in the valley, and improve the contradiction between power supply and demand during peak and low load periods.
When 5G base station does not participate in demand response, it can be regarded as a normal power load. After the 5G energy storage system is charged, it is necessary to increase the energy consumption of the base station. In the low-power generation period of wind power generation, energy storage system or grid-connected transmission can reduce the purchase of electricity from the external grid by microgrid, thus reducing the carbon emission on the power generation side. Because 5G base station can control its energy consumption by changing its own communication equipment, reduce its energy consumption during peak power load, and use energy storage of base station to discharge at peak power load and charge at low power load, thus improving wind power consumption and reduce power purchase of main grid.
As can be seen from Table 4, when 5G base stations participates in the optimal dispatch of microgrid, although the operating cost of the system has increased, the wind power consumption of the system has increased by 8,648.93 kW h, indirectly reduces the electricity purchased by the microgrid from the external grid, and the electricity purchase cost of the main grid has decreased by 20,037.51 yuan. As a result, the total carbon emission of the system decreased by 95.16 tons.
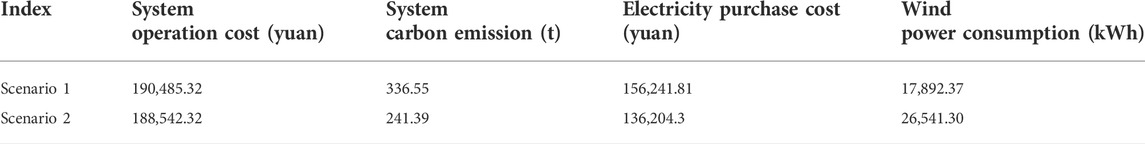
TABLE 4. Comparison of system operation benefits in different scenarios.
5 Conclusion
In order to promote the realization of China’s dual-carbon goal, and make use of new power system to vigorously promote the efficient consumption of clean energy, and realize the carbon emission reduction of power system, this paper takes the interactive response of 5G base station connected to microgrid as the research direction, and puts forward a multi-objective optimization model of 5G base stations connected to microgrid as the breakthrough point, taking the improvement of wind power utilization efficiency as the breakthrough point. Compared with existing research. In this paper, the characteristics of 5G microgrid, the low-carbon operation characteristics of microgrid and the optimal operation of microgrid are studied.
1) 5G base station can reduce its own power demand and improve the energy efficiency of the system by technical management means such as base station sleeping, transceiver turning off, downlink power control, etc., thus indirectly reduce the carbon emission on the power generation side.
2) 5G base station participating in microgrid dispatching can effectively optimize the system load curve, and the fluctuation of system load is obviously optimized. Under the 5G disconnected scenario, the peak value of power load is 9.5111 MW and the valley value is 5.5556 MW. Under the 5G connection scenario, the peak load is 9.0292 MW, and the valley value is 6.1912 MW. It can obviously cut off the peak and fill in the valley, and improve the contradiction between power supply and demand during peak and low load periods.
3) The multi-objective model constructed in this paper can take into account the economic and environmental benefits of microgrid operation at the same time. When 5G base stations participates in the optimal dispatch of microgrid, although the operating cost of the system has increased, the consumption of wind power in the system has increased by 8,648.93 kWh, indirectly reduces the purchase of electricity from the main grid, and the purchase cost of electricity from the main grid has decreased by 20,037.51 uan.
The flexible access of 5G base station to microgrid can improve the utilization efficiency of electric equipment, balance the power flow of lines and reduce some network loss. According to the load situation, adjust the tap-changer of the main transformer at any time, so as to ensure that the grid voltage is within the fluctuation range specified in the regulations. Avoid the power quality degradation caused by the low voltage level in the grid during the peak load, and also increase the voltage at the end of the line, reduce the line current, and achieve the purpose of loss reduction. 5G base station carries out power management and flexible charging and discharging of energy storage battery, which can significantly change the power flow/voltage distribution in the distribution network, not only reduce the network loss, but also improve transmission efficiency. It can also effectively alleviate line congestion and improve the grid-connected capability of clean energy generation microgrid. However, there is no mathematical model for this discovery in this paper, which is the limitation of this paper and the next direction of our research.
Data availability statement
The original contributions presented in the study are included in the article/supplementary material, further inquiries can be directed to the corresponding author.
Author contributions
All authors listed have made a substantial, direct, and intellectual contribution to the work and approved it for publication.
Conflict of interest
Authors GW, ZX, and CY was employed by Fangyuan Construction Group Co., Ltd.
The remaining author declares that the research was conducted in the absence of any commercial or financial relationships that could be construed as a potential conflict of interest.
Publisher’s note
All claims expressed in this article are solely those of the authors and do not necessarily represent those of their affiliated organizations, or those of the publisher, the editors and the reviewers. Any product that may be evaluated in this article, or claim that may be made by its manufacturer, is not guaranteed or endorsed by the publisher.
References
Aa, A., Htr, B., Mak, C., Sk, D., and Yn, E. (2021). A hybrid algorithm (BAPSO) for capacity configuration optimization in a distributed solar PV based Microgrid. Energy Rep. 7, 7906–7912. doi:10.1016/j.egyr.2021.01.034
Agalgaonkar, A., and Robinson, D. (2021). Cooperative control of microgrids: A review of theoretical frameworks, applications and recent developments. Energies 14, 8026. doi:10.3390/en14238026
Alabdali, Q. A., and Nahhas, A. M. (2021). Simulation study of grid connected photovoltaic system using PVsyst software: Analytical study for yanbu and rabigh regions in Saudi arabia. Am. J. Energy Res. 9, 30–44. doi:10.12691/ajer-9-1-4
Ali, A., Mahmoud, K., and Lehtonen, M. (2021). Optimal planning of inverter-based renewable energy sources towards autonomous Microgrids accommodating electric vehicle charging stations. IET Generation Trans. Dist. 16, 219–232. doi:10.1049/gtd2.12268
Asia, J. L., Taipei, , Willis, Ke, and Digitimes, n. d. (2022). CCL demand for 5G base stations may gain momentum in Europe, US in. [WWW Document]. DIGITIMES. URL Availabe at: https://www.digitimes.com/news/a20210621PD203.html (accessed 8 9, 22).
Chandran, T. L., and Abdulla, M. S. (2021). ALS-ORAN 5G: Adapting to lowpower-WAN & satellite - open radio access network in 5G. Work. Pap. 2021, 480.
Chen, B., Wang, J., Lu, X., Chen, C., and Zhao, S. (2020). Networked microgrids for grid resilience, robustness, and efficiency: A review. IEEE Trans. Smart Grid 12, 18–32. doi:10.1109/TSG.2020.3010570
Chen, B., Wang, J., Lu, X., Chen, C., and Zhao, S. (2020). Networked microgrids for grid resilience, robustness, and efficiency: A review. IEEE Trans. Smart Grid 12, 18–32. doi:10.1109/TSG.2020.3010570
Cheng, Z., Zeng, W., Shu, Z., Liao, W., and Lin, Y. (2021). Grid-connected micro-grid power supply and distribution transformer capacity optimization system design in the electricity sales environment. J. Phys. Conf. Ser. 1852, 022050. doi:10.1088/1742-6596/1852/2/022050
Espina, E., Llanos, J., Burgos-Mellado, C., Cárdenas-Dobson, R., Martínez-Gómez, M., and Sáez, D. (2020). Distributed control strategies for microgrids: An overview. IEEE Access 8, 193412–193448. doi:10.1109/ACCESS.2020.3032378
Guo, Y., Lei, X., and Wang, Q. (2021). Capacity coordination planning of isolated Microgrid and battery swapping station based on the quantum behavior particle swarm optimization algorithm. Int. Trans. Electr. Energy Syst. 31. doi:10.1002/2050-7038.12804
Gupta, T. N., Murshid, S., and Singh, B. (2020). Improving power quality of single phase utility grid connected to wind-PV system using multilayer-frequency adaptive fundamental signal extractor. IET Renew. Power Gener. 14, 2126–2134. doi:10.1049/iet-rpg.2019.0928
Hao, H., Hui, D., and Lau, D. (2020). Material advancement in technological development for the 5G wireless communications. Nanotechnol. Rev. 9, 683–699. doi:10.1515/ntrev-2020-0054
He, Y. F., Venkatesh, B., and Uuan, L. (2012). Optimal scheduling for charging and discharging of electric vehicles. IEEE Trans. Smart Grid 3 (3), 1095–1105. doi:10.1109/TSG.2011.2173507
Hirsch, A., Parag, Y., and Guerrero, J. (2018). Microgrids: A review of technologies, key drivers, and outstanding issues. Renew. Sustain. Energy Rev. 90, 402–411. doi:10.1016/j.rser.2018.03.040
ishchenko, E. A., Badaev, A. S., Volodko, A. V., and Fedorov, S. M. (2022). 5G base station antenna integrated into solar panel. IOP Conf. Ser. Earth Environ. Sci. 979, 012104. doi:10.1088/1755-1315/979/1/012104
Junejo, A. K., Elmorshedy, M. F., Elmorshedy, M. F., Wang, S., Buker, M. S., and Akindeji, K. Tet al. ,(2021). Optimal planning and EMS design of PV based standalone rural microgrids. IEEE Access 9, 32908–32930. doi:10.1109/ACCESS.2021.3060031
Katiraei, F., and Iravani, M. R. (2006). Power management strategies for a microgrid with multiple distributed generation units. IEEE Trans. Power Syst. 21, 1821–1831. doi:10.1109/TPWRS.2006.879260
Ke, Y., Liu, J., Meng, J., Fang, S., and Zhuang, S. (2022a). Comprehensive evaluation for plan selection of urban integrated energy systems: A novel multi-criteria decision-making framework. Sustain. Cities Soc. 81, 103837. doi:10.1016/j.scs.2022.103837
Ke, Y., Tang, H., Liu, M., and Qi, X. (2022b). A hybrid decision-making framework for photovoltaic poverty alleviation project site selection under intuitionistic fuzzy environment. Energy Rep. 8, 8844–8856. doi:10.1016/j.egyr.2022.07.012
Lee, D., Son, S., and Kim, I. (2021). Optimal allocation of large-capacity distributed generation with the volt/var control capability using particle swarm optimization. Energies 14, 3112. doi:10.3390/en14113112
Liu, Q. H., He, Y. K., and Zhang, J. H. (2006). Investigation of control for AC-exited VSCF wind power generation system connected to grid. Proc. CSEE 26, 109–114. doi:10.1016/S0379-4172(06)60085-1
Lopes, J. P., Hatziargyriou, N., Mutale, J., Djapic, P., and Jenkins, N. (2007). Integrating distributed generation into electric power systems: A review of drivers, challenges and opportunities. Electr. Power Syst. Res. 77, 1189–1203. doi:10.1016/j.epsr.2006.08.016
Lotfi, H. (2021). Optimal sizing of distributed generation units and shunt capacitors in the distribution system considering uncertainty resources by the modified evolutionary algorithm. J. Ambient. Intell. Humaniz. Comput. 13, 4739–4758. doi:10.1007/s12652-021-03194-w
Marzband, M., Azarinejadian, F., Savaghebi, M., Pouresmaeil, E., Guerrero, J. M., and Photovoltaicbody, G. (2018). Smart transactive energy framework in grid-connected multiple home Microgrids under independent and coalition operations. Renew. Energy 126, 95–106. doi:10.1016/j.renene.2018.03.021
Marzband, M., Azarinejadian, F., Savaghebi, M., Pouresmaeil, E., Guerrero, J. M., and Photovoltaicbody, G. (2018). Smart transactive energy framework in grid-connected multiple home Microgrids under independent and coalition operations. Renew. Energy 126, 95–106. doi:10.1016/j.renene.2018.03.021
Naval, N., and Yusta, J. M. (2021). Optimal short-term water-energy dispatch for pumping stations with grid-connected photovoltaic self-generation. J. Clean. Prod. 316, 128386. doi:10.1016/j.jclepro.2021.128386
Onojo, J. O., Okozi, S. O., Okafor, K. C., Uzoechi, L. O., and Nkwachukwu, C. (2021). Towards smart grid economics using distributed generation systems-hybrid biomass, solar and fossil fuel plants. Int. J. Mechatronics Manuf. Syst. 11, 5019.
Parhizi, S., Lotfi, H., Khodaei, A., and Bahramirad, S. (2015). State of the art in research on microgrids: A review. IEEE Access 3, 890–925. doi:10.1109/ACCESS.2015.2443119
Tan, Z., De, G., Li, M., Lin, H., Yang, S., Huang, L., et al. (2020). Combined electricity-heat-cooling-gas load forecasting model for integrated energy system based on multi-task learning and least square support vector machine. J. Clean. Prod. 248, 119252. doi:10.1016/j.jclepro.2019.119252
Tavakoli, M., Shokridehaki, F., Akorede, M. F., Marzband, M., Vechiu, I., and Pouresmaeil, E. (2018). CVaR-based energy management scheme for optimal resilience and operational cost in commercial building Microgrids. Int. J. Electr. Power & Energy Syst. 100, 1–9. doi:10.1016/j.ijepes.2018.02.022
Wang, X., Zhu, Q., and Wang, Y. (2021). Optimal allocation of wind-solar storage capacity of Microgrid considering carbon emission reduction benefits. IOP Conf. Ser. Earth Environ. Sci. 804, 032015. doi:10.1088/1755-1315/804/3/032015
Weishang, G., Yihua, M., Xuexing, Z., and Huan, Y. (2022). Internal benefit optimization model of gas-thermal power virtual power plant under China’s carbon neutral target. Energy Sci. Eng. 10, 1227–1239. doi:10.1002/ese3.1097
Weissberger, A. (2020). 5G base station deployments. Open-RAN Competition & HUGE 5G BS Power Problem [WWW Document]. Technology Blog. URL Availabe at: https://techblog.comsoc.org/2020/08/07/5g-base-station-deployments-open-ran-competition-huge-5g-bs-power-problem/(accessed 8 9, 22).
Wen, S., Xu, Y., and Dong, Y. (2021). Low-profile wideband omnidirectional antenna for 4G/5G indoor base station application based on multiple resonances. IEEE Antennas Wirel. Propag. Lett. 20, 488–492. doi:10.1109/LAWP.2021.3054682
Yong, P., Zhang, N., Ci, S., and Kang, C. (2021). 5G communication base stations participating in demand response: Key technologies and prospects. Zhongguo Dianji Gongcheng Xuebao/Proceedings Chin. Soc. Electr. Eng. 41, 5540–5551. doi:10.13334/j.0258-8013.pcsee.210183
Yu, X., and Zheng, D. (2020). Cross-regional integrated energy system scheduling optimization model considering conditional value at risk. Int. J. Energy Res. 44, 5564–5581. doi:10.1002/er.5307
Yuvaraj, T., Devabalaji, K. R., Prabaharan, N., Alhelou, H. H., Siano, P., Pal, P., et al. (2021). Optimal integration of capacitor and distributed generation in distribution system considering load variation using bat optimization algorithm. Energies 14, 3548. doi:10.3390/en14123548
Zandrazavi, S. F., Guzman, C. P., Pozos, A. T., Quiros-Tortos, J., and Franco, J. F. (2022). Stochastic multi-objective optimal energy management of grid-connected unbalanced Microgrids with renewable energy generation and plug-in electric vehicles. Energy 241, 122884. doi:10.1016/j.energy.2021.122884
Zhang, H. Q., Wei, P. F., and Li, W. W. (2011). Study on simulation of three-phase Z-source inverter for grid-connected wind power generation. Adv. Mat. Res. 383–390, 2018–2024. doi:10.4028/www.scientific.net/amr.383-390.2018
Zhao, Z., Wang, H., and Zhao, H. (2020). Research on filter parameter optimization method of grid-connected photovoltaic system. IOP Conf. Ser. Earth Environ. Sci. 619, 012020. doi:10.1088/1755-1315/619/1/012020
Zhou, M., Cheng, S., Xu, L., Wang, L., Guo, Q., and Cai, W. (2021). Robust switching gain-based fractional-order sliding mode control for wind-powered microgrids. Complexity 2021, 1–12. doi:10.1155/2021/6697792
Keywords: microgrid, multi objective optimization, 5G base station, carbon peak shaving and carbon neutrality, whale optimization algorithm
Citation: Guo W, Mao Y, Chen Y and Zhang X (2022) Multi-objective optimization model of micro-grid access to 5G base station under the background of China’s carbon peak shaving and carbon neutrality targets. Front. Energy Res. 10:1032993. doi: 10.3389/fenrg.2022.1032993
Received: 31 August 2022; Accepted: 21 October 2022;
Published: 14 November 2022.
Edited by:
Yongming Han, Beijing University of Chemical Technology, ChinaReviewed by:
Yiming Ke, Jinan University, ChinaGejirifu De, Technical University Dortmund, Germany
Yue Zhou, Cardiff University, United Kingdom
Copyright © 2022 Guo, Mao, Chen and Zhang. This is an open-access article distributed under the terms of the Creative Commons Attribution License (CC BY). The use, distribution or reproduction in other forums is permitted, provided the original author(s) and the copyright owner(s) are credited and that the original publication in this journal is cited, in accordance with accepted academic practice. No use, distribution or reproduction is permitted which does not comply with these terms.
*Correspondence: Weishang Guo, 18800161023@163.com